

Summary
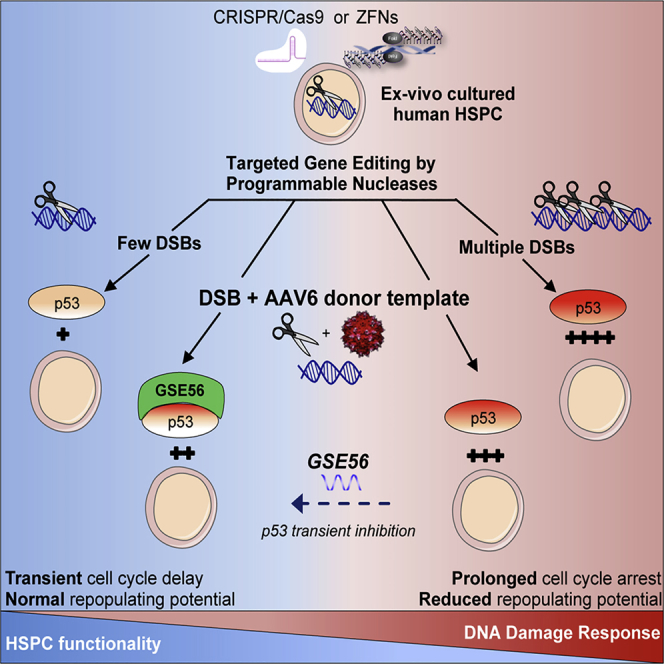
Precise gene editing in hematopoietic stem and progenitor cells (HSPCs) holds promise for treating genetic diseases. However, responses triggered by programmable nucleases in HSPCs are poorly characterized and may negatively impact HSPC engraftment and long-term repopulation capacity. Here, we induced either one or several DNA double-stranded breaks (DSBs) with optimized zinc-finger and CRISPR/Cas9 nucleases and monitored DNA damage response (DDR) foci induction, cell-cycle progression, and transcriptional responses in HSPC subpopulations, with up to single-cell resolution. p53-mediated DDR pathway activation was the predominant response to even single-nuclease-induced DSBs across all HSPC subtypes analyzed. Excess DSB load and/or adeno-associated virus (AAV)-mediated delivery of DNA repair templates induced cumulative p53 pathway activation, constraining proliferation, yield, and engraftment of edited HSPCs. However, functional impairment was reversible when DDR burden was low and could be overcome by transient p53 inhibition. These findings provide molecular and functional evidence for feasible and seamless gene editing in HSPCs.
Keywords: genome editing, programmable nucleases, hematopoietic stem and progenitor cells, DNA double strand breaks, DNA damage response, adeno-associated vector, p53 pathway
Graphical Abstract
Highlights
-
•
DNA DSBs induced by programmable nucleases transiently activate the DDR in HSPCs
-
•
Single-cell transcriptomics show that induced DSBs activate the p53 pathway
-
•
AAV6-mediated genome editing aggravates p53 activation and delays HSPC proliferation
-
•
Transient p53 inhibition alleviates clonogenic and repopulation defects in edited HSPCs
Precise gene editing has the potential to treat immune and hematological diseases. Genovese, Naldini, Di Micco, and colleagues now show that gene-editing procedures are well tolerated by hematopoietic stem cells and provide molecular evidence of the feasibility of seamless gene editing, strengthening translation of such approaches to humans.
Introduction
Targeted gene editing exploits programmable nucleases, such as zinc finger (ZFN) and RNA-based CRISPR/Cas9 nucleases, to induce a double-stranded break (DSB) into a pre-determined genomic sequence (Doudna and Charpentier, 2014, Kim and Kim, 2014). Depending on the DSB repair pathway engaged, the outcome may be inactivation of the targeted locus by insertions or deletions (“indels”) introduced by non-homologous end-joining (NHEJ) or insertion of a new sequence by homology-directed repair (HDR) from an exogenous DNA template. Prospective clinical application of hematopoietic stem and progenitor cell (HSPC) gene editing includes acquired and primary immunodeficiencies, thalassemia, and sickle cell disease (Cornu et al., 2017, Dever and Porteus, 2017).
Despite the advances in perfecting gene-editing platforms (Tsai and Joung, 2016), the functional consequences of the editing process in HSPCs have yet to be elucidated. A major challenge comes from the need to focus such studies on primitive hematopoietic stem cells (HSCs), a small fraction of the cells harvested by CD34 immunoselection. Whereas HSCs are responsible for long-term hematopoietic repopulation in the recipient, their committed counterparts only support transient clonal output (Doulatov et al., 2012). Nuclease-dependent gene editing generates DSBs, potentially toxic lesions that trigger DDR. HSPC function declines in response to multiple DSBs induced by irradiation and other genotoxic agents (Milyavsky et al., 2010, Mohrin et al., 2010), but little is known about the response of ex vivo cultured HSPCs when a single or few DSBs are induced. Whereas programmable nucleases are designed to recognize a single genomic target, the induction of additional DSBs at unintended off-target loci may increase the overall DDR burden and trigger apoptosis, differentiation, or replicative arrest, exacerbating the risk of exhaustion and limiting the long-term engraftment capacity of HSPCs.
HDR-mediated gene editing is constrained in the most primitive HSPC subsets (De Ravin et al., 2016, Dever et al., 2016, Genovese et al., 2014, Schiroli et al., 2017, Wang et al., 2015), likely due to low expression of the HDR machinery, quiescence, limited uptake, and innate response to the exogenous DNA template. Thus, it is crucial to enhance the efficiency of HDR in HSCs while preserving long-term repopulating capacity for clinical applications in which a low yield of edited cells would not be therapeutically effective. Similarly, the impact of adeno-associated viral vector serotype 6 (AAV6) as preferred source of DNA template for HDR in HSPCs remains poorly investigated.
Here, we interrogated up to the single-cell level the molecular processes underlying the response of different HSPC subsets to gene editing and devised a strategy to counteract potential adverse effects on HSPC function.
Results
DNA DSBs Induced by Programmable Nucleases Transiently Activate the DDR in HSPCs
To study the effects of nuclease-induced DNA DSBs in human cord blood (CB)-derived CD34+ HSPCs, we used a previously optimized protocol (Schiroli et al., 2017) and utilized obligate heterodimeric ZFN or CRISPR/Cas9, delivered as purified and base-modified mRNAs or ribonucleoprotein complexes (RNP) of Cas9 with synthetic, base-modified guide RNA (gRNA) (Hendel et al., 2015), respectively (Figure 1A). We employed as controls equimolar amounts of a single ZFN monomer (−DSB) or Cas9 unloaded (Cas9 only) or loaded with a gRNA with no predicted activity against the human genome (−DSB). The panel of nucleases was designed to target the same intronic region of IL2RG, a clinically relevant locus not essential for HSPC survival, and validated for robust activity at the on-target site (Table S1). The IL2RG 6-finger ZFN nuclease pair was optimized to reduce off-target activity to nearly undetectable levels in human cells (Schiroli et al., 2017), whereas gRNAs were designed with stringent or relaxed specificity (hereafter named high specificity [HS] or low specificity [LS], respectively) and tested by GUIDE-seq (Data S1A). Nuclease activity at the top gRNA off-target sites, none of which was located in transcribed regions, was investigated in HSPCs by heteroduplex cleavage assay. Whereas HS RNP showed significant activity at only one off-target site, which was cleaved with lower efficiency than IL2RG, two of the top 5 off-target sites tested for LS RNP were cleaved with similar efficiency as IL2RG (Table S2).
Figure 1.

DNA DSBs Induced by Programmable Nucleases Transiently Activate DDR in HSPCs
(A) Gene editing protocol and cell analyses.
(B) Percentage of IL2RG alleles containing a DSB (DSB-ddPCR) or indels (NHEJ; n = 3).
(C) Confocal images of 53BP1 foci (red) and DAPI (blue) in HSPCs treated with IL2RG ZFN monomers (−DSB(ZFN)), ZFN heterodimers (+DSB(ZFN)), unloaded Cas9 (Cas9 only), RNP with no predicted activity (−DSB(RNP)), and RNP with higher (+DSB(HS RNP)) or lower (+DSB(LS RNP)) specificity 24 h post-treatment. Asterisks indicate foci-positive cells. Scale bar represents 20 μm.
(D) Quantification of 53BP1 foci from (C); 12–24 h: n = 10, 7, 3, 8, 11, and 10; 72–96 h: n = 8, 6, 3, 3, 3, and 4; 168 h: n = 8, 6, 3, 3, and 4; Mann-Whitney or Kruskal-Wallis tests. Cas9 only and −DSB (RNP) were used as a group for statistical analysis.
(E) Combined immunofluorescence staining for 53BP1 (green), DAPI (gray), and DNA FISH for IL2RG (red) in female HSPCs 12 h after treatment with ZFN or HS RNP. Arrowheads and asterisks show alleles associated or not with 53BP1, respectively. Scale bar represents 2 μm.
(F) Percentage of 53BP1+ cells carrying 0, 1, or 2 IL2RG alleles associated with 53BP1 foci in 3 independent donors. On average, 100 nuclei were analyzed for each condition. Two-tail χ2 test; n.d., not detected.
(G) Spearman correlation between percentage of 53BP1+ cells and NHEJ at IL2RG 12–24 h post-electroporation.
(H) Fold expression of p21 relative to −DSB (ZFN) control at 12–24 h (12–24 h: n = 5, 6, 13, and 6; 72–96 h: n = 10 and 7; 168 h: n = 7 and 7). UT, untreated sample; UT electro, electroporation only. Mann-Whitney test.
(I) Fold expression of p21 relative to −DSB(RNP) control. Cells were treated with Cas9 only or escalating doses of IL2RG HS or LS RNPs (12–24 h: n = 3, 4, 4, 4, 3, and 3; 72 h: n = 3, 4, 4, 3, 3, and 3). Kruskal-Wallis test on indicated groups is shown. Where indicated, conditions were used as a group for statistical analysis.
(J) Number of live cells after electroporation of HSPCs treated as indicated (n = 6). Linear mixed-effects (LME) model followed by post hoc analysis at the last time point is shown.
(K) Number of colonies plated at the indicated time post-editing (24 h: n = 8, 9, 6, 7, and 6; 72–96 h: n = 10, 9, 5, 6, and 5; 168 h: n = 10, 10, 5, 4, and 3).
Mann-Whitney or Kruskal-Wallis tests. ns: p > 0.05; ∗p < 0.05; ∗∗p < 0.01; ∗∗∗p < 0.001; ∗∗∗∗p < 0.0001. Lines indicate median values.
Target DNA cleavage and repair, quantified by DSB-droplet digital PCR (ddPCR) (Rose et al., 2017) and indels detection, respectively, occurred mostly within 24 h from nuclease delivery for both nuclease platforms. Intriguingly, the rate of DSB disappearance appeared faster for the ZFN than RNP, despite the former being delivered by mRNA and the latter by protein (Figure 1B).
DDR factors, recruited at site of DSBs, can be identified as microscopically visible subnuclear foci (Polo and Jackson, 2011). We detected accumulation of the DDR sensor 53BP1 within 24 h post-electroporation with the majority of DDR-positive cells displaying one or two foci per nucleus, when highly specific nucleases were employed, compared to negative controls (Figure 1C). The percentage of foci-bearing cells decreased over time, consistently with the resolution of the DSBs. The number of 53BP1 foci per cell was significantly increased when using LS RNP, reflecting higher DDR burden (Figures 1C and 1D). LS-RNP-treated HSPCs still retained DNA DSB repair proficiency over time, as 53BP1 foci progressively disappeared with only slightly delayed kinetics over that of HS-RNP-treated cells (Figure 1D). To investigate the specific targeting of 53BP1 foci to IL2RG alleles, we performed immuno-DNA fluorescence in situ hybridization (FISH) (Chaumeil et al., 2013b) and found 60% of IL2RG alleles associated with a 53BP1 focus in HSPCs treated with ZFN or HS RNP (3 independent donors, 2 males, and 1 female; Figures 1E, 1F, and S1A). Of note, bi-allelic association was well represented in the female HSPCs. Conversely, none of the fewer 53BP1 foci detected in control treated cells associated with IL2RG. The IL2RG-53BP1 association in edited cells was specific, as we did not detect association between 53BP1 and the X-linked TLR7/TLR8 control loci, distal from the intended nuclease target site (Figure S1B). Furthermore, the percentage of 53BP1-positive cells within 24 h post-editing correlated with the fraction of NHEJ measured at the target locus among different experiments, although being generally lower for the former assay (Figure 1G). The majority of 53BP1 foci identified upon editing co-localized with the DDR marker γH2AX, even if more γH2AX foci per cell were identified in all conditions, including controls (Figure S1C).
We next measured the expression level of the DDR downstream effector CDKN1A (hereafter named p21). p21 levels were transiently upregulated with both platforms early post-DSBs (Figures 1H and 1I), with more pronounced and prolonged response to LS than HS RNP (Figure 1I). Of note, some increase in p21 levels was also observed in response to the sole electroporation compared to untreated samples (Figure 1H). Accordingly, a modest proliferation delay was observed in response to highly specific nucleases although robust growth arrest was observed with the LS reagent (Figure 1J), accompanied by only a slightly increased apoptosis rate in the latter condition (Figure S1D). Whereas no treatment skewed culture composition over time (Figures S1E and S1F), significantly fewer colonies were generated in methylcellulose assays only from LS-treated HSPCs (Figure 1K).
Overall, these data indicate that nuclease specificity and not the choice of platform is the major driver of DDR upon gene editing and that delivery of only one or few DNA DSBs in cultured HSPCs triggers a transient cellular response, which has minor impact on proliferation and clonogenic output.
Activation of the p53 Pathway Is the Predominant Response to Nuclease-Induced DSBs across HSPC Subpopulations Identified by Single-Cell Transcriptomics
To study the transcriptional impact of gene editing in individual cells, we performed single-cell RNA sequencing (scRNA-seq) on HSPCs treated with IL2RG ZFN, HS, LS, or control RNP. To enhance representation of the more primitive cells, we sorted CD34+ CD133+ CD90+ cells (named “primitive”) and admixed them 1 to 1 to sorted CD34+ CD133+ CD90− committed progenitors (“progenitors”) for the sequencing analysis. We used male donor cells (which carry only one IL2RG allele), expecting that most cells treated with the more specific nucleases would experience only one on-target DSB, and analyzed cells 24 h after nuclease delivery, when most DSBs have occurred and been repaired. We also included cells treated with HS RNP and AAV6 delivering a GFP-expressing repair template and sorted for targeted integration (HS/AAV6 GFP+ versus HS/AAV6 GFP−). Using a droplet-based approach, we generated scRNA-seq data from 15,431 cells, detecting a median of 2,701 genes/cell (Figure S2A).
To identify cell subpopulations and better enable comparison across datasets, we performed multi-set canonical correlation analysis and segregated cell clusters using the Louvain graph-based clustering approach. We computed the significant components using a supervised approach based on a list of differentially expressed genes (DEGs) between HSCs and progenitors in culture (Fares et al., 2017; Figures 2A and S2B; Data S1B). We identified 6 clusters, 2 of which were enriched for HSC and multipotent progenitors (MPP) marker genes and depleted of lineage-associated markers (hereafter named “HSC-enriched” clusters 1 and 2), with cluster 2 showing higher expression of cell cycle genes, despite clustering being performed with partial regression for cell cycle genes. These two subsets comprised the majority of cells expressing THY1 (CD90), PROCR (EPCR), and other genes previously reported to be upregulated in ex vivo cultured HSPCs endowed with repopulation potential (Figures 2B and S2C). The other clusters were enriched for different sets of lineage-associated genes and were hereafter named “myeloid-biased,” “monocytes/DC/preB-biased,” “neutrophil-biased,” and “erythroid-megakaryocyte-biased” progenitors, according to enrichment of previously reported gene signatures of purified HSPCs with distinct differentiation potential (Figures 2B, 2C, S2C, and S2D; Doulatov et al., 2013, Velten et al., 2017). Consistently with published data on uncultured HSPCs, cells expressing the HSC and not any lineage bias gene signature reflected a continuum of transcriptional states gradually acquiring either myeloid or erythroid lineage signatures, as shown by the trajectories of ordered cells in pseudotime (Figures S2E and S2F). Each identified cluster comprised cells from all treatment conditions in similar ratios, except for a trend toward lower representation of the “HSC-enriched 2” cluster in the sample sorted for targeted integration (HS/AAV6 GFP+; Figure 2D). Similarly, the identifying gene signatures appeared expressed likewise across the different editing or control conditions (Figure S2B). Treatment type did not impact clustering across the samples, even when clustering was performed in an unsupervised manner (Figure S2G; Data S1B).
Figure 2.

Transcriptional Impact of DNA DSBs in HSPCs at a Single-Cell Resolution
(A) tSNE (t-distributed stochastic neighbor embedding) plot comprising scRNA-seq data from HSPCs 24 h after editing. Clusters and associated cell types are indicated by name and colors.
(B) Heatmap showing expression (scaled log-transformed transcript per kilobase million [TPM] values) of selected genes associated with HSC and MPP state, myeloid, or erythroid lineages for each cluster.
(C) Violin plots showing overall average expression (log transformed) of genes within each signature for each cluster. HSC and progenitor signatures are from Doulatov et al. (2013).
(D and E) Stacked barplots showing distribution of the identified clusters (D) or HSC subclusters (E) across samples.
(F) Stacked barplots showing the distribution of G1-S-G2/M cell cycle phase genes (Nestorowa et al., 2016) across the identified HSC subclusters. −DSB(RNP) sample is shown.
(G and H) Violin plots showing the overall average expression (log-transformed TPM values) of HDR-related (G) and NHEJ-related (H) genes, in different cell clusters of −DSB(RNP) condition (R-hsa-5685942 and R-hsa03440 for HDR; KEGG: hsa03450 for NHEJ).
(I) Heatmap showing NES values for GSEA performed for the indicated clusters. All samples were ranked by Log2FC value after comparison to −DSB(RNP) control; ∗p-adjusted < 0.05.
(J) Heatmap showing the mean of the sum of the expression level of genes directly upregulated by p53 (Fischer, 2017) or c-myc (Zeller et al., 2003) transcriptional activity within clusters.
(K) Expression of IL-8 (n = 8, 4, 7, and 5), IL-6 (n = 5, 3, 5, and 5), TNF-α (n = 7, 3, 6, and 5), and IFN-1β (n = 8, 2, 8, and 5) measured by qRT-PCR 72 h post-treatment.
Kruskal Wallis test; lines indicate median values. ns: p > 0.05; ∗p < 0.05; ∗∗p < 0.01.
Further subclustering of the HSC-enriched clusters 1 and 2 continued to segregate cells from the original cluster 2 separately from the other cells, which were further separated in 3 subclusters, with subcluster 1A cells showing the highest levels of the HSC gene signature (e.g., AVP, CRHBP, and MLLT3) and cells with increasing appearance of lineage-associated genes in subclusters 1B and 1C (Figures 2E and S2H–S2J). Analysis of genes expressed in different phases of the cell cycle predicted a substantially higher proportion of cells in S/G2/M phases in cluster 2 than in the others and the highest fraction of cells in G1 in subcluster 1A, suggesting that the former cells might be HSCs that have been activated (Figure 2F). Interestingly, cells in HSC-enriched subclusters 1A, 1B, and 1C, but not HSC-enriched cluster 2, expressed the lowest levels of HDR and NHEJ genes (Figures 2G and 2H). Even after increasing discrimination within the more primitive cell subset, we did not uncover an impact of the editing treatments on the distribution among subclusters.
The transcriptional response to highly specific nucleases, either ZFN or RNP, was mild. Gene set enrichment analysis (GSEA) revealed significant upregulation of genes belonging to the p53 pathway and, to lesser extent, apoptosis and downregulation of c-MYC target genes in nearly all clusters (Figure 2I). In addition, significant upregulation of G2M checkpoint and mitotic spindle genes was observed in clusters comprising the most primitive cells. p53 pathway was also the only gene ontology (GO) term called across several clusters when overrepresentation analysis was performed on the top 100 upregulated genes (Figure S2K). A similar response, but more pervasive across all HSPC subpopulations, was elicited by LS RNP, which triggered higher p53 pathway activation with apoptosis and G2M checkpoint genes upregulation and stronger downregulation of c-MYC targets and oxidative phosphorylation genes. These changes were also revealed by computing the average overall expression of known p53 or c-MYC target genes (Fischer, 2017, Zeller et al., 2003) per cell in each cluster (Figure 2J). Moreover, significant upregulation of inflammation gene categories was observed by GSEA in LS-RNP-treated cells. qPCR showed significant induction of CXCL8 (interleukin-8 [IL8]), IL6, and tumor necrosis factor alpha (TNFα) in response to LS RNP. No induction of IFN1β gene or type-I interferon (IFN) target genes was observed in the conditions tested (Figures 2K and S2L).
Overall, these data indicate that p53 pathway activation and modulation of cell cycle genes are consistently observed upon nuclease treatment across different HSPC types and/or states, including the most primitive subset, as putatively identified in our single-cell analysis. This response is detectable but minor even after induction of a single DSB and substantially increases with lower nuclease specificity up to the activation of pro-inflammatory transcriptional programs.
In-Depth Transcriptomic Analysis Shows that p53 Pathway Activation Is the Predominant and Consistent Response upon Editing at Two Distinct Genomic Loci
To increase the sensitivity of our analysis and extend it to another genomic locus, we performed whole transcriptomic analysis on sorted “primitive” and “progenitor” cells treated with the optimized IL2RG targeting ZFN pair or an early generation 4-finger ZFN pair targeting the AAVS1 safe harbor (Genovese et al., 2014, Lombardo et al., 2011). As control, we employed equimolar amount of IL2RG ZFN monomer. All edited samples displayed comparable high levels of target DNA cleavage and repair (Figure S3A). Upon IL2RG editing, we observed a very limited number of significant DEGs (adjusted p value < 0.05) in primitive (32 up and 3 down) and progenitor cells (35 up and 5 down), consistently with the contained response observed in single-cell analysis to this highly specific nuclease. The number of DEGs, although still limited, was higher in AAVS1-edited cells (103 up and 11 down in primitive; 85 up and 3 down in progenitors; Table S2). A high percentage of DEGs regulated upon IL2RG editing were contained within DEGs regulated upon AAVS1 editing in both subpopulations (Figures 3A and 3B), indicating a shared transcriptional program between editing at the two loci, with additional transcriptional changes induced only in response to AAVS1 editing. Unsupervised hierarchical clustering, performed using the list of DEGs across conditions, retrieved 6 clusters of samples, grouped first by treatment (control monomers, DSB induced by IL2RG and AAVS1 ZFNs) as well as by cell populations. The gene regulation pattern was similar across all edited samples, with AAVS1-edited primitive cells clustering separately from the rest because of the stronger transcriptional response (Figure 3C; Data S1B).
Figure 3.

p53-Dependent Transcriptional Response Is Predominant upon AAVS1 and IL2RG Editing
(A and B) Venn diagram of DEGs in ZFN AAVS1 or IL2RG versus −DSB in CD34+CD133+CD90+ (A) and CD34+CD133+CD90− (B) sorted HSPCs.
(C) Heatmap of regularized log-normalized read counts for genes showing differential expression with adjusted p values < 0.05 across the indicated conditions in HSPC subpopulations; genes (listed in Data S1B) are sorted according to hierarchical clustering, and colors represent the read count values scaled per row (Z scores).
(D) Heatmap showing NES from GSEA against the hallmark gene sets of the Molecular Signatures Database (MSigDB), starting from the list of genes ranked by Log2FC. Terms are sorted according to NES.
(E and F) Volcano plot showing significant down- (green) and up- (red) regulated genes in primitive cells upon DSB at IL2RG (E) and AAVS1 (F) loci. DEGs in proximity of the targeted locus and top 10 p53 target genes ranked by false discovery rate (FDR) are indicated.
We next performed GSEA on gene lists ranked based on log2FC to identify the pathways modulated by nuclease-induced DSB and found positive and significantly high normalized enrichment score for genes belonging to categories involved in the DDR (p53 pathway, G2/M checkpoint, and UV-response-DN), cell cycle regulation (E2F targets and mitotic spindle), apoptosis, epithelial-to-mesenchymal transition, and inflammation (TNF-α signaling via nuclear factor κB [NF-κB]; IL-6/JAK/STAT3 signaling; Figure 3D). We also observed negative enrichment for c-MYC target genes and genes involved in fatty-acid metabolism and oxidative phosphorylation. p53 pathway genes were highly enriched in all edited cells, and more gene categories were modulated in primitive versus progenitor cells with both editing reagents. When plotting the fold change of significant DEGs for each comparison, we found that nearly all top upregulated genes across HSPC subpopulations and editing conditions belonged to the p53 pathway (Figures 3E and 3F for primitive and Figures S3B and S3C for progenitors), with stronger modulation following AAVS1 editing in both subpopulations.
Downregulated genes in IL2RG-edited cells were in proximity of the targeted locus and included IL2RG, MED12, SNX12, and OGT (Figure 3E; Figure S3B in green). Similarly, in AAVS1-edited cells, we identified PPP1R12C, the gene hosting AAVS1 (Figure 3F). These findings are consistent with previously reported transcriptional repression at DNA DSBs (Iannelli et al., 2017), illustrate nucleases on-target activity, and validate the accuracy of our analyses.
Consistent with the more robust transcriptional changes observed upon AAVS1 editing, we observed a more prolonged wave of 53BP1 foci accumulation (Figures S3D and S3E) and p21 level (Figure S3F) as compared to that observed in response to IL2RG editing (see Figures 1C, 1D, and 1H). In agreement with this, we observed reduced clonogenic output of edited cells compared to controls over time (Figure S3G), despite no significant changes in culture composition or apoptosis rate (Figures S3H and S3I).
We next designed a gRNA against AAVS1 with high specificity within the same region targeted by our ZFN set (Table S1; Data S1A), and despite comparable levels of editing (Figure S3J), we observed a more rapid 53BP1 foci resolution (Figures S3K and S3L), transient p21 induction (Figure S3M), and no impact on clonogenic output, culture composition, or apoptosis rate of edited cells (Figures S3N–S3P). These observations indicate that the higher DDR burden observed in response to ZFN AAVS1 could be ascribed to lower specificity of these early generation reagents rather than the choice of the targeted locus.
Overall, this in-depth transcriptomic analysis further indicates that the impact of one or few nuclease-induced DNA DSBs is minor and mainly limited to genes belonging to the p53 pathway. The same pathway was elicited by gene editing at two distinct genomic loci and was more pronounced in primitive versus progenitor cells.
Gene Editing with AAV6 DNA Template Exacerbates the Activation of the p53 Pathway
We then returned to analyze the transcriptional landscape of the HSPCs edited in the presence of an exogenous DNA template from the scRNA-seq experiment of Figure 2. Remarkably, the transcriptional changes observed in cells treated with HS RNP and AAV6 were more robust than those observed in cells treated only with HS RNP. By comparing gene-edited cells transduced with AAV6 and sorted for GFP expression (HS/AAV6 GFP+; enriched for HDR events) or not (HS/AAV6 GFP−) to control, we observed robust upregulation of genes mostly enriched in p53 pathway, apoptosis, and inflammatory response (Figures 4A and S4A). Significantly downregulated pathways included c-MYC targets and cell cycle genes. This pattern was observed throughout the different clusters, with higher normalized enrichment score (NES) for all HSC-enriched subclusters.
Figure 4.

Impact of Targeted-Integration Procedure on HSPC Biology
(A) Heatmap showing NES values for GSEA performed for the indicated clusters. All DEGs in samples were ranked by Log2FC value after comparison to −DSB(RNP) control. ∗p-adjusted < 0.05.
(B) Heatmap showing the mean of the sum of the expression of genes upregulated directly by p53 or c-myc or belonging to HLA class I (Halenius et al., 2015).
(C) Volcano plots showing DEGs in the indicated samples compared to −DSB(RNP) control for “HSC-enriched 1” cluster. Green, downregulated genes; red, upregulated genes with log10 (p-adjusted) < 1.5.
(D) Venn diagram showing the comparison among significant (Log10(p-adjusted) < 1.5) and upregulated (Log2FC > 0.2) genes. Top 5 significant GO terms (Log10(p-adjusted) < 2, Reactome database) enriched within the boxed set of genes are reported.
(E) Volcano plots showing DEGs in HS/AAV6 GFP+ versus HS/AAV6 GFP− for “HSC-enriched 1” cluster. Color scale is as in (C).
(F) Fold expression of p21 relative to electroporation control 24-h post-treatments (n = 11, 5, 6, 3, 3, 8, and 7). Kruskal-Wallis test; lines indicate median values.
(G) 53BP1-positive cells at 12–20 h post-treatments (n = 8, 12, 5, and 4). Kruskal-Wallis test.
(H and I) Percentage of target integration by HDR measured 72 h after IL2RG editing using the indicated donor templates in bulk (H; n = 6, 3, 3, and 6) or within the indicated HSPC subpopulations (I; n = 3).
ns: p > 0.05; ∗p < 0.05; ∗∗p < 0.01; ∗∗∗p < 0.001.
When computing the average overall expression of known p53 or c-MYC target genes per cell in each cluster, we found that the extent of regulation was higher for cells treated with HS RNP/AAV6 compared to HS RNP alone and similar to cells treated with LS RNP alone (Figure 4B; see also Figure 2J). Indeed, the extent and pattern of DEGs versus control were similar among the AAV6-transduced cells to those observed in cells treated with LS RNP (Figure 4C). A good fraction of these upregulated genes in the AAV6-edited samples was shared with the LS-, but not HS-, RNP-treated cells, and was enriched in p53 pathway categories (Figures 4D and S4B). Among the few genes upregulated only upon AAV6 treatment, there were genes belonging to immune-related categories, including histocompatibility leukocyte antigen (HLA) class I genes (Figure 4D; see Figure 4B for average overall expression), suggesting mild activation of innate immune response to sensing of viral components. The G2/M checkpoint category was called by the upregulated genes in LS RNP and the downregulated genes in AAV6 (compare Figures 2I and 4A), with several DEGs showing opposite regulation between the 2 treatments in HSC-enriched cluster 1 (Figure S4C, boxed genes). Further analysis on this latter gene subset showed significant enrichment for FOXM1 transcription factor network (Figure S4D), regulated by p53 and ataxia telangiectasia mutated (ATM) by negative and positive feedback loops (Millour et al., 2011). Opposite regulation of G2M checkpoint genes at the time of our analysis may reflect different duration or engagement of the DDR pathway and/or arrest in different cell cycle phases upon distinct inputs.
When comparing GFP+ and GFP− samples within the HSC-enriched cluster 1, we observed minor differences in gene expression, with IL2RG scoring as the top downregulated gene in GFP+ cells, consistently with the targeted editing of this locus (Figure 4E). Other downregulated genes comprised some cell-cycle-related genes (ASF1B, MYBL2, HIST1H4C, and TK).
The stronger p53 transcriptional response observed in HS/AAV6-edited cells compared with HS RNP treatment alone was triggered by AAV6 transduction, as shown by comparing p21 transcriptional induction and the percentage of cells displaying multiple 53BP1 foci after either single treatment or their combination (Figures 4F, 4G, and S4E). Notably, p21 induction was markedly diminished if single-strand oligodeoxynucleotide (ssODN) of different lengths or double-strand ODN were used as DNA template instead of AAV6 (Figure 4F). Gene editing efficiency, however, remained high and comparable to that observed with AAV6 template in the different HSPC subpopulations, only when using short ssODN (Figures 4H and 4I).
Overall, these data indicate that the p53 pathway receives convergent inputs from the nuclease-induced DNA DSB load and the AAV6 transduction during the gene editing procedure, with cumulative activation of its downstream effectors to levels that can mirror those observed when using low-specificity nucleases. When comparing gene expression in cells that underwent or not HDR, there were almost no differences except for stronger downregulation of cell cycle genes in the former group, likely reflecting more robust arrest when DSB and its repair occurred in HDR-permissive cell cycle phases, such as S/G2.
Gene Editing Induces a Proliferation Delay in HSPCs Overcome by p53 Inhibition
We next assessed whether cumulative p53 activation upon gene editing impacts on HSPC function. We co-electroporated an mRNA encoding for a dominant negative p53 truncated form (GSE56) (Milyavsky et al., 2010) when editing the IL2RG or AAVS1 loci with HS RNP, followed by the cognate AAV6 template. GSE56 significantly mitigated the p53-dependent transcriptional response, as measured by lower upregulation of p53 target genes upon editing, including p21 (Figure 5A). This dampening effect was detectable only within the first 24 h post-treatment, consistently with the transient expression of GSE56 (Figure S5A).
Figure 5.

Dampening the p53 Transcriptional Signature Induced by Gene Editing Increases HSPC Proliferation without Detectable Impact on Genome Integrity
(A) Fold expression of p53-target genes relative to untreated control at 24 h post-treatment (HS/AAV6: n = 8; HS/AAV6+GSE56: n = 7; −DSB(RNP): n = 3). Mann-Whitney test; lines indicate median values.
(B) Cellular confluence after indicated treatments. Up to 50 independent measurements from 3–6 biological replicates were performed. LME model followed by post hoc analysis at the last time point is shown.
(C) Percentage of HSPCs in indicated cell cycle phases measured at 24 h (n = 6, 6, 6, 6, and 6) and 96 h (n = 6, 6, 5, 6, and 6) post-treatments. Significance was calculated for each time point comparing treatments to −DSB(RNP), LME model for each cell cycle phase.
(D) Representative karyotype analysis on HSPC metaphase spreads at 2–4 weeks post-treatments. 157 metaphases from 3 independent donors were analyzed. Percentage of NHEJ and HDR at AAVS1 is indicated.
(E) Representative images of chromosome paint DNA FISH for chromosome 19 (red) and chromosome X (green) on metaphase spreads from HSPCs edited at AAVS1 in presence or not of GSE56.
(F) Percentage of IL2RG alleles harboring chromosome X-14 translocation in HS-RNP-treated HSPCs 72 h post-electroporation (−/+GSE56: n = 10; UT: n = 4), in pools of outgrown colonies (−/+GSE56: n = 6), and in BM cells of mice from Figure 6E (−/+GSE56: n = 6); Wilcoxon matched-pairs signed rank test.
(G) Circos plots for nucleotide substitutions and small indels in HSPCs edited in presence or not of GSE56 2 weeks post-treatment. No significant differences across conditions by two-way ANOVA.
ns: p > 0.05; ∗p < 0.05; ∗∗p < 0.01; ∗∗∗p < 0.001; ∗∗∗∗p < 0.0001.
We then evaluated HSPC cycle progression by measuring cell confluence by time-lapse imaging. Whereas control-treated HSPCs increased confluence at a steady rate, cells treated with HS RNP or exposed to AAV6 donor alone displayed a modest but significant proliferation delay. HSPCs treated with HS RNP in combination with AAV6 had a more robust and prolonged proliferation delay, which could be partially rescued by transient p53 inhibition (Figure 5B). Cell cycle analysis showed that, early upon nuclease-induced DSB with HS RNP, the percentage of HSPCs in S phase was reduced with a concomitant increase in cells in G2/M phase; this effect was exacerbated when using LS reagents (Figure 5C). Combination of HS reagents with AAV6 donor resulted in a concomitant increase in G1 and G2/M phases at the expense of S phase. GSE56 expression rescued the G1 arrest induced by HS/AAV6, increasing the percentage of cells in S phase. The impact on cell cycle was reduced for all treatments at 96 h. Interestingly, the mitigating effect of GSE56 on G1 arrest was no more detectable at this later time, in agreement with its transient p53 inhibition. Of note, GSE56 treatment did not impact the formation and timely resolution of DDR foci induced by nuclease (Figures S5B and S5C).
Altogether, these results indicate that, during gene editing, DSB induction and AAV6 transduction contribute to a robust but transient cell cycle arrest characterized by accumulation of cells mostly in G2/M or G1 phases, respectively, and overcome in part by transient p53 inhibition.
Transient p53 Inhibition Does Not Detectably Impact Genome Stability and Mutational Burden of Edited HSPCs
p53 inhibition may be associated with emergence of chromosomal aberrations and mutational burden. Karyotype analysis of HS-AAVS1-edited HSPCs cultured up to 4 weeks did not reveal any alteration in ploidy or gross chromosomal structures, even when editing was performed in the presence of GSE56 (Figure 5D). Accordingly, we did not observe any alteration on chromosome 19 that hosts AAVS1 in any of the conditions analyzed and across donors (Figure 5E).
To evaluate whether a translocation event induced by nuclease activity on the genome was enhanced in our GSE56 condition, we took advantage of HS RNP, which besides cleaving the intended IL2RG target showed moderate cleavage activity at a second genomic off-target site (see Tables S1 and S2). By quantifying translocation events between these 2 target sites, we detected their occurrence in a small fraction of edited HSPCs, without any difference between cells edited with or without GSE56 (Figure 5F). Of note, translocation events were only detected in bulk cell culture and not in colonies or the human cell graft derived from the edited HSPCs.
We then deep sequenced a panel of 151 cancer-associated genes, including TP53, in cultured HSPCs edited with AAVS1 HS RNP in the presence or not of GSE56. We identified few low-frequency variants in all samples when comparing either editing or control treatment to each other for every donor, without any significant difference in number, type, or distribution of nucleotide substitutions in HSPCs edited with or without GSE56 or control cells (Figures 5G, S5D, S5E, and S5F). None of the variants identified belonged to TP53 or was recurrent across donors (Data S3). The variants called in each sample likely reflected assay background or spontaneous mutations occurring during replication, as suggested by the higher number of variants detected in unedited HSPCs from donor C, which displayed the highest proliferation rate in culture.
Overall, these studies suggest that transient and incomplete inhibition of the p53 response upon gene editing does not detectably aggravate the genotoxicity risk of the procedure.
Transient p53 Inhibition Increases the Yield of Clonogenic and Repopulating Edited HSPCs
We next investigated whether transient p53 inhibition could increase the yield of edited HSPCs and observed a moderate increase of HDR-mediated integration (Figure 6A). The percentage of HDR-edited cells was slightly but consistently higher among all different HSPC subpopulations (Figure 6B), without changes in their proportion or in apoptosis rate (Figures S6A and S6B). Consistently, the number of erythroid and myeloid colonies was higher for the cells edited in the presence of GSE56, in particular for the CD133+CD90+ fraction (Figure 6C).
Figure 6.

Transient p53 Inhibition Increases the Clonogenic and In Vivo Repopulating Capacity of Edited HSPCs
(A) Percentage of HDR and NHEJ 72 h post-editing with AAVS1 or IL2RG HS RNP in presence or not of GSE56 (n = 9); Wilcoxon matched-pairs signed rank test.
(B) Percentage of GFP+ cells 72 h after AAVS1 or IL2RG gene editing in presence or not of GSE56 (n = 15); paired t test.
(C) Colonies from sorted CD133+CD90+ or CD133+CD90− edited cells (n = 11); Mann-Whitney test.
(D–F) Percentage of human CD45+ cells in the peripheral blood (PB) of NSG mice transplanted with (D) HSPCs treated with control mRNA or GSE56 or IL2RG ZFN+AAV6 cells with or without GSE56 (n = 4, 3, 4, and 4), (E) IL2RG HS RNP+AAV6 cells with or without GSE56 (n = 6 and 5), and (F) HSPCs edited as in (E) at AAVS1 site (n = 5 and 5); nonparametric longitudinal data analysis.
(G–I) Percentage of GFP+ cells measured in PB of mice transplanted with cells from (D) in (G), from (E) in (H), and from (F) in (I), respectively.
(J) Percentage of human CD45+GFP+ cells in hematopoietic organs of mice from (D)–(F) (HS/AAV6: n = 14; HS/AAV6+GSE56: n = 15); Mann-Whitney test.
(K) Human PB engraftment after secondary transplant of CD34+ HSPCs sorted from BM of mice in (E) and (F) (n = 6 and 6).
(L) Percentage of GFP+ cells measured within human graft of mice from (K).
∗p < 0.05; ∗∗p < 0.01; ∗∗∗p < 0.001; ∗∗∗∗p < 0.0001. Lines indicate median values.
Finally, we evaluated hematopoietic reconstitution by transplanting HSPCs treated for gene editing into immunodeficient non-obese diabetic (NOD)-severe combined immunodeficiency (SCID)-IL2Rg−/− (NSG) mice. Whereas edited HSPCs engrafted mice to a lower level than control cells, p53 inhibition during editing alleviated this impact (Figure 6D). GSE56 treatment did not increase engraftment per se, as HSPCs electroporated only with GSE56 or control mRNA showed similar engraftment. Increased engraftment of HSPCs edited in the presence of GSE56 was observed in 3 independent experiments employing ZFNs or HS RNP targeting either IL2RG or AAVS1 in combination with the cognate AAV6 donor (Figures 6D–6F) without skewing in differentiation output in blood or bone marrow (Figures S6C–S6F). A high percentage of the graft, ranging from 20% to 40%, was made by cells that underwent HDR (Figures 6G–6I). In one experiment (Figure 6H), the fraction of edited cells tended to decrease at long-term follow-up, and it remained stable in mice transplanted with cells edited with GSE56. In a second experiment (Figure 6I), the graft of cells edited without GSE56 decreased at long-term follow-up and showed higher variance in the fraction of edited cells, suggesting oligoclonal reconstitution. In all experiments, the content of edited human cells in hematopoietic organs was significantly higher in mice transplanted with HSPCs edited in the presence of GSE56 (Figure 6J). Secondary transplantation showed maintenance of engraftment capacity of the edited cells in all conditions, with a trend for higher engraftment by cells edited with GSE56 (Figures 6K and 6L). Targeted sequencing of the HDR-edited IL2RG locus did not reveal any increase in nucleotide substitutions in in vitro cultured or transplanted HSPCs edited with or without GSE56 (Figure S6G).
Overall, these results imply that the p53 activation induced by our gene-editing strategy (DSB + AAV6) reduces the yield of clonogenic and repopulating HSPCs. Short transient inhibition of this response at the time of editing overcomes this constrain and allows higher levels of stable repopulation of transplant recipients by the edited HSCs.
Discussion
Understanding the response to gene editing in ex vivo cultured HSPCs represents a fundamental step toward the clinical development of HSC-based therapies. Here, we identified transient activation of the p53 DDR pathway as a predominant mediator of the response of HSPCs to even single or few nuclease-induced DSBs, resulting in proliferation delay. Although this response resolves without any detectable detrimental impact on HSPC function, prolonged or exacerbated DDR, as induced by lower specificity nucleases, results in growth arrest, especially in the more primitive HSPC subsets. Importantly, the p53 DDR pathway receives multiple converging inputs during the editing procedure, including sensing of AAV6, which may cumulatively impact on HSPC function, even when highly specific nucleases are employed.
To study the apical events in the DDR pathway, we probed for γH2AX and 53BP1 because of their previously reported megabase-wide spreading on the chromatin flanking the DSB (Iacovoni et al., 2010), thus allowing more sensitive detection of single-nuclease-induced DDR foci compared to other reported DDR markers. Combined immunofluorescence and DNA FISH for the nuclease target locus proved that the majority of 53BP1 foci in edited cells were associated with the target locus. To our surprise, we detected γH2AX foci in cultured HSPCs that did not necessarily co-localize with 53BP1. γH2AX signal may be indicative of replication stress induced in culture, an exquisite feature of aged HSCs (Flach et al., 2014), thus limiting the use of this marker alone as a sensitive indicator of nuclease-induced DSBs. The positive correlation between the percentage of 53BP1 foci-bearing cells and of modified targeted alleles by NHEJ suggests that the former assay provides a readout of the overall nuclease activity on the genome per cell and may help comparing the impact of different nucleases directly on primary HSPCs.
The slightly delayed kinetics of DSB rejoining observed for CRISPR/Cas9 versus ZFN in response to matched IL2RG editing levels may be explained by the different nature of generated DNA lesions, which comprise 5′ protruding overhangs for ZFN and blunt ends for RNP, the reported physical retention of Cas9 on DNA ends (Richardson et al., 2016), and the possible engagement of different DNA repair pathways (Bothmer et al., 2017). Recently, computational modeling of rejoining of Cas9-induced DNA ends indicated slow and imperfect repair rates compared to naturally occurring DSBs (Brinkman et al., 2018), thus providing quantitative insights in support of our observation.
Remarkably, when focusing on single cells, the extent of DDR induced by gene editing, even when using LS RNP, did not impact the relative distribution and transcriptional identity of the identified cell clusters, suggesting limited impact on cell state and/or type 24 h post-treatment, when cells are usually transplanted. We found that, despite 4 days of ex vivo culture, a continuum of transcriptional states was preserved, which encompassed cells enriched for HSC features with emerging lineage marking, consistent with previous single-cell studies on uncultured HSPCs (Velten et al., 2017). Subclusters comprising cells with the most primitive gene signature showed a lower basal expression of p53 target and DNA repair genes, except for the subcluster enriched for cell cycle genes. Thus, primitive HSCs preserve in short-term culture the previously reported low expression of DDR and DSB repair genes (Beerman et al., 2014, Biechonski et al., 2018) and upregulate these genes when engaging in S/G2. Conceivably, repair of the DNA DSB may thus be delayed in HSC cultured for editing, likely until they engage in DNA replication. DDR signaling in this phase may then impose a robust arrest to cell cycle progression (Ciccia and Elledge, 2010). Indeed, downregulation of c-MYC target genes and deregulation of G2/M checkpoint and mitotic spindle genes were more clearly observed in clusters comprising the most primitive cells, likely underlying more robust cell cycle arrest. This interpretation may also explain why, when comparing cells that underwent or not HDR, there was a lower fraction of primitive cells with enriched cell cycle genes (cluster “HSC-enriched 2”). Because HDR-mediated integration presumably occurred in S/G2, these cells might be delayed in the progression to the next cell cycle at the time of analysis.
When the DDR was more sustained, we observed enrichment for genes involved in cytokine-mediated signaling pathways. These responses are in agreement with the previously described link between ATM and the NF-κB transcriptional network (Fang et al., 2014) and the recent evidence that DDR-dependent inflammation occurs through cytosolic DNA sensing (Di Micco, 2017). If secreted, such inflammatory cytokines could affect cell fate in a paracrine manner, thus amplifying the impact of gene editing on the whole cell culture.
Higher p53 pathway activation was also observed when performing editing together with AAV6 transduction, which per se induced p21 expression, delayed proliferation, and increased the number of 53BP1 foci. These findings may reflect recognition of the inverted terminal repeats or other AAV DNA structures by the host cell DDR machinery (Schwartz et al., 2007). They also extend a previous study showing transient p21 induction in HSPCs transduced with AAV or lentiviral vectors (LVs), which was associated with a modest reduction in the repopulation capacity of LV-transduced cells in mouse xenografts (Piras et al., 2017). Despite these findings, several clinical studies show that LV-transduced HSPCs engraft robustly and long-term in humans (Naldini, 2019), suggesting that limited and transient induction of p53 response is compatible with maintenance of long-term repopulation capacity at least in a sizable fraction of the cultured cells.
Recently, pervasive CRISPR-Cas9-induced toxicity was reported in pluripotent stem cells (Ihry et al., 2018) and immortalized retinal pigmented epithelial cells (Haapaniemi et al., 2018) and was ascribed to robust p53 activation, leading to apoptosis or cell cycle arrest, respectively (Conti and Di Micco, 2018). p53 was shown to constrain gene editing in these cells and pose a theoretical risk of enriching for p53 inactivation when selecting for edited cells. Our data indicate that HSPCs well tolerate one or few DSBs, with only transient p53 activation and a limited impact on their functionality, mainly consisting in delayed proliferation. Moreover, we did not detect any mutation in the TP53 or ATM genes of edited cells upon prolonged culture by deep sequencing. The response to DSBs among different cell types may be ascribed to distinct apoptosis susceptibility and DNA repair proficiency. Whereas our data show that combining AAV6 delivery with highly specific reagents further delays cell cycle progression, mostly by halting cells both in G1 and G2/M phases, these responses are reversible and appear to affect mostly the yield of HSPCs that underwent successful editing. Indeed, although the number of in vitro colonies, the graft size, and the yield of HDR-edited cells long term after transplant were higher when HSPCs were edited in the presence of p53 inhibitor, these quantitative differences could be explained by the input of a lower fraction of primitive progenitors edited in the standard condition, likely due to delayed proliferation as compared to the unedited counterparts.
Because the rate of hematopoietic repopulation after recipient conditioning depends on the HSPC content of the administered cell product (Copelan, 2006), a low yield of edited HSPC may still impact the feasibility and safety of therapy (Schiroli et al., 2017). Dampening p53 activation during the editing procedure might be considered in some translational settings to increase the yield of edited HSPCs that could engraft patients and ensure rapid establishment of therapeutic benefit. Whereas stable inactivation of p53 might impose a risk of malignancies, a recent study in mice did not show any increase in mutational load upon stable p53 genetic inactivation in HSCs (Garaycoechea et al., 2018). Furthermore, our experimental conditions only partially inhibit p53 signaling within the first 24 h post-editing, with indication of restored DDR signaling afterward (see Figures S5A and 5C) and maintenance of proficient DNA repair (see Figures S5B, S5C, 6A, and 6B). We did not detect any evidence for increased occurrence of chromosomal aberrations and mutational burden when editing was performed in the presence of GSE56, although with the caveats of limited sensitivity of our karyotype analysis and only a targeted genomic coverage in the deep-sequencing studies. Even if oncogenic mutations occur, prompt restoration of the p53 pathway may counter-select cells that have acquired them (Di Micco et al., 2006, Martins et al., 2006). Ultimately, a risk/benefit assessment should be made for each disease application, taking into account the overall genotoxic risk of the genetic manipulation and the clinical implications of transplanting limiting amounts of corrected cells.
Overall, our study provides molecular and functional evidence of the feasibility of seamless targeted gene editing in HSPCs and supports the rationale for testing precision genetic engineering of HSPCs in clinical trials of novel therapies in the near future.
STAR★Methods
Key Resources Table
| REAGENT or RESOURCE | SOURCE | IDENTIFIER |
|---|---|---|
| Antibodies | ||
| Anti-human FCR Blocking | Miltenyi Biotec | Cat# 130-059-901 |
| Purified Rat Anti-Mouse CD16/CD32 | BD Biosciences | Cat# 553141; RRID:AB_394656 |
| Anti-human CD34 PeCy7 | BD Biosciences | Cat# 348811; clone 8G12 |
| Anti-human CD90 APC | BD Biosciences | Cat# 559869; RRID:AB_398677; clone 5E10 |
| Anti-human CD133/2 PE | Miltenyi Biotec | Cat# 130-090-853; RRID:AB_244346; clone 293C3 |
| Anti-human CD34 VioBlue | Miltenyi Biotec | Cat# 130-113-744, RRID:AB_2726283; clone AC136 |
| Anti-human CD45 PB | Biolegend | Cat# 304029, RRID:AB_2174123; clone HI30 |
| Anti-human CD45 APC-eFluor 780 | eBioscience | Cat# 47-0459-42; RRID:AB_1944368; clone HI30 |
| Anti-human CD19 PeCy7 | Biolegend | # 302215, RRID:AB_314245; clone HIB19 |
| Anti-human CD19 PE | BD Biosciences | Cat# 555413, RRID:AB_395813; clone HIB19 |
| Anti-human CD3 PeCy7 | Biolegend | Cat# 300316, RRID:AB_314052; clone HIT3a |
| Anti-human CD13 APC | BD Biosciences | Cat# 557454, RRID:AB_398624; clone WM15 |
| Anti-human CD33 PeCy7 | BD Biosciences | Cat# 333952, RRID:AB_2660886; clone P67.6 |
| Anti-human CD34 PE | Miltenyi Biotec | Cat# 130-081-002, RRID:AB_244351; clone AC136 |
| Anti-human CD133/1 PeCy7 | Miltenyi Biotec | Cat# 130-101-652, RRID:AB_2726283; clone AC133 |
| Anti-phospho Histone H2A.X (ser139), mouse | Millipore | Cat# 05-636, RRID:AB_309864; clone JBW301 |
| Anti - 53BP1, rabbit | Bethyl Laboratories | Cat# A300-272A, RRID:AB_185520 |
| Anti-53BP1, rabbit | Novus Biologicals | Cat# NB100-304, RRID: AB_350221 |
| Alexa Fluor 488 donkey anti mouse | Thermo Fisher | Cat# A-21202, RRID:AB_141607 |
| Alexa Fluor 488 donkey anti rabbit | Thermo Fisher | Cat# A-21206, RRID:AB_2535792 |
| Alexa Fluor 568 donkey anti rabbit | Thermo Fisher | Cat# A-10042, RRID:AB_2534017 |
| GAR-Alexa Fluor 488 | Life Technologies | Cat# A11034 RRID:AB_2576217 |
| Alexa Fluor 647 donkey anti mouse | Thermo Fisher | Cat# A-31571, RRID:AB_162542 |
| Biological Samples | ||
| Umbilical cord blood | Ospedale San Raffaele (TIGET01/09) | N/A |
| Chemicals, Peptides, and Recombinant Proteins | ||
| Prostaglandin E2 | Cayman | Cat# 14750 |
| StemSpan SFEM II | STEMCell Technologies | Cat# 09650 |
| Recombinant human stem cell factor | Peprotech | Cat# 300-07 |
| Recombinant human thrombopoietin | Peprotech | Cat# 300-18 |
| Recombinant human Flt3 ligand | Peprotech | Cat# 300-19 |
| Recombinant human IL6 | Peprotech | Cat# 200-06 |
| StemRegenin 1 (SR1) | BioVision | Cat# 1967 |
| UM171 | STEMCell Technologies | Cat# 72912 |
| MethoCult H4434 | STEMCell Technologies | Cat# 04434 |
| CD34 MicroBead Kit, human | Miltenyi Biotec | Cat# 130-046-702 |
| Iscove’s DMEM, 1X | Corning | Cat# 15-016-CVR |
| Fetal Bovine Serum South America Origin | EuroClone | Cat# FA30WS1810500 |
| Penicillin-Streptomycin (Pen-Strep) (Pen 10.000 U/mL; Strep 10.000 μg/mL) | Lonza | Cat# 17-602E |
| L-Glutamine 200mM | EuroClone | Cat# ECB3000D |
| Alt-R® CRISPR-Cas9 tracrRNA | Integrated DNA Technologies | Cat# 1072534 |
| Alt-R® CRISPR-Cas9 crRNA | Integrated DNA Technologies | http://www.idtdna.com/ |
| Alt-R® Cas9 Electroporation Enhancer | Integrated DNA Technologies | Cat# 1075916 |
| Alt-R® CRISPR-Cas9 Negative Control crRNA #1 | Integrated DNA Technologies | Cat# 1072544 |
| sNLS-SpCas9-sNLS Nuclease | Aldevron | Cat# 9212 |
| DAPI, 4′,6-Diamidino-2-phenyindole, dilactate | SIGMA | Cat# D9564 |
| 7-AAD Viability Staining solution | BioLegend | Cat# 420403 |
| Pacific Blue Annaexin V | BioLegend | Cat# 6409 |
| Critical Commercial Assays | ||
| Fast SYBR Green Master Mix 2X | Thermo Fisher | Cat# 4385618 |
| QIAamp DNA Micro Kit | QIAGEN | Cat# 56304 |
| RNeasy Plus micro | QIAGEN | Cat# 74034 |
| MinElute PCR Purification kit | QIAGEN | Cat# 28006 |
| SuperScript Vilo kit | Invitrogen | Cat# 11754250 |
| P3 Primary Cell 4D-Nucleofector X Kit | Lonza | Cat# V4XP-3032 |
| T7 Endonuclease I | New England Biolabs | Cat# M0302L |
| Chromium Single Cell 3′ Library & Gel Bead Kit v2 | 10X Genomics | Cat# PN-120237 |
| Chromium Single Cell A Chip Kits | 10X Genomics | Cat# PN-1000009 |
| Chromium Multiplex Kit | 10X Genomics | Cat# PN-120262 |
| MEGAscript T7 Transcription Kit | Thermo Fisher | Cat# AM1333 |
| Click-iT Plus EdU Flow Cytometry Assay Kits | Thermo Fisher | Cat# C10419 |
| iScript cDNA Synthesis Kit | Bio-RAD | Cat# 170-8891 |
| TaqMan PreAmp Master Mix 2X | Thermo Fisher | Cat# 4488593 |
| RNase-Free DNase Set | QIAGEN | Cat#79254 |
| miRNeasy Micro Kit | QIAGEN | Cat#1071023 |
| DNeasy Blood & Tissue Kit | QIAGEN | Cat#69504 |
| SureSelectQXT Reagent Kit, ILM 16rxn | Agilent Technolgies | Cat#G9683A |
| ClearSeq Comprehensive Cancer Panel | Agilent Technologies | Cat#5190-8011 |
| TrSq Strnd TL RNA Rbo-Zro Glod St A | Illumina | Cat#RS-122-2301 |
| Deposited Data | ||
| RNA-seq and Mutational Analysis data | This paper | GEO: GSE119597 |
| Experimental Models: Cell Lines | ||
| CB-CD34 | Lonza | Cat# 2C-101 |
| K-562 cells | ATCC | Cat# CCL-243; RRID:CVCL_0004 |
| Experimental Models: Organisms/Strains | ||
| NOD.Cg-Prkdcscid Il2rgtm1Wjl/SzJArc Mus musculus | Jackson laboratory (IACUC 749) | Cat# ARC:NSG, RRID:IMSR_ARC:NSG |
| Oligonucleotides | ||
| See Table S3 | This paper | N/A |
| Recombinant DNA | ||
| pAAV2/6.PGK.GFP.BGHpa (AAVS1 HA) | This paper | N/A |
| pAAV2/6.coIL2RG.PGK.GFP.BGHpa (IL2RG HA) | Schiroli et al., 2017 | N/A |
| pVax. GSE56.WPRE | This paper | N/A |
| pVax-57629 IL2RG Intron1-3′UTR PolyA | Sangamo Therapeutics | N/A |
| pVax-57718 IL2RG Intron1-3′UTR PolyA | Sangamo Therapeutics | N/A |
| pVax-10099 AAVS1-3′UTR PolyA | Sangamo Therapeutics | N/A |
| pVax-9931 AAVS1-3′UTR PolyA | Sangamo Therapeutics | N/A |
| Software and Algorithms | ||
| FACSDIVA software | BD Biosciences | |
| GraphPad Prism v.8 | GraphPad Software | https://www.graphpad.com/ |
| FCS Express Flow | De Novo Software | https://www.denovosoftware.com/ |
| Vector NTI | Invitrogen | https://www.thermofisher.com/us/en/home.html |
| QuantaSoft | Biorad | https://www.bio-rad.com/ |
| QuantStudio Real-Time PCR software | Applied Biosystems | https://www.thermofisher.com/us/en/home.html |
| LabChip GX software | Perkin Elmer | https://www.perkinelmer.com/ |
| R v3.4.3 | The R Foundation | https://www.r-project.org |
| FlowJo | TreeStar | https://www.flowjo.com/ |
| ImageJ | NIH | https://imagej.nih.gov/ij/ |
| CellProfiler (version 2.1.1, revision 6c2d896) | https://cellprofiler.org/ | |
| LAS X Leica Software | Leica Mycrosystems | https://www.leica-microsystems.com/it/prodotti/software-per-microscopi/dettagli/product/leica-las-x-ls/ |
Contact for Reagent and Resource Sharing
The reagents described in this manuscript are available under a material transfer agreement with Ospedale San Raffaele and Fondazione Telethon; requests for materials should be addressed to L.N., P.G. and R.D.M. The ZFN reagents are owned by Sangamo Therapeutics. Further information for resources sharing will be fulfilled by the Lead Contact, L.N. (naldini.luigi@hsr.it).
Experimental Model and Subject Details
Mice
NOD-SCID-IL2Rg−/− (NSG) mice were purchased from The Jackson Laboratory and maintained in specific-pathogen-free (SPF) conditions. The procedures involving animals were designed and performed with the approval of the Animal Care and Use Committee of the San Raffaele Hospital (IACUC #749) and communicated to the Ministry of Health and local authorities according to Italian law.
Primary cells
CD34+ HSPCs were either freshly purified from human cord blood (CB) after obtaining informed consent and upon approval by the Ospedale San Raffaele Bioethical Committee, or purchased frozen from Lonza. Briefly, CD34+ HSPCs were seeded at the concentration of 5x10⁵ cells/ml in serum-free StemSpan medium (StemCell Technologies) supplemented with penicillin, streptomycin, glutamine, 1 μM SR-1(Biovision), 50 nM UM171 (STEMCell Technologies), 10 μM PGE2 added only at the beginning of the culture (Cayman), and human early-acting cytokines (SCF 100 ng/ml, Flt3-L 100 ng/ml, TPO 20 ng/ml, and IL-6 20 ng/ml; all purchased from Peprotech). HSPCs were cultured in a 5% CO2 humidified atmosphere at 37°C. In all the experiments HSPCs from male and female donors were pooled together to have sufficient number of cells, unless otherwise specified.
Cell lines
The human K562 cells (RRID:CVCL0004) were maintained in Iscove’s modified Dulbecco’s medium (IMDM; Corning) supplemented with 10% fetal bovine serum (FBS; Euroclone), penicillin (100 IU/ml), streptomycin (100 μg /ml) and 2% glutamine. Cells were cultured in a 5% CO2 humidified atmosphere at 37°C.
Method Details
Vectors and nucleases
AAV6 donor templates for HDR were generated from a construct containing AAV2 inverted terminal repeats, produced at the TIGEM Vector Core by triple-transfection method and purified by ultracentrifugation on a cesium chloride gradient as previously described (Wang et al., 2015). Design of AAV6 donor templates with homologies for AAVS1 locus (encoding for a PGK.GFP reporter cassette) or targeting intron 1 of IL2RG (encoding for IL2RG corrective cDNA followed by a PGK.GFP reporter cassette) were previously reported (Schiroli et al., 2017).
Intron 1 IL2RG short ssODN donor templates for HDR were purchased from Integrated DNA Technologies as Ultramer DNA Oligo and designed to maximize HDR efficiency as reported (Richardson et al., 2016). Briefly, they were stabilized with phosphorothioate base modifications at the 5′ and 3′ ends and designed to be complementary to the non-target DNA strand with asymmetric homologies of 64 bp at the 5′ and 49 bp at the 3′ end. Upon HDR mediated repair, 3 nucleotides are substituted in the target locus, which generate a RFLP and insert a BsRGI restriction site. Intron 1 IL2RG long ssODN donor templates for HDR were purchased from Integrated DNA Technologies as Megamer DNA Oligo and designed to have a total length of 903 bp with same homology arms of IL2RG AAV6 donor template. Intron 1 IL2RG dsDNA donor template for HDR was synthetized by high-fidelity PCR using the IL2RG AAV6 donor plasmid as template and primers listed in Table S3. dsDNA amplicons were purified by gel electrophoresis to remove plasmid template.
ZFN targeting AAVS1 were from a previously described early generation 4 finger set (Genovese et al., 2014, Lombardo et al., 2011, Schiroli et al., 2017) here modified with obligate heterodimeric FokI domains. The highly optimized ZFN targeting IL2RG intron 1 were previously reported (Schiroli et al., 2017). ZFNs were transiently expressed from in vitro transcribed mRNAs as previously described (Genovese et al., 2014), incorporating modified nucleotides (5-mC and ψU, TriLink Biotechnologies) during the in vitro transcription procedure and purifying mRNAs by reverse phase dHPLC (Transgenomic) with a protocol adapted from (Karikó et al., 2011).
The GSE56.WPRE construct was cloned from a lentiviral vector expressing GSE56.WPRE (Milyavsky et al., 2010) into a pVax plasmid for in vitro mRNA transcription containing a T7 promoter, β-globin 3′UTR and 64bp-polyA.
Sequences of the gRNAs were designed using an online CRISPR design tool (Hsu et al., 2013) and selected for predicted specificity score and on target activity. Genomic sequences recognized by the gRNAs are indicated in Table S2. Ribonucleoproteins (RNPs) were assembled by incubating at 1:1.5 molar ratio S.p.Cas9 protein (Aldevron) with synthetic cr:tracrRNA (Integrated DNA Technologies) for 10’ at 25°C. Electroporation enhancer (Integrated DNA Technologies) was added prior to electroporation according to manufacturer’s instructions.
Gene editing of human HSPCs and analyses
After 3 days of stimulation, cells were washed with PBS and electroporated using P3 Primary Cell 4D-Nucleofector X Kit and program EO-100 (Lonza). Cells were electroporated with 1.25-2.5 μM of RNPs or 175 μg/ml ZFN encoding mRNAs as indicated. Transduction with AAV6 was performed at a dose of 1-2x10⁴ vg/cell 15’ after electroporation. Short ssODN was electroporated at a dose of 200 pmol. Long ssODN and dsDNA were electroporated at a concentration of 1.83 ng/μl (1 pmol) and 15 ng/μl (0.12 pmol), respectively. GSE56 mRNA (and control mRNA) were utilized when indicated at a dose of 150 μg/ml. Gene editing efficiency was measured from cultured cells in vitro 3 days after electroporation by flow cytometry measuring the percentage of cells expressing the GFP marker or by digital droplet PCR analysis designing primers and probe on the junction between the vector sequence and the targeted locus and on control sequences utilized as normalizer as previously described (Schiroli et al., 2017).
CFU-C assay was performed at the indicated timings after electroporation, plating 400-800 cells in methylcellulose-based medium (MethoCult H4434, StemCell Technologies) supplemented with penicillin and streptomycin. For selected analysis the medium was also supplemented with 50ng/ml IL6 and 20 ng/ml FT3L (for each condition 3 technical replicates were performed). Two weeks after plating, colonies were counted in blinded fashion, identified according to morphological criteria.
CD34+ HSPC xenotransplantation studies in NSG mice
For transplantation, 3x10⁵ CD34+ cells treated for editing at day 5 of culture were injected intravenously into NSG mice after sub-lethal irradiation (150-180 cGy). Sample size was determined by the total number of available treated cells. Mice were randomly attributed to each experimental group. Human CD45+ cell engraftment and the presence of gene-edited cells were monitored by serial collection of blood from the mouse tail and, at the end of the experiment (> 20 weeks after transplantation), BM and spleen were harvested and analyzed.
Molecular analyses
For molecular analyses, genomic DNA was isolated with DNeasy Blood & Tissue Kit or QIAamp DNA Micro Kit (QIAGEN) according to the number of cell available. Nuclease activity (IL2RG intron 1, AAVS1 intron 1) was measured by mismatch-sensitive endonuclease assay by PCR-based amplification of the targeted locus followed by digestion with T7 Endonuclease I (NEB) according to the manufacturer’s instructions. HDR-mediated integration of ssODN was quantified by PCR-based amplification of the targeted IL2RG locus, followed by digestion with BsrGI enzyme (NEB).
Digested DNA fragments were resolved and quantified by capillary electrophoresis on LabChip GX Touch HT (Perkin Elmer) according to the manufacturer’s instructions.
For digital droplet PCR analysis, 5-50 ng of genomic DNA were analyzed in duplicate using the QX200 Droplet Digital PCR System (Biorad) according to the manufacturer’s instructions.
For DNA DSB ddPCR, primers and probes were designed on the cleaved sequence (Target site) and on a nearby genomic region (Proximal site), as reported (Rose et al., 2017). Thermal conditions for annealing and extension were adjusted as follows: 55°C for 30 s, 72°C for 3 min. The fraction of cleave DNA was calculated as follows: cleaved product: (Hex+ Fam-) /((Hex+Fam-) +(Hex+ Fam+)); subtraction of background: (Hex- Fam+) /((Hex-Fam+) + (Hex+ Fam+)).
For HDR ddPCR, primers and probes were designed on the junction between the vector sequence and the targeted locus and on control sequences used for normalization (human TTC5 genes). For chromosome X-14 (chrX-chr14) translocation involving IL2RG, ddPCR, primers and probes were designed on the junction between the two RNP cleavage sites on both chromosomes and on control sequences used for normalization (human TTC5 genes). Thermal conditions for annealing and extension were adjusted for each specific application as follows: AAVS1/ Intron 1 IL2RG HDR 3′ integration junction ddPCR, chrX-chr14 translocation ddPCR: 55°C for 30 s, 72°C for 2 min. Primers and probes for PCR and ddPCR amplifications are shown in Table S3.
For gene expression analyses, total RNA was extracted using either miRNeasy Micro Kit (QIAGEN) or RNeasy Plus Micro Kit (QIAGEN), according to the manufacturer’s instructions and DNase treatment was performed using RNase-free DNase Set (QIAGEN). cDNA was synthetized with iScript cDNA Synthesis Kit (Bio-Rad) or SuperScript VILO IV cDNA Synthesis Kit (Invitrogen) with EzDNase treatment. For selected analyses, cDNA was then pre-amplified using TaqMan PreAmp Master Mix (ThermoFisher) and used for q-PCR in a Viia7 Real-time PCR thermal cycler using both Fast SYBR Green Master Mix (Thermofisher), after standard curve method optimization to reach the 100% primer efficiency for each couple of primers listed in Table S3, or TaqMan Gene Expression Assays (Applied Biosystems) mapping to genes indicated in Table S3. The relative expression of each target gene was first normalized to HPRT or GUSB housekeeping genes expression and then represented as 2ˆ-ΔCt for each sample or as fold changes (2ˆ-ΔΔCt) relative to the indicated control conditions.
Flow cytometry
For immunophenotypic analyses (performed on FACSCanto II; BD PharMingen), we used the antibodies listed in the Key Resources Table. Single stained and Fluorescence Minus One stained cells were used as controls. 7-AAD Viability Staining Solution (BioLegend) were included in the sample preparation for flow cytometry to exclude dead cells from the analysis. Apoptosis analysis was performed by 7-AAD staining in combination with Annexin V (BioLegend) according to the manufacturer’s instructions. . Cell sorting was performed using MoFlo XDP Cell Sorter (Beckman Coulter) or FACS Aria Fusion (BD Biosciences).
Single-cell RNA-Sequencing and analyses
Droplet-based digital 3′ end scRNA-Seq was performed on a Chromium Single-Cell Controller (10X Genomics) using the Chromium Single Cell 3′ Reagent Kit v2 according to the manufacturer’s instructions. 24 hours after the editing treatment, CD34+ cells were sorted according to surface expression of CD34+ CD133+ CD90+ and CD34+ CD133+ CD90−; viable cells were counted with Trypan Blue solution 0.4% (GIBCO) and 5200 viable cells (2700 from each population) were utilized for the subsequent procedure (estimated recovery: 3000 cells/sample). Briefly, single cells were partitioned in Gel Beads in Emulsion (GEMs) and lysed, followed by RNA barcoding, reverse transcription and PCR amplification (12-14 cycles, according to the available cDNA quantity). scRNA-Seq libraries were prepared according to the manufacturer’s instructions, checked and quantified on LabChip GX Touch HT (Perkin Elmer) and Qubit 3.0 (Invitrogen) instruments. Sequencing was performed on a NextSeq 500 machine (Illumina) using the NextSeq 500/550 High Output v2 kit (75 cycles).
Illumina sequencer’s base call files (BCLs) were demultiplexed, for each flow cell directory, into FASTQ files using Cellranger mkfastq with default parameters (v. 1.3, https://github.com/10XGenomics/cellranger). FASTQ files were then processed using Cellranger count with default parameters. Internally, the software relies on STAR for aligning reads to a pre-build filtered human reference genome relying on GRCh38, while genes are quantified using ENSEMBL genes as gene model. The output of Cellranger is a BAM file containing reads aligned to the genome annotated with barcode information and a filtered gene-barcode matrix containing the UMI counts for each gene.
Gene counts were processed with Seurat (v 2.3.1, https://satijalab.org/seurat/). Cells expressing less than 200 unique genes and genes expressed in less than 3 cells/sample were discarded. Counts were normalized using Seurat function NormalizeData with default parameters. Genes with a mean expression lower than 0.01 were excluded. Cells with a ratio of mitochondrial versus endogenous genes expression exceeding 0.15 were also excluded. Expression data were then scaled using the ScaleData function, regressing on difference between S and G2M scores. Cell cycle scores were calculated using the CellCycleScoring function, providing as input a previously reported gene list (Nestorowa et al., 2016). Multi-set Canonical Correlation Analysis (MultiCCA) (Butler et al., 2018) was then performed for all the 6 samples using the MultiCCA function. A list of genes differentially expressed between cultured CD34+ CB-derived primitive and committed cells (Fares et al., 2017) was used as input, and the first 20 dimensions of the achieved reduction were aligned.
Cell clusters were defined evaluating the first 15 CCA components at resolution r = 0.6 using the FindCluster function, which relies on a hared nearest neighbor clustering algorithm, using the default Louvain implementation. Cells were visualized in 2-dimension using t-SNE (t-Distributed Stochastic Neighbor Embedding). Genes enriched in cells within each cluster were identified selecting only genes expressed in at least 20% of cluster single cells ranking by decreasing logFC.
As gene signatures for the different cell populations, we utilized list of genes differentially expressed in defined subpopulations from CB- (Doulatov et al., 2013, Fares et al., 2017) or BM- derived (Velten et al., 2017) CD34+ cells.
Genes differentially expressed across different conditions were identified using the FindMarkers function, applying the MAST test (Finak et al., 2015) and the Bonferroni correction. Average logFC were computed adding to averaged pseudocount expression values of 0.001 and only genes expressed in at least 1% of cells in at least one sample were considered.
Pseudo-time trajectories were identified in each single sample by using Monocle with default parameters (v 2.8, https://github.com/cole-trapnell-lab/monocle-release). This R package orders individual cells according to their progress through a biological process, by identifying genes that define the progress through that process. As before, a list of genes differentially expressed between cultured CD34+ CB-derived primitive and committed cells (Fares et al., 2017) was used as input of the pseudo-time procedure. Cell clusters were recovered by the Seurat MultiCCA analysis. Dimensional reduction was achieved through the DDRTree approach.
Over Representation Analysis (ORA) and Gene Set Enrichment Analysis (GSEA) were computed considering different datasets (Gene Ontology, KEGG Pathway Database, Reactome Pathway Database, Disease Ontology, Molecular Signatures Database) through clusterProfiler (v 3.8.1, http://bioconductor.org/packages/release/bioc/html/clusterProfiler.html) and enrichR (v 1.0, https://cran.r-project.org/web/packages/enrichR/index.html). For Over Representation Analysis, the top 100 genes upregulated and downregulated in samples versus –DSB(RNP) condition comparisons were identified ranking genes on logFC values. Only genes expressed in at least 5% of cells in at least one sample were considered. For GSEA, differentially expressed genes were pre-ranked according to Log2FC values.
Mean normalized expression level of genes targeted by p53 or c-myc transcriptional activity (Fischer, 2017) (Zeller et al., 2003), or HLA class I genes (Halenius et al., 2015) within identified clusters were calculated by dividing the sum of the expression (scaled log transformed TPM values) of each gene per cell with the total number of cells belonging to each cluster.
Total RNA-seq library preparation and analysis
Total RNA was isolated using miRNeasy Micro Kit (QIAGEN), and DNase treatment was performed using RNase-free DNase Set (QIAGEN), according to the manufacturer’s instructions. RNA was quantified with The Qubit 2.0 Fluorometer (ThermoFisher) and its quality was assessed by a 2100 Agilent Bioanalyser (Agilent Technologies). Minimum quality was defined as RNA integrity number (RIN) > 8. 300 ng of total RNA were used for library preparation with TruSeq Stranded Total RNA with Ribo-Zero Gold kit (Illumina) and sequenced on a NextSeq 500 (Illumina). RNA-seq data were aligned to the human reference genome (GRCh38/hg38) using both HISAT2 and STAR with standard input parameters. Gene counts were produced using Subread featureCounts against Genecode v26, considering results produced by both the aligners. After visual inspection of results, we continued the analysis using alignments achieved using HISAT, which provided more conservative alignments. Transcript counts were processed using edgeR (normalizing for library size using trimmed mean of M-values), DeSeq2 (normalizing for library size using Relative Log Expression) and limma-voom (normalizing for library size using trimmed mean of M-values), using standard protocols as reported in the respective manuals. All the predictions tools achieved very similar results in terms of differential expressed genes. We continued the analysis using edgeR results, which provided the more conservative and shared list of genes. Differential expression was determined considering only protein coding genes and correcting p-values using FDR.
GUIDE-Seq Analysis
For GUIDE-Seq analysis 3x10⁵ K562 cells were electroporated using Nucleofector 4D device (Lonza) according to the manufacturer’s instructions (SF kit, program FF-120) with 25 pmol CRISPR-Cas9 delivered as RNP and 200 pmol dsODN designed as in (Tsai et al., 2015). Successful dsODN integration at the on-target sites was confirmed by restriction fragment length polymorphism assay using NdeI enzyme (NEB). Library preparation was performed as in (Tsai et al., 2015). Briefly, genomic DNA was extracted using DNeasy Blood & Tissue Kit (QIAGEN) and sheared with Covaris E220 instrument to an average length of 500 bp according to the manufacturer’s instructions. DNA fragments were then end-repaired, A-tailed and ligated to half-functional adapters, incorporating a 8-nt random molecular index. Two rounds of nested anchored PCR were used for target enrichment. PCR products were pooled in one Illumina MiSeq sequencing run with paired-end reads at 300 cycles, producing 18,363,596 reads of 150 bp length each read pair. DNA sequences with a quality score below 25 (Phred scale) were removed. Flexbar (Roehr et al., 2017) was used to trim the sequences of the Illumina adapters from sequencing reads, multiplex samples (maximum allowed barcode edit distance at 1), clean reads by primer in R1 (ATCACCGACTGCCCATAGAGAGGACTCCAGTCAC) and R2 (AGATCGGAAGAGCGTCGTGTAGGGAAAGAGTGT) and identify unique molecular identifiers (UMI) of 8 nucleotides. Sequences were aligned on human reference genome (hg19/GRCh37) using Bowtie2 (Langmead and Salzberg, 2012) configured with the highest accuracy (–local–very-sensitive-local). To call off-targets we used the pipeline for GUIDE-seq data published in (Zhu et al., 2017) with the following parameters: peak span up/down-stream of 20 bp, PAM size of 3, max allowed mismatches at 2 or 3, allowed.mismatch.PAM = 2, PAM = “NGG,” PAM.pattern = “(NAG|NGG|NGA)$.” The minimum read coverage for peak calling has been set to 15 reads.
Mutational Analysis
For target sequencing of a portion of the cassette inserted at the site of HDR, total DNA was isolated using QIAamp DNA Micro Kit (QIAGEN), according to the manufacturer’s instruction. Libraries were generated by one-step PCR using PfuUltra II Fusion HS DNA Polymerase (Agilent Technologies). Forward and reverse primers were designed to amplify 294 bp within the codon-usage optimized IL2RG corrective cDNA and endowed with tails containing P5/P7 sequence, i5/i7 Illumina tag to allow multiplexed sequencing and R1/R2 primer complementary sequence (see Table S3). PCR library amplicons were separately purified using MinElute PCR Purification kit (QIAGEN) and quality assessed by Agilent Tapestation (Agilent Technologies). PCR products were pooled in one Illumina MiSeq sequencing run with paired-end reads at 300 cycles, producing a median of 495,000 reads/sample of 150 bp length. After quality controls, reads were aligned to the human genome GRCh38 using bwa-mem with default parameters. After removing duplicates using Picard, we computed for all the positions the read count for each nucleotide. We considered the regions outside the TCA patterns to estimate the background error rate and we compared this background error to the C to T transition frequency for all the TCA patterns in the sequences, to verify possible increments in the mutation rate. To compare different samples, we normalized the count of mutated reads in a variation rate per Million reads. Then, we performed a per base analysis, using a two-way ANOVA with Tukey’s multiple comparison post-test and Bonferroni’s correction, to identify possible increments in specific variations.
For the mutational analyses of a panel of cancer-associated genes, total DNA was isolated using QIAamp DNA Micro Kit (QIAGEN), according to the manufacturer’s instructions and purified with AMPure Beads. DNA was quantified with The Qubit 2.0 Fluorometer (ThermoFisher) and its quality was assessed by Agilent Tapestation (Agilent Technologies). Minimum quality was defined as DNA integrity number (RIN) > 7. 30 ng of total DNA were used for library preparation with SureSelectQXT Target Enrichment for Illumina Multiplexed Sequencing (Agilent Technologies). DNA library amplicons were then hybridized with ClearSeq Comprehensive Cancer library, a panel of 151 disease-associated genes and the final enriched library was sequenced on a NextSeq 500 (Illumina) with 1000X coverage. After quality controls, reads were aligned to the human genome GRCh38 using bwa-mem with default parameters. After removing duplicates using Picard, somatic short variants were called using MuTect2 from the GATK4 suite. According to the suggested protocol, we created a somatic background combining data from all the donors, the so-called Panel of Normals, for each condition. Then, we performed the variant calling comparing case and control samples from the same donor, using all the possible combinations of experimental conditions. We used as background both the Panel of Normals, corresponding to the control sample, and the germline data of the Exome Aggregation Consortium. The analysis was limited to the regions specified in the panel, in order to avoid off-target calls, and results were filtered taking into account cross-contaminations. Variant annotations were performed using SnpEff, using the hg38 annotation database provided with the package, in order to annotate the type (missense, synonymous, frame_shift, etc.) and position of variant (upstream_gene_variant, intron_variant, exon_variant, downstream_gene_variant), the possible impact, and all the information about the corresponding gene. Circos plots were generated by the ‘circlize’ R package to display on a circular layout the genomic positions of both substitutions and small indels (inner circle) for each dataset. Significance was tested using a two-way ANOVA with Tukey’s multiple comparison post-test and Bonferroni’s correction.
Immunofluorescence Analysis
Multitest slides (10 well, MP Biomedicals) were treated for 20’ with Poly-L-lysine solution (Sigma-Aldrich) at 1mg/ml concentration. After two washes with DPBS solution, approximately 0.5/1x105 cells were seeded on covers for 20’ and fixed with 4% paraformaldehyde (Santa Cruz Biotechnology) for other 20’. Cells were then permeabilized with 0.1% Triton X-100. After blocking with 0.5% BSA and 0.2% fish gelatin in DPBS, cells were probed with the indicated primary antibodies. After primary antibodies incubation (53BP1 Antibody, Bethyl Laboratories; Anti-phospho Histone H2A.X (Ser139) Antibody, clone JBW301, Merck), cells were washed three times with DPBS and incubate with Alexa 488-, 568- and/or 647-labeled secondary antibodies (Invitrogen). Nuclear DNA was stained with DAPI at 0.2 μg/ml concentration (Sigma-Aldrich) and covers were mounted with Aqua-Poly/Mount solution (Polysciences. Inc.) on glass slides (Bio-Optica). Fluorescent images were acquired using Leica SP2 and Leica SP5 Confocal microscopes. Quantification of DDR foci in immunofluorescence images was conducted using Cell Profiler (version 2.1.1, revision 6c2d896) in Figures 1D and 4G.
Karyotype Analysis
Edited HSPC treated or not with GSE56 and electroporated controls were incubated overnight with 0.1μg/ml of mitotic inhibitor Colcemid (KaryoMAX Colcemid Solution in PBS Life Technologies, Carlsbad, CA, 10 μg/ml), thereafter incubated in 1% hypotonic solution (Sodium Citrate tribasic dihydrate), and then fixed with Carnoy’s fixative (3:1 methanol to acetic acid).
Metaphase spreads were aged at room temperature for 5 days and G-banding were performed following standard methods with a few modifications: slides were incubated in Soerrensen buffer at room temperature for 2 minutes, followed by 2 minutes in Wright stain solution (0.5ml Wright stain and 1.5 mL of Soerrensen buffer). A total of 157 metaphase spreads from three independent HSPC donors and editing experiments were analyzed with an Olympus BX51 microscope coupled to a charge-coupled device camera COHU 4912 (Olympus, Milan, Italy). Captured images were analyzed using MaKtype software (PowerGene, Olympus).
Live imaging analysis of confluence
IncuCyte (Essen Biosciences) was used to quantify confluence in live cells. 3x10⁴ cells for each condition were plated in a 96-multiwell, kept in fixed positions in humidified thermostatic chamber and images were acquired each 15’ up to 4 days post treatment. The confluence processing analysis tool (IncuCyte Software S3 v2018A) calculated confluence for each sample. Quantification of the cellular confluence of each condition was assessed by Log2 fold change to first time point.
Cell cycle phases analysis by EdU/ Hoechst staining
EdU (5-ethynyl-2′-deoxyuridine), supplied with Click-iT EdU Alexa Fluor 647 Imaging Kit (#C10424, Thermo-Fisher Scientific, Waltham, MA, USA), was diluted in DMSO to a final concentration of 10 mM and kept at −20°C. 0.5-1x10⁵ cells were treated with 2μM EdU for 4 hours in culture. Cells (approx. 0,5-1 × 10⁵ cells) were washed with 3 mL of 1% BSA in PBS and fixed with 100 μL of Click-iT fixative for 15 min. Cells were washed again with 3 mL of 1% BSA in PBS and permeabilized with 100 μL of 1X Click-iT saponin-based permeabilization for 15 min. Detection of EdU-DNA was performed by incubating cells with 500 μL of Click-iT Plus reaction cocktail for 30 min at RT protected from light. Cells were subsequently washed with 3 mL of 1% BSA in PBS before staining of DNA with Hoechst for 1h at RT protected from light and immediately after their fluorescence was measured by flow cytometry.
Immuno-DNA FISH (IF-DNA FISH)
3D combined immunofluorescence-DNA FISH for 53BP1 and the IL2RG locus were carried out on human HSPC adhered to poly-L lysine-coated slides, as previously described with some modifications (Chaumeil et al., 2013b). Briefly, cells were fixed with 3% paraformaldehyde/1X PBS (pH 7–7.4) for 15 min at room temperature (RT) and permeabilized for 5min with 0.5% Triton X-100/PBS on ice. After 30 min of blocking in 2.5% BSA/10% normal goat serum/1X PBS, cells were sequentially incubated with a primary antibody against 53BP1 (1/500, Novus Biologicals, #NB100-304) and a secondary goat-anti-rabbit antibody (1/1000, GAR-Alexa Fluor 488; Life technologies) for 1h each at RT. Cells were then post-fixed in 2% paraformaldehyde/ 1X PBS for 10 min at RT and permeabilized in 0.7% Triton X-100/ 0.1M HCl for 10min on ice. Cells and probe were then denatured simultaneously on a hot plate at 75°C for 4min and hybridized overnight 37°C in a dark and humid chamber. The next day, cells were rinsed three times in 50% formamide/2X SSC and three times in 2X SSC at 37°C for 5min each. Finally, slides were stained with DAPI and mounted in ProLong Gold mounting medium (Life technologies). More than 80 53BP1-positive nuclei were analyzed for each condition. 3D image acquisition was performed using a Delta Vision microscope (Applied Precision) with a 40x objective and a z-step of 200nm. Image analysis was performed using the ImageJ software and figures were mounted as either single z-plane or maximum projection images of few z-planes.
DNA FISH Probes
The CTD-3090M11 (IL2RG; 96012-3090M11) and RP11-1137P1 (TLR7/TLR8; RPCI11.C-1137P1) BAC probes covering around 200Kb of either the Xq13.1 genomic region containing the IL2RG locus or the Xp22.2 containing the TLR7/TLR8 genes respectively (Life technologies), were directly labeled by nick translation (Vysis) with Aminoallyl-dUTP-ATTO-550 or −647 (Jena Bioscience) following manufacturer’s instructions (Vysis). For one slide (24mmx40mm area), 1μg of each labeled DNA were precipitated with 5μg of human Cot-1 DNA (Life technologies) and 10μg of Salmon sperm and resuspended in 40μl of hybridization buffer (50% Formamide, 10% Dextran sulfate, 2mg/ml BSA (NEB), 2X SSC).
Chromosome paint DNA FISH
Chromosome paint DNA FISH was performed as provided by the manufacturer (Xcyting chromosome paints, MetaSystems Probes). Briefly, a mix of 5 μL of each chromosome paint (human chromosomes 19 and X, labeled with orange and green emitting fluorophores respectively) was applied on the metaphase spreads onto a slide and covered with coverslip. Cells and probes were then simultaneously denatured on a hot plate at 75°C for 2min and hybridized overnight at 37°C in a dark and humid chamber. Washing steps after hybridization included a 2min wash at 72°C in 0.4X SSC (pH 7.0-7.5) buffer, and then a 30sec wash in 2X SSC/0.05% Tween-20 (pH 7.0) at RT. Slides were then rinsed briefly in distilled water (to avoid crystal formation), air-dried and mounted with a mix of 90% Metasystem DAPI/Antifade (MetaSystems Probes) and 10% of Prolong Gold anti-fade reagent with DAPI (Life technologies). 3D-image stacks were acquired using either a Metafer system (Slide scanning platform provided by MetaSystems with a 40X objective) or an Olympus BX63F microscope with a Hamamatsu ORCA-Flash4.0 LT C11440-42U fluorescent camera and a 40X objective (z-step = 400nm). Maximum projection images were performed with the Isis image acquisition system (MetaSystems) or the ImageJ software, respectively. 40-100 metaphases were analyzed for each sample.
Quantification and Statistical Analysis
Data were expressed as means ± SEM or dot plots with median values indicated as a line. Inferential techniques were carried out whenever appropriate sample size was available, otherwise descriptive statistics are reported. Percentage values were transformed into a log-odds scale to perform parametric statistical analyses. Assumptions for the correct application of standard parametric procedures were checked (e.g., normality of the data). t test for paired data was applied to compare dependent observations. For mutational analysis significance was tested using a two-way ANOVA with Tukey’s multiple comparison post-test and Bonferroni’s correction. Growth curves and cell cycle analyses were analyzed using linear mixed-effects models (Pinheiro and Bates, 2000) which account for longitudinal course and inclusion of additional random-effect terms, thus considering sources of heterogeneity among experimental units. Treatment group indicator and time variable, along with their interaction, were included as covariates in the model to identify potential differences in growth dynamics of treatment groups. Logarithmic logit or cubic transformations were used to linearize the relationship between the outcome and the dependent variables. LME were estimated in R (version 3.5.1) by means of the nlme package, while the lsmeans package was used to perform the post hoc analysis and compute all pairwise comparisons of treatment groups at a fixed time point. Adjusted p-values using Bonferroni’s correction are also reported.
Whenever these assumptions were not met, nonparametric statistical tests were performed. In particular, Mann-Whitney test was performed to compare two independent groups. In presence of more than two independent groups, Kruskal-Wallis test was performed, followed by post hoc pairwise comparisons. This strategy was applied also to analyze growth curves when the interest was in differences among groups at specific time points. For paired observations, Wilcoxon matched-pairs signed rank test was performed. For the analysis of repeated-measures data, a robust rank-based method for the analysis of longitudinal data in factorial designs (nparLD procedure developed in R by Noguchi et al., 2012) were used as indicated. For gene expression data, analyses were performed on 2(- ΔCT) values relative to housekeeping gene (GUSB or HPRT). Spearman’s correlation coefficient was calculated to evaluate the presence of a monotonic relationship between two variables. Statistical analysis for immune-DNA FISH were performed using χ2 test as in (Chaumeil et al., 2013a).
Analyses were performed using GraphPad Prism v8 and R statistical software. Differences were considered statistically significant at ∗p < 0.05, ∗∗p < 0.01, ∗∗∗p < 0.001, ∗∗∗∗p < 0.0001, ‘‘ns’’ represents non significance.
Data and Software Availability
The RNA-seq and Mutational Analysis data from this study have been deposited in the NCBI Gene Expression Omnibus (GEO) under accession numbers GEO: GSE119597. All softwares used were freely or commercially available.
Acknowledgments
We thank the Naldini and Di Micco laboratories for discussion; the FRACTAL and ALEMBIC facilities; C. Di Serio and F. Cugnata (CUSSB, Vita-Salute San Raffaele University) for assistance with statistical analyses; M. Bianchi and A. Agresti for providing access to SP5 microscope; M. Holmes, A. Conway, and G. Lee (Sangamo Therapeutics) for sharing ZFN reagents and critical reading of the manuscript; D. Lazarevic, F. Simeoni, and S. Bonfiglio of CTGB for help with library preparation; A. Auricchio and M. Doria (TIGEM) for providing AAV6 vectors; L. Basso-Ricci and V. Gambacorta for help with LSRFortessa; C. Lescale and L. Deriano (Institut Pasteur, Paris) for help with Metafer microscope; the PICT-IBiSA@BDD (Institut Curie, Paris; member of the French-BioImaging National Research Infrastructure (ANR-10-INBS-04)); in particular A. Dauphin, O. Leroy, O. Renaud, and the IMAG’IC facility (Institut Cochin, Paris) for imaging experiments; and A. Lombardo, R. Ostuni, A. Kajaste-Rudnitski, and S. Francia for critical reading of the manuscript. This work was supported by grants to P. Genovese from Telethon (TIGET grant E3 2016) and the Italian Ministry of Health (GR-2013-02358956); to L.N. from Telethon (TIGET grant E1 2016) and the Italian Ministry of Health (NET-2011-02350069); and to R.D.M. from Telethon (TIGET grant E5 2016), San Raffaele Hospital (Pilot and Seed Grant), and Human Frontier Science Program (HFSP) Long-Term/Cross-Disciplinary Fellowship. J.C. is supported by an ATIP-Avenir program C16002KS (INSERM/CNRS) and the French Cancer Research Association R17016KK (ARC foundation). L.d.V., S.F., and V.V. conducted this study as partial fulfillment of their international Ph.D.s in Molecular Medicine, Vita-Salute San Raffaele University. A.J. conducted this study as partial fulfillment of his Ph.D. in Translational and Molecular Medicine - DIMET, Bicocca University. G.S. was supported by a fellowship from Fondazione Caligara. A. Conti was supported by a FIRC-AIRC fellowship for Italy.
Author Contributions
G.S. and A. Conti performed research, interpreted data, and wrote the manuscript; S.F., L.d.V. and A.J., performed research and interpreted data; L.A. provided technical help with mouse experiments; V.V. performed guide-seq experiments and A. Calabria and E.M. analyzed guide-seq datasets; P. Gasparini performed karyotype analysis; J.C. and D.N.-L. performed the IF-DNA FISH and J.C. analyzed the data; and E.S. and D.N.-L. performed chromosome paint DNA FISH and E.S. analyzed the data. G.S., S.F., S.B., and I.M. performed bioinformatic analysis on scRNA-seq; S.B. and I.M. performed all remaining bioinformatic analyses; C.B. performed statistical analyses; and P. Genovese, L.N., and R.D.M. designed the study, interpreted data, supervised research, and wrote the manuscript.
Declaration of Interests
L.N. received funding from Editas Medicine for a different collaborative gene-editing project. L.N. is member of the scientific advisory board of Sangamo Therapeutics. L.N. and P. Genovese are inventors of patents on applications of gene editing in HSPCs owned and managed by the San Raffaele Scientific Institute and the Telethon Foundation, including a patent application on the use of p53 inhibitor in gene editing recently filed by G.S., A.J., P. Genovese, and L.N. All other authors declare no conflict of interests.
Published: March 21, 2019
Footnotes
Supplemental Information can be found with this article online at https://doi.org/10.1016/j.stem.2019.02.019.
Contributor Information
Pietro Genovese, Email: genovese.pietro@hsr.it.
Luigi Naldini, Email: naldini.luigi@hsr.it.
Raffaella Di Micco, Email: dimicco.raffaella@hsr.it.
Supplemental Information
(A) GuideSeq (separate Excel file, first sheet). Full list of identified off-targets by Guide-seq in K562 cells edited with AAVS1 HS, IL2RG HS and LS RNP. (B) Top markers of the identified heatmaps (separate Excel file, second sheet). List of genes (from top to bottom) of the heatmap showed in Figures S2B, S2G, and 3C.
List of DEGs in primitive and progenitor subpopulations upon ZFN-mediated editing at IL2RG and AAVS1 target sites.
List of variants identified in HSPC edited in presence or absence of GSE56 from 3 independent donors.
References
- Beerman I., Seita J., Inlay M.A., Weissman I.L., Rossi D.J. Quiescent hematopoietic stem cells accumulate DNA damage during aging that is repaired upon entry into cell cycle. Cell Stem Cell. 2014;15:37–50. doi: 10.1016/j.stem.2014.04.016. [DOI] [PMC free article] [PubMed] [Google Scholar]
- Biechonski S., Olender L., Zipin-Roitman A., Yassin M., Aqaqe N., Marcu-Malina V., Rall-Scharpf M., Trottier M., Meyn M.S., Wiesmüller L. Attenuated DNA damage responses and increased apoptosis characterize human hematopoietic stem cells exposed to irradiation. Sci. Rep. 2018;8:6071. doi: 10.1038/s41598-018-24440-w. [DOI] [PMC free article] [PubMed] [Google Scholar]
- Bothmer A., Phadke T., Barrera L.A., Margulies C.M., Lee C.S., Buquicchio F., Moss S., Abdulkerim H.S., Selleck W., Jayaram H. Characterization of the interplay between DNA repair and CRISPR/Cas9-induced DNA lesions at an endogenous locus. Nat. Commun. 2017;8:13905. doi: 10.1038/ncomms13905. [DOI] [PMC free article] [PubMed] [Google Scholar]
- Brinkman E.K., Kousholt A.N., Harmsen T., Leemans C., Chen T., Jonkers J., van Steensel B. Easy quantification of template-directed CRISPR/Cas9 editing. Nucleic Acids Res. 2018;46:e58. doi: 10.1093/nar/gky164. [DOI] [PMC free article] [PubMed] [Google Scholar]
- Butler A., Hoffman P., Smibert P., Papalexi E., Satija R. Integrating single-cell transcriptomic data across different conditions, technologies, and species. Nat. Biotechnol. 2018;36:411–420. doi: 10.1038/nbt.4096. [DOI] [PMC free article] [PubMed] [Google Scholar]
- Chaumeil J., Micsinai M., Ntziachristos P., Deriano L., Wang J.M., Ji Y., Nora E.P., Rodesch M.J., Jeddeloh J.A., Aifantis I. Higher-order looping and nuclear organization of Tcra facilitate targeted rag cleavage and regulated rearrangement in recombination centers. Cell Rep. 2013;3:359–370. doi: 10.1016/j.celrep.2013.01.024. [DOI] [PMC free article] [PubMed] [Google Scholar]
- Chaumeil J., Micsinai M., Skok J.A. Combined immunofluorescence and DNA FISH on 3D-preserved interphase nuclei to study changes in 3D nuclear organization. J Vis Exp. 2013;72:e50087. doi: 10.3791/50087. [DOI] [PMC free article] [PubMed] [Google Scholar]
- Ciccia A., Elledge S.J. The DNA damage response: making it safe to play with knives. Mol. Cell. 2010;40:179–204. doi: 10.1016/j.molcel.2010.09.019. [DOI] [PMC free article] [PubMed] [Google Scholar]
- Conti A., Di Micco R. p53 activation: a checkpoint for precision genome editing? Genome Med. 2018;10:66. doi: 10.1186/s13073-018-0578-6. [DOI] [PMC free article] [PubMed] [Google Scholar]
- Copelan E.A. Hematopoietic stem-cell transplantation. N. Engl. J. Med. 2006;354:1813–1826. doi: 10.1056/NEJMra052638. [DOI] [PubMed] [Google Scholar]
- Cornu T.I., Mussolino C., Cathomen T. Refining strategies to translate genome editing to the clinic. Nat. Med. 2017;23:415–423. doi: 10.1038/nm.4313. [DOI] [PubMed] [Google Scholar]
- De Ravin S.S., Reik A., Liu P.Q., Li L., Wu X., Su L., Raley C., Theobald N., Choi U., Song A.H. Targeted gene addition in human CD34(+) hematopoietic cells for correction of X-linked chronic granulomatous disease. Nat. Biotechnol. 2016;34:424–429. doi: 10.1038/nbt.3513. [DOI] [PMC free article] [PubMed] [Google Scholar]
- Dever D.P., Porteus M.H. The changing landscape of gene editing in hematopoietic stem cells: a step towards Cas9 clinical translation. Curr. Opin. Hematol. 2017;24:481–488. doi: 10.1097/MOH.0000000000000385. [DOI] [PMC free article] [PubMed] [Google Scholar]
- Dever D.P., Bak R.O., Reinisch A., Camarena J., Washington G., Nicolas C.E., Pavel-Dinu M., Saxena N., Wilkens A.B., Mantri S. CRISPR/Cas9 β-globin gene targeting in human haematopoietic stem cells. Nature. 2016;539:384–389. doi: 10.1038/nature20134. [DOI] [PMC free article] [PubMed] [Google Scholar]
- Di Micco R. Sensing the breaks: cytosolic chromatin in senescence and cancer. Trends Mol. Med. 2017;23:1067–1070. doi: 10.1016/j.molmed.2017.10.009. [DOI] [PubMed] [Google Scholar]
- Di Micco R., Fumagalli M., Cicalese A., Piccinin S., Gasparini P., Luise C., Schurra C., Garre’ M., Nuciforo P.G., Bensimon A. Oncogene-induced senescence is a DNA damage response triggered by DNA hyper-replication. Nature. 2006;444:638–642. doi: 10.1038/nature05327. [DOI] [PubMed] [Google Scholar]
- Doudna J.A., Charpentier E. Genome editing. The new frontier of genome engineering with CRISPR-Cas9. Science. 2014;346:1258096. doi: 10.1126/science.1258096. [DOI] [PubMed] [Google Scholar]
- Doulatov S., Notta F., Laurenti E., Dick J.E. Hematopoiesis: a human perspective. Cell Stem Cell. 2012;10:120–136. doi: 10.1016/j.stem.2012.01.006. [DOI] [PubMed] [Google Scholar]
- Doulatov S., Vo L.T., Chou S.S., Kim P.G., Arora N., Li H., Hadland B.K., Bernstein I.D., Collins J.J., Zon L.I., Daley G.Q. Induction of multipotential hematopoietic progenitors from human pluripotent stem cells via respecification of lineage-restricted precursors. Cell Stem Cell. 2013;13:459–470. doi: 10.1016/j.stem.2013.09.002. [DOI] [PMC free article] [PubMed] [Google Scholar]
- Fang L., Choudhary S., Zhao Y., Edeh C.B., Yang C., Boldogh I., Brasier A.R. ATM regulates NF-κB-dependent immediate-early genes via RelA Ser 276 phosphorylation coupled to CDK9 promoter recruitment. Nucleic Acids Res. 2014;42:8416–8432. doi: 10.1093/nar/gku529. [DOI] [PMC free article] [PubMed] [Google Scholar]
- Fares I., Chagraoui J., Lehnertz B., MacRae T., Mayotte N., Tomellini E., Aubert L., Roux P.P., Sauvageau G. EPCR expression marks UM171-expanded CD34+ cord blood stem cells. Blood. 2017;129:3344–3351. doi: 10.1182/blood-2016-11-750729. [DOI] [PubMed] [Google Scholar]
- Finak G., McDavid A., Yajima M., Deng J., Gersuk V., Shalek A.K., Slichter C.K., Miller H.W., McElrath M.J., Prlic M. MAST: a flexible statistical framework for assessing transcriptional changes and characterizing heterogeneity in single-cell RNA sequencing data. Genome Biol. 2015;16:278. doi: 10.1186/s13059-015-0844-5. [DOI] [PMC free article] [PubMed] [Google Scholar]
- Fischer M. Census and evaluation of p53 target genes. Oncogene. 2017;36:3943–3956. doi: 10.1038/onc.2016.502. [DOI] [PMC free article] [PubMed] [Google Scholar]
- Flach J., Bakker S.T., Mohrin M., Conroy P.C., Pietras E.M., Reynaud D., Alvarez S., Diolaiti M.E., Ugarte F., Forsberg E.C. Replication stress is a potent driver of functional decline in ageing haematopoietic stem cells. Nature. 2014;512:198–202. doi: 10.1038/nature13619. [DOI] [PMC free article] [PubMed] [Google Scholar]
- Garaycoechea J.I., Crossan G.P., Langevin F., Mulderrig L., Louzada S., Yang F., Guilbaud G., Park N., Roerink S., Nik-Zainal S. Alcohol and endogenous aldehydes damage chromosomes and mutate stem cells. Nature. 2018;553:171–177. doi: 10.1038/nature25154. [DOI] [PMC free article] [PubMed] [Google Scholar]
- Genovese P., Schiroli G., Escobar G., Tomaso T.D., Firrito C., Calabria A., Moi D., Mazzieri R., Bonini C., Holmes M.C. Targeted genome editing in human repopulating haematopoietic stem cells. Nature. 2014;510:235–240. doi: 10.1038/nature13420. [DOI] [PMC free article] [PubMed] [Google Scholar]
- Haapaniemi E., Botla S., Persson J., Schmierer B., Taipale J. CRISPR-Cas9 genome editing induces a p53-mediated DNA damage response. Nat. Med. 2018;24:927–930. doi: 10.1038/s41591-018-0049-z. [DOI] [PubMed] [Google Scholar]
- Halenius A., Gerke C., Hengel H. Classical and non-classical MHC I molecule manipulation by human cytomegalovirus: so many targets—but how many arrows in the quiver? Cell. Mol. Immunol. 2015;12:139–153. doi: 10.1038/cmi.2014.105. [DOI] [PMC free article] [PubMed] [Google Scholar]
- Hendel A., Bak R.O., Clark J.T., Kennedy A.B., Ryan D.E., Roy S., Steinfeld I., Lunstad B.D., Kaiser R.J., Wilkens A.B. Chemically modified guide RNAs enhance CRISPR-Cas genome editing in human primary cells. Nat. Biotechnol. 2015;33:985–989. doi: 10.1038/nbt.3290. [DOI] [PMC free article] [PubMed] [Google Scholar]
- Hsu P.D., Scott D.A., Weinstein J.A., Ran F.A., Konermann S., Agarwala V., Li Y., Fine E.J., Wu X., Shalem O. DNA targeting specificity of RNA-guided Cas9 nucleases. Nat. Biotechnol. 2013;31:827–832. doi: 10.1038/nbt.2647. [DOI] [PMC free article] [PubMed] [Google Scholar]
- Iacovoni J.S., Caron P., Lassadi I., Nicolas E., Massip L., Trouche D., Legube G. High-resolution profiling of gammaH2AX around DNA double strand breaks in the mammalian genome. EMBO J. 2010;29:1446–1457. doi: 10.1038/emboj.2010.38. [DOI] [PMC free article] [PubMed] [Google Scholar]
- Iannelli F., Galbiati A., Capozzo I., Nguyen Q., Magnuson B., Michelini F., D’Alessandro G., Cabrini M., Roncador M., Francia S. A damaged genome’s transcriptional landscape through multilayered expression profiling around in situ-mapped DNA double-strand breaks. Nat. Commun. 2017;8:15656. doi: 10.1038/ncomms15656. [DOI] [PMC free article] [PubMed] [Google Scholar]
- Ihry R.J., Worringer K.A., Salick M.R., Frias E., Ho D., Theriault K., Kommineni S., Chen J., Sondey M., Ye C. p53 inhibits CRISPR-Cas9 engineering in human pluripotent stem cells. Nat. Med. 2018;24:939–946. doi: 10.1038/s41591-018-0050-6. [DOI] [PubMed] [Google Scholar]
- Karikó K., Muramatsu H., Ludwig J., Weissman D. Generating the optimal mRNA for therapy: HPLC purification eliminates immune activation and improves translation of nucleoside-modified, protein-encoding mRNA. Nucleic Acids Res. 2011;39:e142. doi: 10.1093/nar/gkr695. [DOI] [PMC free article] [PubMed] [Google Scholar]
- Kim H., Kim J.S. A guide to genome engineering with programmable nucleases. Nat. Rev. Genet. 2014;15:321–334. doi: 10.1038/nrg3686. [DOI] [PubMed] [Google Scholar]
- Langmead B., Salzberg S.L. Fast gapped-read alignment with Bowtie 2. Nat. Methods. 2012;9:357–359. doi: 10.1038/nmeth.1923. [DOI] [PMC free article] [PubMed] [Google Scholar]
- Lombardo A., Cesana D., Genovese P., Di Stefano B., Provasi E., Colombo D.F., Neri M., Magnani Z., Cantore A., Lo Riso P. Site-specific integration and tailoring of cassette design for sustainable gene transfer. Nat. Methods. 2011;8:861–869. doi: 10.1038/nmeth.1674. [DOI] [PubMed] [Google Scholar]
- Martins C.P., Brown-Swigart L., Evan G.I. Modeling the therapeutic efficacy of p53 restoration in tumors. Cell. 2006;127:1323–1334. doi: 10.1016/j.cell.2006.12.007. [DOI] [PubMed] [Google Scholar]
- Millour J., de Olano N., Horimoto Y., Monteiro L.J., Langer J.K., Aligue R., Hajji N., Lam E.W. ATM and p53 regulate FOXM1 expression via E2F in breast cancer epirubicin treatment and resistance. Mol. Cancer Ther. 2011;10:1046–1058. doi: 10.1158/1535-7163.MCT-11-0024. [DOI] [PMC free article] [PubMed] [Google Scholar]
- Milyavsky M., Gan O.I., Trottier M., Komosa M., Tabach O., Notta F., Lechman E., Hermans K.G., Eppert K., Konovalova Z. A distinctive DNA damage response in human hematopoietic stem cells reveals an apoptosis-independent role for p53 in self-renewal. Cell Stem Cell. 2010;7:186–197. doi: 10.1016/j.stem.2010.05.016. [DOI] [PubMed] [Google Scholar]
- Mohrin M., Bourke E., Alexander D., Warr M.R., Barry-Holson K., Le Beau M.M., Morrison C.G., Passegué E. Hematopoietic stem cell quiescence promotes error-prone DNA repair and mutagenesis. Cell Stem Cell. 2010;7:174–185. doi: 10.1016/j.stem.2010.06.014. [DOI] [PMC free article] [PubMed] [Google Scholar]
- Naldini L. Genetic engineering of hematopoiesis: current stage of clinical translation and future perspectives. EMBO Mol. Med. 2019 doi: 10.15252/emmm.201809958. Published online January 22, 2019. [DOI] [PMC free article] [PubMed] [Google Scholar]
- Nestorowa S., Hamey F.K., Pijuan Sala B., Diamanti E., Shepherd M., Laurenti E., Wilson N.K., Kent D.G., Göttgens B. A single-cell resolution map of mouse hematopoietic stem and progenitor cell differentiation. Blood. 2016;128:e20–e31. doi: 10.1182/blood-2016-05-716480. [DOI] [PMC free article] [PubMed] [Google Scholar]
- Noguchi K., Gel Y.R., Brunner E., Konietschke F. nparLD: An R Software Package for the Nonparametric Analysis of Longitudinal Data in Factorial Experiments. Journal of Statistical Software. 2012;50 https://www.jstatsoft.org/article/view/v050i12.other [Google Scholar]
- Pinheiro J.C., Bates D.M. Linear mixed-effects models: basic concepts and examples. In: Chambers J., Eddy W., editors. Mixed-effects models in S and S-Plus. Springer; 2000. pp. 3–56. [Google Scholar]
- Piras F., Riba M., Petrillo C., Lazarevic D., Cuccovillo I., Bartolaccini S., Stupka E., Gentner B., Cittaro D., Naldini L., Kajaste-Rudnitski A. Lentiviral vectors escape innate sensing but trigger p53 in human hematopoietic stem and progenitor cells. EMBO Mol. Med. 2017;9:1198–1211. doi: 10.15252/emmm.201707922. [DOI] [PMC free article] [PubMed] [Google Scholar]
- Polo S.E., Jackson S.P. Dynamics of DNA damage response proteins at DNA breaks: a focus on protein modifications. Genes Dev. 2011;25:409–433. doi: 10.1101/gad.2021311. [DOI] [PMC free article] [PubMed] [Google Scholar]
- Richardson C.D., Ray G.J., DeWitt M.A., Curie G.L., Corn J.E. Enhancing homology-directed genome editing by catalytically active and inactive CRISPR-Cas9 using asymmetric donor DNA. Nat. Biotechnol. 2016;34:339–344. doi: 10.1038/nbt.3481. [DOI] [PubMed] [Google Scholar]
- Roehr J.T., Dieterich C., Reinert K. Flexbar 3.0 - SIMD and multicore parallelization. Bioinformatics. 2017;33:2941–2942. doi: 10.1093/bioinformatics/btx330. [DOI] [PubMed] [Google Scholar]
- Rose J.C., Stephany J.J., Valente W.J., Trevillian B.M., Dang H.V., Bielas J.H., Maly D.J., Fowler D.M. Rapidly inducible Cas9 and DSB-ddPCR to probe editing kinetics. Nat. Methods. 2017;14:891–896. doi: 10.1038/nmeth.4368. [DOI] [PMC free article] [PubMed] [Google Scholar]
- Schiroli G., Ferrari S., Conway A., Jacob A., Capo V., Albano L., Plati T., Castiello M.C., Sanvito F., Gennery A.R. Preclinical modeling highlights the therapeutic potential of hematopoietic stem cell gene editing for correction of SCID-X1. Sci. Transl. Med. 2017;9:eaan0820. doi: 10.1126/scitranslmed.aan0820. [DOI] [PubMed] [Google Scholar]
- Schwartz R.A., Palacios J.A., Cassell G.D., Adam S., Giacca M., Weitzman M.D. The Mre11/Rad50/Nbs1 complex limits adeno-associated virus transduction and replication. J. Virol. 2007;81:12936–12945. doi: 10.1128/JVI.01523-07. [DOI] [PMC free article] [PubMed] [Google Scholar]
- Tsai S.Q., Joung J.K. Defining and improving the genome-wide specificities of CRISPR-Cas9 nucleases. Nat. Rev. Genet. 2016;17:300–312. doi: 10.1038/nrg.2016.28. [DOI] [PMC free article] [PubMed] [Google Scholar]
- Tsai S.Q., Zheng Z., Nguyen N.T., Liebers M., Topkar V.V., Thapar V., Wyvekens N., Khayter C., Iafrate A.J., Le L.P. GUIDE-seq enables genome-wide profiling of off-target cleavage by CRISPR-Cas nucleases. Nat. Biotechnol. 2015;33:187–197. doi: 10.1038/nbt.3117. [DOI] [PMC free article] [PubMed] [Google Scholar]
- Velten L., Haas S.F., Raffel S., Blaszkiewicz S., Islam S., Hennig B.P., Hirche C., Lutz C., Buss E.C., Nowak D. Human haematopoietic stem cell lineage commitment is a continuous process. Nat. Cell Biol. 2017;19:271–281. doi: 10.1038/ncb3493. [DOI] [PMC free article] [PubMed] [Google Scholar]
- Wang J., Exline C.M., DeClercq J.J., Llewellyn G.N., Hayward S.B., Li P.W., Shivak D.A., Surosky R.T., Gregory P.D., Holmes M.C., Cannon P.M. Homology-driven genome editing in hematopoietic stem and progenitor cells using ZFN mRNA and AAV6 donors. Nat. Biotechnol. 2015;33:1256–1263. doi: 10.1038/nbt.3408. [DOI] [PMC free article] [PubMed] [Google Scholar]
- Zeller K.I., Jegga A.G., Aronow B.J., O’Donnell K.A., Dang C.V. An integrated database of genes responsive to the Myc oncogenic transcription factor: identification of direct genomic targets. Genome Biol. 2003;4:R69. doi: 10.1186/gb-2003-4-10-r69. [DOI] [PMC free article] [PubMed] [Google Scholar]
- Zhu L.J., Lawrence M., Gupta A., Pagès H., Kucukural A., Garber M., Wolfe S.A. GUIDEseq: a bioconductor package to analyze GUIDE-seq datasets for CRISPR-Cas nucleases. BMC Genomics. 2017;18:379. doi: 10.1186/s12864-017-3746-y. [DOI] [PMC free article] [PubMed] [Google Scholar]
Associated Data
This section collects any data citations, data availability statements, or supplementary materials included in this article.
Supplementary Materials
(A) GuideSeq (separate Excel file, first sheet). Full list of identified off-targets by Guide-seq in K562 cells edited with AAVS1 HS, IL2RG HS and LS RNP. (B) Top markers of the identified heatmaps (separate Excel file, second sheet). List of genes (from top to bottom) of the heatmap showed in Figures S2B, S2G, and 3C.
List of DEGs in primitive and progenitor subpopulations upon ZFN-mediated editing at IL2RG and AAVS1 target sites.
List of variants identified in HSPC edited in presence or absence of GSE56 from 3 independent donors.
Data Availability Statement
The RNA-seq and Mutational Analysis data from this study have been deposited in the NCBI Gene Expression Omnibus (GEO) under accession numbers GEO: GSE119597. All softwares used were freely or commercially available.