Abstract
Superresolution algorithms in ultrasound imaging are attracting the interest of researchers recently due to the ability of these methods to enable enhanced vascular imaging. In this study, two superresolution imaging methods are compared for postprocessing images of microbubbles generated using passive acoustic mapping (PAM) methods with a potential application of three-dimensional (3-D) brain vascular imaging. The first method is based on fitting single bubble images one at a time with a 3-D Gaussian profile to localize the microbubbles and a superresolution image is then formed using the uncertainty of the localization as the standard deviation of the Gaussian profile. The second superresolution method is based on image deconvolution that processes multiframe resolution-limited images iteratively and estimates the intensity at each pixel of the superresolution image without the need for localizing each microbubble. The point spread function is approximated by a Gaussian curve which is similar to the beam response of the hemispherical transducer array used in our experimental setup. The Cramér–Rao Bounds of the two estimation techniques are derived analytically and the performance of these techniques is compared through numerical simulations based on experimental PAM images. For linear and sinusoidal traces, the localization errors between the estimated peaks by the fitting-based method and the actual source locations were 220 ± 10 μm and 210 ± 5 μm, respectively, as compared to 74 ± 10 μm and 59 ± 8 μm with the deconvolution-based method. However, in terms of the running time and the computational costs, the curve fitting technique outperforms the deconvolution-based approach.
Keywords: Ultrasound Medical Imaging, localization, super-resolution imaging, passive acoustic mapping, microbubbles
I. Introduction
ULTRASOUND brain vascular imaging is hindered by spatial resolution limitations arising from the need for the ultrasound to propagate through the skull bone. The poor penetration of higher frequencies through the skull bone and the aberrating effect of the heterogenous human skull limit the achievable resolution, making ultrasound imaging for brain vascular mapping a challenging problem. To improve the signal detected through the skull bone, a solution of contrast agent consisting of gas filled microbubbles can be injected to the vascular network [1]. Due to their gaseous content and high compressibility (which results in a nonlinear response) these micron-sized bubbles scatter the sound wave more efficiently resulting in higher sensitivity to the blood flow [2]. Microbubbles can also act as acoustical sources which can be localized by passive beamforming techniques [3], [4]. For ultrasound therapy purposes, the feasibility of mapping microbubble emissions through the skull bone has been demonstrated using passive acoustic mapping (PAM) [4]–[6] providing the potential for real-time therapy monitoring.
The reconstruction methods applied for PAM are categorized into either data independent delay-and-sum (DAS) beamforming or the data dependent adaptive beamformers. In the DAS approach, different time-of-flights from each transducer element to each point in the region of interest (ROI) are compensated for and then a summation is performed on all the aligned observations to form the image [3], [7]. The performance of conventional beamforming techniques like DAS is limited by the bandwidth restriction of the receivers and its performance degrades when there are coherent sources in the medium [3]. Also, DAS beamforming is independent of the second order statistics of the data. Therefore, it provides lower resolution and worse interference suppression capability as compared to data-dependent techniques like Capon beamforming [8] and Multiple Signal Classification (MUSIC) [9] methods. These adaptive beamforming techniques have been applied to cavitation mapping [10], [11], but require an estimate of the number of cavitating bubbles beforehand which is difficult in case of bubble clouds. Also, it is worth noting that one of the most common reasons for performance degradation of adaptive beamfomers is a mismatch between the presumed and the actual array responses due to imprecise knowledge of the transducer responses and locations. There are a handful of research works on improving the robustness of the adaptive beamformers [8], [12] but most of these are based on narrowband assumptions. Microbubble responses either occupy a wideband of frequencies or are centered over multiple bands, which also limits the use of the narrowband adaptive beaforming techniques and revising these methods is a must for the PAM-based imaging.
Recently, several groups have suggested ultrasound superresolution methods for microvessel imaging [13]–[20]. Some of these approaches are based on curve fitting on low resolution images of single bubbles to produce higher resolution post-processed images [13]. While other approaches in [14] and [21] are based on fitting the RF data with parallel parabolas to find their summit and then super-localize the microbubbles. Single bubbles may be isolated either using very low contrast agent concentrations [13], [16] or by capitalizing on the temporally varying signal of bubbles moving in the blood stream [14]. The former method has been used to image the vessel tree in a mouse ear [16], while the latter method has produced images of the vascular networks in rat brain [14]. In [20], a phase correlation method for motion correction of microbubbles is suggested to improve the localization accuracy. Our group integrated a 128-element hemispherical sparse receiver array (central frequency of 612 kHz) into an existing hemispherical phased array prototype of 30 cm diameter [22] for focused ultrasound therapy with simultaneous 3D cavitation mapping through ex vivo human skulls [23]. In [13], a preliminary result of using this array for 3D super-resolution mapping of a vessel phantom through human skull bone was reported. In the present study, we examine in greater depth super-resolution imaging techniques proposed in fluorescence microscopy [24]–[29]. The first set of these methods is based on switching the fluorescence of single emitters (or sparse subset of molecules) sequentially on and off either stochastically or in a targeted manner and then using a simple fitting algorithm to localize them. A super-resolution image can then be formed using numerous fluorophore positions over time [24]–[26]. We applied this method in our initial experimental study [13]. The second set of super resolution methods is based on image deconvolution that processes the multiframe fluorescence images and estimates the intensity at each pixel of the super-resolution image (i.e., an image with a pixel size finer than that of the original image) without the need for localizing individual molecules [28], [30]. In the present study, we adopt and compare both the localization and deconvolution based techniques for super-resolution PAM-based imaging. For localizing the microbubbles, curve fitting-based processing is performed using a fast Levenberg-Marquardt algorithm [31] that takes less than a fraction of a second to derive the bubble’s estimated spatial location. The deconvolution based imaging, on the other hand, processes the multiframe resolution-limited images iteratively and estimates the intensity at each pixel of the superresolution image without the need to localize each microbubble. We also present the Cramér-Rao Bounds (CRB) [32] of the two estimation techniques, which is known to be the lower bound of any unbiased estimator. The performance of these techniques is compared through extensive numerical simulations based on experimental PAM data.
II. Passive Cavitation Mapping
This section describes the conventional beamforming formulation applied to the transducer recordings in order to image the cavitating bubbles. In this model, the bubbles are assumed to be point reflectors producing the field f(rs, t) = q(t)δ(rs) due to an excitation probe sent by the transducers. The notation δ(rs) is the multidimensional Dirac delta function at point rs with a strength of q(t) that depends on the probing signal and the forward path attenuation. The emissions from these reflectors are convolved with the Green’s function of the tissue recorded by the transducers at rm, for (1 ≤ m ≤ M) and produces the following pressure field at time t′ [33].
| (1) |
where the notation ⊗ stands for convolution. With c denoting the propagation speed, the Green’s function at time t′ and at an observation point r is given as follows:
| (2) |
Let the recordings at the receivers in the frequency domain be denoted as Ym (ω) for 1 ≤ m ≤ M for M transducers which can be presented as
| (3) |
where Hm (ω) is the frequency response of transducer m, P(rm, ω) is the pressure field at the receiver m in response to the cavitating bubble field, and Nm (ω) is the observation noise. In this model, the receivers are assumed to be point transducers, however, in practice, due to the finite size of the transducer, Hm (ω) is also space dependent. In the frequency domain, the pressure Pm (ω) can be modeled as the multiplication of the Green’s function of the medium (with propagation velocity of c) and the source field generated from the bubble at location rs [3], [33]–[35]. Defining the frequency dependent near field array steering vector a(rs, ω) as
| (4) |
the emission from the source bubble at rs are recorded at the receiver locations rm for 1 ≤ m ≤ M. Then, the (M × 1) vector of received signals can be represented as
| (5) |
with y(ω) = [Y1(ω), … , YM (ω)]T, the vector n(ω) is the stack vector of all the M observation noise Nm (ω), F (rs, ω) is the frequency representation of f (rs, t) presented in (1) and the notation ⨀ is the Hadamard product of the two vectors. The (M × 1) vector h(ω) = [α(r1, ω) H1(ω), … , α(rM, ω) HM (ω)]T takes care of both the frequency dependent attenuation factor of the medium α(rm, ω) as well as the frequency response of the transducers. Before applying the conventional beamforming, a bandpass filter is applied to highlight the frequency band of interest and suppress the observation noise as much as possible. We denote the filtered received signals as and apply the conventional DAS beamforming to map the bubble cavitation spatially. In DAS, each received signal is shifted using the delays based on distances between each observation point in the ROI and then the M shifted signals are summed to increase the signal-to-noise ratio (SNR) at the location of the cavitating bubble. Now, the search steering vector a(x, ω) over the ROI is used for this purpose as
| (6) |
where the intensity of frame k is averaged over a number of frequency bins Q. We consider different frequency bins selections for each microbubble which results in multiple resolution-limited images or frames K. When the search steering vector matches the bubble location steering vector, the SNR is high and the intensity shows a peak at this location, otherwise the signals destructively cancel each other and the intensity is lower. In the following section, we apply super-resolution techniques to low resolution reconstructed images formed by the conventional DAS beamforming technique presented in (6).
III. Materials and Methods
Determining the best estimate of a microbubble location based on noisy beamformed images is a statistical estimation problem. The resulting degraded image of an imaging system is the convolution of the original image with the point spread function (PSF) of the system [36]. The goal of a super-resolution technique is to remove the limitations imposed by the PSF and to have access to the original image. In order to solve this estimation problem, two different approaches have been considered in this work. The first super-resolution imaging technique is based on localizing single bubbles one at a time which is based on the techniques proposed in fluorescence microscopy capable of imaging features with a resolution well beyond the diffraction limit [24]–[26]. We adapted the localization based technique for super-resolution ultrasound imaging of microbubbles [13]. This method finds the peaks of the beamformed images through a statistical fit of the ideal PSF to its beamformed image distribution. All the super-resolution images are then combined through a MIP technique [37] to form the final image of the microbubble trace. The second method directly estimates the intensity of the pixel grids in the super-resolution image by deconvolving the PSF nonlinearly from a series of noisy low resolution images [28]. The PSF parameters are derived again by fitting a 3D Gaussian function to single bubble low resolution images. In the following sections, we provide details for both of the super-resolution imaging algorithms.
A. Localization Based Super-Resolution Imaging
This section explains single microbubble fitting based localization to obtain a super-resolution image. The localization technique is based on the Photoactivated Localization Microscopy (PALM) [24] technique which temporally separates the spatially overlapping images of individual molecules. This can be achieved in ultrasound imaging using low concentration of microbubbles such that the bubbles are spatially isolated [13] or by exploiting the fact that microbubbles move with blood flow [14]. We assume that the PSF of the system has a three-dimensional Gaussian shape. This is an approximation of the shape of the main lobe of the beam response in the hemispherical transducer array we used in our experiment. For microbubble l (for 1 ≤ l ≤ L), multiple beamformed images (K frames) are formed using different frequency bins within the frequency range of interest in (6). Then, a three-dimensional Gaussian function using an unweighted least-squares optimization is fitted to the image, yielding an amplitude of A, center position of [xc yc zc], and uncertainty of σx, σy, σz using all the K frames. Each bubble is then rendered in a new super-resolution domain X = [Xl Yl Zl], as a Gaussian with standard deviation of σx, σy, σz instead of the much larger deviation of the original image as given in Step 1.b of Algorithm 1. The least-squares estimation is based on the Levenberg-Marquardt algorithm [31]. Finally, the aggregate position information from all sets of images are then assembled into one super-resolution image using the MIP method after intensity normalization.
| Algorithm 1: LOCALIZATION([in] Ik (x) [out] ˆI(X)). | |
|---|---|
B. Deconvolution Based Super-Resolution Imaging
We assume a model for the intensity of the pixels in the low resolution images at frame k (denoted as Ik (x)) as being the convolution of the PSF of the ultrasound imaging system (w(x)) with the original image with grid of X (denoted as Ik (X)) which has generally a finer grid than the imaging grids of the low resolution images (x). The expected intensity (which is presented by a circumflex to denote the estimated quantities) in the low resolution image at pixel x and frame k is given as
| (7) |
where b is the background intensity of the image and is the set of all the points in the super-resolution image. Also, the PSF is normalized such that for ∀x. This method approximates the maximum-likelihood image based on all available temporal and spatial data without explicitly localizing the microbubbles. We adapted the deconvolution STORM algorithm [28] to ultrasound passive cavitation imaging. This method follows the iterative image deconvolution algorithm in [36] which converges to the maximum likelihood estimate of the image from some blurred and noisy images with some prior statistics of the data. This algorithm starts at iteration (d = 1) with a uniform estimate of the image intensity at location X of the super-resolution image in frame k (i.e., ). Following (7), the expected intensity at pixel x and at iteration time d is . It is assumed that both the background intensity b and the PSF function w(x) are known or can be estimated beforehand from a set of single microbubble images. At each iteration d, the error between the observed intensity at frame k and the estimated intensity at that frame is defined as . This error at iteration d is then convolved with the PSF to produce the next iteration intensity as follows:
| (8) |
where is a super-resolution grid dependent normalization constant. Once (8) converges, the mean intensity of all the K frames produces the intensity in the final super-resolution image. To increase the speed of convergence, an exponential prior distribution of the form is used in [38] which is the same for every location in grid and every frame. Then, in (8), the normalization constant c(X) is replaced by c(X) + γ to accelerate the convergence of the algorithm. This method is summarized in Algorithm 2. Next section, presents the lower bounds of the accuracy of the two algorithms and studies the performance limitations imposed by different image parameters.
| Algorithm 2: DECONVOLUTION([in] Ik (x), w(X), b [out] ˆI(X)). | |
|---|---|
C. Analytical Lower Bounds of the Localization Accuracy
CRB is a lower bound to the variance of any unbiased estimate of an unknown parameter. Although the CRBs are guaranteed to be lower bounds, they may not be achievable in practice. The CRBs depend upon the type and quality of information supplied to the estimation algorithms, and thus represent the impact of information, not algorithms on the estimation quality [39]. For the Gaussian profile estimation, references [40], [41] under certain assumptions, provide the covariance matrices of the unknown parameters (i.e., A, xc, yc, zc, σx, σy, σz). Then, the individual variances of each parameter are given by the diagonal elements of the covariance matrix. In this section, we briefly review the results presented in [40]–[42] to find how well the parameters can be estimated and in what ways the estimation accuracy is limited. The CRB has already been used for demonstrating the accuracy bounds of the localization method used in [18] for microbubble super-resolution imaging. Assuming that the ROI is much larger than the standard deviations of the 3D Gaussian model, the localization uncertainties are given by [43]
| (9) |
where a flat noise of variance is considered to be the same for all pixels in frame k, vox is the number of voxels, assumed to be the same for all three dimensions, and a is the contrast of the 3D Gaussian model relative to the background. The assumption of equal noise in all three directions is necessary to be able to derive the CRBs of the localization method as it is not possible to come up with a closed form expression of the lower bounds unless the noise is considered equal. As shown in the CRBs, the accuracy of the curve fitting algorithm depends on the variance of the noise of pixels, the number of pixels at the ROI, the background intensity (hidden in parameter a), the variance of the data in the same axis while having an inverse relation with the variance of the data in other axes. These results also justify the larger variance in the axial direction compared with the lateral direction because of the larger σz relative to σx and σy. The other factors involved in the localization accuracy are the size of the pixel in the original reconstructed image and the size of the ROI; the bigger the ROI, the less accurate the fit will be. On the other hand, in algorithm 2, the unknown parameters are the intensities of all pixels in kth frame of the super-resolution image. We assume that we have noisy images (K frames) in the resolution-limited domain with the intensity of gk (x) which are noisy versions of Ik (x) presented in (7). Assuming that the log-likelihood function is denoted by ln P(gk∣Ik (x)), the Fisher Information Matrix (FIM) of the unknown parameters Ik (X) is given by [39]
where ∇ is the gradient with respect to the unknown parameter Ik(X) and ℰ{.} is the expectation operator. Here, we assume that the noisy resolution-limited images gk (x) have a Gaussian probability distribution with mean of Ik (x) and variance of . Assuming the independence of the intensity of the pixels from each other, for the ith pixel in the super-resolution image, the FIM of the intensity is given as
| (10) |
Then, the CRB of the intensity of pixel i in the super-resolution image is the inverse of the above equation. The parameters that affect the lower bound of the intensity accuracy depends on (i) variance of the background noise in the resolution-limited image, (ii) PSF of the imaging system and (iii) number of frames K of the resolution-limited image.
D. Experimental Setup
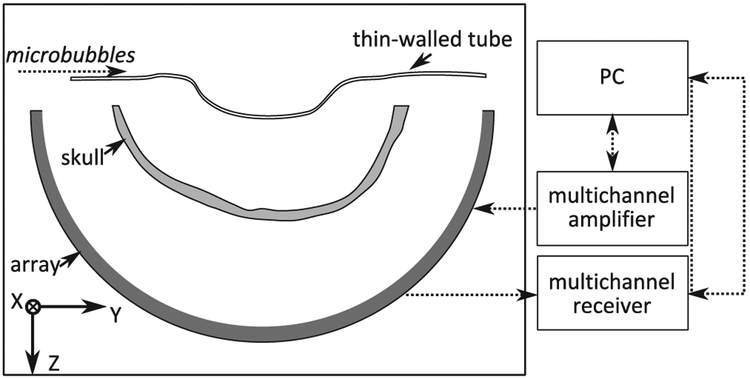
As reported previously in [13], the ultrasound was generated by a subset of 128 elements in the 306 kHz, 30 cm diameter hemispherical therapy array described by [22]. As shown in Fig. 1, the array was driven using a 128 channel driving system (Verasonics, Inc., Redmond, WA, USA). Bursts were five cycles in length, repeated at a 10 Hz PRF. The receiver array was configured in an optimized sparse arrangement distributed over the full hemispherical array aperture. The receiver array has a total of 128 piezo-ceramic elements (Del Piezo Specialties, LLC., West Palm Beach, FL, USA), with center frequencies of 612 kHz, or two times the transmit frequency. The received signals were captured with a 128 channel receiver (SonixDAQ, Ultrasonix, Richmond, B. C., Canada) at a sampling rate of 10 MHz.
Fig. 1.
Experimental setup and the imaging phantom. The array is illustrated in dark gray and the skull in light gray. The microbubbles flow through a tube that is placed near the geometric focus of the array.
The array contained in a rubber-lined tank filled with degassed, deionized water. An ex vivo human skullcap was degassed in a vacuum jar for 2 hours prior to experimentation. The skullcap was placed in the tank and a 0.8 mm internal diameter tube was placed at the array focus. The tube was filled with deionized water and sonicated with the transmit array. The scattered waveforms were captured by the receive array. Next a solution of deionized water and Definity microbubbles (1–3 μm mean diam., Lantheus Medical Imaging, North Billerica, MA, USA) was pumped through the tubing and the tube was again sonicated and the waveforms were captured. The bubbles were diluted in water at an approximate concentration of 1600 bubbles/mL, or 12 mm of tubing per bubble, allowing the assumption of single bubbles being excited at the array focus. This estimate is based on the mean concentration of undiluted bubbles measured by Coulter Counter in [4] and the dilution ratio used. To suppress strong reflections from the skull bone, the signals captured with bubbles present are subtracted from the case of just water prior to further processing. Phase correction for the delays induced by the skull were corrected for using time-of-flight measurements of the signal from a narrowband source, captured directly and through the skull. We have demonstrated elsewhere [13] that non-invasive bubble-based methods can also be used to calculate the phase and amplitude correction terms.
IV. Results
A. Localization Based Results
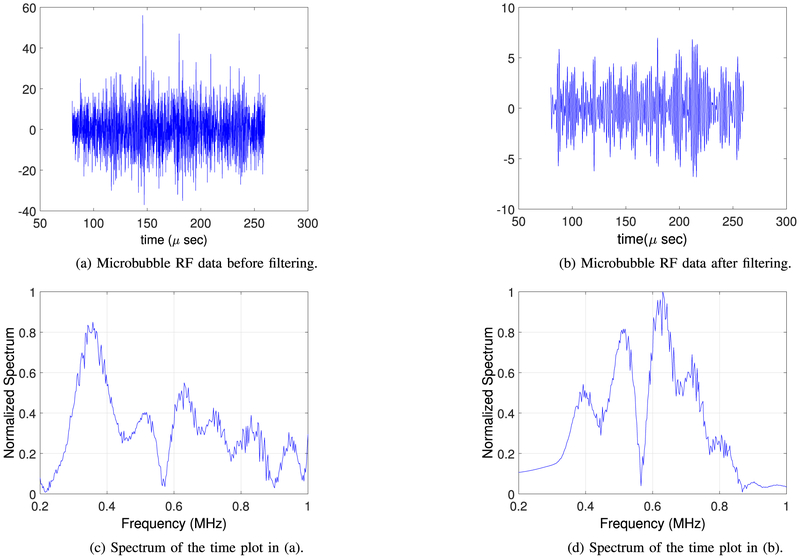
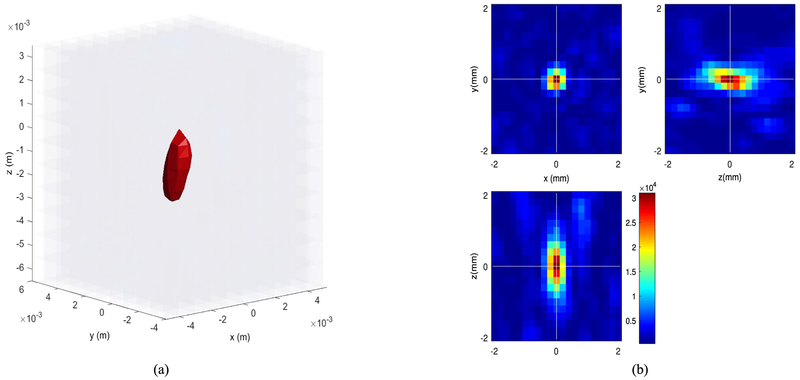
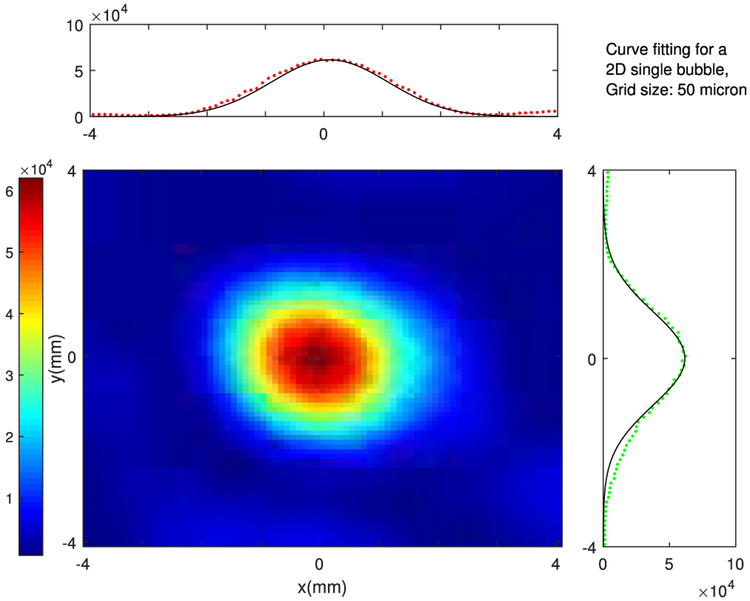
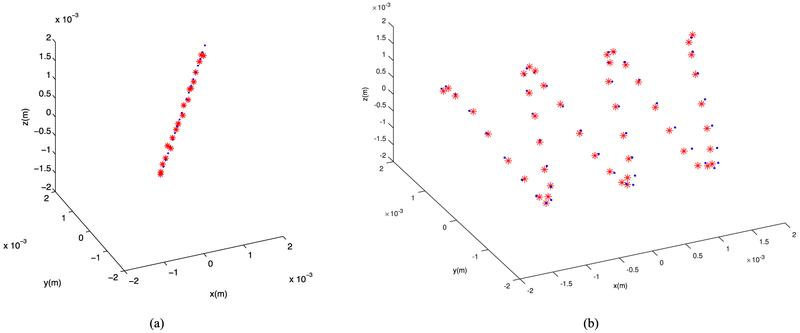
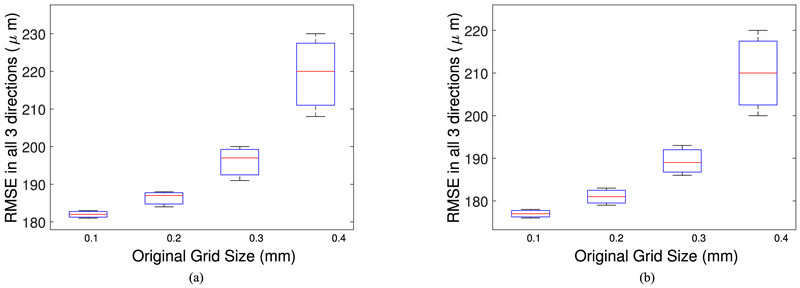
Example RF data is plotted in Fig. 2 both in time and frequency domains. A zero-phase bandpass butterworth filter of order 4 was used to suppress the other frequency bins and highlight the frequency range between 400–800 kHz. Compensating for the effects of the skull bone, 3D and 2D single bubble images are plotted in Fig. 3, at a grid spacing of 0.5 mm. As shown in Fig. 3, the elongation artifact significantly reduces the axial resolution due to the limitation of the hemispherical transducer array in the z-direction. Then, using a PAM based image of a single bubble, different scenarios are simulated to track the movement of microbubbles. In this article, we present linear and sinusoidal traces to evaluate the performance of the proposed localization method. In a linear trace, the source is shifted along all three directions with 160 micron spacing between adjacent bubbles with 20 bubbles in total. The RF received signals of a single bubble by the hemispherical transducers are up-sampled by 4 to increase delay accuracy and then delayed based on the difference between the shifted source positions. The reconstructed image for each microbubble is formed separately based on the delayed RF data and a Gaussian function is fitted to each microbubble. We use an existing implementation of Matlab via the optimization toolbox (lsqcurvefit), in which we enable the Levenberg-Marquardt option as minimization scheme. The results are shown in a 2D plane in Fig. 4. The center points of the Gaussian functions after curve fitting are considered as the estimated peak of the microbubble and are plotted together with the bubble locations in linear and sinusoidal traces in Fig. 5. The uncertainties on the fit were calculated to be 20 ± 2 μm (mean ± S.D.) for each microbubble. In order to evaluate the performance of the localization algorithm, the reconstruction grid step was varied from 0.1 mm to 0.4 mm for each bubble image and the root-mean-square errors (RMSE) are plotted considering all the bubble locations in the trace (Fig. 6). We repeated the same experiment with other single microbubble reconstructed images to get the RMSEs and also compensated for the effect of the varying number of grid points. As shown in Fig. 6, the lower discretization step in the initial reconstructed image reduces the error of the peak estimation but seems to reach a limit around 0.1–0.2 mm for the reconstruction grid size.
Fig. 2.
Snapshot of the RF data before and after filtering: (a) Raw data v.s. time in μs, (b) Normalized filtered data v.s. time in μ s, (c) Raw data v.s. frequency in MHz, and (d) Normalized filtered data v.s. frequency in MHz.
Fig. 3.
Reconstructed image of a single bubble; (a) Three dimensional image, (b) Two-dimensional representation of (a), the x-y-z axes show the number of grids.
Fig. 4.
Two dimensional Gaussian fitting for localization with 50 μm reconstruction grid size and the x-y axes being the number of grids.
Fig. 5.
Localization: Linear and sinusoidal bubble traces after applying the curve fitting algorithm on the original grid size, blue dots are source locations and the red stars are the localized sources.
Fig. 6.
Root-mean-square error of the localized peaks for: (a) the linear trace and (b) the sinusoidal trace.
B. Deconvolution Based Results
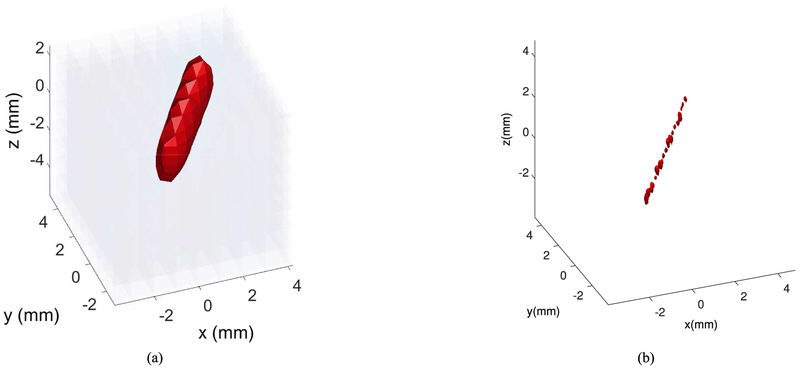
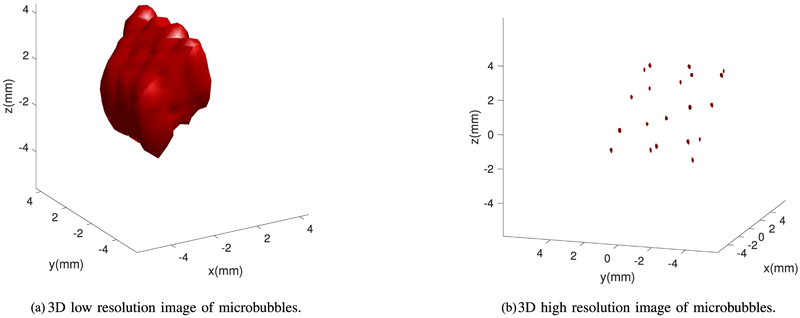
In this section, we present the super-resolution imaging results based on deconvolution as presented in Algorithm 2. Here, we present the results for the same linear and sinusoidal traces of bubbles as we formed previously for the localization based imaging except that we are directly estimating the intensity for a single microbubble one at a time. The maximum intensity projection is used to form the traces both in the original and super-resolution images. Fig. 7(a) shows the low resolution image with 0.4 mm reconstruction grid size and Fig. 7(b) shows the super-resolution images after applying Algorithm 2 with eight times finer grid size. Fig. 8 also, presents the results for a sinusoidal shape bubble trace using the deconvolution based estimation. The results indicate that the bubbles in the reconstructed images are not spatially resolvable, while the traces in the super-resolution images almost always can differentiate between the two adjacent bubbles. However, the lateral resolution achieved by both the algorithms is around 2 times higher than the axial resolution. Also, the peak of the intensity in the super-resolution images for each bubble is the estimated source location. The error between the estimated peaks and the actual source locations is computed for the linear and sinusoidal traces to be 74 ± 10 μm and 59 ± 8 μm, respectively. These errors are less than the errors of the localized peaks based on algorithm 1 for the same reconstruction grid (0.4 mm) which are 220 ± 10 μm and 210 ± 5 μm, for the linear and sinusoidal traces, respectively. The above examples indicate the potential of using super-resolution techniques to analyze the bubble dynamics more efficiently compared with the existing beamforming techniques, but the performance in practice depends on parameters such as the density of the bubbles and the size of the image features.
Fig. 7.
Deconvolution method for a linear trace constructed from moving a single microbubble low resolution image, (a) 3D plot of the microbubble in a linear trace at the original resolution, (b) Super-resolution image after applying the deconvolution algorithm, plotted on an eight-fold upsampled image grid.
Fig. 8.
Deconvolution method for a sinusoidal trace constructed from moving a single microbubble low resolution image, (a) 3D plot of the microbubble in a sinusoidal trace, (b) Super-resolution image after applying the deconvolution algorithm, plotted on an eight-fold upsampled image grid.
C. Comparison of the Methods
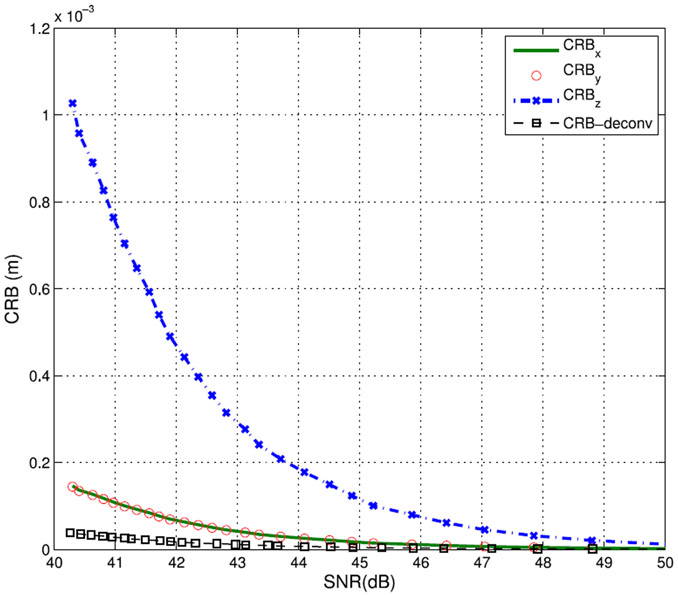
This section compares the performance of the two proposed algorithms in terms of the localization error, running time and the computational costs. First, we plot the CRBs for a single bubble location estimation using (9)–(10). Random noise is added to each pixel of the low resolution image to simulate different SNRs and the CRBs are calculated for each SNR. Fig. 9 shows the CRBs of the localization algorithm in x, y, and z directions as compared with the deconvolution based CRB. The figure shows that in general, the deconvolution based algorithm has lower CRB than the localization algorithm at different SNRs.
Fig. 9.
CRB plot of both the fitting-based localization algorithm in x, y, and z directions as well as the deconvolution based algorithm at different SNRs.
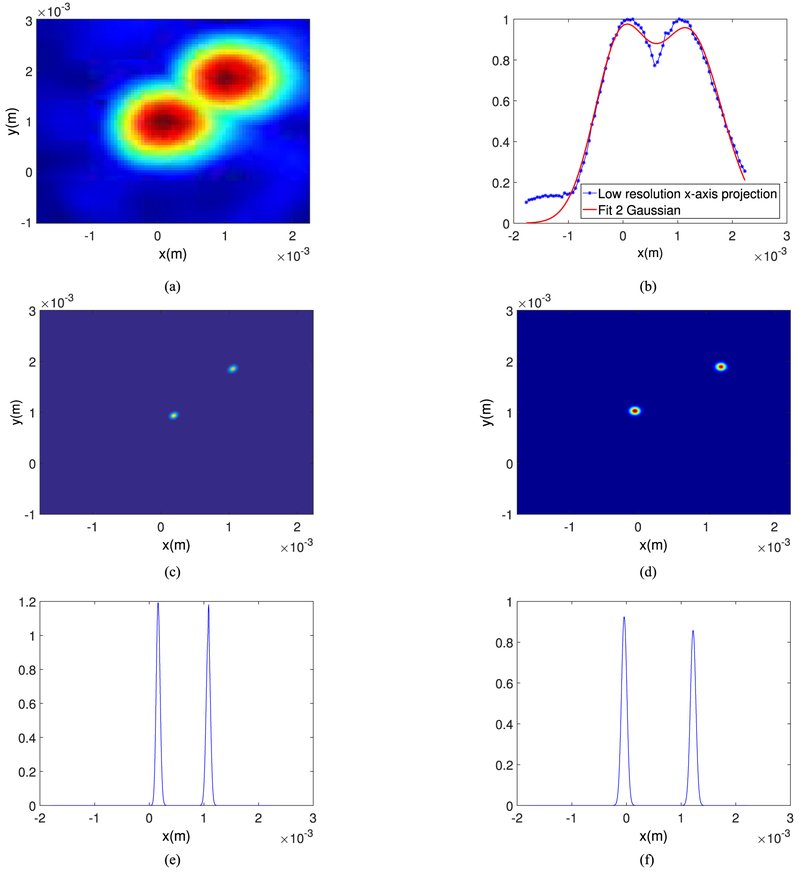
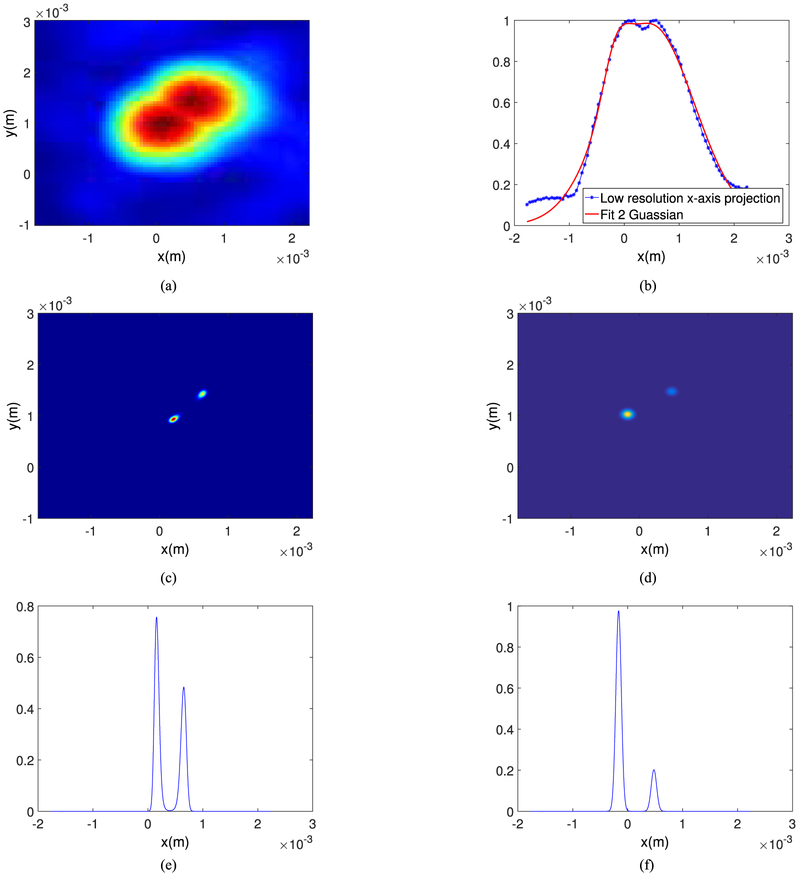
In terms of the localization error, we demonstrate the superresolution capability of the proposed algorithms by generating images of two bubbles separated by a given distance. Fig. 10 shows the localized bubbles with 1 mm spacing (Fig. 10(a)) after curve fitting and the maximum projection along the x-axis with the two Gaussian fitted curves (Fig. 10(b), (d) and (f)) and after applying the deconvolution based algorithm (Fig. 10(c) and (e)). In this figure, we show the 2D images along the x-y axis for clarity. As shown in this figure, both the algorithms can resolve the bubbles but the width of the main lobe indicates that the deconvolution based algorithm provides better resolution. Based on the peak intensity along the x-axis, the absolute value of the error for the algorithms 1 and 2 are 310 μm and 130 μm, respectively at reconstruction grid size of 50 μm of the original image. We repeat the experiment for lower bubble spacing (0.5 mm in x-direction) and the results are presented in Fig. 11. This makes the absolute value of the error for the curve fitting-based imaging to be 348 μm as compared to the 152 μm absolute error of the deconvolution based imaging. We also compared the relative visibility v of the projected intensity profiles given in Fig. 10(e) and (f) and also in Fig. 11(e) and (f), defined as [27]
| (11) |
where Imax, i for i = 1, 2 are the maximum mean intensity at the known source locations when each algorithm is applied (as shown in Fig. 10(e)–(f)), Imin is the mean intensity of the half of the sum of the source locations, and I1, I2 are the real source intensities. This metric is a number between 0 to 1 and is a measure of how much the intensity of the super-resolution point targets are at the exact locations of the initial targets with respect to the background intensity between the two targets. For bubble spacing of 1 mm and 0.5 mm, these metrics are respectively 0.12 and 0.2 for algorithm 1 and 0.72 and 0.62 for algorithm 2 which indicates that, by this metric, the deconvolution based super-resolution image is better.
Fig. 10.
Images of two bubbles separated laterally 1 mm (a) 2D lateral image, (b) Two Gaussian curves fitting of (a), solid line shows the fitted curve and the dots show the intensity projection along the x-axis, (c) Super-resolution image using deconvolution method plotted on an eight fold upsampled grid, (d) Super-resolution image using curve fitting method plotted on an eight fold upsampled grid (e) Projection of (c) along the x-axis (f) Projection of (d) along the x-axis.
Fig. 11.
Images of two bubbles separated laterally 0.5 mm (a) 2D lateral image, (b) Two Gaussian curves fitting of (a), solid line shows the fitted curve and the dots show the intensity projection along the x-axis, (c) Super-resolution image using deconvolution method plotted on an eight fold upsampled grid, (d) Super-resolution image using curve fitting method plotted on an eight fold upsampled grid, (e) Projection of (c) along the x-axis (f) Projection of (d) along the x-axis.
Curve fitting based processing can be performed using a fast Levenberg-Marquardt algorithm that takes less than a second. On the other hand, deconvolution procedures estimate the intensity of the entire image, i.e., a gray scale value at each super-resolution pixel, therefore, algorithm 2 requires a great number of computations at each iteration compared to localization algorithms. Even with the use of a spatial and temporal statistical prior information to accelerate the convergence speed, in same cases, the deconvolution technique may need 103 iterations to converge. In terms of the running time using MATLAB (MathWorks, Inc.), with a 64-bit 8 core Intel(R)Xeon(R) CPU @2.5 GHz and 32 GB of RAM, algorithm 1 takes 0.5 seconds while algorithm 2 with 30 iterations and original pixel size of 41*41 and 200 frames with 10 times more pixels in the superresolution image, takes around 20 minutes to run. Therefore, algorithm 1 is much faster.
The computational complexity of curve fitting approach with respect to required operations (i.e., time complexity) depends on several parameters. First of all, the number of iterations of the iterative minimization process has large influence on the algorithmic complexity of the approach. This value cannot be predicted beforehand and depends on the quality of the initial parameters and the suitability of the Gaussian fitted model. For each iteration, with s3 and t being the number of voxels in the ROI and the number of model parameters (i.e., 7 in 3D), respectively, the process involves operations [43]. For all iterations (D), the algorithmic complexity is given by . It can be seen that for 3D images, the algorithmic complexity of fitting is dominated by the size of the ROI. This process is repeated for each microbubble of each L images and K frames, resulting in operations. Comparing with this number of operations, we neglect the number of operations to form the super-resolution image with s′3 voxels in the ROI. The computational complexity of the conventional MIP is [37], which can be neglected with respect to the computational complexity of that of the curve fitting . For each iteration, the computational complexity of the deconvolution phase of algorithm 2 by means of Fast Fourier Transform (FFT), is [44] and is independent of the number of bubbles, L. Then, for D iterations and K image frames, the total computational complexity will be . We assume that the other step of the algorithm which involves in estimating the sparseness parameter is dominated by the first step due to the size of the ROI, s′3. Comparing these two computational complexities, it can be seen that the deconvolution based super-resolution imaging will take many more operations than the curve fitting based approach.
Both of these algorithms process a number of multiframe resolution limited images from experimental PAM data and provide a super-resolution image, therefore, the practicality of both the approaches in real time operations are limited. The other underlying assumption for both localization and deconvolution-based algorithms is that there is only single microbubble one at a time in the ROI which may be a difficult setup to achieve in practice. We also artificially created the traces of microbubbles from a single PAM experimental data set. Our future work will focus on using experimental data from multiple bubbles. The localization-based algorithm assumes a Gaussian fit to the resolution limited images while the deconvolution-based approach assumes a model with known PSF. Finally, in order to determine the flow velocity within the microvasculature, microbubble tracking algorithms need to identify individual microbubble signals [16]. The deconvolution-based algorithm does not emphasize imaging individual microbubbles one at a time, therefore, it is difficult to use this method with tracking algorithms.
V. Conclusion and Future Work
There is a pressing need to develop more efficient superresolution imaging algorithms for PAM exhibiting an appropriate compromise between algorithmic simplicity, computational complexity, visibility, robustness against noise, and high accuracy. In this work, we proposed two methods to form a super-resolution image from a number of multiframe resolution-limited images. The first approach is based on curve fitting to localize the bubbles, which runs in less than a second using common least squares estimation methods. Our future goal for the localization based method is to extend the algorithm to fit multiple bubbles at the same time. This requires iteratively finding all local maxima above a certain threshold, fitting a Gaussian curve to all the bubbles, forming the fitted image based on the localization parameters, calculating the residual error, lowering the threshold and continuing this process until a certain threshold of the error is reached [45]. Rather than processing data by estimating the locations, the deconvolution based method is fundamentally different and estimates the intensity of each pixel in the superresolution image, assuming that the PSF is known beforehand.
The accuracy of the proposed methods are investigated by presenting the corresponding CRBs. Using a single microbubble experimental data set, different traces of the microbubbles are formed and the performance of the two methods are compared in terms of the accuracy and the computational complexity. In terms of the localization error, the deconvolution based method has almost one third of the absolute mean error, while in terms of the running time and the computational costs, the curve fitting technique is superior. For future work, we plan to take advantage of parallel computing on different graphical processing units and develop parallel programming in Matlab and C language for analyzing multiple frames in parallel to form the deconvolution based image.
Contributor Information
Foroohar Foroozan, Analog Devices, Toronto, ON M5G 2C8, Canada, and was with the Physical Sciences Platform, Sunnybrook Research Institute, Toronto, ON M4N 3M5 Canada (foroohar.foroozan.f@ieee.org)..
Meaghan A. O’Reilly, Physical Sciences Platform, Sunnybrook Research Institute and also with the Department of Medical Biophysics, University of Toronto..
Kullervo Hynynen, Physical Sciences Platform, Sunnybrook Research Institute, Department of Medical Biophysics, University of Toronto, and also with the Institute of Biomaterials and Biomedical Engineering, University of Toronto..
References
- [1].Feinstein SB et al. , “Contrast echocardiography during coronary arteriography in humans: Perfusion and anatomic studies,” J. Amer. College Cardiol, vol. 11, no. 1, pp. 59–65, 1988. [DOI] [PubMed] [Google Scholar]
- [2].Stride E and Saffari N, “Microbubble ultrasound contrast agents: A review,” J. Eng. Med., H, vol. 217, no. 6, pp. 429–447, 2003. [DOI] [PubMed] [Google Scholar]
- [3].Gyongy M, “Passive cavitation mapping for monitoring ultrasound therapy,” Ph.D. dissertation, Oxford Univ., Oxford, U.K., 2010. [Google Scholar]
- [4].OReilly MA et al. , “Three-dimensional transcranial ultrasound imaging of microbubble clouds using a sparse hemispherical array,” IEEE Trans. Biomed. Eng, vol. 61, no. 4, pp. 1285–1294, April 2014. [DOI] [PMC free article] [PubMed] [Google Scholar]
- [5].Arvanitis CD et al. , “Passive mapping of cavitation activity for monitoring of drug delivery,” J.Acoust. Soc. Amer, vol. 127, no. 3, pp. 1977–1977, 2010. [Google Scholar]
- [6].Jones RM et al. , “Transcranial passive acoustic mapping with hemispherical sparse arrays using CT-based skull-specific aberration corrections: A simulation study,” Phys. Med. Biol, vol. 58, no. 14, pp. 4981–5005, 2013. [DOI] [PMC free article] [PubMed] [Google Scholar]
- [7].Norton SJ et al. , “Passive imaging of underground acoustic sources,” J. Acoust. Soc. Amer, vol. 119, 2006, Art. no. 2840. [Google Scholar]
- [8].Stoica P et al. , “Robust Capon beamforming,” IEEE Signal Process. Lett, vol. 10, no. 6, pp. 172–175, June 2003. [Google Scholar]
- [9].Schmidt R, “Multiple emitter location and signal parameter estimation,” IEEE Trans. Antennas Propag, vol. 34, no. 3, pp. 276–280, March 1986. [Google Scholar]
- [10].Coviello CM et al. , “Robust capon beamforming for passive cavitation mapping during high-intensity focused ultrasound therapy,” J. Acoust. Soc. Amer, vol. 128, 2010, Art. no. 2280. [Google Scholar]
- [11].Coviello etal C et al. , “Passive acoustic mapping using optimal beamforming for real-time monitoring of ultrasound therapy,” in Proc. Meet. Acoust, vol. 19, 2013, Art. no. 075024. [Google Scholar]
- [12].Wang Z et al. , “Time-delay-and time-reversal-based robust capon beam-formers for ultrasound imaging,” IEEE Trans. Med. Imag, vol. 24, no. 10, pp. 1308–1322, October 2005. [DOI] [PubMed] [Google Scholar]
- [13].OReilly MA and Hynynen K, “A super-resolution ultrasound method for brain vascular mapping,” Med. Phys, vol. 40, no. 11, 2013, Art. no. 110701. [DOI] [PMC free article] [PubMed] [Google Scholar]
- [14].Errico C et al. , “Ultrafast ultrasound localization microscopy for deep super-resolution vascular imaging,” Nature, vol. 527, no. 7579, pp. 499–502, 2015. [DOI] [PubMed] [Google Scholar]
- [15].Viessmann O et al. , “Acoustic super-resolution with ultrasound and microbubbles,” Phys. Med. Biol, vol. 58, no. 18, pp. 6447–6458, 2013. [DOI] [PubMed] [Google Scholar]
- [16].Christensen-Jeffries K et al. , “In vivo acoustic super-resolution and super-resolved velocity mapping using microbubbles,” IEEE Trans. Med. Imag, vol. 34, no. 2, pp. 433–440, February 2015. [DOI] [PubMed] [Google Scholar]
- [17].Ackermann D and Schmitz G, “Detection and tracking of multiple microbubbles in ultrasound B-mode images,” IEEE Trans. Ultrason., Ferroelect., Freq. Control, vol. 63, no. 1, pp. 72–82, January 2016. [DOI] [PubMed] [Google Scholar]
- [18].Desailly Y et al. , “Sono-activated ultrasound localization microscopy,” Appl. Phys. Lett, vol. 103, no. 17, pp. 174 107-1–174 107-4, 2013. [Google Scholar]
- [19].Foiret J et al. , “Ultrasound localization microscopy to image and assess microvasculature in a rat kidney,” Sci. Rep, vol. 7, 2017, Art. no. 13662. [DOI] [PMC free article] [PubMed] [Google Scholar]
- [20].Hingot V et al. , “Subwavelength motion-correction for ultrafast ultrasound localization microscopy,” Ultrasonics, vol. 77, pp. 17–21, 2017. [DOI] [PubMed] [Google Scholar]
- [21].Desailly Y et al. , “Resolution limits of ultrafast ultrasound localization microscopy,” Phys. Med. Biol, vol. 60, no. 22, pp. 8723–8740, November 2015. [DOI] [PubMed] [Google Scholar]
- [22].Song J and Hynynen K, “Feasibility of using lateral mode coupling method for a large scale ultrasound phased array for noninvasive transcranial therapy,” IEEE Trans. Biomed. Eng, vol. 57, no. 1, pp. 124–133, January 2010. [DOI] [PMC free article] [PubMed] [Google Scholar]
- [23].Deng L et al. , “A multi-frequency sparse hemispherical ultrasound phased array for microbubble-mediated transcranial therapy and simultaneous cavitation mapping,” Phys. Med. Biol, vol. 61, no. 24, pp. 8476–8501, December 2016. [DOI] [PMC free article] [PubMed] [Google Scholar]
- [24].Henriques R et al. , “QuickPALM: 3D real-time photoactivation nanoscopy image processing in imageJ,” Nature Methods, vol. 7, no. 5, pp. 339–340, 2010. [DOI] [PubMed] [Google Scholar]
- [25].Huang B et al. , “Three-dimensional super-resolution imaging by stochastic optical reconstruction microscopy,” Science, vol. 319, no. 5864, pp. 810–813, 2008. [DOI] [PMC free article] [PubMed] [Google Scholar]
- [26].Betzig E et al. , “Imaging intracellular fluorescent proteins at nanometer resolution,” Science, vol. 313, no. 5793, pp. 1642–1645, 2006. [DOI] [PubMed] [Google Scholar]
- [27].Geissbuehler S et al. , “Comparison between SOFI and STORM,” Biomed. Opt. Express, vol. 2, no. 3, pp. 408–420, 2011. [DOI] [PMC free article] [PubMed] [Google Scholar]
- [28].Mukamel EA et al. , “Statistical deconvolution for superresolution fluorescence microscopy,” Biophys. J, vol. 102, no. 10, pp. 2391–2400, 2012. [DOI] [PMC free article] [PubMed] [Google Scholar]
- [29].Selvin PR et al. , “Fluorescence imaging with one-nanometer accuracy (FIONA),” Cold Spring Harbor Protocols, vol. 2007, no. 10, 2007, Art. no. pdb.top27. [DOI] [PubMed] [Google Scholar]
- [30].Sarder P and Nehorai A, “Deconvolution methods for 3-D fluorescence microscopy images,” IEEE Signal Process. Mag, vol. 23, no. 3, pp. 32–45, May 2006. [Google Scholar]
- [31].Mor J, “The Levenberg–Marquardt algorithm: Implementation and theory,” in Numerical Analysis, ser Lecture Notes in Mathematics, Watson G, Ed. Berlin, Germany: Springer, 1978, vol. 630, pp. 105–116. [Google Scholar]
- [32].Krim H and Viberg M, “Two decades of array signal processing research: The parametric approach,” IEEE Signal Process. Mag, vol. 13, no. 4, pp. 67–94, July 1996. [Google Scholar]
- [33].GyöD6ngy M and Coussios C-C, “Passive cavitation mapping for localization and tracking of bubble dynamics,” J. Acoust. Soc. Amer, vol. 128, no. 4, pp. EL175–EL180, 2010. [DOI] [PubMed] [Google Scholar]
- [34].Salgaonkar VA et al. , “Passive cavitation imaging with ultrasound arrays,” J. Acoust. Soc. Amer, vol. 126, pp. 3071–3083, 2009. [DOI] [PMC free article] [PubMed] [Google Scholar]
- [35].Collin JR, “Detection and interpretation of thermally relevant cavitation during HIFU exposure,” Ph.D. dissertation, Oxford Univ., Oxford, U.K., 2009. [Google Scholar]
- [36].Richardson WH, “Bayesian-based iterative method of image restoration,” J. Opt. Soc. Amer, vol. 62, no. 1, pp. 55–59, 1972. [Google Scholar]
- [37].Kim K and Park H, “A fast progressive method of maximum intensity projection,” Computerized Med. Imag. Graph, vol. 25, no. 5, pp. 433–441, 2001. [DOI] [PubMed] [Google Scholar]
- [38].Chen SS et al. , “Atomic decomposition by basis pursuit,” SIAM J. Sci. Comput, vol. 20, no. 1, pp. 33–61, 1998. [Google Scholar]
- [39].Ye JC et al. , “Cramér-Rao bounds for parametric shape estimation in inverse problems,” IEEE Trans. Image Process, vol. 12, no. 1, pp. 71–84, January 2003. [DOI] [PubMed] [Google Scholar]
- [40].Hagen N et al. , “Gaussian profile estimation in one dimension,” Appl. Opt, vol. 46, no. 22, pp. 5374–5383, August 2007. [DOI] [PMC free article] [PubMed] [Google Scholar]
- [41].Hagen N and Dereniak EL, “Gaussian profile estimation in two dimensions,” Appl. Opt, vol. 47, no. 36, pp. 6842–6851, 2008. [DOI] [PubMed] [Google Scholar]
- [42].Wörz S and Roher K, “Localization of anatomical point landmarks in 3D medical images by fitting 3D parametric intensity models,” Med. Image Anal, vol. 10, no. 1, pp. 41–58, 2006. [DOI] [PubMed] [Google Scholar]
- [43].WöD6rz S, “Three-D parametric intensity models for the localization of 3D anatomical point landmarks and 3D segmentation of human vessels,” Ph.D. dissertation, IOS Press, Amsterdam, The Netherlands, 2006. [Google Scholar]
- [44].Guo H et al. , “The quick discrete Fourier transform,” in Proc. IEEE Int. Conf. Acoust., Speech, Signal Process, vol. iii, 1994, pp. III/445–III/448. [Google Scholar]
- [45].Babcock H et al. , “A high-density 3D localization algorithm for stochastic optical reconstruction microscopy,” Opt. Nanoscopy, vol. 1, no. 1, pp. 1–10, 2012. [DOI] [PMC free article] [PubMed] [Google Scholar]


