Abstract
Fructose consumption has increased because of widespread use of high-fructose corn syrup by the food industry. Renal proximal tubules are thought to reabsorb fructose. However, fructose reabsorption (Jfructose) by proximal tubules has not yet been directly demonstrated, nor the effects of dietary fructose on Jfructose. This segment expresses Na+- and glucose-linked transporters (SGLTs) 1, 2, 4, and 5 and glucose transporters (GLUTs) 2 and 5. SGLT4 and -5 transport fructose, but SGLT1 and -2 do not. Knocking out SGLT5 increases urinary fructose excretion. We hypothesize that Jfructose in the S2 portion of the proximal tubule is mediated by luminal entry via SGLT4/5 and basolateral exit by GLUT2 and that it is enhanced by a fructose-enriched diet. We measured Jfructose by proximal straight tubules from rats consuming either tap water (Controls) or 20% fructose (FRU). Basal Jfructose in Controls was 14.1 ± 1.5 pmol·mm−1·min−1. SGLT inhibition with phlorizin reduced Jfructose to 4.9 ± 1.4 pmol·mm−1·min−1 (P < 0.008), whereas removal of Na+ diminished Jfructose by 86 ± 5% (P < 0.0001). A fructose-enriched diet increased Jfructose from 12.8 ± 2.5 to 19.3 ± 0.5 pmol·mm−1·min−1, a 51% increase (P < 0.03). Using immunofluorescence, we detected luminal SGLT4 and SGLT5 and basolateral GLUT2; GLUT5 was undetectable. The expression of apical transporters SGLT4 and SGLT5 was higher in FRU than in Controls [137 ± 10% (P < 0.01) and 38 ± 14% (P < 0.04), respectively]. GLUT2 was also elevated by 88 ± 27% (P < 0.02) in FRU. We conclude that Jfructose by proximal tubules occurs primarily via Na+-linked cotransport processes, and a fructose-enriched diet enhances reabsorption. Transport across luminal and basolateral membranes is likely mediated by SGLT4/5 and GLUT2, respectively.
Keywords: hexoses, kidney, phlorizin, salt, sugar transport
INTRODUCTION
Fructose consumption has increased in industrialized countries because of widespread use of high-fructose corn syrup by the food industry. Individuals in the upper quartiles of the fructose consumption distribution curve consume 20% or more of their total calories as fructose (30, 38, 44). Such elevated ingestion raises the risk of developing several cardiovascular and metabolic diseases (2, 16, 17, 22). In the United States this may represent more than 16 million people (28, 33, 44).
The postprandial plasma fructose concentration is primarily a balance between absorption by the intestine, hepatic metabolism, and renal reabsorption and excretion (3, 13, 24, 32, 41). Thus, fructose-rich diets are expected to increase, at least transiently blood fructose. Once fructose is reabsorbed by the intestine, hepatic metabolism roughly accounts for 80% of fructose removal from the blood while renal clearance accounts for the remaining 20% (3). The proximal nephron plays a pivotal role in reabsorbing sugars such as glucose and galactose. In this nephron segment, glucose is completely reabsorbed. Thus it has been assumed that this segment also reabsorbs fructose. However, it is not known whether proximal tubules reabsorb fructose or the transporters involved.
It has been assumed that reabsorption of fructose in the proximal nephron is the result of passive facilitated diffusion, since it is in the intestine with glucose transporter 5 (GLUT5) mediating fructose entry and glucose transporter 2 (GLUT2) mediating exit in the blood. Both proximal convoluted (S1) and straight (S2) tubules express GLUT2 (42), but only the S3 segment of the proximal straight tubule expresses GLUT5 (39). In addition, whether GLUT2 expression is limited to the basolateral membrane remains controversial. Therefore, this model alone may work for S3 but not the S1 and S2.
Na+- and glucose-linked transporter 5 (SGLT5) is a recently defined fructose transporter (13). Similar to all SGLTs, it is thought to transport sugars in cells using the energy of the Na+ electrochemical gradient to drive sugar absorption against a concentration gradient. Unlike SGLT1 and -2, which do not transport fructose at physiological concentrations (23, 36), SGLT5 has a greater affinity for fructose than glucose (21). SGLT5 is expressed in the kidney, and knocking it out increases urinary fructose excretion (13). The exact localization of SGLT5 remains elusive. Given that SGLT1 and -2 are expressed in the luminal membrane of the proximal tubule (1, 34, 40, 43), SGLT5 is assumed to be localized there; still, this has never been shown. Although less studied, SGLT4 is another member of the SGLT family found in the kidney that could be involved in fructose transport. Similar to SGLT5, its localization has not been demonstrated. Currently the roles of SGLT4 and SGLT5 in fructose reabsorption by proximal tubules are unknown.
Enhanced sugar consumption has been shown to increase SGLT5 (5) expression in the kidney and GLUT2 in the intestines (10, 29). However, the particular effects of dietary fructose on the renal expression and activity of the fructose transporters SGLT4, SGLT5, and GLUT2 have not been addressed. We hypothesize that fructose reabsorption in the S2 portion of the proximal tubule is mediated by luminal entry via SGLT4 and SGLT5 and basolateral exit by GLUT2, and that fructose reabsorption is enhanced by a fructose-enriched diet.
METHODS
Animals.
Male Sprague-Dawley rats were purchased from Charles River Laboratories (Wilmington, MA) and fed a purified diet (no. 5876; TestDiet, St. Louis, MO) with a regular Na+ content (~100 meq/kg). Animals were allowed to acclimate to the facility and the diet for 5 days while drinking tap water. After the acclimation period, animals were randomly split and assigned to either FRU or Control groups (day 0). The Control group remained drinking tap water while the FRU group received a fructose beverage (200 g/l) as a sole source of fluid. Animals remained on this dietary intervention for 7–9 days until terminal surgery. The metabolic characteristics of this model have been published before (15, 18). All experiments were approved by the Case Western Reserve University Institutional Animal Care and Use Committee in accordance with National Institutes of Health Guidelines for Use and Care of Laboratory Animals.
Isolation and perfusion of proximal straight tubules.
Cortical tubules corresponding to the S2 portion of the proximal tubule were dissected and perfused as we have previously described (7, 15). Briefly, rats were anesthetized with ketamine (100 mg/kg) and xylazine (20 mg/kg) via intraperitoneal injections. The left kidney was bathed in ice-cold 150 mmol/l NaCl for 2–3 min before being removed. Coronal slices were cut and placed in physiological solution containing (in mmol/l): 130 NaCl, 4 KCl, 10 HEPES (pH 7.5 at 20°C), 2.5 Na2HPO4, 1.2 MgSO4, 1 calcium dilactate, 1 sodium acetate, 6 dl-alanine, and 5 fructose. In the Na+-free solution NaCl was replaced with iso-osmolar mannitol, Na2HPO4 with K2HPO4, and sodium acetate with potassium acetate. Medullary rays were dissected from the slices and placed in a petri dish on the stage of a stereomicroscope that was electronically cooled. S2 segments were then dissected at 4–8°C and placed in a chamber on the stage of an inverted microscope (Diaphot or Eclipse TE300; Nikon Instruments, Melville, NY). Tubules were perfused with a nanoliter pump at 5–10 nl/min via an array of glass pipets and warmed to 37°C. The basolateral bath was exchanged at 1 ml/min.
Measurement of fructose transport.
Fluid reabsorption was calculated from the difference between the calibrated perfusion rate and the timed collection rate of fluid that had traversed the tubule.
Fructose reabsorption was calculated using the equation:
where Jfructose is the rate of fructose reabsorption (in pmol·mm−1·min−1), Cp is the concentration of fructose in the perfusion solution (in mmol/l); PR is the perfusion rate (in nl·mm−1·min−1), Cc is the concentration of fructose in the collected fluid, and CR is the collection rate (in nl·mm−1·min−1).
Fructose was measured using a modified commercially available kit (ab83380; Abcam, Cambridge, MA) using a flow-through ultramicrofluorometer similar to that which we have previously described (14). The perfusion rate was set using a calibrated nanoliter pump. The collection rate was measured using a calibrated pipet.
Immunofluorescence for SGLT4 and SGLT5.
Isolated S2 proximal tubules were transferred to a chamber on the stage of an inverted microscope (Eclipse Ti; Nikon Instruments) and perfused with 150 mM NaCl. The tubules were then fixed with a 1:10 dilution of HistoChoice MB Tissue Fixative (VWR Amresco, Solon, OH) in the bath for 30 min. The basolateral side of the tubule was washed three times with 150 mM NaCl. Blocking was performed by perfusing the tubule for 30 min with 3% bovine serum albumin (BSA) in 150 mM NaCl. Next, the tubule was perfused with a 1:300 dilution of the primary antibody in 3% BSA in 150 mM NaCl for 2 h (Table 1). After perfusion with 150 mM NaCl for a 5-min wash, the tubule was incubated with a 1:300 dilution of a fluorophore-conjugated secondary antibody in 3% BSA in 150 mM NaCl in the perfusate for 1 h (Table 1). The tubule was then perfused with 150 mM NaCl for 10 min. Fluorescent images of the proximal tubule excited at 488 nm were obtained using a ×40 immersion oil objective on a confocal microscope system (Visitech International, Sunderland, UK) equipped with VoxCell v8.03.01 software.
Table 1.
Antibodies and conditions used for immunofluorescence microscopy
| Conditions |
|||||
|---|---|---|---|---|---|
| Antibody | Provider | Catalog No. | Source | Dilution | Time, h |
| SGLT4 (S-14) | Santa Cruz Biotechnology | sc-162184 | Goat | 1:300 | 2 |
| 2ry anti-Goat IgG Alexa Fluor 488 | Abcam | ab150129 | Donkey | 1:300 | 1 |
| SGLT5 | Abcam | ab167156 | Rabbit | 1:300 | 2 |
| 2ry anti-Rabbit IgG Alexa Fluor 488 | Abcam | ab150077 | Goat | 1:300 | 1 |
| GLUT2 (H-67) | Santa Cruz Biotechnology | sc-9117 | Rabbit | 1:500 | 2 |
| 2ry anti-Rabbit IgG Alexa Fluor 488 | Life Technologies | a21206 | Donkey | 1:500 | 1 |
| GLUT5 (S-12) | Santa Cruz Biotechnology | sc-31846 | Rabbit | 1:500 | 2 |
| 2ry anti-Rabbit IgG Alexa Fluor 488 | Life Technologies | a21206 | Donkey | 1:500 | 1 |
SGLT, Na+- and glucose-linked transporter.
To study whether SGLT4 and -5 were expressed on the basolateral membrane, the same procedure for detection of luminal expression was used, except solutions were added to the basolateral bath. The primary antibodies used in this protocol were as follows: anti-SGLT4(S-14) (sc-162184, lot: A1910; Santa Cruz Biotechnology) and anti-SLC5A10 (EPR9573) (ab167156, lot: 4J062907DS; Abcam).
Immunofluorescence for GLUT2 and GLUT5.
Isolated S2 proximal tubules were transferred to a chamber on the stage of a Diaphot inverted microscope and perfused with phosphate-buffered saline (PBS). Then they were fixed with 4% paraformaldehyde in PBS (pH 7.4) for 30 min. Fixed tubules were washed three times with PBS, and both luminal and basolateral sides of the tubule were blocked for 30 min with 3% BSA in PBS. After being blocked, the luminal and basolateral sides of the proximal tubules were incubated with the primary antibody diluted 1:500 in 3% BSA in PBS for 2 h (Table 1). The tubule was then washed three times using PBS. Immediately after washing, the luminal and basolateral sides of the proximal tubules were incubated with a fluorophore-conjugated secondary antibody diluted 1:500 in 3% BSA in PBS for 2 h (Table 1). Finally, the tubule was washed three times with PBS. Fluorescent images of the proximal tubule were taken using a ×40 oil immersion objective, a Coolsnap HQ digital camera (Photometrics, Tucson, AZ), and Metafluor (v7) imaging software. The primary antibodies used in this protocol were as follows: anti-Glut2(H-67) (sc-9117, lot: F2013; Santa Cruz Biotechnology) and anti-Glut5(S-12) (sc-31846, lot: B0806; Santa Cruz Biotechnology).
Western blots.
Samples were prepared by dissolving fresh cortical tissue in cold lysis buffer (CelLytic M, C2978; Sigma-Aldrich, St. Louis, MO) supplemented with 1:100 protease inhibitor cocktail (P8340; Sigma-Aldrich) in a glass homogenizer. Lysates were centrifuged (5,000 g, 5 min, 4°C), the supernatant was recovered, and protein concentration was taken to 1 µg/µl by adding cold lysis buffer.
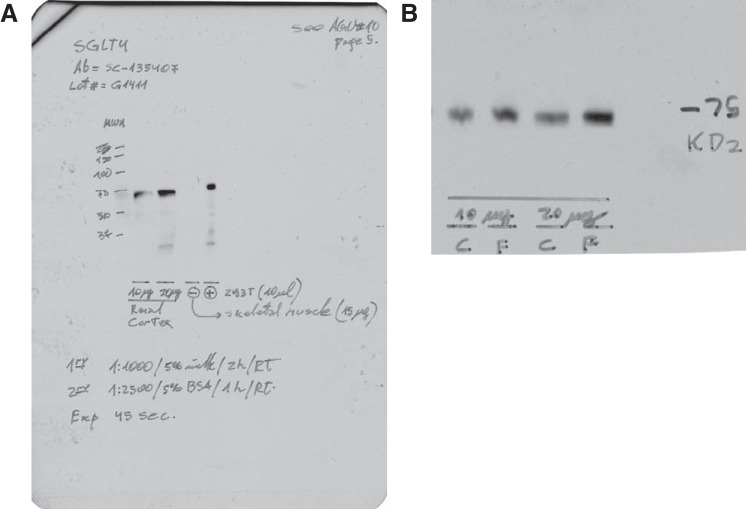
To measure SGLT4, two protein amounts per sample were loaded (10 and 20 µg) on 10% polyacrylamide gels. Electrophoresis was performed at 100 V, and proteins were transferred to a low-fluorescence polyvinylidene difluoride (PVDF) membrane (no. 162–0264; Bio-Rad) overnight. After transfer, Western blots were carried out using the anti-SGLT4(R-68) (sc-135407, lot: G1411; Santa Cruz Biotechnology) with its corresponding horseradish peroxidase (HRP)-conjugated secondary antibody, as detailed in Table 2. Next, the membranes were washed and incubated with a luminol-based chemiluminescent substrate for HRP (Luminata Classico; Millipore, Billerica, MA), blotted, and imaged. The intensities of the bands for the two protein amounts were measured and tested for linearity. The intensities were then standardized to the amount of protein loaded, and an average intensity was taken for each sample. Next, membranes were stripped and reblotted for β-tubulin as a loading control. The SGLT4 antibody was validated using five lines on a 10% gel as follows: 1) full-range molecular weight marker, 2) 10 µg of renal cortex lysate, 3) 20 µg of renal cortex lysate, 4) 15 µg of skeletal muscle used as negative control, and 5) 10 µl of 293T cells lysate (no. ab95494; Abcam) used as positive control Fig. 1.
Table 2.
Antibodies and conditions used for Western blotting
| Conditions |
|||||||
|---|---|---|---|---|---|---|---|
| Antibody | Provider | Catalog No. | Source | Blocking Buffer | Dilution | Buffer | Time, h |
| SGLT4 (R-68) | Santa Cruz Biotechnology | sc-135407 | Rabbit | 5% Milk | 1:1,000 | 5% Milk | 2 |
| SGLT5 | Abcam | ab167156 | Rabbit | 5% BSA | 1:20,000 | 5% BSA | 2 |
| GLUT2 (H-67) | Santa Cruz Biotechnology | sc-9117 | Rabbit | 5% BSA | 1:5,000 | 5% BSA | 2 |
| β-Tubulin | Abcam | ab6046 | Rabbit | 5% Milk | 1:10,000 | 5% Milk | 2 |
| GAPDH-HRP | Abcam | ab9485 | Rabbit | 5% BSA | 1:15,000 | 5% BSA | 2 |
| 2ry anti-Rabbit-HRP | GE Healthcare | NA9340V | Donkey | 1:2,500 | 5% BSA | 1 | |
SGLT, Na+- and glucose-linked transporter; GLUT2, glucose transporter 2; HRP, horseradish peroxidase; BSA, bovine serum albumin; milk, nonfat dehydrated bovine milk; buffer, Tris-buffered saline with Tween 20 (in mmol/l): 20 Tris (pH 7.6), 137 NaCl + 0.1% Tween 20.
Fig. 1.
Na+- and glucose-linked transporter (SGLT) 4 antibody validation. A: blot signal, using the conditions described in Table 2. Lane 1, full-range molecular weight marker; lane 2, 10 µg of renal cortex lysate; lane 3, 20 µg of renal cortex lysate; lane 4, 15 µg of skeletal muscle used as negative control; lane 5, 10 µl of 293T cell lysate (no. ab95494; Abcam) used as positive control. B: representative blot, using the conditions described in Table 2. Exposure time: 45 s.
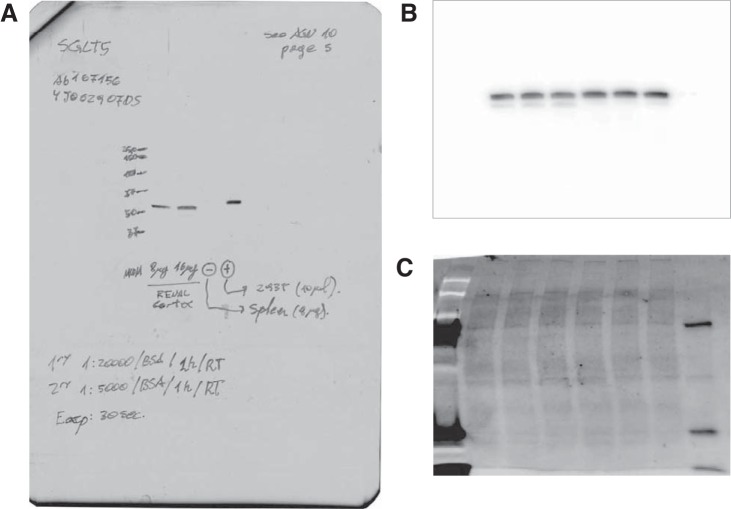
To measure SGLT5, 10 µg of protein were loaded in a 10% Stain-Free (no. 456–8034; Bio-Rad) polyacrylamide gel. The Control and study groups were loaded in duplicates in adjacent lines. Electrophoresis was performed at 100 V. After being run, the gels were illuminated at 302 nm for 5 min using the UV Override feature of the C600 imager (Azure Biosystems, Dublin, CA) to quantify protein loading by the Stain-Free method. Next, proteins were dry-transferred to a PVDF membrane using regular stack on the IBlot2 system (Invitrogen, Kiryat Shmona, Israel) and loading/transference check in the C600 imager again. Finally, Western blots for SGLT5 were carried out with the anti-SLC5A10 antibody (EPR9573) (ab167156, lot: 4J062907DS; Abcam) under the conditions depicted in Table 2. Membranes were imaged on the C600 imager and loading and transferring corrected by the Stain-Free signal. The SGLT5 antibody was validated using five lines on a 10% gel as follows: 1) full-range molecular weight marker, 2) 8 µg of renal cortex lysate, 3) 16 µg of renal cortex lysate, 4) 8 µg of spleen used as negative control, and 5) 10 µl of 293T cells lysate (no. ab95494; Abcam) used as positive control (Fig. 2).
Fig. 2.
Na+- and glucose-linked transporter (SGLT) 5 antibody validation. A: Western blot signal, using the conditions described in Table 2. Lane 1, full-range molecular weight marker; lane 2, 8 µg of renal cortex lysate; lane 3, 16 µg of renal cortex lysate; lane 4, 8 µg of spleen used as negative control; lane 5, 10 µl of 293T cell lysate (no. ab95494; Abcam) used as positive control. B: primary image of an experimental membrane captured on the C600 imager. Only the 4 inner lines were used for analysis (see Fig. 8). C: proteins transferred to membrane as measured by the Stain-Free methodology. Refer to methods for details.
To measure GLUT2, 10 µg protein were loaded on 7.5% polyacrylamide gels. Electrophoresis was performed at 100 V, and proteins were transferred overnight to a low-fluorescence 0.45-µm-pore size PVDF membrane (no. 162–0264; Bio-Rad, Hercules, CA). After being transferred, Western blots were carried out on the membranes using the anti-Glut2(H-67) (sc-9117, lot: F2013; Santa Cruz Biotechnology) with its corresponding HRP-conjugated secondary antibody, as detailed in Table 2. Next, the membranes were washed and incubated with a luminol-based chemiluminescent substrate for HRP (Luminata Classico; Millipore). Films were exposed for 3 min. Finally, membranes were stripped and reblotted for glyceraldehyde-3-phosphate dehydrogenase (GAPDH) as a loading control. This antibody has been extensively used before in several publications, including gut of different species and renal cells (25, 37), and no specificity issues were reported.
All films were scanned using an EPSON Expression 1680 scanner with EPSON-Scan software (positive film, 16-bit grayscale, 600 dpi). The densitometry of the bands on both films and the Typhoon files were measured using Image J 1.47p software. The average peak area of all experimental lanes in each membrane was calculated, and the peak areas of individual lanes were expressed as a fraction of this value. Results were expressed as SGLT4-to-β-tubulin and GLUT2-to-GAPDH ratios.
Statistics.
Data were analyzed using GraphPad Prism (V 6.02). Results are expressed as the arithmetic mean ± SE. For comparison of means, Student t-tests were used. The P values were calculated using two-tailed tests in all cases, and paired or unpaired tests were used where appropriate. A P value <0.05 was considered significant.
RESULTS
First we performed direct measurements of fructose reabsorption. S2 segments of isolated perfused rat proximal straight tubules reabsorbed fructose at a rate of 14.1 ± 1.5 pmol·mm−1·min−1 while reabsorbing fluid at a rate of 0.8 ± 0.2 nl·mm−1·min−1. Because both the luminal perfusion solution and the basolateral bath contained fructose, these results likely represent active transport of fructose from the lumen.
To study whether SGLTs or GLUTs mediated transport of fructose across the luminal membrane, we studied the effect of phlorizin, a nonselective SGLT inhibitor, on fructose reabsorption. During the control period, fructose reabsorption was 14.1 ± 1.5 pmol·mm−1·min−1. In the presence of 100 μmol/l phlorizin, fructose reabsorption was 4.9 ± 1.4 pmol·mm−1·min−1, 64% less than the control value (P < 0.008, n = 5; Fig. 3).
Fig. 3.
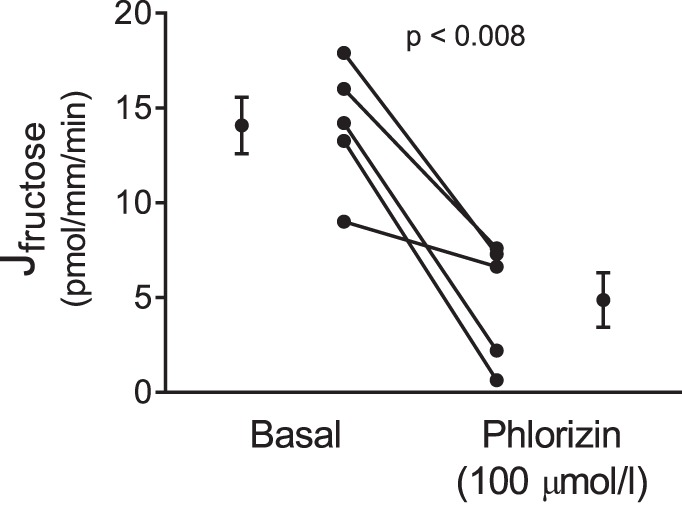
Effect of phlorizin on net fructose reabsorption (Jfructose) by isolated perfused rat proximal straight tubules from control animals (P < 0.008, n = 5).
All SGLTs depend on Na+ to transport sugar, and phlorizin is a rather nonselective transport inhibitor. Thus, we next tested whether Na+ removal would blunt active fructose reabsorption. In the absence of luminal Na+, fructose reabsorption was reduced by 86 ± 5% (P < 0.0001, n = 5; Fig. 4). The change in fructose concentration of the luminal perfusate after Na+ removal was not significantly different from zero. Taken together the data in Figs. 1 and 2 indicate that most fructose reabsorption is mediated by one of the SGLTs.
Fig. 4.
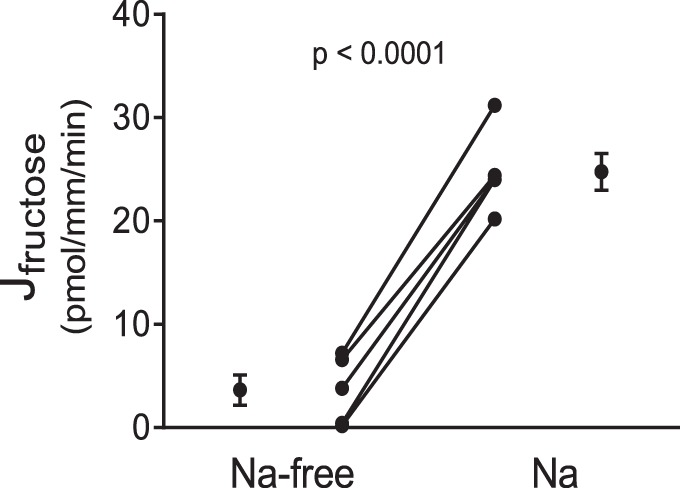
Effect of switching from a Na+-free to a Na+-containing perfusion solution on fructose reabsorption (Jfructose) by isolated perfused proximal straight tubules from control rats (P < 0.0001, n = 5).
SGLT4 and -5 both have the potential to transport fructose (13, 41). GLUT2 and GLUT5 mediate fructose reabsorption in the gut (6, 8, 12, 26). Thus, we studied the expression of these transporters by immunofluorescence. We found immunolocalization of SGLT4 and SGLT5 only in the luminal membrane (Figs. 5A and 3B, respectively). In contrast, GLUT2 was only localized to the basolateral membrane (Fig. 5C). We were unable to detect GLUT5 by immunofluorescence.
Fig. 5.
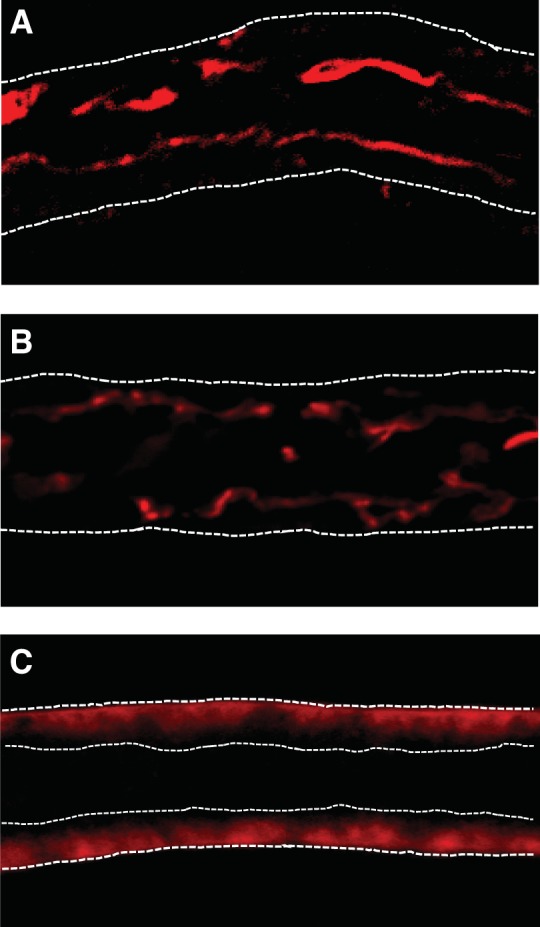
Immunofluorescent localization of Na+- and glucose-linked transporter (SGLT) 4, SGLT5, and glucose transporter (GLUT) 2 in isolated perfused rat proximal straight tubules. A: SGLT4 is localized to the luminal membrane of proximal tubules. B: luminal localization of SGLT5. C: GLUT2 is localized to the basolateral membrane. For A and B, white dashed lines outline the tubule. For C, white dashed lines outline the tubule and the lumen.
In the gastrointestinal track, a fructose-enriched diet increases fructose absorption. Thus, we studied the effect of such a diet on fructose reabsorption. We found that proximal tubules isolated from control rats reabsorbed fructose at a rate of 12.8 ± 2.5 pmol·mm−1·min−1 while those given 20% fructose in their drinking water for 1 wk reabsorbed fructose at a rate of 19.3 ± 0.5 pmol·mm−1·min−1, 51% greater than tubules from control rats (P < 0.03, n = 5; Fig. 6).
Fig. 6.
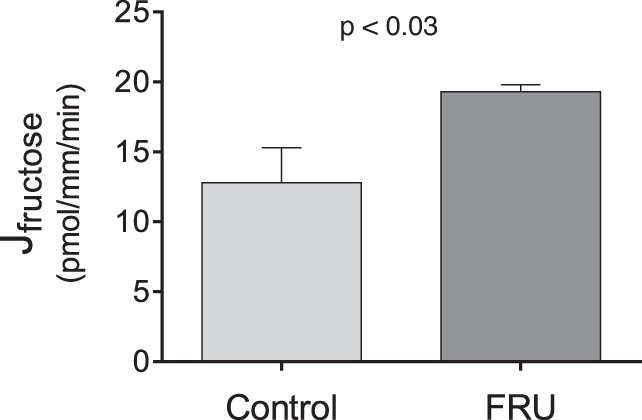
Fructose reabsorption (Jfructose) by isolated perfused rat proximal straight tubules from rats either drinking a 20% fructose beverage (FRU) or tap water (Control) (P < 0.03; n = 5).
Given that the fructose-enriched diet increased proximal tubule fructose reabsorption, we next measured the effect of this diet on SGLT4/5 and GLUT2 expression. We found that 20% fructose in the drinking water enhanced the SGLT4-to-tubulin ratio from 0.59 ± 0.05 to 1.40 ± 0.06 (P < 0.01, n = 5 for each group; Fig. 7), the SGLT5-to-total protein ratio from 0.85 ± 0.05 to 1.17 ± 0.07 (P < 0.04, n = 8 for each group; Fig. 8), and the GLUT2-to-GAPDH ratio from 0.72 ± 0.18 to 1.35 ± 0.08 (P < 0.02, n = 4 for each group; Fig. 9).
Fig. 7.
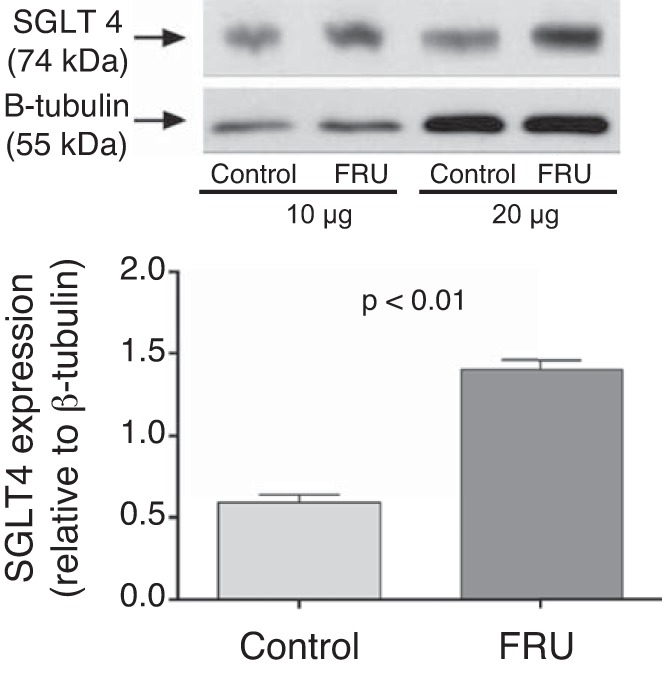
Na+- and glucose-linked transporter (SGLT) 4 expression in freshly isolated renal cortexes from rats either drinking a 20% fructose beverage (FRU) or tap water (Control) ( n = 5).
Fig. 8.
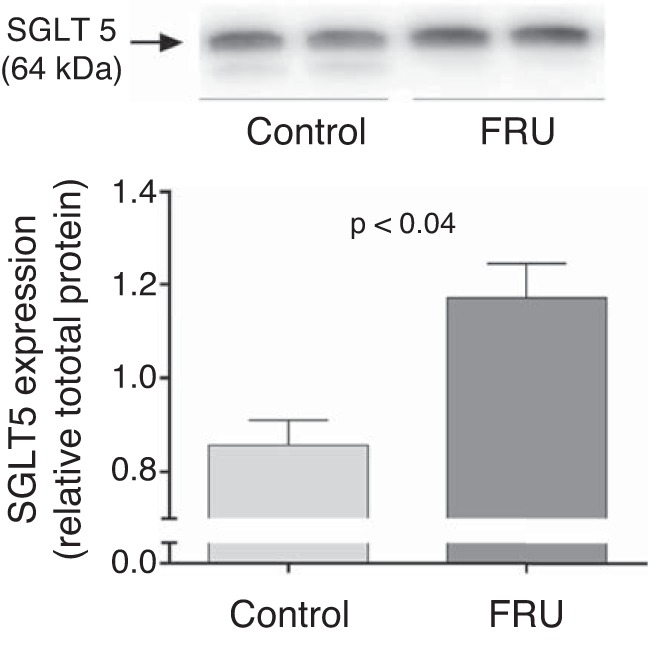
Na+- and glucose-linked transporter (SGLT) 5 expression in freshly isolated renal cortexes from rats either drinking a 20% fructose beverage (FRU) or tap water (Control) (n = 8). Total protein per line was measured on the membrane using Stain-Free protein detection as explained in methods.
Fig. 9.
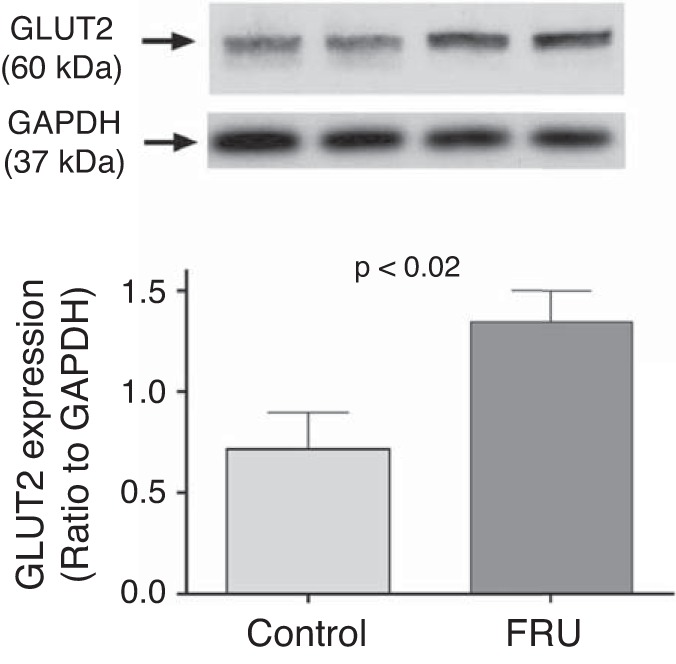
Glucose transporter (GLUT) 2 expression in freshly isolated renal cortexes from rats either drinking a 20% fructose beverage (FRU) or tap water (Control) (n = 4).
DISCUSSION
Here we report for the first time direct measurements of fructose reabsorption by the proximal tubule and the mechanisms involved. We found that the S2 segment of the proximal tubule reabsorbs fructose and that this process is inhibited by 85% by removing Na+ from the luminal perfusion solution and blunted by the SGLT inhibitor phlorizin by ~75%. Given this, our data indicate that one or more of the SGLTs mediate most of fructose transport across the luminal membrane of proximal tubule cells. Because SGLT1 and SGLT2 do not transport appreciable amounts of fructose, we investigated the possible role of SGLT4 and SGLT5. We found that SGLT4 and SGLT5 are localized to the luminal but not basolateral membranes of S2 segments. This is the first report of SGLT4 and SGLT5 localizations. Thus, it is likely that these SGLTs mediate most fructose entry in proximal tubule cells.
In good agreement with previously published data (27, 40, 42), we found that GLUT2, but not GLUT5, is expressed in the basolateral membrane of the S2 portion of proximal tubules. Thus, GLUT2 likely mediates fructose exit from proximal tubule cells in the blood. Because sugar transit through GLUT2 is a passive facilitated diffusion process, fructose exit though these carriers would require an intracellular concentration of fructose greater than that of the blood. There are two models that can meet these conditions. One model requires the entry of fructose in the cell across the luminal membrane against a chemical gradient. Such a process would be energetically unfavorable; thus, it must either be linked to the transport of another solute or be energized by ATP hydrolysis. Our data indicate that, in the S2 portion of the proximal tubule, addition of phlorizin or removal of Na+ from the lumen largely inhibits fructose clearance from the luminal solution. Thus, in this segment, fructose likely enters the cell though SGLTs driven by the Na+ electrochemical gradient. An alternative model in which fructose enters the cell passively via facilitated diffusion through GLUT5 would only work when the concentration of fructose in the lumen of the tubule is greater than that of the interior of the cell, and the intracellular concentration greater than that of blood. These conditions would seem only to be possible in later segments of the proximal tubule, i.e., S3, given the concentrating effect of fluid reabsorption occurring in S1 and S2. Not surprisingly, the S3 portion of the nephron expresses GLUT2 and GLUT5 (39) and presents lower paracellular permeability than the S1 and S2 segments (35), which would favor the transcellular reabsorption of fructose. Supporting this idea, GLUT5 expression was found increased in the S3 segment of rats given fructose for 6 wk (31).
A limitation of all models based on passive fructose exit through GLUT2 is that they require the intracellular fructose concentration to be greater than the interstitium. Because proximal tubules express fructokinase (9, 11) it is unclear if this condition can be met. Determining how much fructose is metabolized by proximal tubules and how much is returned to the blood as fructose is not a problem that can be easily solved. However, it is an important area for investigation.
Our data show that 65–85% of fructose reabsorption in S2 can be inhibited by either Na+ removal from the perfusate or phlorizin, an SGLT blocker. Furthermore, in the S2 segment, we found no evidence of apical expression of either GLUT2 or GLUT5, the only GLUTs known to be expressed in proximal tubules. Thus, there is no passive mechanism to facilitate fructose movement across the brush-border membrane in S2 proximal tubule cells. Taken together, these data suggest that essentially all fructose reabsorption occurs in S2 though the Na+-fructose symporters SGLT4 or SGLT5. In native isolated perfused tubules that closely represent the in vivo state, it would be difficult, if not impossible, to assess the contribution of each transporter to fructose reabsorption. The selectivity sequence for monosaccharides is the same (21, 41), limiting the usefulness of competition studies. Even if we were able to specifically inhibit one of the transporters, substrate activation of the remaining would overestimate its fraction contribution to total fructose reabsorption.
The small remaining rates of fructose reabsorption in both the phlorizin and Na+ removal experiments may be explained by: 1) the luminal perfusate not being 100% Na+-free because of back flux of Na+ from the basolateral bath, 2) incomplete inhibition by phlorizin, and/or 3) reabsorption of fructose via the paracellular pathway caused by solvent drag as occurs with other solutes and sugars (20, 35).
In addition to the aforementioned mechanism, we were able to demonstrate that fructose reabsorption in the S2 portion of the proximal tubule is stimulated by a fructose-enriched diet by ~50%. These are the first direct measurements of fructose reabsorption showing such an effect and may at least partially explain why elevated dietary fructose increases plasma fructose concentrations, even in the face of stimulated metabolism by the liver. Our data indicate that SGLT4, SGLT5, and GLUT2 expression are all enhanced by this diet. These data suggest that the increase in proximal tubule fructose reabsorption in these animals could be mediated by an increase in fructose transporters. To our knowledge, this is the first report on the effects of dietary fructose on SGLT4 and -5 expressions. However, novelty comes at the price of not having antibodies largely validated by other investigators. We followed closely recent recommendations for the use of antibodies in physiology studies (4) to address this issue. Because we were unable to obtain knockout animals, we used tissues known not to express the protein of interest instead. In the case of SGLT5, we have also reproduced preliminary data obtained with a different antibody. With respect to our GLUT2 findings, they are similar to previous reports showing that increasing dietary sugar consumption enhances GLUT2 expression in other tissues (10, 19).
Given that the absolute rate of fructose reabsorption by proximal tubules from rats on the fructose regime was ~20 pmol·mm−1·min−1, similar in magnitude to the one measured in Control tubules after adding Na+ in the Na+ removal experiments, one might well ask how we can conclude that dietary fructose stimulates fructose reabsorption. The likely explanation for this is as follows. In the experiments designed to test whether fructose reabsorption was Na+ dependent, tubules were initially perfused with a Na+-free solution. This would have caused both the electrical and chemical gradients that drive Na+ entry to increase. Next, when Na+ was returned, SGLT activity would have been enhanced because of the elevated electrochemical Na+ gradient, which would drive fructose reabsorption above the basal rates reported in all other experiments. Supporting this view, the basal fructose reabsorption rates from Control tubules found by different investigators were very similar and close (13 pmol·mm−1·min−1). This is not surprising, since transporters normally work at or below half-maximal velocities under basal conditions.
In summary, we provided for the first time direct evidence for fructose reabsorption by the proximal tubule and the likely involved transporters. We also show for the first time that a fructose-enriched diet stimulates proximal tubule fructose reabsorption likely by increases in SGLT4, SGLT5, and GLUT2 expression. Augmented fructose reabsorption caused by a fructose-enriched diet may contribute to the pathologies caused by such a diet.
GRANTS
This work was supported in part by NIH Grants HL-128053 and DK-07470.
DISCLOSURES
No conflicts of interest, financial or otherwise, are declared by the authors.
AUTHOR CONTRIBUTIONS
A.G.-V., P.D.C., N.J.H., and J.L.G. conceived and designed research; A.G.-V., P.D.C., N.J.H., J.A., and J.L.G. performed experiments; A.G.-V., P.D.C., N.J.H., J.A., F.S., and J.L.G. analyzed data; A.G.-V., P.D.C., N.J.H., F.S., and J.L.G. interpreted results of experiments; A.G.-V., P.D.C., N.J.H., and J.L.G. prepared figures; A.G.-V., P.D.C., N.J.H., and J.L.G. drafted manuscript; A.G.-V., P.D.C., N.J.H., and J.L.G. edited and revised manuscript; A.G.-V., P.D.C., N.J.H., and J.L.G. approved final version of manuscript.
ACKNOWLEDGMENTS
Present address of P. D. Cabral: Cardio-Renal, Eye & Metabolic Disorders, Merck Research Laboratories, 630 Gateway Blvd., South San Francisco, CA 94080.
REFERENCES
- 1.Balen D, Ljubojevic M, Breljak D, Brzica H, Zlender V, Koepsell H, Sabolic I. Revised immunolocalization of the Na+-D-glucose cotransporter SGLT1 in rat organs with an improved antibody. Am J Physiol Cell Physiol 295: C475–C489, 2008. doi: 10.1152/ajpcell.00180.2008. [DOI] [PubMed] [Google Scholar]
- 2.Beierwaltes W, Ismail A, Szandzik D, Garvin J, Ortiz P.. A fructose enriched diet (20%) induces salt-sensitive hypertension and prevents salt-induced decrease in plasma renin (Abstract) FASEB J 29: 260.6, 2015. [Google Scholar]
- 3.Björkman O, Felig P. Role of the kidney in the metabolism of fructose in 60-hour fasted humans. Diabetes 31: 516–520, 1982. doi: 10.2337/diab.31.6.516. [DOI] [PubMed] [Google Scholar]
- 4.Brooks HL, Lindsey ML. Guidelines for authors and reviewers on antibody use in physiology studies. Am J Physiol Heart Circ Physiol 314: H724–H732, 2018. doi: 10.1152/ajpheart.00512.2017. [DOI] [PMC free article] [PubMed] [Google Scholar]
- 5.Burant CF, Saxena M. Rapid reversible substrate regulation of fructose transporter expression in rat small intestine and kidney. Am J Physiol Gastrointest Liver Physiol 267: G71–G79, 1994. doi: 10.1152/ajpgi.1994.267.1.G71. [DOI] [PubMed] [Google Scholar]
- 6.Burant CF, Takeda J, Brot-Laroche E, Bell GI, Davidson NO. Fructose transporter in human spermatozoa and small intestine is GLUT5. J Biol Chem 267: 14523–14526, 1992. [PubMed] [Google Scholar]
- 7.Cabral PD, Hong NJ, Hye Khan MA, Ortiz PA, Beierwaltes WH, Imig JD, Garvin JL. Fructose stimulates Na/H exchange activity and sensitizes the proximal tubule to angiotensin II. Hypertension 63: e68–e73, 2014. doi: 10.1161/HYPERTENSIONAHA.113.02564. [DOI] [PubMed] [Google Scholar]
- 8.Cheeseman CI. GLUT2 is the transporter for fructose across the rat intestinal basolateral membrane. Gastroenterology 105: 1050–1056, 1993. doi: 10.1016/0016-5085(93)90948-C. [DOI] [PubMed] [Google Scholar]
- 9.Cirillo P, Gersch MS, Mu W, Scherer PM, Kim KM, Gesualdo L, Henderson GN, Johnson RJ, Sautin YY. Ketohexokinase-dependent metabolism of fructose induces proinflammatory mediators in proximal tubular cells. J Am Soc Nephrol 20: 545–553, 2009. doi: 10.1681/ASN.2008060576. [DOI] [PMC free article] [PubMed] [Google Scholar]
- 10.Cui XL, Jiang L, Ferraris RP. Regulation of rat intestinal GLUT2 mRNA abundance by luminal and systemic factors. Biochim Biophys Acta 1612: 178–185, 2003. doi: 10.1016/S0005-2736(03)00129-9. [DOI] [PubMed] [Google Scholar]
- 11.Diggle CP, Shires M, Leitch D, Brooke D, Carr IM, Markham AF, Hayward BE, Asipu A, Bonthron DT. Ketohexokinase: expression and localization of the principal fructose-metabolizing enzyme. J Histochem Cytochem 57: 763–774, 2009. doi: 10.1369/jhc.2009.953190. [DOI] [PMC free article] [PubMed] [Google Scholar]
- 12.Douard V, Ferraris RP. Regulation of the fructose transporter GLUT5 in health and disease. Am J Physiol Endocrinol Metab 295: E227–E237, 2008. doi: 10.1152/ajpendo.90245.2008. [DOI] [PMC free article] [PubMed] [Google Scholar]
- 13.Fukuzawa T, Fukazawa M, Ueda O, Shimada H, Kito A, Kakefuda M, Kawase Y, Wada NA, Goto C, Fukushima N, Jishage K, Honda K, King GL, Kawabe Y. SGLT5 reabsorbs fructose in the kidney but its deficiency paradoxically exacerbates hepatic steatosis induced by fructose. PLoS One 8: e56681, 2013. doi: 10.1371/journal.pone.0056681. [DOI] [PMC free article] [PubMed] [Google Scholar]
- 14.García NH, Plato CF, Garvin JL, García NH. Fluorescent determination of chloride in nanoliter samples. Kidney Int 55: 321–325, 1999. doi: 10.1046/j.1523-1755.1999.00239.x. [DOI] [PubMed] [Google Scholar]
- 15.Gonzalez-Vicente A, Cabral PD, Hong NJ, Asirwatham J, Yang N, Berthiaume JM, Dominici FP, Garvin JL. Dietary fructose enhances the ability of low concentrations of angiotensin II to stimulate proximal tubule Na+ reabsorption. Nutrients 9: 885, 2017. doi: 10.3390/nu9080885. [DOI] [PMC free article] [PubMed] [Google Scholar]
- 16.Gonzalez-Vicente A, Garvin JL, Hopfer U. Transcriptome signature for dietary fructose-specific changes in rat renal cortex: A quantitative approach to physiological relevance. PLoS One 13: e0201293, 2018. doi: 10.1371/journal.pone.0201293. [DOI] [PMC free article] [PubMed] [Google Scholar]
- 17.Gonzalez-Vicente A, Hong NJ, Yang N, Cabral PD, Berthiaume JM, Dominici FP, Garvin JL. Dietary fructose increases the sensitivity of proximal tubules to angiotensin II in rats fed high-salt diets. Nutrients 10: 1244, 2018. doi: 10.3390/nu10091244. [DOI] [PMC free article] [PubMed] [Google Scholar]
- 18.Gordish KL, Kassem KM, Ortiz PA, Beierwaltes WH. Moderate (20%) fructose-enriched diet stimulates salt-sensitive hypertension with increased salt retention and decreased renal nitric oxide. Physiol Rep 5: e13162, 2017. doi: 10.14814/phy2.13162. [DOI] [PMC free article] [PubMed] [Google Scholar]
- 19.Gouyon F, Caillaud L, Carriere V, Klein C, Dalet V, Citadelle D, Kellett GL, Thorens B, Leturque A, Brot-Laroche E. Simple-sugar meals target GLUT2 at enterocyte apical membranes to improve sugar absorption: a study in GLUT2-null mice. J Physiol 552: 823–832, 2003. doi: 10.1113/jphysiol.2003.049247. [DOI] [PMC free article] [PubMed] [Google Scholar]
- 20.Green R, Giebisch G. Reflection coefficients and water permeability in rat proximal tubule. Am J Physiol Renal Fluid Electrolyte Physiol 257: F658–F668, 1989. doi: 10.1152/ajprenal.1989.257.4.F658. [DOI] [PubMed] [Google Scholar]
- 21.Grempler R, Augustin R, Froehner S, Hildebrandt T, Simon E, Mark M, Eickelmann P. Functional characterisation of human SGLT-5 as a novel kidney-specific sodium-dependent sugar transporter. FEBS Lett 586: 248–253, 2012. doi: 10.1016/j.febslet.2011.12.027. [DOI] [PubMed] [Google Scholar]
- 22.Hwang IS, Ho H, Hoffman BB, Reaven GM. Fructose-induced insulin resistance and hypertension in rats. Hypertension 10: 512–516, 1987. doi: 10.1161/01.HYP.10.5.512. [DOI] [PubMed] [Google Scholar]
- 23.Kanai Y, Lee WS, You G, Brown D, Hediger MA. The human kidney low affinity Na+/glucose cotransporter SGLT2. Delineation of the major renal reabsorptive mechanism for D-glucose. J Clin Invest 93: 397–404, 1994. doi: 10.1172/JCI116972. [DOI] [PMC free article] [PubMed] [Google Scholar]
- 24.Laughlin MR. Normal roles for dietary fructose in carbohydrate metabolism. Nutrients 6: 3117–3129, 2014. doi: 10.3390/nu6083117. [DOI] [PMC free article] [PubMed] [Google Scholar]
- 25.Lewko B, Bryl E, Witkowski JM, Latawiec E, Angielski S, Stepinski J. Mechanical stress and glucose concentration modulate glucose transport in cultured rat podocytes. Nephrol Dial Transplant 20: 306–311, 2005. doi: 10.1093/ndt/gfh612. [DOI] [PubMed] [Google Scholar]
- 26.Manolescu AR, Witkowska K, Kinnaird A, Cessford T, Cheeseman C. Facilitated hexose transporters: new perspectives on form and function. Physiology (Bethesda) 22: 234–240, 2007. doi: 10.1152/physiol.00011.2007. [DOI] [PubMed] [Google Scholar]
- 27.Marks J, Carvou NJ, Debnam ES, Srai SK, Unwin RJ. Diabetes increases facilitative glucose uptake and GLUT2 expression at the rat proximal tubule brush border membrane. J Physiol 553: 137–145, 2003. doi: 10.1113/jphysiol.2003.046268. [DOI] [PMC free article] [PubMed] [Google Scholar]
- 28.Marriott BP, Olsho L, Hadden L, Connor P. Intake of added sugars and selected nutrients in the United States, National Health and Nutrition Examination Survey (NHANES) 2003-2006. Crit Rev Food Sci Nutr 50: 228–258, 2010. doi: 10.1080/10408391003626223. [DOI] [PubMed] [Google Scholar]
- 29.Miyamoto K, Hase K, Takagi T, Fujii T, Taketani Y, Minami H, Oka T, Nakabou Y. Differential responses of intestinal glucose transporter mRNA transcripts to levels of dietary sugars. Biochem J 295: 211–215, 1993. doi: 10.1042/bj2950211. [DOI] [PMC free article] [PubMed] [Google Scholar]
- 30.Montonen J, Järvinen R, Knekt P, Heliövaara M, Reunanen A. Consumption of sweetened beverages and intakes of fructose and glucose predict type 2 diabetes occurrence. J Nutr 137: 1447–1454, 2007. doi: 10.1093/jn/137.6.1447. [DOI] [PubMed] [Google Scholar]
- 31.Nakayama T, Kosugi T, Gersch M, Connor T, Sanchez-Lozada LG, Lanaspa MA, Roncal C, Perez-Pozo SE, Johnson RJ, Nakagawa T. Dietary fructose causes tubulointerstitial injury in the normal rat kidney. Am J Physiol Renal Physiol 298: F712–F720, 2010. doi: 10.1152/ajprenal.00433.2009. [DOI] [PMC free article] [PubMed] [Google Scholar]
- 32.Noelting J, DiBaise JK. Mechanisms of fructose absorption. Clin Transl Gastroenterol 6: e120, 2015. doi: 10.1038/ctg.2015.50. [DOI] [Google Scholar]
- 33.Ogden CL, Kit BK, Carroll MD, Park S. Consumption of sugar drinks in the United States, 2005-2008. NCHS Data Brief (71): 1–8, 2011. [PubMed] [Google Scholar]
- 34.Sabolić I, Skarica M, Gorboulev V, Ljubojević M, Balen D, Herak-Kramberger CM, Koepsell H. Rat renal glucose transporter SGLT1 exhibits zonal distribution and androgen-dependent gender differences. Am J Physiol Renal Physiol 290: F913–F926, 2006. doi: 10.1152/ajprenal.00270.2005. [DOI] [PubMed] [Google Scholar]
- 35.Schafer JA. Transepithelial osmolality differences, hydraulic conductivities, and volume absorption in the proximal tubule Annu Rev Physiol 52: 709–726, 1990. doi: 10.1146/annurev.ph.52.030190.003425. [DOI] [PubMed] [Google Scholar]
- 36.Shibazaki T, Tomae M, Ishikawa-Takemura Y, Fushimi N, Itoh F, Yamada M, Isaji M. KGA-2727, a novel selective inhibitor of a high-affinity sodium glucose cotransporter (SGLT1), exhibits antidiabetic efficacy in rodent models. J Pharmacol Exp Ther 342: 288–296, 2012. doi: 10.1124/jpet.112.193045. [DOI] [PubMed] [Google Scholar]
- 37.Silva E, Soares-da-Silva P. Protein cytoskeleton and overexpression of Na(+),K(+)-ATPase in opossum kidney cells. J Cell Physiol 221: 318–324, 2009. doi: 10.1002/jcp.21853. [DOI] [PubMed] [Google Scholar]
- 38.Sluik D, Engelen AI, Feskens EJ. Fructose consumption in the Netherlands: the Dutch National Food Consumption Survey 2007-2010. Eur J Clin Nutr 69: 475–481, 2015. doi: 10.1038/ejcn.2014.267. [DOI] [PubMed] [Google Scholar]
- 39.Sugawara-Yokoo M, Suzuki T, Matsuzaki T, Naruse T, Takata K. Presence of fructose transporter GLUT5 in the S3 proximal tubules in the rat kidney. Kidney Int 56: 1022–1028, 1999. doi: 10.1046/j.1523-1755.1999.00635.x. [DOI] [PubMed] [Google Scholar]
- 40.Takata K, Kasahara T, Kasahara M, Ezaki O, Hirano H. Localization of Na(+)-dependent active type and erythrocyte/HepG2-type glucose transporters in rat kidney: immunofluorescence and immunogold study. J Histochem Cytochem 39: 287–298, 1991. doi: 10.1177/39.3.1993828. [DOI] [PubMed] [Google Scholar]
- 41.Tazawa S, Yamato T, Fujikura H, Hiratochi M, Itoh F, Tomae M, Takemura Y, Maruyama H, Sugiyama T, Wakamatsu A, Isogai T, Isaji M. SLC5A9/SGLT4, a new Na+-dependent glucose transporter, is an essential transporter for mannose, 1,5-anhydro-D-glucitol, and fructose. Life Sci 76: 1039–1050, 2005. doi: 10.1016/j.lfs.2004.10.016. [DOI] [PubMed] [Google Scholar]
- 42.Thorens B, Lodish HF, Brown D. Differential localization of two glucose transporter isoforms in rat kidney. Am J Physiol Cell Physiol 259: C286–C294, 1990. doi: 10.1152/ajpcell.1990.259.2.C286. [DOI] [PubMed] [Google Scholar]
- 43.Vallon V, Platt KA, Cunard R, Schroth J, Whaley J, Thomson SC, Koepsell H, Rieg T. SGLT2 mediates glucose reabsorption in the early proximal tubule. J Am Soc Nephrol 22: 104–112, 2011. doi: 10.1681/ASN.2010030246. [DOI] [PMC free article] [PubMed] [Google Scholar]
- 44.Vos MB, Kimmons JE, Gillespie C, Welsh J, Blanck HM. Dietary fructose consumption among US children and adults: the Third National Health and Nutrition Examination Survey. Medscape J Med 10: 160, 2008. [PMC free article] [PubMed] [Google Scholar]


