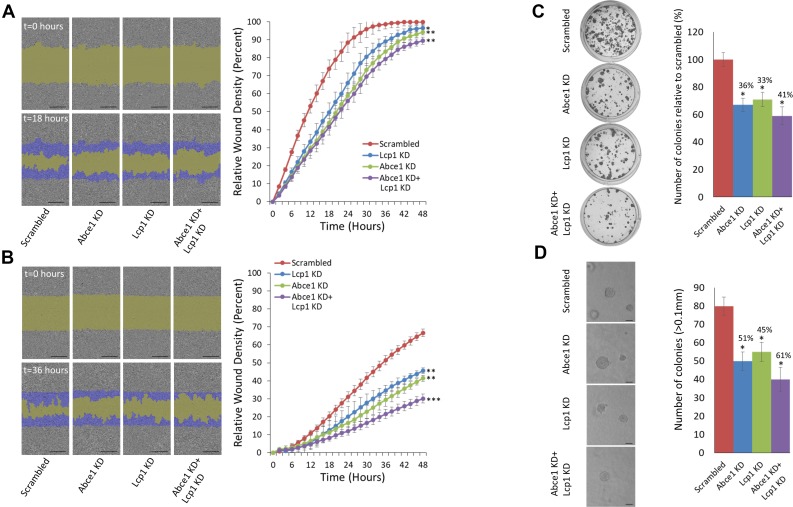
Figure 3. Simultaneous knockdown of LCP1 and ABCE1 has an additive effect on reduction of migration and invasion of 4T1 breast cancer cells.
(A) Representative images of a migration assay (left) and mean scratch area closure over time (right). The upper row represents time 0 and the bottom row represents 18 hours post-scratch. HS578 cells (expressing scrambled, ABCE1 KD, LCP1 KD, or ABCE1 KD + LCP1 KD) are shown in gray, the green area represents the scratch, and migrating cells are indicated in dark blue. The migration assay mean scratch area closure over time reveals a delay in the rate of migration of cells that underexpress ABCE1, LCP1 or both compared to the scrambled control. Data for each time point is presented as mean ± SEM *p < 0.05 **p < 0.01. Scale bars represent 300 µm. (B) Representative images of an invasion assay (left) and mean scratch area closure over time (right). The upper image represents time 0 and the bottom image represents 36 hours post-scratch. Invading HS578 cells (expressing scrambled, ABCE1 KD, LCP1 KD, or ABCE1 KD + LCP1 KD) are indicated in dark blue. The invasion assay mean scratch area closure over time demonstrates slower invasion rates of cells with LCP1 KD compared to Scrambled and an additive effect of dual ABCE1 and LCP1 KD compared to knockdown of each gene individually. Data for each time point is presented as mean ± SEM **p < 0.01 ***p < 0.005. (C) Representative images (left) and quantification (right) of colony formation assays in 4T1 cells. (D) Representative images (left) and quantification (right) of colony numbers from anchorage-independent growth assays in 4T1 cells. Colonies were counted at 10× magnification using a phase contrast microscope. Only colonies larger than 0.1 mm in diameter were counted. Scale bars represent 200 µm. Both assays show that knockdown of either ABCE1 or LCP1 reduces colony formation, and simultaneous knockdown of both genes further reduces colony formation. Data are presented as mean ± SEM. *p < 0.05.

