Abstract
Although vein bypass grafting is one of the primary options for the treatment of arterial occlusive disease and provides satisfactory results at an early stage of the treatment, the patency is limited to a few months in many patients. When the vein is implanted in the arterial system, it adapts to the high flow rate and high pressure of the arterial environment by changing the sizes of its layers, and this remodeling is believed to be a precursor of future graft failure. Hemodynamic forces, such as wall shear stress (WSS) and wall tension, have been recognized as major factors impacting vein graft remodeling. Although a wide range of experimental evidence relating hemodynamic forces to vein graft remodeling has been reported, a comprehensive mathematical model describing the relationship among WSS, wall tension, and the structural adaptation of each individual layer of the vein graft wall is lacking. The current manuscript presents a comprehensive and robust framework for treating the complex interaction between the WSS, wall tension, and the structural adaptation of each individual layer of the vein graft wall. We modeled the intimal and medial area and the radius of external elastic lamina, which in combination dictate luminal narrowing and the propensity for graft occlusion. Central to our model is a logistic relationship between independent and dependent variables to describe the initial increase and later decrease in the growth rate. The detailed understanding of the temporal changes in vein graft morphology that can be extracted from the current model is critical in identifying the dominant contributions to vein graft failure and the further development of strategies to improve their longevity.
Keywords: Hemodynamics, Shear stress, Wall tension, Intimal hyperplasia, Vein graft, Vascular remodeling
1. Introduction
Vein bypass grafting is one of the primary options for the treatment of arterial occlusive disease. Although vein grafts provide immediate improvement in distal perfusion, a recent study showed that, for lower extremity grafts, the primary patency rate was only 59.5% at 1year after surgery (Conte et al. 2006). The acute transposition of a vein segment from a low pressure and flow environment to the high pressure and flow arterial system leads to significant structural changes within the wall. These changes are characterized by an increase in both intimal and medial thicknesses, a burst of smooth muscle cell proliferation with conversion from a contractile to synthetic phenotype, and the extracellular deposition of type I collagen and proteoglycans. These early events in vein graft adaptation frequently continue in an uncontrolled manner, leading to severe lumen narrowing and subsequent graft failure (Bhardwaj et al. 2008; Mann 2004; Schwartz 1999). Shear stress has been recognized as one of the major hemodynamic factors which modulate vein graft remodeling. Since the initial report of Grondin et al. (1971), which identified flow rate as an important determinant of early aorto-coronary vein graft failure, a range of animal and human-based studies have confirmed the correlation between low wall shear, accelerated lumen loss, and reduced vein graft patency (Berguer et al. 1980; Dobrin et al. 1989; Galt et al. 1993; Jiang et al. 2004). Less well studied, but also recognized as a important regulator of vascular remodeling is intramural wall tension. In vitro studies have shown that the magnitude of cyclic strain is an important regulator of smooth muscle cell proliferation and matrix metabolism (Mai et al. 2002; Sumpio and Banes 1988). Subsequent in vivo studies have demonstrated that the increased wall tension induced following vein graft implantation leads to thickening of the media and a reduction in intramural wall stress to a level equal to that of normal artery (Schwartz et al. 1992; Zwolak 1987).
Notable to vein graft implantation is the injury that occurs simultaneous to the transposition of the conduit into an altered hemodynamic environment. In response to the damage, a coordinated series of repair events, including leukocyte recruitment, re-endothelialization, smooth muscle cell proliferation, and matrix deposition, occur in a time framing ranging from hours to months. Invariably, the imposed hemodynamics modulate each of these processes in a unique manner, such that the effect of an altered shear stress (or wall tension) during the initial hours to days after graft placement is notably different from the influence that this same force would have much later in the adaptation process. This temporal dependence between the local hemodynamic environment and the response of the vascular wall is frequently lacking from models that have been developed to quantitatively examine the morphologic changes that characterize the remodeling process, and this is the focus of the current manuscript. Although numerous experimental evidences relating hemodynamic forces to vein graft remodeling have been reported, a comprehensive mathematical model describing the relationship among the wall shear stress (WSS), wall tension, and the remodeling of each individual wall layer of vein graft is lacking. In the current manuscript, we present the mathematical relationships for vein graft remodeling based on experimental data from our well-characterized rabbit model. Founded on the previous work of our group (Fernandez et al. 2004), which focused exclusively on the influence of shear stress on intimal adaptation, the current model examines the coordinated changes in intimal and medial area and the radius of external elastic lamina (EEL). Also unique in the current model is the integration of a logistic relationship between independent and dependent variables to describe the early acceleration and later reduction in the rate of adaptation. The detailed understanding of the temporal changes in vein graft morphology that can be extracted from the current model is critical in identifying the dominant contributions to vein graft failure and enhancing further development of strategies to improve their longevity.
2. Model development
2.1. Animal experiments of vein graft remodeling
Experimental data used in the model development were obtained using a rabbit bilateral vein graft construct, as previously described (Jiang et al. 2004, 2009). Briefly, New Zealand White rabbits (3.0–3.5kg) underwent bilateral jugular vein interposition grafting and unilateral distal carotid artery branch ligation to create two distinct flow (Bhardwaj et al. 2008). Differential flows between the right and left vein grafts were accomplished via ligation of the internal carotid and three of the four primary branches of the external carotid artery, resulting in an immediate sixfold difference in blood flow. A segment of the vein was retained at the time of implantation for baseline morphometric measurements. Vein grafts were harvested at 1 (n = 8), 3 (n = 7), 7(n = 8), 14 (n = 5), 28 (n = 6), 90 (n = 6), and 180 (n = 3) days after implantation, fixed in 10% formalin, and paraffin embedded. Graft flow rate and intraluminal pressure were measured at graft harvest using an ultrasound flow meter (Transonics, Ithica, NY) and micro-tip catheter transducer (Millar, Houston, TX), respectively. Morphologic analyses (Axiovision, Zeiss) were completed using in vivo external graft diameter and cross-sectional measurements on Masson stained specimens, as previously described (Fernandez et al. 2004). Mean circumferential wall stress (T) was estimated, neglecting the time-dependent component of the intraluminal pressure waveform, using the equation T = P R / h, where P is the mean intraluminal pressure, R is the lumen radius, and h is the wall thickness. Shear stress was calculated from the measured flow rate assuming steady-state Poiseuille flow.
2.2. Mathematical model of vein graft remodeling
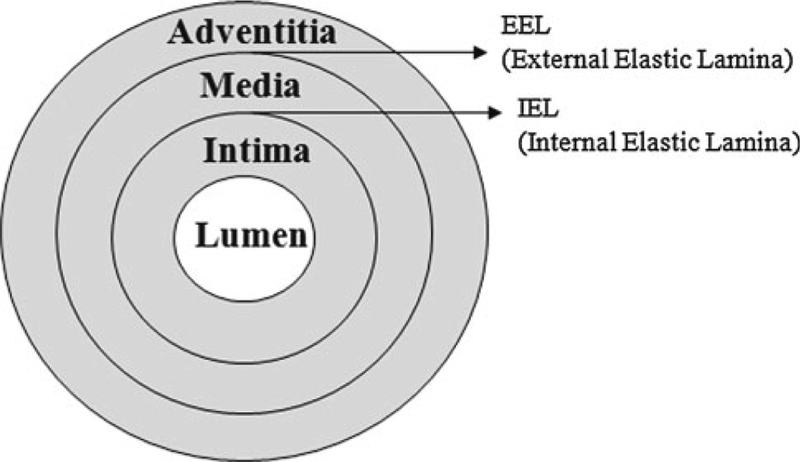
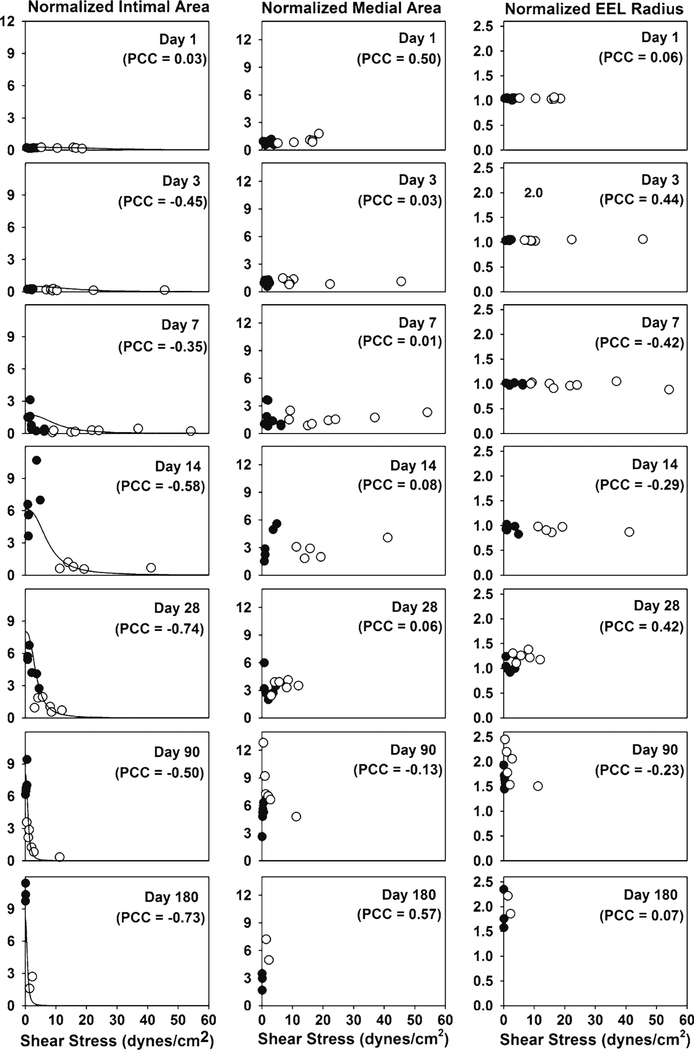
Previously, we presented a mathematical model of intimal layer remodeling (Tran-Son-Tay et al. 2008), expressing the rate of intimal change as an exponential function of shear stress and time. While valid in the initial 28days after graft implantation, further examination of these exponential relationships using 3- and 6-month data has demonstrated significant deviations between model predictions and experimental results during these later time periods. In the present development, a logistic model is used to describe the time-dependent adaptation of the intimal area, medial area, and EEL radius (Fig. 1). Our experimental data of wall thickening (Figs. 2, 3, 5) show an initial accelerated growth and then damping once the wall thickness has reached a critical value, which is the hallmark of most growth models. The S-shaped behavior parallels the population growth of smooth muscle cells. For that reason, a logistic model, which is a common and one of the simplest models of population growth, is used to describe the observed S-shaped behavior. A logistic model with the following general form was used (Britton 2003):
| (1) |
where N is the variable of interest, t is time, and a and b are constants representing the growth rate and carrying capacity of N, respectively. This logistic relationship was appropriately modified to model the time-dependent changes in EEL radius, intimal area, and medial area. To minimize the influence of inherent variations in initial vein geometries, each outcome variable was normalized to the corresponding value at the time of implantation. The exception is intimal area, which was normalized with respect to the medial area due to the inherent inaccuracies in measuring the cross-sectional area of this single-cell layer.
Fig. 1.
Schematic of the cross-section of venous wall
Fig. 2.
Normalized intimal area, normalized medial area, and normalized EEL radius with respect to shear stress at each time point. The normalized intimal area shows an inverse relationship with shear stress, while the normalized medial area and the normalized EEL radius are observed to be independent of shear stress. The total number of model parameters in the intima model is 4, while the number of experimental data is 83. filled circle Experiment (low flow graft), open circle Experiment (high flow graft), solid line Model (Eq. 3), PCC Pearson Correlation Coefficient
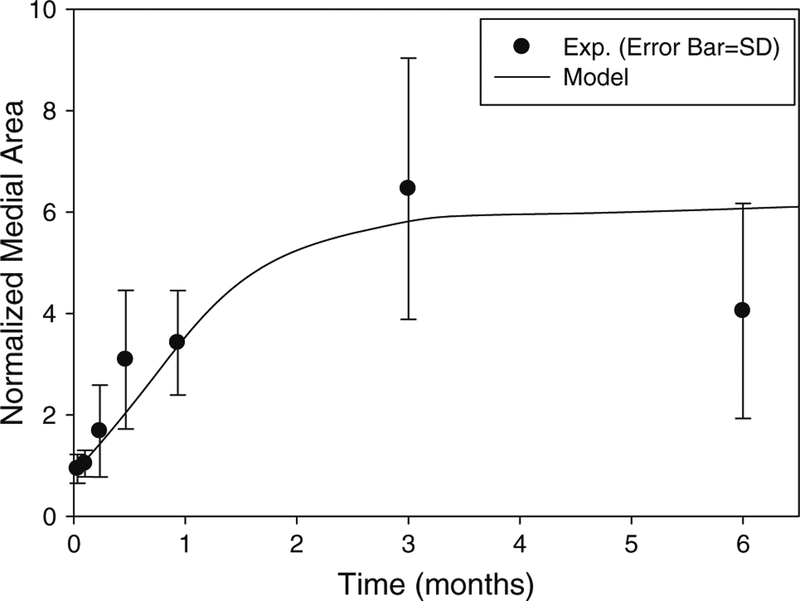
Fig. 3.
Normalized medial area as a function of time. The normalization is with respect to the medial area at implantation. Both experimental data and model curve are shown (R2 = 0.76). The model curve was obtained by integrating Eq. (4) numerically. The total number of model parameters in the media model is 6, while the number of experimental data is 83
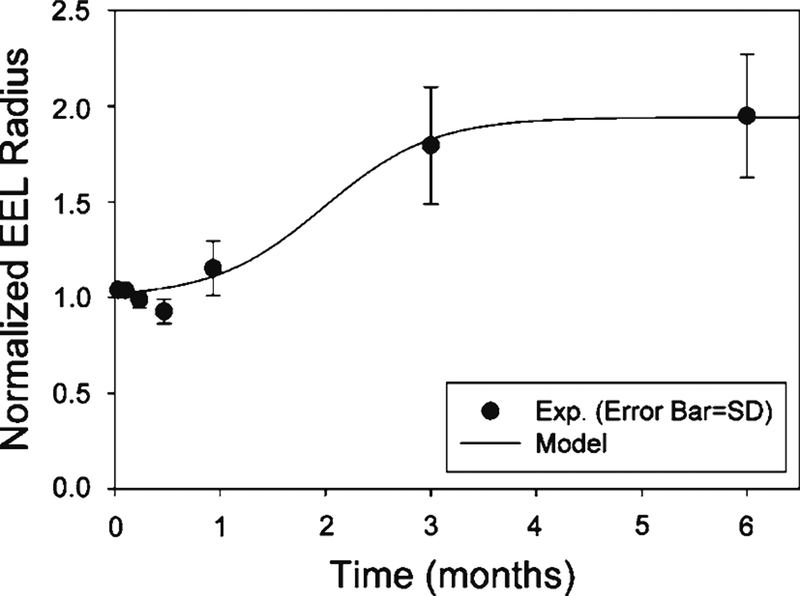
Fig. 5.
Normalized EEL radius. The normalization is with respect to the EEL radius at implantation. Both experimental data and model curve are shown (R2 = 0.98). The total number of model parameters in the EEL model is 3, while the number of experimental data is 83
2.3. Intima model
Experimental data detailing the effect of shear stress and implantation time on the normalized intimal area are provided in Fig. 2. Consistent with the finding of other investigators (Meyerson et al. 2001; Schwartz et al. 1992), an inverse relationship between the intimal area and shear stress is observed. Due to outward remodeling of the graft and an increase in lumen diameter, a reduction in shear stress is initially observed at 28days after implantation and continues throughout the 180days observation period. To incorporate these characteristics, the logistic model for the growth of the intima is as follows.
| (2) |
where is the normalized intimal area, τ is the shear stress, DI = (R/R0)3, R is the lumen radius at time t, R0 is lumen radius at implantation, x is a position vector, and aI , bI , cI, and dI are constants. The coefficient aI represents the slope of the rate of intimal area growth. The coefficient bI provides the limit of intimal area growth for the shear stress. The exponents cI and dI represent the dependence on the shear stress. Note that represents the upper limit that can be obtained by the intimal area and incorporates the inverse relationship with shear stress that was previously described. Integration of Eq. (2) yields:
| (3) |
Coefficients aI , bI , cI, and dI were obtained through nonlinear regression (MATLAB v7.7, The MathWorks Inc., Natick, MA) against the experimental data (Fig. 2) and were found to be 0.35 ± 0.06, 8.0 ± 0.9, 0.013 ± 0.035, and 2.6 ± 1.4 with 95% confidence intervals, respectively. is the normalized intimal area at implantation and was experimentally measured to be 0.186. The units used for shear stress and time are dynes/cm2 and day, respectively.
Wall thickness depends on both cell proliferation and vein graft diameter change, while wall area changes only by cell proliferation. By using wall area as the modeling variable, the effects of cell proliferation and graft diameter change can be separated.
2.4. Media model
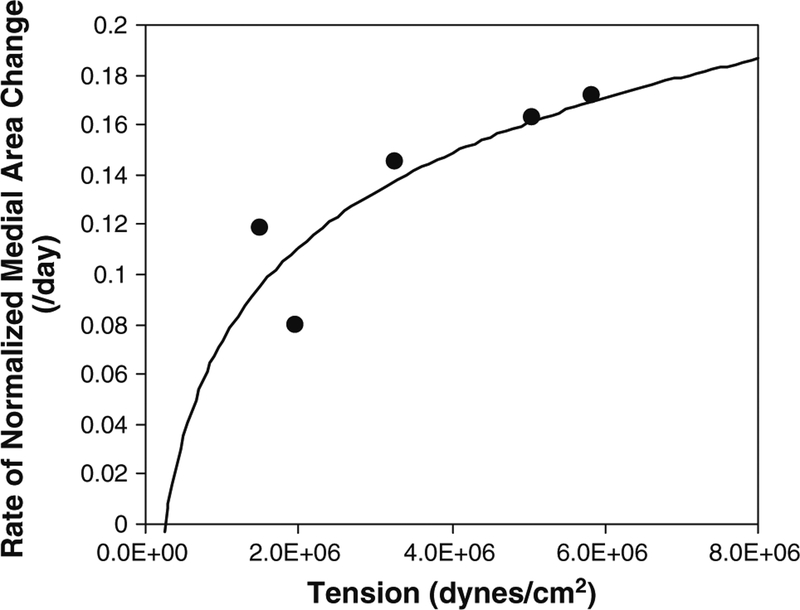
Experimentally measured medial areas, normalized to the medial area at the time of implantation, are illustrated in Figs. 2 and 3. Unlike the notable influence of shear stress on intimal hyperplasia, the process of medial thickening appears independent of the imposed WSS. Instead, previous investigators have shown intramural wall tension to have an important dependence on medial thickening (Schwartz et al. 1992; Zwolak et al. 1987). Although our experimental design was not developed to directly evaluate the influence of wall tension on vascular remodeling, examination of our data supports a positive correlation between the rate of medial hyper-trophy and the imposed wall tension (Fig. 4). Using this as a starting point, we assume a linear correlation between the rate of medial area growth and wall tension, modifying the logistic model as follows.
| (4) |
where is the normalized medial area, DM = R0/R, R is the lumen radius at time t, R0 is the lumen radius at implantation, T is the circumferential wall tensile stress, x is a position vector, and aM, bM, and cM are constants.
Fig. 4.
Rate of normalized medial area change as a function of wall tension. The rate of change data (dots) are derived from the medial area data, and the curve is a logarithmic fit
The coefficient aM represents the slope of the rate of medial area growth. The coefficient bM gives the limit of medial area growth for the wall tensile stress. The exponent cM is a function of the tensile stress.
In order to obtain the coefficients in Eq. (4), the rate of change of the normalized medial area is needed. We fitted (t is time, and A, B, and C are constants) to the experimental data in Fig. 3 to obtain the rate of change . Knowing that rate, the values for aM, bM, and cM in Eq. (4) are obtained through a non-linear regression of the logistic model using the experimental data for , , DM, and T, where the wall tension stress is calculated from the relation T = P R/h (T tension per unit area, P blood pressure, R lumen radius, and h medial thickness). Using this approach, the coefficients aM, bM, and cM in Eq. (4) were found to be 0.014 ± 0.175, 0.79 ± 8.33, and 0.30 ± 2.03 with 95% confidence intervals, respectively. The units used for blood pressure and time are 104dynes/cm2 and day, respectively. Figure 3 shows the model curve obtained by numerically integrating Eq. (4).
2.5. EEL model
EEL radii were determined experimentally over a 6-month period and are shown in Figs. 2 and 5. Similar to our observations related to adaptation of the media, changes in the graft radius were relatively independent of WSS (Fig. 2). Hence, the logistic model for the normalized EEL radius utilizes time as the only dependent variable and is provided by the following expression
| (5) |
where t is time, x is a position vector, and aE and bE are constants. The coefficient aE represents the slope of the rate of EEL radius increase. The coefficient bE is the limit of EEL radius increase.
The analytical solution to Eq. (5) is
| (6) |
and coefficients aE, bE, and are found to be 0.133 ± 0.092 and 1.94 ± 0.19, and 1.02 ± 0.04 with 95% confidence intervals, respectively, through non-linear regression using the shear-averaged experimental data in Fig. 5. Note that coefficients aE and bE are proportionality constants, and they define the maximum limit of . The unit used for time is day. The model curve describing the normalized EEL radius as a function of time is shown in Fig. 5.
Figure 2 shows that there is no consistent correlation between WSS and EEL remodeling. This is somewhat surprising considering that it has been suspected that vein graft expands to reduce the WSS imposed by faster arterial flow. Wall tension does not seem to be the driving force of EEL remodeling either. EEL expansion tends to increase lumen radius which increases wall tension. EEL remodeling seems to be related to the biologic environment of the arterial system which is represented by time-dependent terms in the model equation.
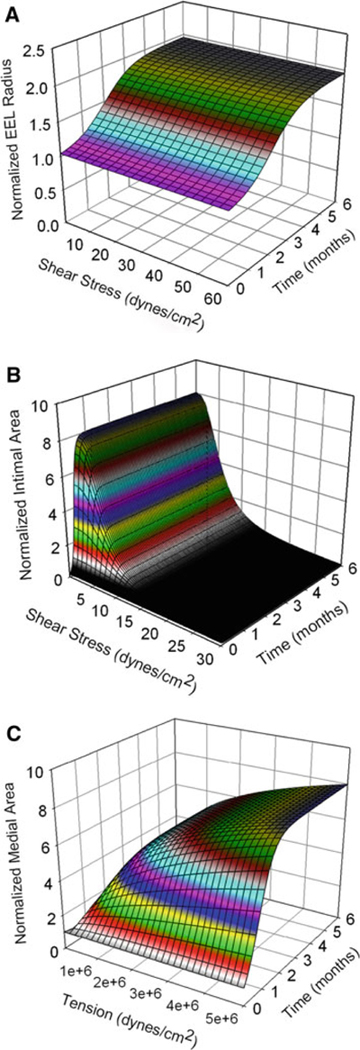
Figure 6 shows the surface plots of the normalized EEL radius as a function of time, the normalized intimal area inversely related to shear stress, and the normalized medial area positively related to tension and reaching plateau after about 3months.
Fig. 6.
Surface plots of normalized EEL radius (a), normalized intimal area (b), and normalized medial area (c). The EEL radius is normalized with respect to the EEL radius at implantation, and the intimal area and medial area are both normalized with respect to the medial area at implantation. Normalized EEL radius is a function time only. Normalized intimal area is a function of shear stress and time. Normalized medial area is a function of wall tension and time
2.6. Sensitivity and stochastic analysis
To examine the effects of the variation of each coefficient on the calculation of the change of the area or radius in Eqs. (2), (4), and (5), each coefficient was varied 100 and −50%, and the model predictions at 6months were obtained (Table 1). In the intima model (Eq. 2), bI has the greatest impact where the % change of the coefficient was directly reflected on the model prediction. The other coefficients have minimal impacts. In the media model (Eq. 4), the coefficients bM and cM have the greatest impacts on the model prediction. In the EEL model (Eq. 5), bE has direct impact. However, for all the coefficients, the % change of the model prediction was within the range of the % change of the coefficient.
Table 1.
Parameter sensitivity analysis
| Coefficient | % Change of coefficient | % Change of model prediction at 6 months |
|---|---|---|
| aI | 100 | 0 |
| −50 | 0 | |
| bI | 100 | 100 |
| −50 | −50 | |
| cI | 100 | −6 |
| −50 | 4 | |
| dI | 100 | −24 |
| −50 | 4 | |
| aM | 100 | 0 |
| −50 | 0 | |
| bM | 100 | 80 |
| −50 | −44 | |
| cM | 100 | 102 |
| −50 | −36 | |
| aE | 100 | 0 |
| −50 | −6 | |
| bE | 100 | 100 |
| −50 | −48 |
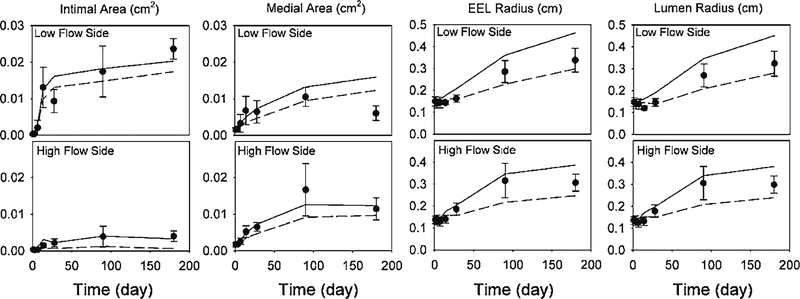
In order to examine the robustness of the model to variations in the experimental data, a stochastic analysis was performed. Using the mean and standard deviation (SD) of the experimental data at each time point, 104 sets of new data (consisting of intima, media, and EEL) were generated assuming a normal distribution at each data point. In the absence of a standard deviation for the shear- and time-dependent intimal area experimental data (Fig. 2), these values were assumed to have a coefficient of variation (CV) equal to that of the medial area (CV=0.39). Using the experimentally measured flow rate, blood pressure and initial vein graft geometry, Eqs. (2), (4), and (5) were used to update the vein graft geometry at every 0.5day. Because each experimental data point represents an individual rabbit, separate simulations were performed for each harvest day using the average of the initial conditions for that specific day. To parallel the experimental design, simulations were performed separately for the low and high flow groups of the vein grafts. Figure 7 shows both experimental data and model predictions for these stochastic simulations. In the cases of the EEL and lumen radii, the mean values of the experimental data are located within one standard deviation of the model predictions after 28days. In the cases of the intima and media, some increased deviations at the 6-month time point are observed. However, for all the data points, the SDs of the model predictions are comparable to those of the experimental data, confirming the robustness of the model.
Fig. 7.
Stochastic analysis. Both experimental data and model predictions for intimal area, medial area, EEL radius, and lumen radius are shown. Filled circle Experiment (Error Bar SD), solid line Model (mean + SD), dashed line Model (mean − SD)
3. Model applications
3.1. Simulation of idealized stenosis
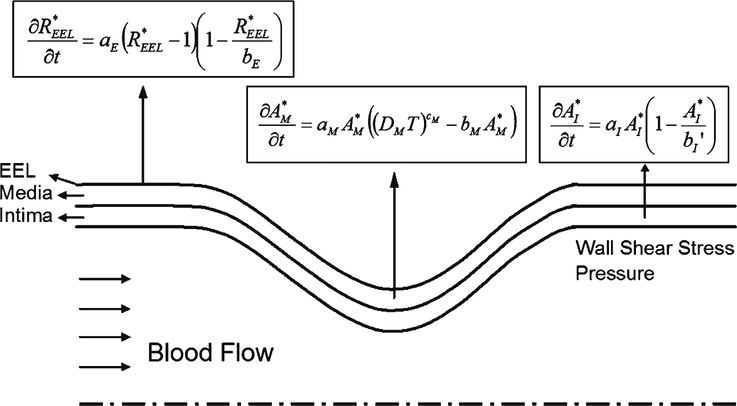
The model described in the previous sections is now applied to the simulation of wall remodeling in an idealized stenosis to test the applicability of the model. Figure 8 shows a schematic of the stenosis geometry and the equations describing dynamic remodeling within each layer of the vein graft wall. A smooth geometry within the throat region was modeled using a sinusoidal curve.
Fig. 8.
Schematic of stenosis simulation. The equations describing the remodeling of the three wall layers (intima area, medial area, and EEL radius) are shown. At each time step, the model equations are used to update the wall geometry based on the shear stress and wall tension from the blood flow simulation
The initial WSS was estimated using the ADINA finite element analysis software package (Version 8.5, ADINA R&D Inc., Watertown, MA), assuming axial symmetry, a Newtonian fluid, and a non-slip boundary condition at the wall. Supported by our histological examination of the developing intima, which demonstrates a disorganized extracellular matrix structure, we have assumed this layer to be a non-load bearing structure in the analysis schema, and the resulting wall tension is determined by the relationship T = P R/h (T tensile stress, P blood pressure, R lumen radius, and h medial thickness). Using wall shear and tension as input parameters for Eqs. (2), (4), and (5), a new wall geometry (i.e., intimal and medial thickness and EEL radius) was determined. Updated wall geometries were determined at 1day intervals for the duration of the simulation as follows. At the time interval, ti, the geometry of the vessel, WSS, and pressure were computed using the mesh and values generated at ti−1. This coupling between computational fluid dynamics (CFD) and growth model is in line with the one used by Figueroa et al. (2009). In order to evaluate the influence of the 1-day time interval on the numerical integration of Eqs. (2), (4), and (5), an analytical solution to these equations was obtained. Comparison between the forward Euler time integration using a 1-day interval and the analytic solutions demonstrated a less than 0.002% difference for all expressions at Day 180, using shear and tension values in the physiologic range. Analyses were performed assuming an initial 50, 70, and 80% stenosis (diameter) subjected to low and high flow conditions. To parallel our experimental rabbit vein graft model, the initial inlet lumen radius was set to 1.5mm. Inlet parabolic profiles with a centerline velocity of 2.45 and 12.6cm/s were used for the low and high flow conditions, respectively. The total axial length of the geometry was set to be equal to 80 times the inlet diameter to ensure no reverse flow at the exit.
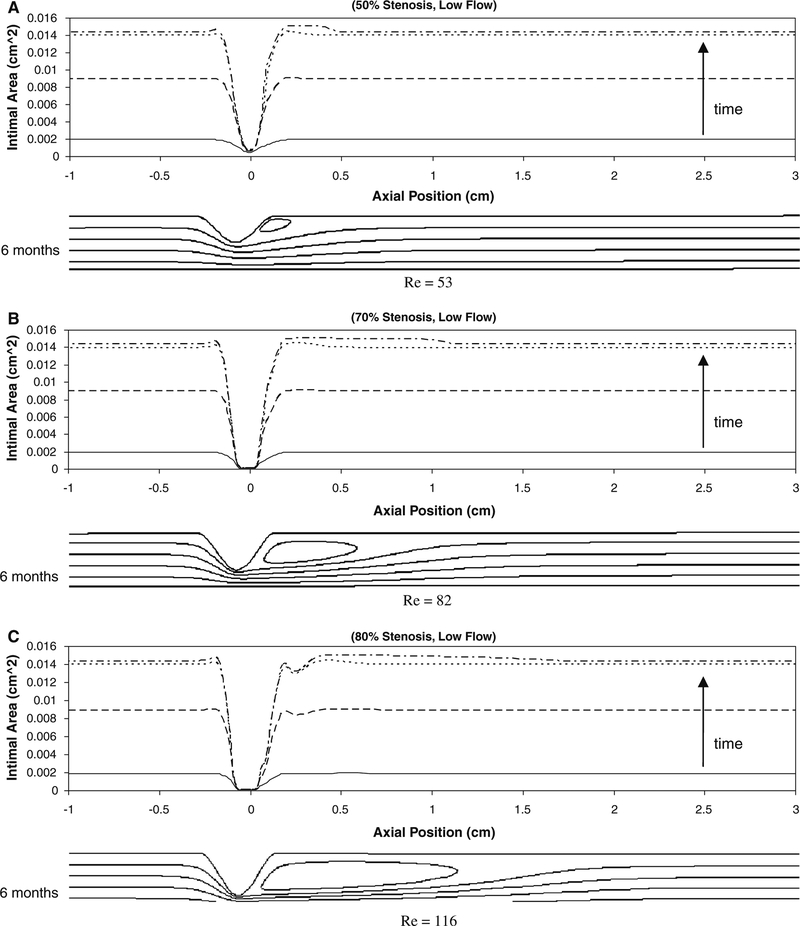
Figure 9 shows the intimal area along the graft at 1week, 2weeks, 3weeks, and 6months after implantation under low flow conditions. Intimal thickening is observed along the graft except in the region of the stenosis, where shear stress is maximal. The intimal area increases rapidly and reaches an asymptote at about 1month after implantation. In association with an initial 50% stenosis (Fig. 9a), a localized increase in intimal thickening is observed between axial positions 0.1 and 0.3cm and corresponds to the flow separation and reattachment distal to the stenosis. In association with the 70 and 80% stenoses (Fig. 9b, c), the site of flow reattachment is located at 1.1 and 1.5cm, respectively, leading to a broad region of recirculation and a mild increase in intimal area in these regions.
Fig. 9.
Simulation results for intimal area around the idealized stenosis of 50% (a), 70% (b), and 80% (c) reduction in stenosis (diameter) at its center under low flow condition at 1week (solid line), 2 weeks (dashed line), 3weeks (dotted line), and 6months (dashed with dotted line). No significant change is seen beyond about 1month. The axial position of 0cm is the location of the minimal luminal area (throat). The maximum Reynolds number generated in all the flow conditions is 528 and well in the range of laminar flow
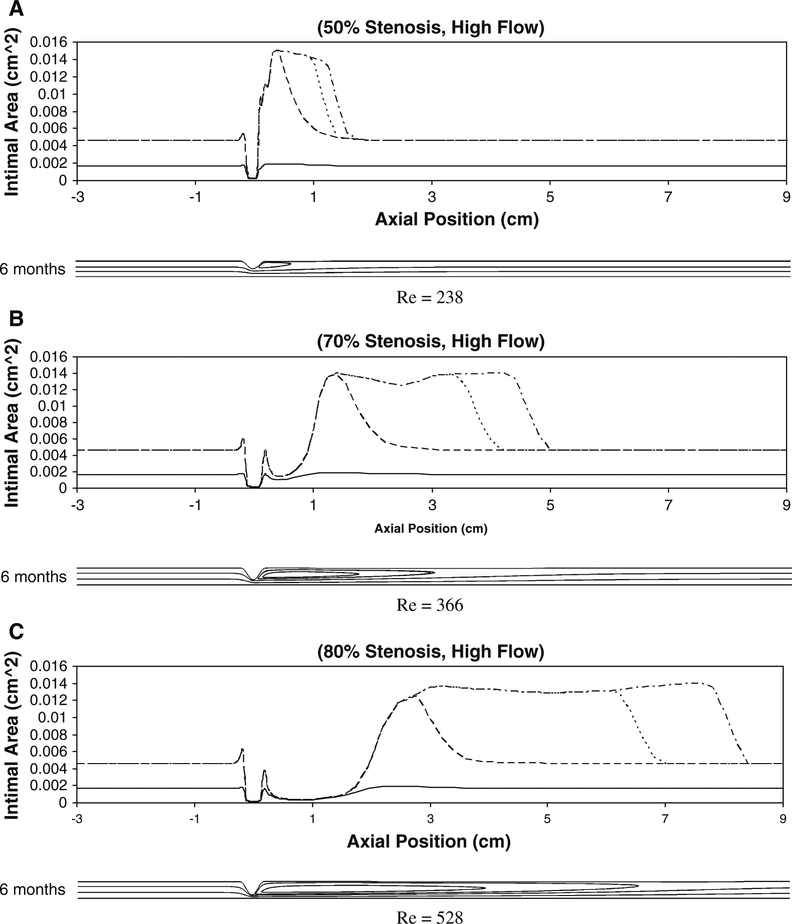
Figure 10 shows the intimal area along the graft under high flow conditions. Within regions of uniform/unidirectional flow, proximal and distal to the stenosis, high flow conditions result in a reduction in intimal thickening. In contrast to the low-flow simulations, the marked reductions in shear distal to the stenosis lead to a marked augmentation in intimal area in this region. Notable are the 70 and 80% high-flow simulations where the reduced shear within the region of flow separation has shifted distally, resulting in enhanced intimal thickening that is several centimeters distal to the site of maximum stenosis.
Fig. 10.
Simulation results for intimal area around the idealized stenosis for 50% (a), 70% (b), and 80% (c) stenosis (diameter) under high flow condition at 1week (solid line), 1month (dashed line), 3months (dotted line), and 6months (dashed with dotted line). The axial position of 0cm is the location of the minimal luminal area (throat). The two small peaks proximal and distal to the throat correspond to the corners of the stenosis. The reason for these sudden local intimal thickenings is that the WSS drops to a minimum in these regions due to the abrupt change in lumen diameter around the stenosis corners. The maximum Reynolds number generated in all the flow conditions is 528 and well in the range of laminar flow
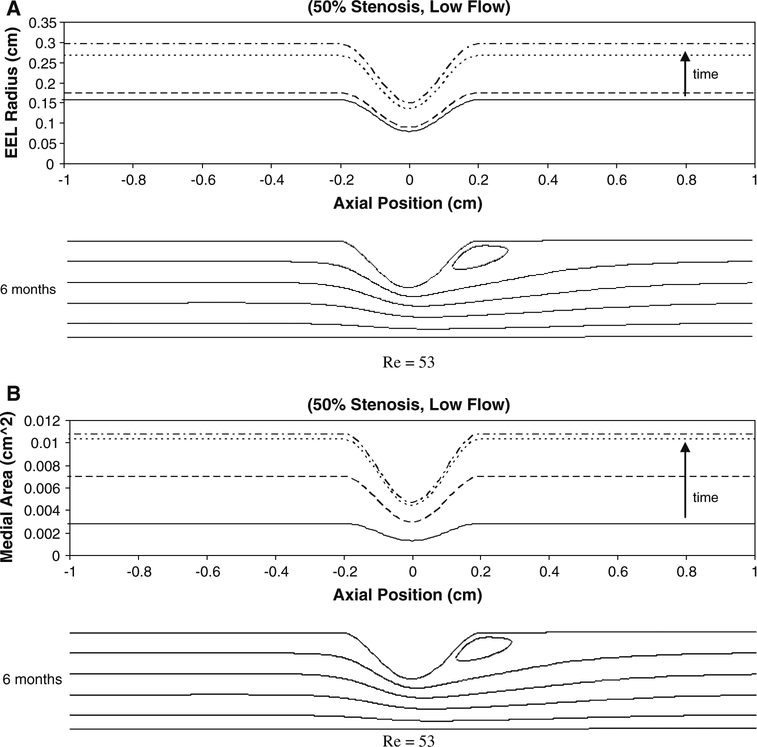
Figure 11 illustrates the change in the EEL radius and medial area associated with a 50% stenosis exposed to low flow conditions. A uniform increase in both graft radius and medial area is observed proximal and distal to the stenosis. In contrast to the effect on intimal thickening, the perturbations in the flow patterns induced by the stenosis have a limited effect on these geometric parameters. The patterns of graft expansion and medial growth associated with 70 and 80% stenoses demonstrated a similar asymptotic behavior and were not notably influenced by the magnitude of the flow (data not shown).
Fig. 11.
Simulation results for EEL radius (a) and medial area (b) for 50% stenosis under low flow condition at 1week (solid line), 1month (dashed line), 3months (dotted line), and 6months (dashed with dotted line). The axial position of 0cm is the location of the minimal luminal area (throat). Re Reynolds Number
One of the limitations of the stenosis study is that the WSS was obtained from steady flow simulations. Pulsatile simulations were not performed because of the amount of time needed and cases considered here. However, it is expected that under pulsatile flow, the recirculation zone behind the stenosis would oscillate, which would result in different prediction of wall thickening in those regions. Thus, the intimal thickening around the reattachment point shown in Fig. 10 could be an over-prediction.
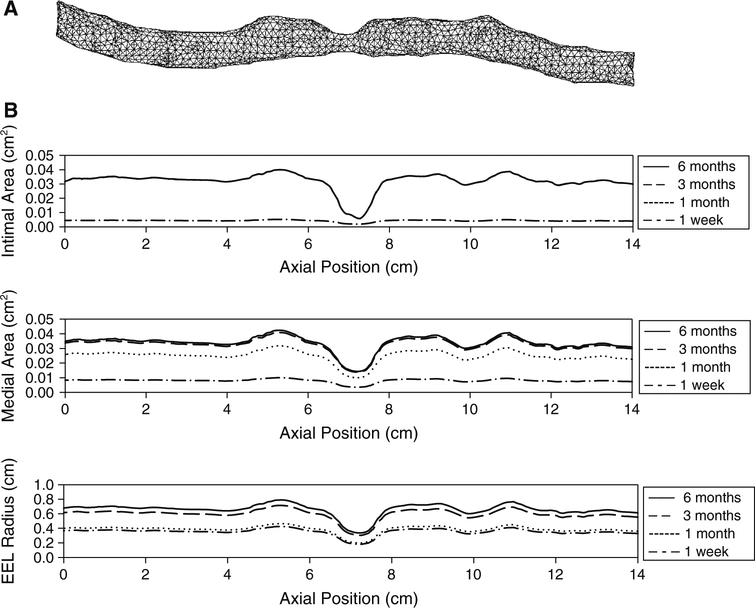
3.2. Simulation of human vein graft
The present mathematical model was applied to the simulation of human vein graft remodeling, encompassing the geometric complexities, which are inherent in these conduits. Figure 12a illustrates a 14-cm segment of human saphenous vein whose structure was extracted from a computer tomo-graphic (CT) image obtained several days after implantation. An approach similar to that described above for the idealized stenosis was used to simulate the human vein graft wall remodeling. Assuming a blood flow rate of 100cm/s and an intraluminal pressure of 1.3 × 10⁴ Pa, the resulting wall shear and tension served as the input parameters for Eqs. (2), (4), and (5) to determine the interval change in intimal area, medial area, and EEL radius. Alternately, calculating the local hemodynamics and graft geometry at 1-day intervals yielded a temporal understanding of vein graft remodeling through the initial 6months following implantation. Figure 12b shows the intimal area, medial area, and EEL radius along the graft at 1week, 1month, 3months, and 6months. The remodeling patterns observed in the human vein graft approximate those observed in the idealized stenosis, with intimal thickening that was minimal within the throat of the stenosis and reached a plateau at about 1month. Medial thickening is also minimal within the stenosis, with a growth rate that decreases with time.
Fig. 12.
Simulation results for human vein graft. a Vein graft geometry and mesh implantation. b Corresponding intimal area, medial area, and EEL radius along the vein graft are shown at 1week, 1month, 3months, and 6months
4. Discussion
Vein graft remodeling is a complex process involving many biological and hemodynamic factors. There have been experimental evidences that relate each individual hemodynamic factor to the remodeling of each wall layer of the vein graft, and we have developed a set of mathematical equations, which define these relationships. There are two modeling approaches that can be adopted: cell-based methodology (Hwang et al. 2009) and mathematical models (Alford et al. 2008; Valentín and Humphrey 2009). Cell-based modeling methodology takes advantage of the fact that the cells constitute the biological systems, and mathematical models provide insight into the relationships among the components in the system. Novel in our approach is the development of a comprehensive mathematical model that includes three layers for vein graft remodeling, in contrast to the less physiological single-layer models previously described in the literature (Budu-Grajdeanu et al. 2008; Friedman et al. 1986; Tran-Son-Tay et al. 2008; Zohdi 2005). Through the implicit linkage between these geometric parameters and the local hemodynamic environment, a temporal understanding of vein graft remodeling is obtained. Also unique to the current formulation is the use of a logistic model as our base expression. Offering a simple equation that incorporates the S-shaped behavior observed in our experimental data (Figs. 2, 3, 5), this approach has been used by many researchers for modeling cell population growth (Britton 2003; Fujikawa et al. 2004; Goudar et al. 2005), but is novel in its application to soft tissue remodeling.
In the formulation of our model, changes in intimal and medial cross-sectional area are related to WSS and wall tension, respectively, and EEL radius change is a function of time only. There have been reports that vein graft dilation is dependent on shear stress. Fillinger et al. (1994) and Owens et al. (2006) observed a positive correlation between initial shear stress and percent change in lumen diameter in human vein grafts data. However, the observed shear dependence of lumen size does not depend only on graft dilation but also on wall thickening. Therefore, we have chosen EEL radius as a measure of graft dilation to separate the effect of wall thickening. Moreover, Galt et al. (1993), in their rabbit vein graft experiments, observed no significant change in lumen radius of vein grafts exposed to normal and low flow for 4weeks. In contrast, intimal-medial thickening was significantly more pronounced in the low flow case, suggesting a more prominent increase in EEL radius in those grafts exposed to low flow conditions. In our experiments, we did not observe any significant dependence of EEL radius on the shear stress.
Wall tension has been recognized as one of the hemodynamic factors that has a notable impact on the thickening of the vein graft wall (Schwartz et al. 1992; Zwolak et al. 1987). In our model, wall tension affects the medial layer, and the intima is regulated by shear stress. Our experimental data (Fig. 2) show a significant difference in the initial intimal area change rates (up to 14days) between low and high-flow vein grafts, even though the experiments were started under comparable wall tension for both flow groups. The effect of the wall tension on the intima is minimal because the intimal area did not increase much in the high-flow vein grafts throughout the 6-month period. Our intima model describes an inverse relationship between shear stress and intimal growth rate, which has been observed by many researchers (Jiang et al. 2004; Meyerson et al. 2001; Schwartz et al. 1992). Another characteristic of the intima model is that it can predict the regression of the intima. Morinaga et al. (1987) reported that the thickened intima in a vein graft exposed to low flow regressed when the vein graft is exposed to higher flow rate in their canine vein graft experiment. In Eq. (2), the rate becomes negative when the shear stress is increased such that the is less than .
In our previous work (Tran-Son-Tay et al. 2008), we have validated the intima model with stenosis experimental data, which were appropriate for the validation of the intimal thickening. However, that stenosis was created using ligature that prevented EEL remodeling, which makes the data inadequate for validation of our current three-layer model. Validation of the current model will require another set of experimental data and is beyond our resources at this time.
We realize that hemodynamic forces are not the only factors that regulate vein graft remodeling. Incorporation of the biologic environment of the arterial system is needed in order to provide a more realistic description of the vein graft behavior. The current model describes vein graft adaptation in the earlier time frame after surgery. Eventually, some vein grafts will become stable after the adaptation and some unstable leading to vein graft failure. The reason why some vein grafts are stable and some are unstable is currently unknown. In addition, the mechanism of vein graft failure seems to be different from that of early adaptation. The ultimate goal of our modeling effort is to develop a model that can predict unstable remodeling leading to vein graft failure, so that the model can be used as a predictor of vein graft failure. However, despite of these limitations, our model is able to provide key features observed experimentally. It gives an insight into the relationships that exist between the hemodynamic factors and the remodeling of each layer of the vein graft, and pro vides a sound framework for the development of a predictor of vein graft failure.
Acknowledgments
This work was supported by the National Institutes of Health (R01-HL095508–01).
Contributor Information
Minki Hwang, Department of Mechanical and Aerospace Engineering, University of Florida, Gainesville, FL 32611, USA.
Scott A. Berceli, Department of Surgery, University of Florida College of Medicine, Gainesville, FL 32610, USA Malcom Randall Veterans Affairs Medical Center, Gainesville, FL 32608, USA.
Marc Garbey, Department of Computer Science, University of Houston, Houston, TX 77004, USA.
Nam Ho Kim, Department of Mechanical and Aerospace Engineering, University of Florida, Gainesville, FL 32611, USA.
Roger Tran-Son-Tay, Department of Mechanical and Aerospace Engineering, University of Florida, Gainesville, FL 32611, USA; Department of Biomedical Engineering, University of Florida, Gainesville, FL 32611, USA.
References
- Alford PW, Humphrey JD, Taber LA (2008) Growth and remodeling in a thick-walled artery model: effects of spatial variations in wall constituents. Biomech Model Mechanobiol 7:245–262 [DOI] [PMC free article] [PubMed] [Google Scholar]
- Berguer R, Higgins RF, Reddy DJ (1980) Intimal hyperplasia. ArchSurg 115:332–335 [DOI] [PubMed] [Google Scholar]
- Bhardwaj S, Roy H, Ylä-Herttuala S (2008) Gene therapy to prevent occlusion of venous bypass grafts. Expert Rev Cardiovasc Ther 6:641–652 [DOI] [PubMed] [Google Scholar]
- Britton NF (2003) Essential mathematical biology. Springer, London [Google Scholar]
- Budu-Grajdeanu P, Schugart RC, Friedman A, Valentine C, Agarwal AK, Rovin BH (2008) A mathematical model of venous neointimal hyperplasia formation. Theor Biol Med Model 5:2. [DOI] [PMC free article] [PubMed] [Google Scholar]
- Conte MS, Bandyk DF, Clowes AW, Moneta GL, Seely L, Lorenz TJ, Namini H, Hamdan AD, Roddy SP, Belkin M, Berceli SA, DeMasi RJ, Samson RH, Berman SS, P. I. Investigators (2006) Results of PREVENT III: a multicenter, randomized trial of edifoligide for the prevention of vein graft failure in lower extremity bypass surgery. J Vasc Surg 43:742–751 [DOI] [PubMed] [Google Scholar]
- Dobrin PB, Littooy FN, Endean ED (1989) Mechanical factors predis-posing to intimal hyperplasia and medial thickening in autogenous vein grafts. Surgery 105:393–400 [PubMed] [Google Scholar]
- Fernandez CM, Goldman DR, Jiang Z, Ozaki CK, Tran-Son-Tay R, Berceli SA (2004) Impact of shear stress on early vein graft remodeling: a biomechanical analysis. Ann Biomed Eng 32:1484–1493 [DOI] [PubMed] [Google Scholar]
- Figueroa CA, Baek S, Taylor CA, Humphrey JD (2009) A computational framework for fluid-solid-growth modeling in cardiovascular simulations. Comput Methods Appl Mech Eng 198:3583–3602 [DOI] [PMC free article] [PubMed] [Google Scholar]
- Fillinger MF, Cronenwett JL, Besso S, Walsh DB, Zwolak RM (1994) Vein adaptation to the hemodynamic environment of infrainguinal grafts. J Vasc Surg 19:970–979 [DOI] [PubMed] [Google Scholar]
- Friedman MH, Deters OJ, Bargeron CB, Hutchins GM, Mark FF (1986) Shear-dependent thickening of the human arterial intima. Atherosclerosis 60:161–171 [DOI] [PubMed] [Google Scholar]
- Fujikawa H, Kai A, Morozumi S (2004) A new logistic model for Escherichia coli growth at constant and dynamic temperatures. Food Microbiol 21:501–509 [Google Scholar]
- Galt SW, Zwolak RM, Wagner RJ, Gilbertson JJ (1993) Differential response of arteries and vein grafts to blood flow reduction. J Vasc Surg 17:563–570 [PubMed] [Google Scholar]
- Goudar CT, Joeris K, Konstantinov KB, Piret JM (2005) Logistic equations effectively model mammalian cell batch and fed-batch kinetics by logically constraining the fit. Biotechnol Prog 21:1109–1118 [DOI] [PubMed] [Google Scholar]
- Grondin CM, Lepage G, Castonguay YR, Meere C, Grondin P (1971) Aortocoronary bypass graft: initial blood flow through the graft, and early postoperative patency. Circulation 44:815–819 [DOI] [PubMed] [Google Scholar]
- Hwang M, Garbey M, Berceli SA, Tran-Son-Tay R (2009) Rule-based simulation of multi-cellular biological systems—a review of modeling techniques. Cell Mol Bioeng 2:285–294 [DOI] [PMC free article] [PubMed] [Google Scholar]
- Jiang Z, Wu L, Miller BL, Goldman DR, Fernandez CM, Abouhamze ZS, Ozaki CK, Berceli SA (2004) A novel vein graft model: adaptation to differential flow environment. Am J Physiol Heart Circ Physiol 286:H240–H245 [DOI] [PubMed] [Google Scholar]
- Jiang Z, Tao M, Omalley KA, Wang D, Ozaki CK, Berceli SA (2009) Established neointimal hyperplasia in vein grafts expands via TGF-b-mediated progressive fibrosis. Am J Physiol Heart Circ Physiol 297:H1200–H1207 [DOI] [PMC free article] [PubMed] [Google Scholar]
- Mai J, Sameni M, Mikkelsen T, Sloane BF (2002) Degradation of extra-cellular matrix protein tenascin-C by cathepsin B: an interaction involved in the progression of gliomas. Biol Chem 383:1407–1413 [DOI] [PubMed] [Google Scholar]
- Mann MJ (2004) Novel strategies for the prevention of bypass graft failure. BioDrugs 18:1–8 [DOI] [PubMed] [Google Scholar]
- Meyerson SL, Skelly CL, Curi MA, Shakur UM, Vosicky JE, Glagov S, Schwartz LB (2001) The effects of extremely low shear stress on cellular proliferation and neointimal thickening in the failing bypass graft. J Vasc Surg 34:90–97 [DOI] [PubMed] [Google Scholar]
- Morinaga K, Eguchi H, Miyazaki T, Okadome K, Sugimachi K (1987) Development and regression of intimal thickening of arterially transplanted autologous vein grafts in dogs. J Vasc Surg 5:719–730 [DOI] [PubMed] [Google Scholar]
- Owens CD, Wake N, Jacot JG, Gerhard-Herman M, Gaccione P, Belkin M, Creager MA, Conte MS (2006) Early biomechanical changes in lower extremity vein grafts—distinct temporal phases of remodeling and wall stiffness. J Vasc Surg 44:740–746 [DOI] [PubMed] [Google Scholar]
- Schwartz LB, O’Donohoe MK, Purut CM, Mikat EM, Hagen PO, McCann RL (1992) Myointimal thickening in experimental vein grafts is dependent on wall tension. J Vasc Surg 15:176–186 [DOI] [PubMed] [Google Scholar]
- Schwartz SM (1999) The intima: a new soil. Circ Res 85:877–879 [DOI] [PubMed] [Google Scholar]
- Sumpio BE, Banes AJ (1988) Response of porcine aortic smooth muscle cells to cyclic tensional deformation in culture. J Surg Res 44:696–701 [DOI] [PubMed] [Google Scholar]
- Tran-Son-Tay R, Hwang M, Garbey M, Jiang Z, Ozaki CK, Berceli SA (2008) An experiment-based model of vein graft remodeling induced by shear stress. Ann Biomed Eng 36:1083–1091 [DOI] [PubMed] [Google Scholar]
- Valentín A, Humphrey JD (2009) Evaluation of fundamental hypotheses underlying constrained mixture models of arterial growth and remodeling. Phil Trans R Soc A 367:3585–3606 [DOI] [PMC free article] [PubMed] [Google Scholar]
- Zohdi TI (2005) A simple model for shear stress mediated lumen reduction in blood vessels. Biomech Model Mechanobiol 4:57–61 [DOI] [PubMed] [Google Scholar]
- Zwolak RM, Adams MC, Clowes AW (1987) Kinetics of vein graft hyperplasia: association with tangential stress. J Vasc Surg 5: 126–136 [PubMed] [Google Scholar]


