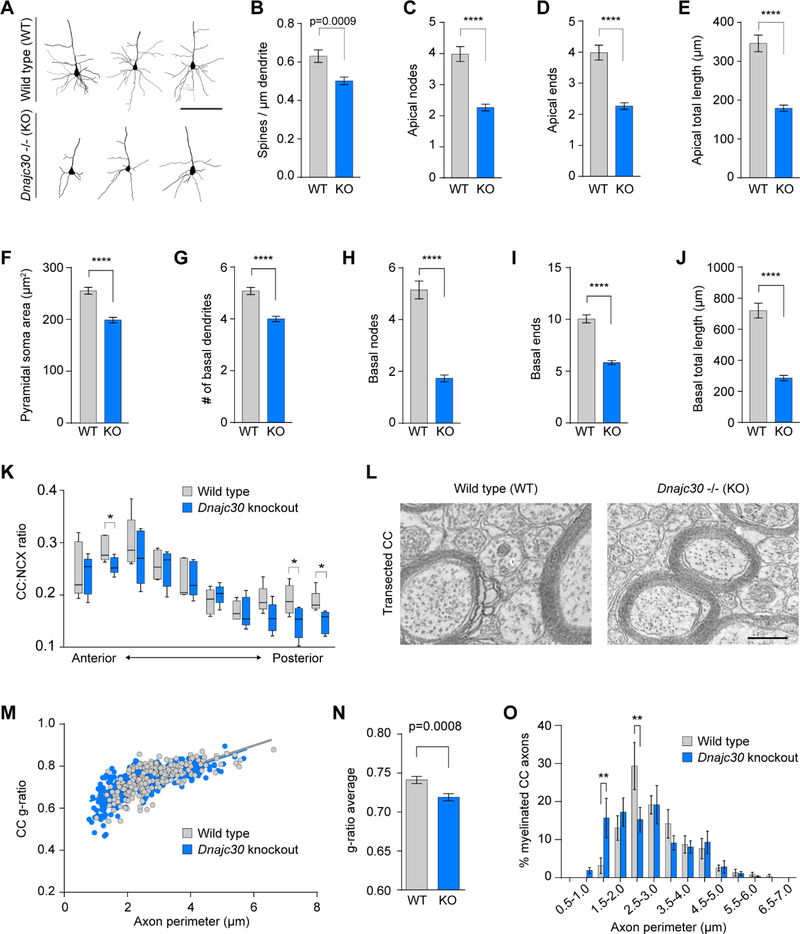
Figure 3. Dnajc30 Knockout Mice have Reduced Pyramidal Soma Area, Dendritic Morphology, and Callosal Axon Thickness.
(A) Reconstructed neurons stained using the Golgi-Cox technique (scale = 100μm). (B-J) Quantification of Golgi-Cox stained neuronal architecture. WT, n=64 neurons/4 mice; KO, n=93 neurons/6 mice. (K) Serial coronal brain sections (age P9–10) of corpus callosum:NCX thickness. n=5 for WT and KO. (L) Representative electron micrographs of transected CC (scale = 500nm). (M) CC g-ratio and axon perimeter distribution (age 3–4 weeks). (N) Average g-ratio between WT and KO mice (WT, n = 209 axons/5 mice; KO, n = 265 axons/5 mice). (O) Percentage distribution of axon perimeter populations. *, p<0.05; **, p<0.01; ****, p<0.0001. Statistical analyses were performed using student’s t-tests and multiple t-tests and corrections using the Holm-Sidak method. See also Figure S4.

