Abstract
Compartmentalization of reactions is ubiquitous in biochemistry. Self-reproducing lipids are widely studied as chemical models of compartmentalized biological systems. Here, we explore the effect of catalyst location on copper-catalyzed azide–alkyne cycloadditions which drive the self-reproduction of micelles from phase-separated components. Tuning the hydrophilicity of the copper-ligand complex, so that hydro-phobic or -philic catalysts are used in combination with hydro-philic and -phobic coupling partners, provides a wide range of reactivity patterns. Analysis of the kinetic data shows that reactions with a hydrophobic catalyst are faster than with a hydrophilic catalyst. Diffusion-ordered spectroscopy experiments suggest compartmentalization of the hydrophobic catalyst inside micelles while the hydrophilic catalyst remains in the bulk aqueous phase. The autocatalytic effects observed can be tuned by varying reactant structure and coupling a hydrophilic alkyne and hydrophobic azide results in a more pronounced autocatalytic effect. We propose and test a model that rationalizes the observations in terms of the phase behavior of the reaction components and catalysts.
Introduction
Compartmentalized reactions may occur inside nano- or microscale species such as micelles, vesicles, and emulsion droplets.1 These compartments can serve as microscale reactors and provide a mechanism for controlling the interactions between components of heterogeneous systems.2 Studying compartmentalized reactions may help us understand biochemical processes and how to control chemical reactivity.3−5 Living cells are compartmentalized out-of-equilibrium systems which are able to control complex multistep reactions, such as NADPH metabolism, which relies on the ability to separate different components.6 Similarly, gluconeogenesis likely involves three intracellular compartments performing different reactions.7,8
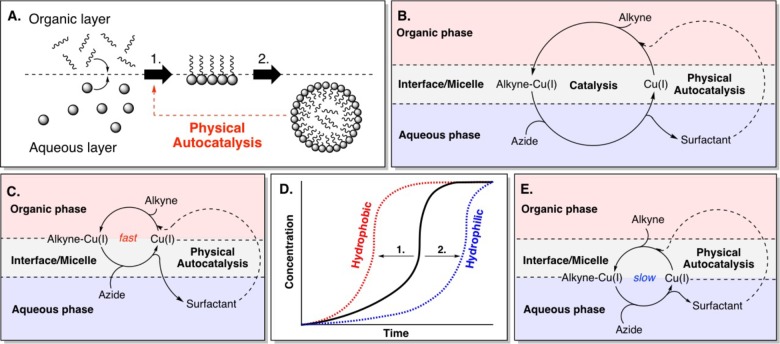
Lipid-based compartments have been studied as simple models of cellular membranes9−11 and display complex aggregation behavior including deformation and division.12−15 The chemical self-reproduction of synthetic micelles and vesicles has been used to drive the growth and division processes16−18 and serve as minimal metabolic networks where compartmentalized reactions generate self-organizing components of the compartment.19,20 In physical autocatalytic processes surfactants are initially slowly formed through the reaction of two phase separated reagents at the interface of a biphasic system (Figure 1A, step 1).21−31 Once a critical concentration of the products is reached, supramolecular aggregates form allowing the reaction components to interact by compartmentalization and subsequent solubilization into the opposing phase, facilitating further surfactant formation (step 2).24 The formation of these aggregates can probably be viewed most simply as an extension of the interface where phase separated reagents are capable of interacting. This concept was first explored by Luisi and co-workers where they reported on the alkaline hydrolysis of ethyl caprylate which yielded sodium caprylate micelles that enhanced the rate of hydrolysis.22 Later Sugawara and co-workers developed a system of self-reproducing giant vesicles in a biphasic system through a dehydrocondensation reaction between a lipophilic aniline precursor and a amphiphilic aldehyde catalyzed by a amphiphilic acid catalyst.29 However, the systems studied thus far did not allow for facile control over the compartmentalization of a secondary catalyst which may enable the development of more sophisticated reaction networks. Fréchet and co-workers have used the polarity of compounds to sequester reagents in different phases allowing for the development of a one-pot asymmetric cascade reaction mediated by two catalysts.32
Figure 1.
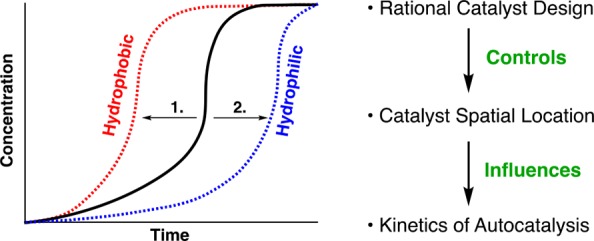
(A) Overview of physical autocatalysis. (B) A copper catalyzed physical autocatalytic system where an organic alkyne reacts first with the Cu-catalyst, then with an aqueous azide to form a surfactant. Product micelles accelerate the reaction.33 (C–E) This work: (C) Using a hydrophobic Cu-ligand promotes retention of the Cu-catalyst in the organic phase and faster turnover is observed. (D) Summary of effect of tuning the catalyst hydrophilicity to alter reaction kinetics. (1) A hydrophobic ligand leads to shorter lag periods and higher rates while (2) a hydrophilic ligand retards the reaction. (E) Using a hydrophilic Cu-ligand in the system favors keeping the Cu-catalyst in the aqueous phase and slower turnover is observed.
We recently reported a system where we used copper-catalyzed alkyne–azide cycloadditions (CuAAC) as a secondary catalytic cycle in the self-reproduction of micelles (Figure 1B).33 The coupling of an excess of a hydrophobic alkyne that constitutes the organic phase as oil droplets on water with a hydrophilic azide in a biphasic reaction mixture showed complex behavior consistent with autocatalysis.
Here we show that the kinetic behavior of self-reproducing lipid aggregates can be controlled (Figure 1C–E) by tuning the solubility properties of a Cu-catalyst where the autocatalytic cycle is completely dependent on the Cu-catalyst. We also examine different combinations of hydrophobic and hydrophilic alkyne/azide coupling partners. We rationalize our findings in terms of the system’s phase behavior and how the catalyst and the reaction events are localized by compartmentalization. We propose a mechanistic model which explains under which conditions more or less dramatic autocatalytic effects are observed. The generality of this model is tested in a novel system with a phosphocholine polar headgroup.
Results and Discussion
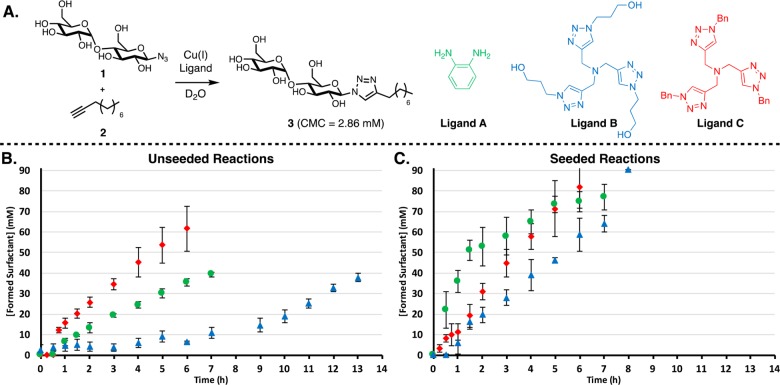
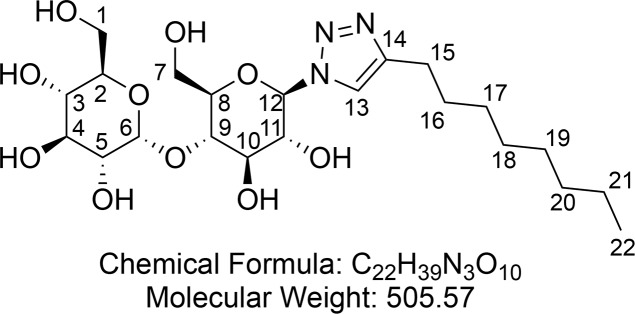
As previously reported, reaction between hydrophilic maltose azide 1 and hydrophobic aliphatic alkyne 2 via a CuAAC forms surfactant 3 (Figure 2A), which according to DLS and fluorimetry measurements forms micelles of around 7 nm at 2.86 mM (Figures S21 and S23). These reactions involve “typical” aqueous CuAAC conditions: in situ reduction of CuSO4 with sodium ascorbate using O-phenylenediamine as a ligand (Figure 2A; ligand A). Kinetic experiments, after considerable examination of physical parameters such as stirring speed and flask size/shape to give reaction kinetics suitable for study on convenient time scales, reveal a lag period followed by a subsequent period with a faster rate (Figure 2B; green circles). Seeding the reaction at t = 0 with product 3 at concentrations above the CMC34 removed the lag period and increased the rate of product formation (Figure 2C; green circles). These observations are consistent with an autocatalytic mechanism.35
Figure 2.
(A) Reactions where maltose azide 1 is coupled to alkyne 2 via a CuAAC reaction to form surfactant 3 and the structures of ligands used. Ligands A and B are hydrophilic, and ligand C is hydrophobic. (B) Kinetic results showing the influence of the ligand; A (green circles), B (blue triangles), and C (red diamonds), on the rate of conversion. A trend is observed where increased hydrophobicity of the ligand results in higher rates of conversion. (C) When seeding reactions with 22 mM of product, elimination of the lag period and higher reaction rates are observed. The reaction is monitored by consumption of azide 1 and formation of surfactant 3 by 1H NMR spectroscopy. Points are the mean of three independent experiments, and the error bars are the standard deviation.
Controlling Catalyst Compartmentalization by Tuning Ligand Hydrophobicity
Autocatalytic cycles involving a secondary catalyst would be expected to behave differently than cycles driven by spontaneous reactions. As this form of replication involves multiple solution phases, altering the solubility properties of the Cu-catalyst is expected to allow for control over the spatial location of the reaction by, for example, restricting it to the micelle interior. Such catalyst compartmentalization may provide insight into how to control chemical reactivity, develop complex reaction networks, and enable sophisticated models of cells. To this end we varied the hydrophobicity of the copper ligand.
Tristriazole ligands are known36 to prevent oxidation and disproportionation of Cu(I) and also enhance catalytic activity compared to CuSO4/ascorbate alone. Interestingly, these ligands were discovered when autocatalytic effects were observed during mechanistic studies of the CuAAC reaction on polyvalent substrates.37 The mechanism of this autocatalytic cycle was recently studied in depth.38 Devaraj and co-workers have used self-reproducing tristriazole compounds to embed copper in a phospholipid bilayer and drive membrane growth and form self-assembling peptide nanomaterials.30,31 These weakly binding polytriazole ligands are exceptional in water because they prevent the formation of unreactive polynuclear copper acetylides40−42 and other more strongly binding ligands inhibit the reaction by denying azide access to the metal.39 Furthermore, simple synthetic modifications to this class of ligand allow easy tuning of solubility without affecting catalytic activity. We chose two known ligands, one strongly hydrophilic (ligand B) and one hydrophobic (ligand C), to compare and contrast with the previously studied ligand A (Figure 2A).
In the unseeded reactions, ligand C accelerates the reaction almost 2-fold compared to ligand A (Figure 2B; Table S3 for extracted reaction rates). Conversely the reaction with ligand B is slow compared to ligand A with a much longer lag period and gradual initial product formation. There is however a small reproducible amount of initial product formation observed using ligand B, which was further investigated by varying the equivalent of ligand B used (Figure S44). A correlation between the length of lag period and the ligand used was observed, where 1 equiv led to a significant rate increase and use of 4 equiv of ligand gave no observed product in the first 6 h (after 5 days about 10% conversion was observed).
In the seeded reactions, ligand A shows significant product-induced rate enhancement and is clearly the fastest of the three reactions (Figure 2C, Table S4 for extracted reaction rates). Ligand B shows an ∼2× rate compared to its unseeded reaction, and a slight lag period. Curiously seeded reactions with B did not show initial formation of a small amount of product as seen with unseeded reactions using B. Ligand C shows only a modest rate increase over the unseeded reaction.
Control Experiments
To eliminate the possibility that C is simply a more effective ligand than B, we performed the reaction in a 1:1 water/tert-butanol mixture to facilitate phase mixing (Figure S43). Although the kinetic profiles may still appear to have some sigmoidal character, all three ligands gave comparable rates and the reactions went to completion within 2 h. This supports the assumption that phase behavior is responsible for the lag period and slower kinetics and that there is no inherent difference in efficiency between the ligands.
During our previous studies with A we found that 1-dodecyne (2b) (likely because of its very low solubility in water) reacted slowly, with a lag period of over 3 h and a reaction time of several days (Figure 3, blue circles). Here we show that using hydrophobic C gives a much faster reaction with 2b and completely removes the lag period (Figure 3, red squares).
Figure 3.
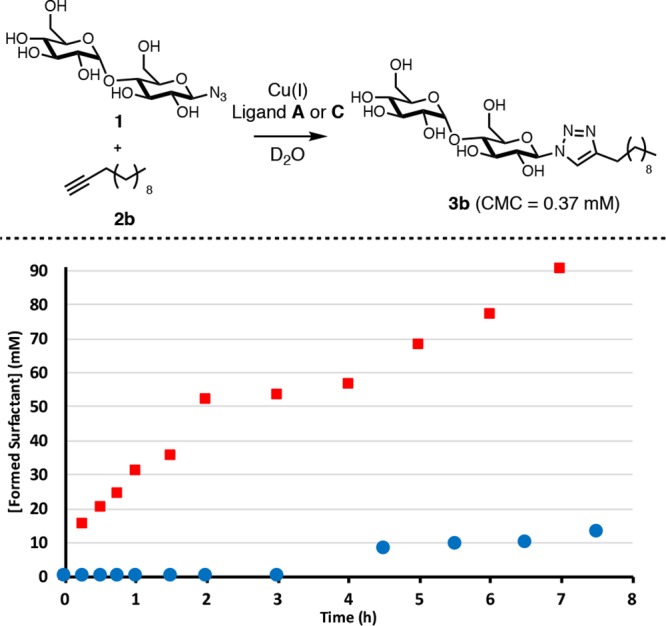
Reaction kinetics of coupling 1 to 2b to form surfactant 3b. An unseeded reaction with ligand A (blue circles) and an unseeded reaction with ligand C (red squares).
We probed the phase behavior of the reaction components using diffusion ordered spectroscopy (DOSY). A lower diffusion coefficient (D) is expected for an aggregated surfactant compared to free surfactant below the CMC. A compound associating with the micelle is expected to diffuse at a similar rate as the surfactant above the CMC, where tetramethylsilane (TMS) is added as a control for the diffusion rate of supramolecular aggregates. Control experiments show that our surfactants aggregate above their CMCs (Table 1, entries A–B), that alkyne 2 is probably fully associated with surfactant 3 above its CMC (entries C–D), and that azide 1 does not associate detectibly with 3 (E–G). Water-soluble complexes Cu-A and Cu-B diffuse slower than the respective free ligands (entries H–I and Table S1, entries N–O) and do not associate with the micelles (entries J–K) while the hydrophobic Cu-C complex binds strongly to the micelles (entries L–M). The diffusion rates of the free small molecules, such as the surfactant below its CMC, the azide, and free B are in agreement with their molecular weights according to Morris’ correlation (Table S1).43 Using the Stokes–Einstein relationship we calculate a hydrodynamic radius of 1.9 nm for micelles of surfactant 3 at 22 mM, which is in agreement with the data obtained from DLS.44
Table 1. Diffusion Coefficients Extracted from DOSY Experiments.
| entry | species presenta | Db (3) | D (2) | D (1) | D (ligand) | D (TMSc) |
|---|---|---|---|---|---|---|
| A | 3 (2 mM) | 3.6 | – | – | – | 8.2 |
| B | 3 (22 mM) | 1.3 | – | – | – | 1.2 |
| C | 3 (2 mM) + 2 (saturated) | 3.8 | NDd | – | – | 4.1 |
| D | 3 (22 mM) + 2 (saturated) | 1.3 | 0.58e | – | – | 1.1 |
| E | 1 (91 mM) | – | – | 4.3 | – | – |
| F | 3 (2 mM) + 1 (91 mM) | 3.6 | – | 4.4 | – | 7.6 |
| G | 3 (22 mM) + 1 (91 mM) | 1.2 | – | 4.9 | – | 1.2 |
| H | B (8.3 mM) | – | – | 4.1 | – | 9.0 |
| I | [Cu-B] (8.3 mM) | – | – | – | 3.1 | 9.8 |
| J | 3 (2 mM) + [Cu-B] (8.3 mM) | 3.1 | – | – | 3.0 | 9.3 |
| K | 3 (22 mM) + [Cu-B] (8.3 mM) | 1.3 | – | – | 2.8 | 1.5 |
| L | 3 (2 mM) + [Cu-C] (saturated) | 3.8 | – | – | ND | 8.6 |
| M | 3 (22 mM) + [Cu-C] (saturated) | 1.1 | – | – | 0.67 | 1.2 |
The diffusion coefficients for all reaction components present in the system during the synthesis of 3.
D values reported in 10–10 m2 s–1.
TMS was added as a control.
ND indicates that the diffusion coefficient could not be extracted because of the limited solubility of the compound in water.
A value below that of 3 and TMS indicates a strong association with the micelle, where the measured value of 3 reflects the presence of monomeric and aggregated surfactant.
Inverting the Polarity of the System
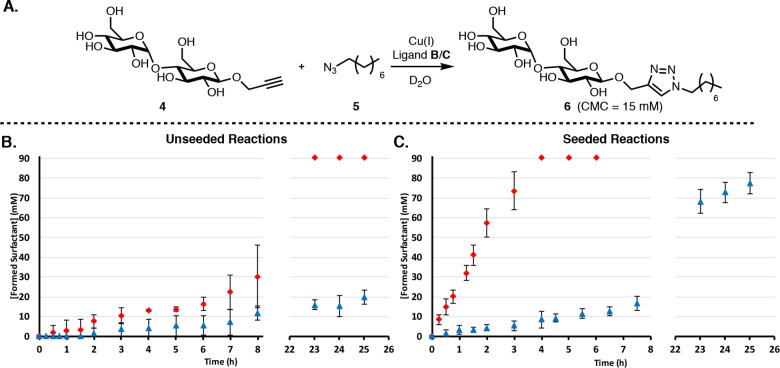
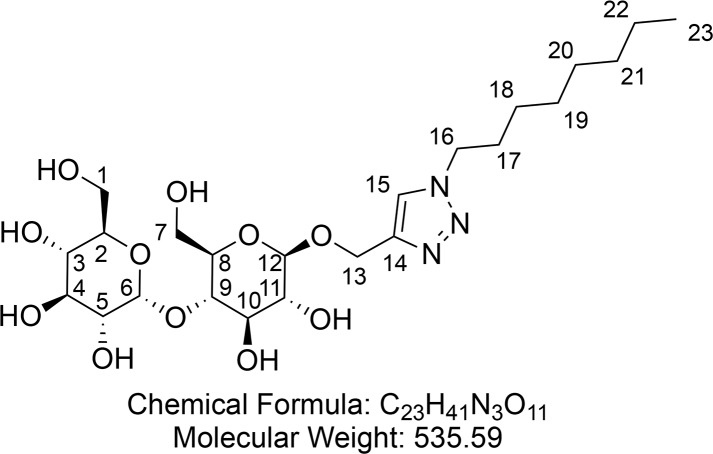
We inverted the polarity of the reaction components by synthesizing a hydrophilic, maltose-based alkyne 4 and a hydrophobic alkyl azide 5 (Figure 4A) and examined the reactivity of this “inverse” system for ligands B and C. DLS and fluorimetry measurements showed that surfactant 6 forms micelles of around 6 nm at 15 mM (Figures S22 and S24). Switching the polarity of the coupling partners results in a significantly slower rate and a pronounced lag period for both ligands (Figure 4B). However, the trend of reactions involving C being much faster than those with B remains (see Tables S5 and S6 for extracted rates). Seeding the C reaction with product entirely eliminated the lag period and led to a remarkably fast reaction (Figure 4C). Conversely, the reaction with B is slow and reaches completion only after several days. Even when seeded it does not reach completion within 1 day, unlike all the other seeded reactions we have studied.
Figure 4.
(A) Reaction scheme for the “inverted system” involving coupling water-soluble alkyne 4 and hydrophobic azide 5 to give 6. (B) Kinetics using ligands B (blue triangles) and C (red diamonds) in the unseeded inverted system. Identical reaction conditions to those for the original system were applied. (C) Kinetics when the inverted system is seeded with product (30 mM). Points are the mean of three independent experiments and the error bars are the standard deviation.
When the reaction was performed in a 1:1 water/tert-butanol mixture to facilitate phase mixing (Figure S45) complete conversion was observed within 30 min for both ligands. Interestingly, this is a faster rate than in the original system even though this reaction is significantly slower under biphasic conditions.
DOSY experiments aimed at probing aggregation states in the inverse system show similar phenomena as above, in that only hydrophobic components associate with the micelle (Table 2 and SI for extended Table S2). Surfactant 6 aggregates above the CMC (Table 2, entries A–B), azide 5 is fully associated with surfactant 6 above the CMC (entries C–D), and alkyne 4 does not associate detectibly with 6 (entries E–G). Water-soluble complex Cu-B diffuses slower than the respective free ligand (Table S2) and does not associate with the micelles (entries H–I) while the hydrophobic Cu-C complex binds strongly to the micelles (entries J–K).
Table 2. Diffusion Coefficients Extracted from DOSY Experiments.
| entry | species presenta | Db (6) | D (5) | D (4) | D (ligand) | D (TMS) |
|---|---|---|---|---|---|---|
| A | 6 (3 mM) | 3.4 | – | – | – | 7.2 |
| B | 6 (30 mM) | 2.1 | – | – | – | 1.9 |
| C | 6 (3 mM) + 5 (saturated) | 3.3 | ND | – | – | 7.0 |
| D | 6 (30 mM) + 5 (saturated) | 1.9 | 1.9 | – | – | 1.7 |
| E | 4 (91 mM) | – | – | 3.8 | – | – |
| F | 6 (3 mM) + 4 (91 mM) | 3.2 | – | 3.8 | – | 5.0 |
| G | 6 (30 mM) + 4 (91 mM) | 1.9 | – | 3.7 | – | 1.9 |
| Hc | 6 (3 mM) + [Cu-B] (8.3 mM) | 2.3 | – | – | 2.5 | 7.8 |
| I | 6 (30 mM) + [Cu-B] (8.3 mM) | 2.2 | – | – | 2.6 | 2.1 |
| J | 6 (3 mM) + [Cu-C] (saturated) | 3.3 | – | – | ND | 7.1 |
| K | 6 (30 mM) + [Cu-C] (saturated) | 1.4 | – | – | 1.0 | 2.0 |
The diffusion coefficients for reaction components present in the system during the synthesis of 6.
D values reported in 10–10 m2 s–1.
There may be an association between monomers of 6 and [Cu-B] leading to the observed D of 2.3 and not the expected D of ∼3.3. The D of TMS suggests that no surfactant aggregation/encapsulation is taking place. 6 with ligand B (and no copper) diffuses at the expected rate (see SI Table S2).
Deuterium Exchange Measurements
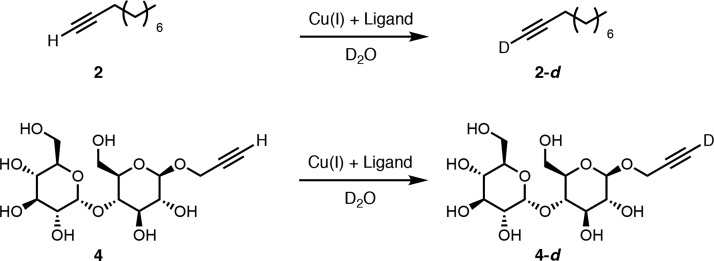
The rate of deuterium exchange for alkynes 2 and 4 to yield 2-d and 4-d by copper in D2O was measured to probe how readily alkynes coordinate to Cu-L and subsequently interact with water (Scheme 1 and Table 3). These experiments may be relevant to the first step of the CuAAC mechanism where coordination of copper to alkyne is believed to occur. With compound 2 in the absence of copper, no deuterium exchange was observed (entry 1). For 2 with both Cu-B and Cu-C, the rate of H- to D-exchange was slow giving 58% and 32% conversion respectively within a day (entries 2 and 3). It may be that exchange is faster with hydrophilic Cu-B because the complex can more easily interact with water. When H- to D-exchange experiments with 2 were seeded with 3, full conversion to 2-d was observed within 5 h (entries 4 and 5).
Scheme 1. Deuterium Exchange Control Experiment for Alkyne 2 and 4.
Table 3. Conversion and Reaction Time for the Deuterium Exchange Reaction of Alkyne 2 and 4.
| entrya | alkyne | ligandb | seed (mM)c | conv (%)d | time |
|---|---|---|---|---|---|
| 1 | 2 | N/Ae | 0 | 0 | 24 h |
| 2 | 2 | B | 0 | 58 | 24 h |
| 3 | 2 | C | 0 | 32 | 24 h |
| 4 | 2 | B | 22 | 100 | 5 h |
| 5 | 2 | C | 22 | 100 | 5 h |
| 6 | 4 | N/A | 0 | 0 | 24 h |
| 7 | 4 | B | 0 | 100 | <1 min |
| 8 | 4 | C | 0 | 100 | 3 h |
| 9 | 4 | C | 30 | 100 | 2.5 h |
Standard reaction conditions were applied in D2O in the absence of azides to prevent CuAAC.
Different rates of deuterium exchange were observed when ligand B or C was applied.
Seeding the system with 3 (for 2) or 6 (for 4) increased the rate of D-exchange in all cases.
Reactions monitored and conversion determined by 1H NMR spectroscopy.
Control reaction in the absence of copper.
With hydrophilic alkyne 4, H- to D-exchange also did not occur in the absence of copper (entry 6). Using the combination of 4 and ligand B exchange was so fast that full conversion is observed in less than a minute (entry 7). However, C required 3 h for full D-exchange (entry 8). The hydrophilic Cu-B complex and hydrophilic alkyne combination results in much faster exchange than phase separated components. Surprisingly, seeding Cu-C mediated exchange of 4 to 4-d with product 6 did not significantly increase the reaction rate (entry 9). This might indicate that these CuAAC reactions benefit more from solubilization of hydrophobic azide 5 than from bringing hydrophobic Cu-C into the aqueous phase or interface.
Overall copper is required for the deuterium exchange, and it appears that phase separation between the Cu-L-complex and alkyne impacts the rate of exchange. Addition of product leads to acceleration of exchange for alkyne 2 while 4 is minimally impacted. This may indicate that the first step in the CuAAC reaction here is accelerated by product formation for alkyne 2 while this is not the case for alkyne 4.
Mechanistic Rationalization
The mechanism at play in these systems is reminiscent of phase transfer catalysis, where two substances located in different immiscible phases are able to react via a catalyst. This is possible because the catalyst is able to transfer a substrate to its opposing phase. Although phase-transfer catalysis is well developed, some mechanistic aspects still remain unclear,45−47 at least partially because of problems arising from monitoring biphasic systems and the many parameters involved. Mechanistic studies have been performed on micellar autocatalysis;22,48,49 however, these models never involved a secondary catalyst such as reported here.
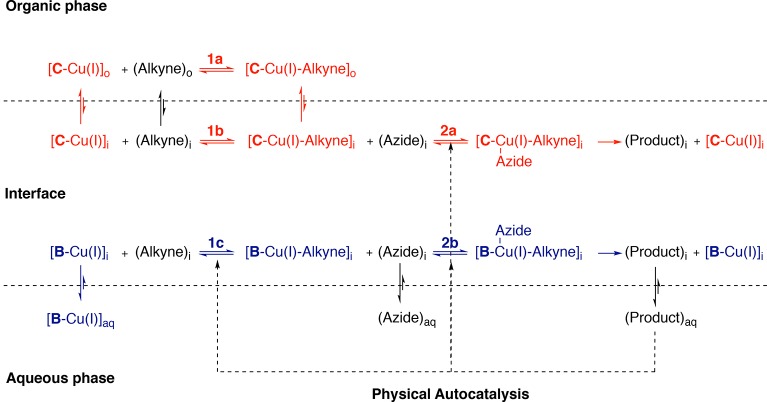
Our rationalization for the kinetics observed in the original system is shown in Figure 5. We think of the system as consisting of three phases: an organic phase (alkyne), an aqueous phase, and an interfacial phase where the two mix well. The micelles are seen as an extension of the interface. The mechanism of CuAAC is complex, but there are likely two key steps that involve interaction of components that would be phase separated here, namely the interaction of copper with alkyne and subsequently the interaction of this complex with azide.50−57 Although initial coordination of azide to copper might occur in a phase separated case, we assume the generally accepted sequence of events occurs here and believe that if the sequence were inverted the overall conclusions drawn from the model (vide infra) would not change. We assume other steps, such as formation of the copper-ligand complex and demetalation of the triazole, occur rapidly relative to the phase separated steps and are therefore not incorporated into the model nor is the mono- or dinuclear nature of the catalyst complex.
Figure 5.
Proposed mechanism for physical autocatalysis in a biphasic CuAAC reaction involving a hydrophobic alkyne and a hydrophilic azide. Red represents processes catalyzed by Cu-C, and blue, those catalyzed by Cu-B.
The deuterium exchange experiments have given some insight into the rates of interaction of alkyne with copper, and from this, the rates of the second step can be inferred. The model assumes that the phase behavior of complexes and intermediates are similar to those of the individual reaction components observed during the DOSY experiments.
In steps where the hydrophilic reagent is present at high concentrations in the aqueous phase, we expect efficient phase transfer catalysis by the micelle and these steps to be promoted by product. For steps where the hydrophilic reagent is present at low concentrations, we expect less efficient phase transfer catalysis, and therefore they are weakly promoted by product (weakly autocatalytic). Colocalization, solubilization of two hydrophobic reagents within the micelle will lead to a strongly promoted step. Whenever it is stated that a step is faster, promoted, or more efficient, it is important to note that this is due to a change in the rate of mass transport, not a change in catalytic activity of copper.
(Step 1) Hydrophobic alkyne and Cu-L interact
Since the [C-Cu(I)]-complex and alkyne are both strongly hydrophobic, they can react freely and quickly in the organic phase (Figure 5, step 1a and 1b). This step will therefore not benefit from any product formation. The [B-Cu(I)]-complex on the other hand is mainly present in the aqueous phase and has to encounter the alkyne at the interface (step 1c). Autocatalysis can accelerate this step, but it will be limited by Cu-B complex concentration leading to a weak promotion of this step.
(Step 2) Aqueous azide coordinates to Cu-L-alkyne complex
The azide is hydrophilic, and with both B and C this should be a biphasic process (Figure 5, step 2a and 2b) that is promoted by the presence of product. We assume that the Cu-B-alkyne complex will be in the interface and B is not sufficiently polar to solubilize it completely into the aqueous phase (slow H-to-D exchange is observed here, Table 3, entry 2), so that step 2 with both ligands will occur at the interface and behave similarly. Subsequently product 3 accumulates at the interface, while Cu-L re-enters the catalytic cycle. Once the CMC is reached and micelles form, the product will start to catalyze any biphasic steps.
This qualitatively accounts for the observed differences between B and C (Figure 2). For B, step 1c is slow since it is biphasic and we observe a significant lag-period (up to about 7 h). For C, step 1a/b will be fast as it is a single-phase reaction and we observe a short lag period of 30 min. Step 2 presumably has significant biphasic character in either case.
The model also qualitatively accounts for differences observed between seeded and nonseeded reactions. With B seeding with product all but eliminates the lag period and doubles the maximum rate, likely by facilitating the mixing of hydrophilic catalyst and hydrophobic azide in step 1. With ligand C there is not a significant difference in maximum rate between seeded and nonseeded reactions (see Tables S3 and S4 for extracted rates). Overall it appears that the ligand polarity can effectively make step 1 fast or slow: with ligand C, step 1 is rapid, while, with ligand B, step 1 becomes rate-limiting.
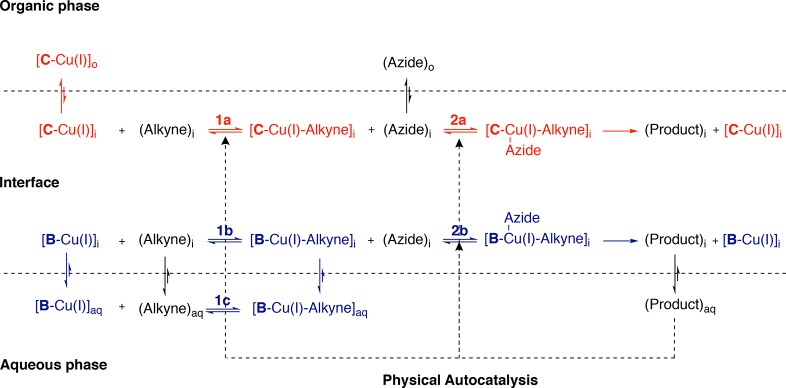
A modified model (Figure 6) is required to explain the kinetics of the inverse system which considers the phase behavior of the different coupling partners.
Figure 6.
Proposed mechanism for a biphasic CuAAC reaction with a hydrophilic alkyne and hydrophobic azide. Red represents processes catalyzed by Cu-C, and blue, those catalyzed by Cu-B.
(Step 1) Aqueous alkyne and Cu-L interact
Association of the [C-Cu(I)]-complex with alkyne is initially slow (Figure 6, step 1a) but only weakly promoted once micelles of 6 are formed. Although the complex can associate with the micelle (Table 2, entries J and K), 4 does not readily associate with micelles (Table 2, entries E, F, and G). And as judged by H- to D-exchange experiments (Table 3, entries 8 and 9) micelles do not have very much of an effect on the way the complex and 4 encounter each other. Step 1b for the [B-Cu(I)]-complex is fast, as alkyne and Cu-B are both soluble in water (Table 3, entry 7).
(Step 2) Hydrophobic azide coordinates to Cu-L-alkyne complex
Cu-C-alkyne is likely hydrophobic enough to colocalize with 5 inside the micelle. This will strongly promote step 2a upon formation of micelles. For B step 2b will be weakly promoted: the organic azide needs to encounter Cu-B-alkyne complex assembled from two hydrophilic components. While micelles should increase the concentration of azide that can encounter Cu-B-alkyne, the concentration of the latter in micelles is probably low. 6 will accumulate at the interface and, once the CMC is reached, catalyze any biphasic steps.
Overall the kinetics of this system are slower, with both ligands showing pronounced lag periods (Figure 4B). Water/tert-butanol experiments suggest this is not due to inherent substrate reactivity (Figures S43 and S45). This may be due to rate limiting step 2 where the Cu-L-alkyne complex has to interact with the hydrophobic substrate. Since this complex will be present in the low concentrations, this could be the cause for the slower kinetics observed in the absence of micelles.
When seeded (Figure 4C) reactions with C showed a significant rate increase, but with B the reaction is only minimally promoted by product. Co-localization of the Cu-C-alkyne complex and 5 in the micelles should lead to higher local concentrations and faster reactions for C, while the strongly hydrophilic Cu-B-alkyne complex does not as easily interact with the micelles. Overall it appears that step 2 is rate limiting here and this step can be strongly promoted using product 6 with ligand C but not ligand B.
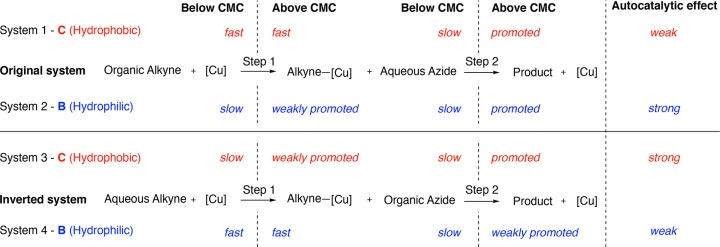
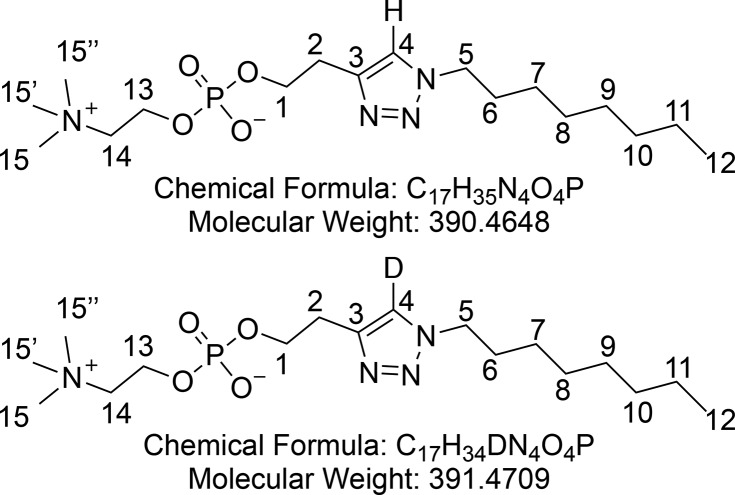
The four different systems investigated and the degree to which surfactant products should promote each step are summarized in Figure 7. Steps where both reagents are present in the same phase will be fast, while steps where substrates are phase separated are slow. Micelles will promote phase separated steps, but if this involves a low concentration of aqueous substrate the step will only be weakly promoted. Overall ‘systems 2 and 3’ (Figure 7) should see the more dramatic autocatalytic effects since the rate limiting steps in these two systems are promoted by product formation. A new system was developed to investigate if biphasic autocatalytic CuAAC reactions are reasonably general and see if the model could be used to predict a reaction with an autocatalytic effect. Alkyne 7 containing a zwitterionic phosphocholine headgroup (Figure 8A) was coupled to azide 5 using ligand C to yield surfactant 8 (conditions of system 3, Figure 7). A CuAAC reaction with this new polar alkyne should show efficient autocatalysis since according to the model the main prerequisite for this effect is phase separation. This system shows a lag period, and seeding with product leads to a disappearance of the lag period and a pronounced rate acceleration (Figure 8B).58 These results support the idea that the model can be used to predict an autocatalytic effect.
Figure 7.
Summary of phase-transfer models used to understand Cu-catalyzed self-reproduction of micelles, and a prediction of whether an autocatalytic effect should be observed.
Figure 8.
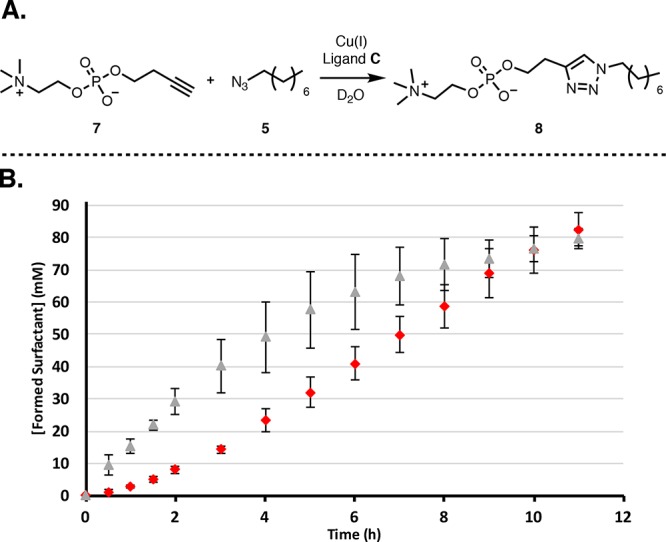
(A) Biphasic coupling of phosphocholine 7 and azide 5 to form surfactant 8. (B) Kinetics using ligand. (C) The unseeded reaction (red diamonds) has a lag period followed by an increased rate of product formation. When the system is seeded with product 8 (30 mM, gray triangles), the lag period is eliminated and a significant rate increase is observed. Points are the mean of three independent experiments, and the error bars are the standard deviation.
Conclusions
This study has shown that a secondary catalyst promoting CuAAC reactions can be used to tune the kinetics of a system that is autocatalytic as a whole by virtue of phase behavior. Coupling a secondary catalytic cycle to an autocatalytic cycle enables control of the reaction kinetics through rational variations in catalyst structure. Changing the hydrophilicity of the ligand, and therefore the location of the active catalyst, provides a handle to vary the rate limiting step of the reaction. Our observations can be rationalized in terms of the phase behavior of the reaction components. A predictive model was obtained that has shown that a hydrophobic ligand and azide combined with a hydrophilic alkyne can be used to obtain a pronounced autocatalytic effect. We anticipate that these studies might be useful in understanding how to gain control over the spatial organization of compartmentalized reactions.
Experimental Section
General Information
Procedures using oxygen- and/or moisture-sensitive materials were performed with anhydrous solvents under an atmosphere of anhydrous argon in flame-dried flasks, using standard Schlenk techniques. Analytical TLC was performed on precoated aluminum-backed plates (Silica Gel 60 F254; Merck),and visualized using aqueous ceric ammonium molybdate (CAM), aqueous basic potassium permanganate, or ninhydrin stains. Flash column chromatography was carried out using Merck Geduran Si 60 (40–63 μm) silica gel. The compound was loaded on to the columns with Chemtube Hydromatrix from Agilent Technologies. Pressure was applied at the column head via a flow of nitrogen with the solvent system used in parentheses.
Cooling of reaction mixtures to 0 °C was achieved using an ice–water bath. Cooling to −10 °C was achieved using a salt–ice bath. Cooling to −78 °C was achieved using a dry ice–acetone bath.
Chemicals
All chemicals were purchased from Sigma-Aldrich or Fluorochem Scientific and used without further purification. Dry CHCl3, THF, CH2Cl2, Et2O, toluene, benzene, hexane, pentane, DMF, and acetonitrile were collected fresh from an mBraun SPS-5 solvent purification system having been passed through anhydrous alumina columns. All other solvents were used as purchased from Sigma-Aldrich, Honeywell, or Fisher Scientific.
Equipment
All NMR spectra were recorded at room temperature. 1H NMR and 13C NMR spectra were recorded using Bruker AVIII HD 400 (400/101 MHz) and AVIII HD 500 (500/126 MHz) spectrometers. Chemical shifts are reported in ppm from the residual solvent peak. Chemical shifts (δ) are given in ppm, and coupling constants (J) are quoted in hertz (Hz). Resonances are described as s (singlet), d (doublet), t (triplet), q (quartet), and m (multiplet). Assignments were made with the assistance of 2D COSY and HSQC NMR experiments.
DOSY NMR measurements were performed using a Bruker AVIII HD 500 equipped with a TFI probehead at 298 K using the 2D sequence for diffusion measurement using double stimulated echo for convection compensation and longitudinal eddy current delay, using bipolar gradient pulses for diffusion, and using three spoil gradients (Bruker terminology: dstebpgp35) pulse sequence. The samples were thoroughly mixed using a Vortex Genie 2 mixer (Scientific Industries) and were then clarified using a hand centrifuge (Hettich, model 1011) and then measured. Samples containing saturated alkyne consequently had a small layer of neat alkyne above the D2O layer; sufficient D2O was used to ensure that the alkyne layer was not detectible by the NMR probe. Experiments were performed in two stages: initially 1D-edited DOSY experiments were used to optimize the diffusion period to Δ = 100 ms. The 2D dstebpgp35 sequence was then used, based on the optimized Δfrom the previous procedure and with δ = 4 ms, with the gradient amplitude ranging from 2% to 85% with 16 points in between. Data were analyzed using the T1T2 module in TOPSPIN 3.2, and plots were generated using the eddosy module.
High-resolution mass spectra (EI and ESI) were recorded using a Bruker MicroTOF spectrometer by the internal service at the University of Oxford. Low-resolution mass spectra were recorded using a Walters LCT premier XE.
Infrared measurements (thin film) were carried out using a Bruker Tensor 27 FTIR with internal calibration in the range 4000–600 cm–1.
Optical rotations were recorded using a PerkinElmer 241 polarimeter at 25 °C in a 10 cm cell in the stated solvent. [α]D values are given in 10–1 deg·cm2 g–1, with concentration c given as g/100 mL.
Fluorimetry was performed using Edinburgh Instruments Spectrofluorometer FS5 model with Fluoracle software. The slit width for both excitation and emission was set at 1 nm.
DLS measurements were recorded using a Malvern Zetasizer Nano ZS DLS instrument and analyzed with Zetasizer software. All samples were prepared in ultrapure Milli-Q water and filtered through 0.2 μm PTFE filters before measuring.
Experimental Procedures and Characterization of Compounds
General Procedure 1: Synthesis of Protected Surfactant Products via CuAAC Reaction
Conditions adapted from Shao et al.59 To a stirred suspension of CuI (0.02 equiv) in degassed CH2Cl2 was added protected maltose (1 eq, 160 mM), DIPEA (0.04 equiv), AcOH (0.04 equiv) and hydrophobic coupling partner (1.4 equiv). The resulting solution was stirred for 18 h. The reaction mixture was concentrated in vacuo, and the crude was purified with flash column chromatography. The column was eluted with EtOAc:hexane (1:1) to yield the product.
General Procedure 2: Acetyl Deprotection
Synthesis according to Mahon et al.60 To a stirred suspension of protected sugar (150 mM) in MeOH was added sodium methoxide (0.1 equiv). Upon dissolution of the solid and concurrent disappearance of protected sugar (TLC control) the solution was neutralized using Amberlyst 15 resin (H+ form). The resin was filtered off and washed with MeOH and the filtrate was concentrated in vacuo. The residue was dried under high vacuum to give a deprotected sugar as a tacky, hygroscopic white foam.
General Procedure 3: Setup of Kinetic Experiments
A solution of hydrophilic substrate (0.408 mmol, 1 eq, 1.5 mL of 272 mM standard solution in D2O), CuSO4·5H2O (6 mg, 0.024 mmol, 0.06 eq, 1 mL of 6 mg/mL standard solution in D2O) (and deprotected surfactant in the reported concentrations for the seeded reactions) were added to D2O (2 mL) to give a total volume of 4.5 mL in a round-bottom flask (25 mL) with a stirrer bar of an identical size (4.5 mm diameter and 12 mm length) for each experiment. Subsequently ligand (0.12 equiv), hydrophobic substrate (2 equiv) were added and the flask was capped with a septum and the solution was degassed by bubbling argon through it for 30 min. Afterward sodium ascorbate (16.2 mg, 0.082 mmol, 0.2 equiv) was added to initiate the reaction. The reaction mixture was stirred at 200 rpm under a continuous flow of argon. Samples for analysis during the kinetic experiments were prepared at regular intervals by diluting 0.1 mL of the reaction mixture in 0.4 mL of D2O and immediately taking a 1H NMR measurement.
Note: These reactions are very sensitive to physical parameters, so changing the flask size or stirrer bar or adding compounds at different time points during the degassing process might affect the overall kinetics of the reaction.
Note 2: The deuterium exchange experiments were performed in the absence of azide 1 or 5. Alkyne 2 was monitored by extracting 0.1 mL of the reaction mixture into 0.4 mL of CDCl3 and immediately taking a 1H NMR measurement.
α/β-d-Maltose Octaacetate (9)
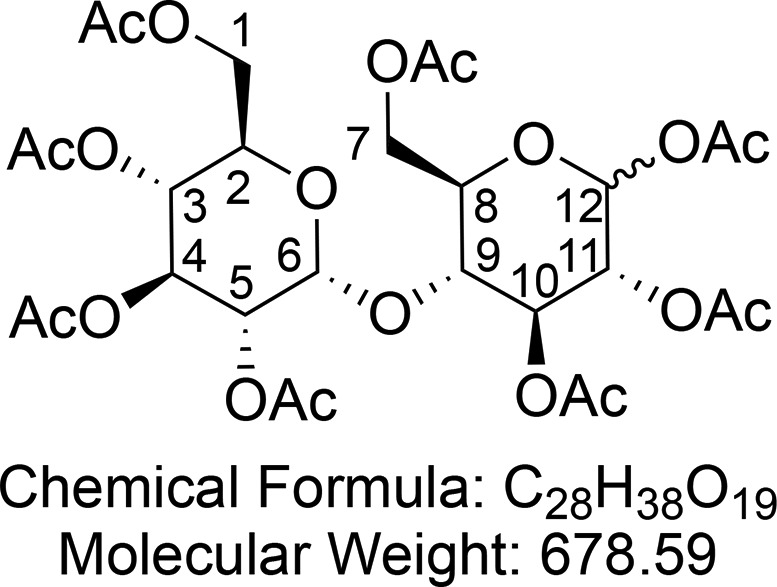
Synthesized according to Harvey et al.61 NaOAc (5.00 g, 61.0 mmol, 1.1 equiv) was added to a stirred suspension of d-maltose (10.0 g, 29.2 mmol, 1 equiv) in Ac2O (50 mL) at 140 °C. The reaction was stirred until deemed complete by the disappearance of maltose (TLC control, 2:1 petroleum ether/EtOAc) (approximately 1 h). The reaction mixture was diluted with CH2Cl2 (50 mL). The organic mixture was washed with saturated aqueous NaHCO3 (3 × 100 mL), dried (Na2SO4), and concentrated in vacuo to yield the peracetylated d-maltose 9 (23.0 g, quantitative yield, α:β ≈ 1:4.55) as an amorphous white solid.
1H NMR (400 MHz, CDCl3) δ 5.74 (d, J = 8.1 Hz, 1H, CH-6), 5.40 (d, J = 4.1 Hz, 1H, CH-12), 5.35 (dd, J = 10.6, 9.5 Hz, 1H, CH-4), 5.29 (t, J = 9.0 Hz, 1H, CH-10), 5.05 (dd, J = 10.2, 9.5 Hz, 1H, CH-3), 4.97 (dd, J = 9.2, 8.2 Hz, 1H, CH-5), 4.85 (dd, J = 10.5, 4.0 Hz, 1H, CH-11), 4.45 (dd, J = 12.3, 2.5 Hz, 1H, CHaHb-7), 4.30–4.17 (m, 2H, CHaHb-7 and CHaHb-1), 4.07–3.99 (m, 2H, CHaHb-1 and CH-9), 3.97–3.92 (m, 1H, CH-2), 3.83 (ddd, J = 9.7, 4.5, 2.6 Hz, 1H, 10.1, 3.1 Hz, 1H, CH-8), 2.22 (s, 6H, CH3CO), 2.13 (s, 3H, CH3CO), 2.09 (s, 6H, CH3CO), 2.04 (s, 3H, CH3CO), 2.02 (s, 3H, CH3CO), 2.01 (s, 3H, CH3CO), 2.01 (s, 3H, CH3CO), 2.00 (s, 3H, CH3CO). 13C{1H} NMR (101 MHz, CDCl3) δ 170.7, 170.6, 170.6, 170.1, 170.1, 170.0, 169.5, 169.0, 95.9, 88.9, 72.4, 72.3, 70.20, 70.15, 69.8, 69.3, 68.7, 68.0, 62.5, 61.4, 21.1, 21.0, 20.9, 20.8, 20.73 (2C), 20.71, 20.6. HRMS (ESI) m/z calcd for C28H38O19Na [M + Na]+, 701.1900; found, 701.1896.
Data reported here are for the β-anomer and are consistent with reported literature values.60
Hepta-O-acetyl-1-deoxy-1-azido-β-d-maltopyranose (10)
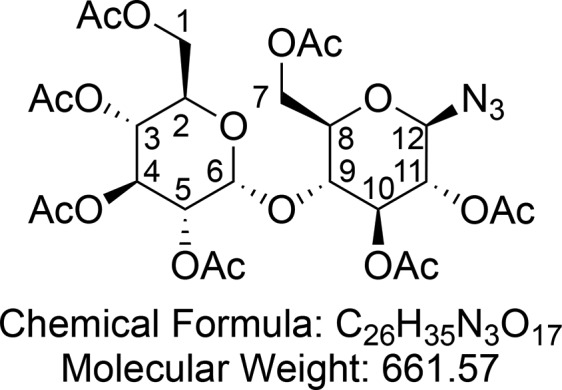
Synthesized according to Mahon et al.60 The crude maltose octaacetate 9 (40.8 g, 60.1 mmol, 1.0 equiv) was dissolved in AcOH (80 mL). HBr (80 mL, 33% solution in AcOH, 12 equiv) was added slowly at 0 °C, and the reaction was stirred at rt until complete (TLC control, 3:1 petroleum ether/EtOAc, approximately 3 h). The reaction mixture was diluted with CH2Cl2 (100 mL). The layers were separated, and the organic layer was washed with saturated aqueous NaHCO3 (3 × 100 mL) and then brine (1 × 100 mL). The organic layer was dried (Na2SO4) and concentrated in vacuo to give a syrupy yellow oil (43.7 g). The crude bromide was dissolved in CHCl3 (90 mL), and saturated aqueous NaHCO3 (90 mL) was added. Tetrabutylammonium iodide (20 g, 54.1 mmol, 0.9 equiv) was added, followed by NaN3 (slow addition, 5 min, 18.00 g, 213.8 mmol, 4.6 equiv), and the reaction was stirred at rt for 18 h. The layers were partitioned, and the organic layer was washed with H2O (100 mL), saturated aqueous NaHCO3 (100 mL), and brine (100 mL). The organic layer was dried (MgSO4) and concentrated in vacuo to give a brown solid. The crude product was recrystallized from a minimum of hot MeOH to give hepta-O-acetyl-1-deoxy-1-azido-β-d-maltopyranose 10 (26.0 g, 39.3 mmol, 65% over two steps) as a white crystalline solid.
1H NMR (400 MHz, CDCl3) δ 5.40 (d, J = 4.0 Hz, 1H, CH-6), 5.34 (dd, J = 10.6, 9.5 Hz, 1H, CH-4), 5.25 (t, J = 8.9 Hz, 1H, CH-10), 5.04 (dd, J = 10.3, 9.5 Hz, 1H, CH-3), 4.84 (dd, J = 10.6, 4.0 Hz, 1H, CH-5), 4.77 (t, = 8.9 Hz, 1H, CH-11), 4.70 (d, J = 8.7 Hz, 1H, CH-12), 4.50 (dd, J = 12.2, 2.6 Hz, 1H, CHaHb-7), 4.23 (ddd, J = 12.3, 4.2, 2.0 Hz, 2H, CHaHb-7 and CHaHb-1), 4.04 (dd, J = 12.5, 2.3 Hz, 1H, CHaHb-1), 4.01 (dd, J = 9.8, 8.7 Hz, 1H, CH-9), 3.98–3.89 (m, 1H, CH-2), 3.77 (ddd, J = 9.8, 4.5, 2.6 Hz, 1H, CH-8), 2.15 (s, 3H, CH3CO), 2.09 (s, 3H, CH3CO), 2.04 (s, 3H, CH3CO), 2.03 (s, 3H, CH3CO), 2.02 (s, 3H, CH3CO), 2.00 (s, 3H), 1.99 (s, 3H, CH3CO). 13C{1H} NMR (101 MHz, CDCl3) δ 170.7, 170.6, 170.2, 170.1, 169.64, 169.56, 95.8, 87.6, 75.2, 74.4, 72.5, 71.6, 70.1, 69.4, 68.8, 68.1, 62.7, 61.6, 51.0, 21.0, 20.90, 20.8, 20.72, 20.69 (3C). HRMS (ESI) m/z calcd for C26H35O17N3Na [M + Na]+, 684.1859; found, 684.1855.
Consistent with reported literature values.60
1-(Hepta-O-acetyl-1-deoxy-β-d-maltopyranosyl)-4-octyl Triazole (11)
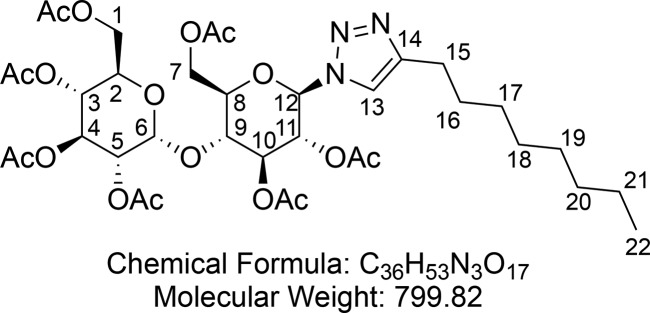
Synthesized according to general procedure 1 using maltose azide 10 (1.00 g, 1.51 mmol), CuI (6 mg, 0.032 mmol), DIPEA (10 μL, 0.06 mmol), AcOH (3.5 μL, 0.06 mmol), and 1-decyne (290 μL, 1.6 mmol). Flash column chromatography (50% EtOAc in hexane) provided 1-(hepta-O-acetyl-1-deoxy-β-d-maltopyranosyl)-4-octyl triazole 11 (1.20 g, 1.50 mmol, quantitative yield) as a white foam.
1H NMR (400 MHz, CDCl3) δ 7.42 (s, 1H, CH-13), 5.86 (d, J = 9.3 Hz, 1H, CH-12), 5.48–5.42 (m, 2H, CH-6 and CH-10), 5.35 (m, 2H, CH-4 and CH-11), 5.08 (t, J = 9.8 Hz, 1H, CH-3), 4.88 (dd, J = 10.5, 4.0 Hz, 1H, CH-5), 4.48 (dd, J = 12.4, 2.4 Hz, 1H, CHaHb-7), 4.27 (t, J = 3.9 Hz, 1H, CHaHb-1), 4.24 (t, J = 4.0 Hz, 1H, CHaHb-7), 4.12 (dd, J = 9.8, 8.7 Hz, 1H, CH-9), 4.05 (dd, J = 12.5, 2.3 Hz, 1H, CHaHb-1), 3.97 (m, 2H, CH-2 and CH-8), 2.74–2.67 (m, 2H, CH2-15), 2.13 (s, 3H, CH3CO), 2.11 (s, 3H, CH3CO), 2.07 (s, 3H, CH3CO), 2.03 (s, 3H, CH3CO), 2.03 (s, 3H, CH3CO), 2.01 (s, 3H, CH3CO), 1.84 (s, 3H, CH3CO), 1.65 (m, 2H, CH2-16), 1.36–1.21 (m, 10H, (CH2)5-17,18,19,20,21), 0.91–0.85 (m, 3H, CH2-22). 13C{1H} NMR (101 MHz, CDCl3) δ 170.7, 170.6, 170.4, 170.0 (2C), 169.5, 169.3, 149.2, 118.8, 96.0, 85.2, 75.38, 75.35, 72.6, 71.0, 70.1, 69.3, 68.9, 68.0, 62.7, 61.6, 31.9, 29.4, 29.3, 29.2 (2C), 25.7, 22.7, 20.92, 20.86, 20.8, 20.7, 20.2, 14.2. HRMS (ESI) m/z calcd for C36H54O17N3 [M + H]+, 800.3448; found, 800.3441.
Consistent with reported literature values.62
1-Deoxy-1-azido-β-d-maltopyranose (1)
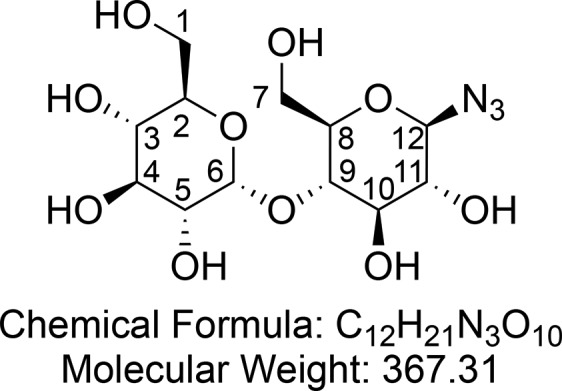
Synthesized according to general procedure 2 using protected maltose azide 10 (2.00 g, 3.02 mmol) and NaOMe (20 mg, 0.37 mmol). After concentration in vacuo 1-deoxy-1-azido-β-d-maltopyranose 1 (1.13 g, quantitative yield) was obtained as a hygroscopic, off white foam.
1H NMR (400 MHz, D2O) δ 5.37 (d, J = 3.9 Hz, 1H, CH-6), 4.71 (d, J = 8.8 Hz, 1H, CH-12), 3.92–3.87 (m, 1H, CH-11), 3.81 (dd, J = 12.1, 2.1 Hz, 1H, CHaHb-7), 3.75 (ddd, J = 12.9, 4.3, 2.3 Hz, 2H, CHaHb-1 and CHaHb-7), 3.71–3.61 (m, 6H, CHaHb-1 and CH-2 and CH-4 and CH-8 and CH-9 and CH-10), 3.53 (dd, J = 9.9, 3.9 Hz, 1H, CH-5), 3.37 (t, J = 9.4 Hz, 1H, CH-3), 3.25 (t, J = 9.1 Hz, 1H CH-11). 13C{1H} NMR (101 MHz, D2O) δ 99.5, 89.9, 76.4, 76.1, 76.0, 72.7, 72.6 (2C), 71.6, 69.2, 60.42, 60.37. HRMS (ESI) m/z calcd for C12H20O10N3 [M – H]−, 366.1154; found, 366.1153.
Consistent with reported literature values.62
1-(1-Deoxy-β-d-maltopyranosyl)-4-octyl Triazole (3)
Synthesized according to general procedure 2 using protected surfactant 11 (2.15 g, 2.79 mmol) and NaOMe (40 mg, 0.74 mmol). After concentration in vacuo 1-(1-deoxy-β-d-maltopyranosyl)-4-octyl triazole 3 (1.30 g, 2.58 mmol, 92%) was obtained as a hygroscopic, off white foam.
1H NMR (400 MHz, D2O) δ 7.85 (s, 1H, CH-13), 5.50 (d, J = 7.7 Hz, 1H, CH-12), 5.33–5.27 (m, 1H, CH-6), 3.90–3.68 (m, 4H, CH-11 and CH-10 and CHaHb-7 and CHaHb-1), 3.68–3.48 (m, 6H, CHaHb-7 and CHaHb-1 and CH-3 and CH-4 and CH-8 and CH-9), 3.47–3.38 (m, 1H, CH-5), 3.34–3.27 (m, 1H, CH-2,), 2.42 (m, 2H, CH2-15), 1.43 (m, 2H, CH2-16), 1.13 (m, 10H, (CH2)5-17,18,19,20,21), 0.72 (t, J = 6.0 Hz, 3H, CH3-22). 13C{1H} NMR (101 MHz, D2O) δ 147.8, 125.7, 99.9, 87.3, 77.4, 76.4 (2C), 72.8 (2C), 72.1, 72.0, 69.1, 62.4, 60.4, 31.8, 29.2 (3C), 28.8, 25.0, 22.5, 13.7. HRMS (ESI) m/z calcd for C22H39O10N3Na [M + Na]+, 528.2528; found, 528.2525.
Consistent with reported literature values.62
Benzyl Azide (12)
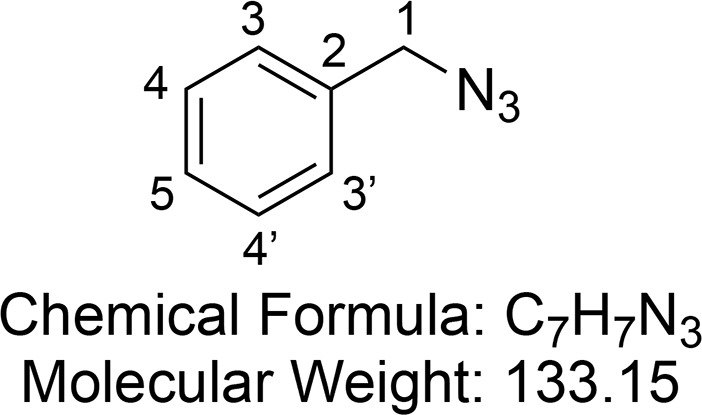
Synthesized according to Healy et al.63 Benzyl bromide (6.95 mL, 58.5 mmol, 1 equiv) was added dropwise to a solution of sodium azide (7.6 g, 117 mmol, 2 equiv) in (3:1 acetone/water, 100 mL), and the resulting mixture was stirred at room temperature for 1 h. The reaction was diluted with water (200 mL) and extracted with ethyl acetate (3 × 300 mL). The combined layers were washed with brine (2 × 200 mL), dried (MgSO4), and concentrated in vacuo to give benzyl azide 12 as a crude colorless oil (7.32 g, 55.0 mmol, 94%). Due to instability 12 was immediately used in the next step.
1H NMR (400 MHz, CDCl3) δ 7.44–7.29 (m, 5H, CH-3 and CH-3′ and CH-4 and CH-4′ and CH-5), 4.35 (s, 2H, CH2-1). 13C{1H} NMR (101 MHz, CDCl3) δ 128.9, 128.3, 128.2, 54.8.
Consistent with reported literature values.63
Tris(benzyltriazolylmethyl)amine (TBTA, Ligand C) (13)
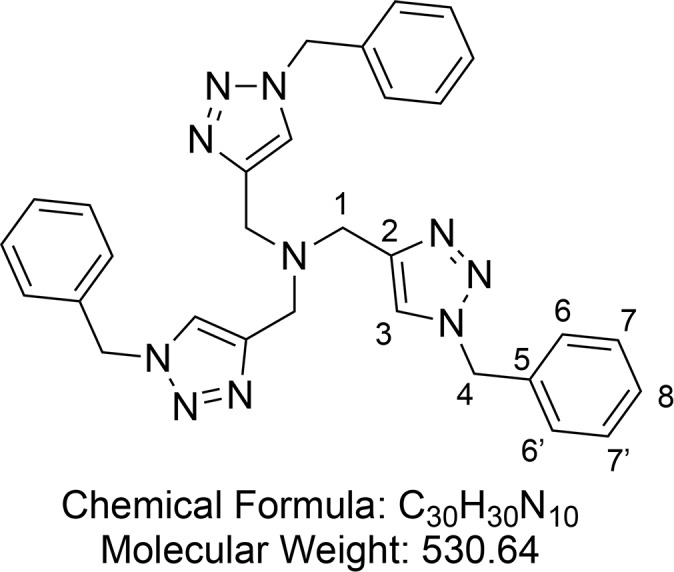
Synthesized according to Zhu et al.64 Benzyl azide 12 (6.87 mL, d = 1.066 g/mL, 55 mmol, 4 equiv) was dissolved in tert-butyl alcohol (100 mL) in a 250 mL round-bottom flask equipped with a magnetic stir bar. Tripropargylamine (2.444 mL, d = 0.927 g/mL, 17.2 mmol, 1 equiv) was subsequently added, and the flask was placed in a water bath at rt. Cu(OAc)2·H2O (212 mg, 1 mmol, 0.06 equiv) was added in the solid form, and the reaction flask was left uncovered while being stirred for 5 min. The flask was then closed with a rubber septum equipped with an argon balloon. The reaction mixture was allowed to stir overnight, during which time a precipitate formed. The precipitate was purified by flash column chromatography (1–3% MeOH in DCM) to afford a pink solid. This was then dissolved in a minimum of hot MeCN, and crystallization was induced through addition of Et2O. The crystals were collected by filtration to provide TBTA 13 (7.78 g, 14.7 mmol, 85%) as a white crystalline solid.
1H NMR (400 MHz, CDCl3) δ 7.65 (s, 3H, CH-3), 7.38–7.30 (m, 9H, CH-6 and CH-6′ and CH-8), 7.29–7.22 (m, 6H, CH-7 and CH-7′), 5.50 (s, 6H, CH2-4), 3.70 (s, 6H, CH2-1). 13C{1H} NMR (101 MHz, CDCl3) δ 134.7, 129.1, 128.7, 128.0, 54.2. HRMS (ESI) m/z calcd for C30H31N10 [M + H]+, 531.2728; found, 531.2725.
Consistent with reported literature values.64
3-Bromopropyl Acetate (14)
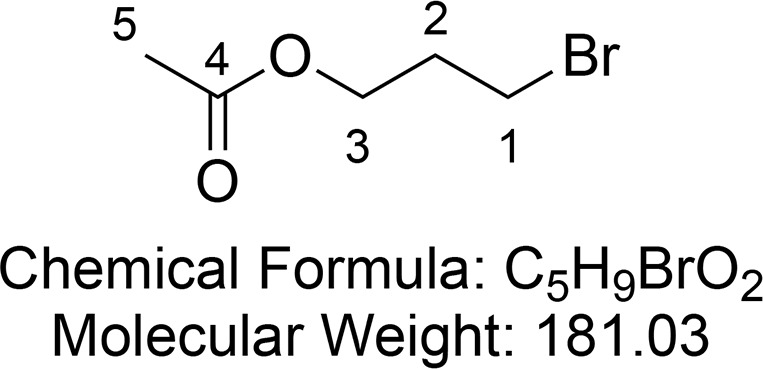
Synthesized according to Hong et al.65 A mixture of Ac2O (2.24 mL, 21.58 mmol, 1 equiv) and Et3N (3.31 mL, 21.58 mmol, 1 equiv) was added to 3-bromo-propanol (1.88 mL, 21.58 mmol, 1 equiv) dissolved in CH2Cl2 (30 mL) and stirred at room temperature for an hour. The reaction mixture was washed with saturated aqueous NaHCO3 (2 × 40 mL) and brine (2 × 40 mL). The organic layer was dried (MgSO4) and concentrated in vacuo to afford 3-bromopropyl acetate 14 (3.50 g, 19.3 mmol, 90%) as a colorless liquid.
1H NMR (400 MHz, CDCl3) δ 4.20 (t, J = 6.1 Hz, 2H, CH2-3), 3.47 (t, J = 6.5 Hz, 2H, CH2-1), 2.18 (p, J = 6.4 Hz, 2H, CH2-2), 2.06 (s, 3H, CH3-5). 13C{1H} NMR (101 MHz, CDCl3) δ 170.9, 62.2, 31.7, 29.4, 20.9.
Consistent with reported literature values.65
3-Azidopropyl Acetate (15)
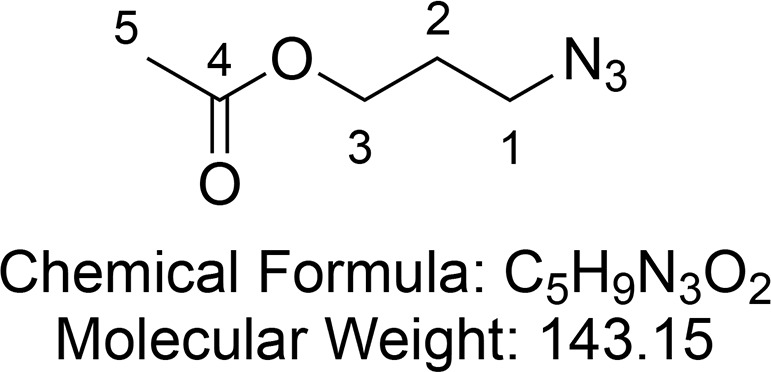
Synthesized according to Hong et al.65 Water (100 mL) and NaN3 (2.8 g, 43 mmol, 2 equiv) were added to 3-bromopropyl acetate 14 (3.5 g, 19.3 mmol, 1 equiv), and the resulting solution was stirred at 90 °C overnight. The mixture was extracted with dichloromethane (3 × 100 mL). The combined organic layers were dried (MgSO4) and concentrated in vacuo to yield 3-azidopropyl acetate 15 as pale yellow oil (2.32 g, 15.2 mmol, 79%, some product was lost through evaporation and hydrolysis).
1H NMR (400 MHz, CDCl3) δ 4.15 (t, J = 6.2 Hz, 2H, CH2-3), 3.40 (t, J = 6.7 Hz, 2H, CH2-1), 2.06 (s, 3H, CH3-5), 1.91 (p, J = 6.5 Hz, 2H, CH2-2). 13C{1H} NMR (101 MHz, CDCl3) δ 171.0, 61.3, 48.2, 28.1, 20.9.
Consistent with reported literature values.65
Tris(3-acetoxypropyltriazolylmethyl)amine (16)
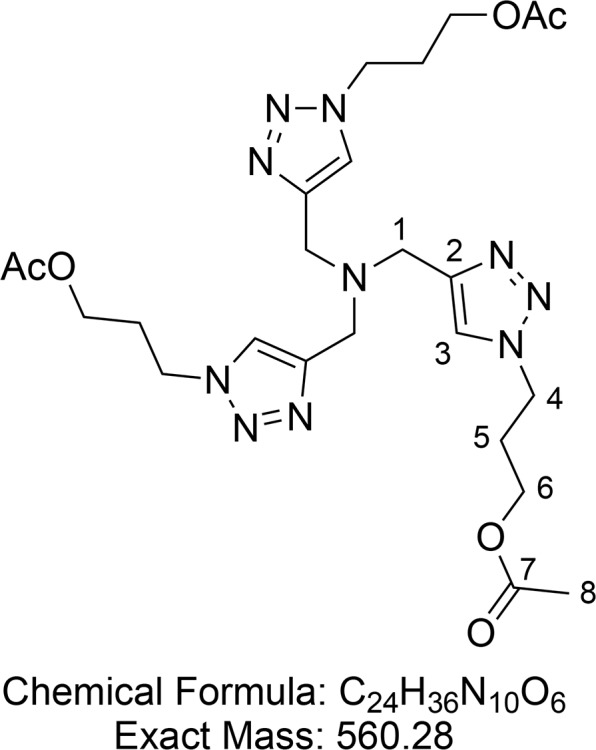
Synthesized according to Hong et al.65 3-Azidopropyl acetate 15 (4.91 g, 34.2 mmol, 4.0 equiv) was dissolved in tert-butyl alcohol (50 mL) in a 100 mL round-bottom flask equipped with a magnetic stir bar. Tripropargylamine (1.21 mL, 8.56 mmol, 1.0 equiv) was subsequently added, and the flask was placed in a water bath at rt. Cu(OAc)2·H2O (100 mg, 0.5 mmol, 0.06 equiv) was added in the solid form, and the reaction flask was left uncovered while being stirred for 5 min. The flask was then closed with a rubber septum equipped with an argon balloon. The reaction mixture was allowed to stir overnight, during which the solution gelated. Diethyl ether (100 mL) was added to the flask, and the stirring continued for another 10–20 min. The solvent was evaporated, and flash column chromatography (1–3% MeOH in CH2Cl2) provided protected THPTA 16 (4.75 g, 8.48 mmol, 99% yield) as a white crystalline solid.
1H NMR (400 MHz, CDCl3) δ 7.81 (s, 3H, CH-3), 4.47 (t, J = 7.1 Hz, 6H, CH2-4), 4.10 (t, J = 6.0 Hz, 6H, CH2-6), 3.74 (s, 6H, CH2-1), 2.32–2.23 (m, 6H, CH2-5), 2.08 (s, 9H, CH3-8). 13C{1H} NMR (101 MHz, CDCl3) δ 171.0, 143.9, 124.2, 61.0, 47.2, 47.0, 29.5, 21.0. HRMS (ESI) m/z calcd for C24H37O6N10 [M + H]+, 561.2892; found, 561.2889.
Consistent with reported literature values.65
Tris(3-hydroxypropyltriazolylmethyl)amine (THPTA, Ligand B) (17)
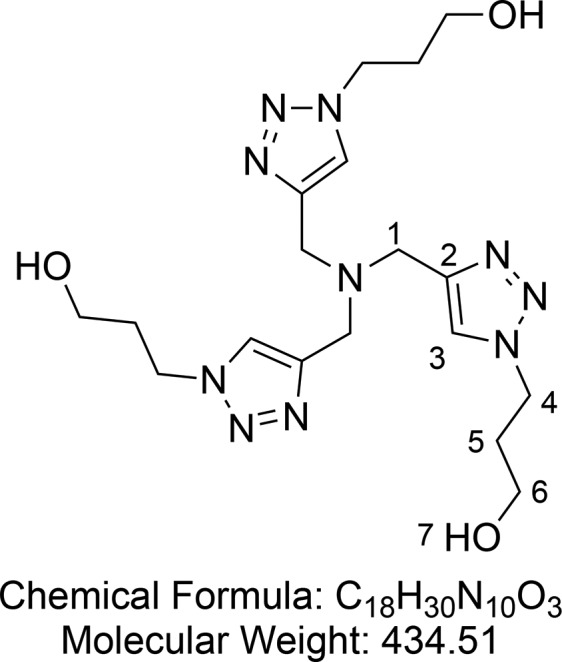
Synthesized according to Hong et al.65 Tris(3-acetoxypropyltriazolylmethyl)amine 16 (4.75 g, 8.48 mmol, 1 equiv) was treated with ammonia in MeOH (2 M, 160 mL), and the mixture was stirred at 40 °C overnight. The solution was concentrated, and the residue dried under high vacuum. The resulting pale yellow solid was dispersed in acetonitrile, sonicated to further break up the solid, filtered, washed with acetonitrile, and dried under vacuum to yield THPTA 17 (3.66 g, 84.2 mmol, quantitative yield) as a white solid.
1H NMR (400 MHz, D2O) δ 7.91 (s, 3H, CH-3), 4.48 (t, J = 7.0 Hz, 6H, CH2-4), 3.80 (s, 6H, CH2-1), 3.55 (t, J = 6.2 Hz, 6H, CH2-6), 2.10 (p, J = 6.7 Hz, 6H, CH2-5). 13C{1H} NMR (101 MHz, D2O) δ 143.9, 125.9, 58.8, 48.1, 47.8, 32.4. HRMS (ESI) m/z calcd for C18H31O3N10 [M + H]+, 435.2575; found, 435.2573.
Consistent with reported literature values.65
Propargyl Hepta-O-acetyl-β-d-maltopyranoside (18)
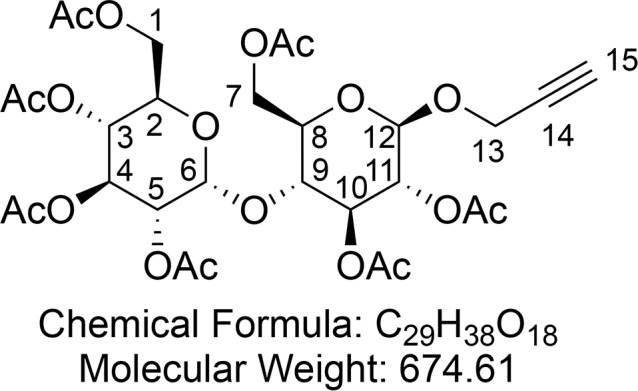
A flame-dried 250 mL flask was charged with peracetylated maltose 9 (19.0 g, 28.0 mmol, 1 equiv) and 4 Å MS (5.00 g), capped with a rubber septum and filled with argon. To the flask dry DCM (100 mL) and propargyl alcohol (3.26 mL, 56 mmol) were sequentially added via syringe. The reaction mixture was cooled to 0 °C with an ice bath, and BF3·Et2O (12 mL, 84 mmol) was slowly added dropwise. After stirring overnight, the reaction was quenched by slow addition of sat. aq. K2CO3 (100 mL). The organic layer was subsequently washed with H2O (100 mL) and brine (100 mL), dried (MgSO4), concentrated in vacuo, and purified by flash column chromatography (30% EtOAc in hexane) to yield propargyl hepta-O-acetyl-β-d-maltopyranoside 18 (12.0 g, 17.8 mmol, 64%) as a brown foam. 18 was obtained exclusively as the β-anomer; residual starting material consisted of pure α-anomer.
1H NMR (400 MHz, CDCl3) δ 5.41 (d, J = 4.0 Hz, 1H, CH-6), 5.35 (dd, J = 10.6, 9.5 Hz, 1H, CH-4), 5.28 (t, J = 8.9 Hz, 1H, CH-10), 5.05 (dd, J = 10.3, 9.5 Hz, 1H, CH-3), 4.90–4.81 (m, 2H, CH-11 and CH-5), 4.80 (d, J = 7.8 Hz, 1H, CH-12), 4.50 (dd, J = 12.1, 2.7 Hz, 1H, CHaHb-7), 4.35 (d, J = 2.4 Hz, 2H, CH2-13), 4.24 (ddd, J = 11.8, 7.4, 4.1 Hz, 2H, CHaHb-1 and CHaHb-7), 4.08–3.99 (m, 2H, CHaHb-1 and CH-9), 3.95 (ddd, J = 10.3, 3.9, 2.3 Hz, 1H, CH-2), 3.72 (ddd, J = 9.6, 4.3, 2.7 Hz, 1H, CH-8), 2.47 (t, J = 2.4 Hz, 1H, CH-15), 2.14 (s, 3H, CH3CO), 2.10 (s, 3H, CH3CO), 2.04 (s, 3H, CH3CO), 2.04 (s, 3H, CH3CO), 2.02 (s, 3H, CH3CO), 2.01 (s, 3H, CH3CO), 2.00 (s, 3H, CH3CO). 13C{1H} NMR (101 MHz, CDCl3) δ 170.6, 170.6, 170.3, 170.1, 169.8, 169.5, 97.7, 95.6, 78.2, 75.7, 75.4, 72.6, 72.3, 71.9, 70.1, 69.4, 68.6, 68.1, 62.7, 61.6, 60.5, 56.0, 21.02, 20.95, 20.80, 20.79, 20.72, 20.70. HRMS (ESI) m/z calcd for C29H38O18Na [M + Na]+, 697.1950; found, 697.1932. IR (ATR) ν (cm–1) thin film, CH2Cl2: 3275 (w), 2960 (w), 1748 (s), 1434 (w), 1369 (m), 1229 (s), 1040 (s). [α]25D = +40.8 (c = 1.00, CH2Cl2).
1-Azidooctane (5)
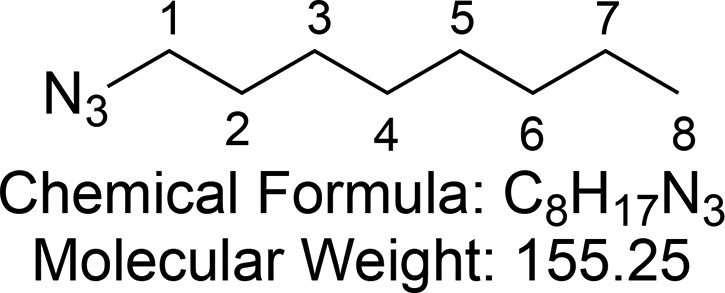
Synthesized according to Murnane et al.66 Bromo alkane (8.95 mL, 51.78 mmol, 1 equiv) and sodium azide (10.0 g, 155.3 mmol, 3 equiv) were added to a mixture of acetone/water (3:1, 80 mL). The solution was heated to 60 °C for 8 h. After completion of reaction, the solution was cooled to room temperature and excess solvent was removed under vacuum. The resulting aqueous solution was extracted with hexane (3 × 80 mL). The combined organic extracts were washed with brine and dried (MgSO4), and excess solvent was removed in vacuo to obtain 1-azidooctane 5 (6.32 g, 40.7 mmol, 79%) as a transparent liquid.
1H NMR (400 MHz, CDCl3) δ 3.25 (t, J = 7.0 Hz, 2H, CH-1), 1.64–1.54 (m, 2H, CH-2), 1.42–1.19 (m, 10H, (CH2)5-3,4,5,6,7), 0.91–0.85 (m, 3H, CH3-8). 13C{1H} NMR (101 MHz, CDCl3) δ 51.6, 31.9, 29.3, 29.2, 29.0, 26.8, 22.8, 14.2.
Consistent with reported literature values.66
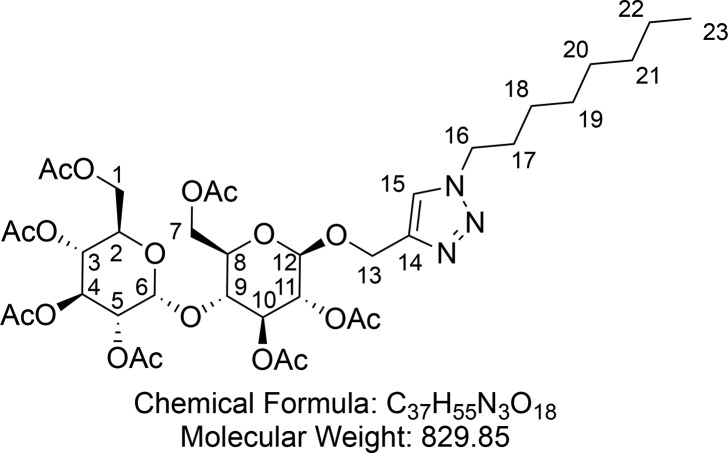
1-Octyl-4-(propargyl hepta-O-acetyl-β-d-maltopyranosidyl) Triazole (19)
Synthesized according to general procedure 1 using maltose alkyne 18 (2.00 g, 2.96 mmol), CuI (28 mg, 0.15 mmol), DIPEA (60 μL, 0.36 mmol) AcOH (16 μL, 0.28 mmol), and 1-azidooctane (628 μL, 3.56 mmol). Flash column chromatography (30% EtOAc in hexane) provided 1-octyl-4-(propargyl hepta-O-acetyl-β-d-maltopyranosidyl) triazole 19 (2.02 g, 2.44 mmol, 82%) as a white foam.
1H NMR (400 MHz, CDCl3) δ 7.50 (s, 1H, CH-15), 5.41 (d, J = 4.0 Hz, 1H, CH-6), 5.40–5.30 (m, 1H, CH-4), 5.24 (t, J = 9.1 Hz, 1H, CH10), 5.05 (t, J = 9.9 Hz, 1H, CH-3), 4.94–4.78 (m, 4H, CH-10 and CH-5 and CH2-16), 4.68 (d, J = 7.9 Hz, 1H, CH-12), 4.52 (dd, J = 12.2, 2.7 Hz, 1H, CHaHb-7), 4.34 (t, J = 7.3 Hz, 2H, CH2-13), 4.24 (ddd, J = 12.1, 10.0, 4.1 Hz, 2H, CHaHb-1 and CHaHb-7), 4.07–3.98 (m, 2H, CHaHb-1 and CH-9), 3.96 (ddd, J = 10.2, 3.8, 2.4 Hz, 1H, CH-2), 3.71 (ddd, J = 9.6, 4.3, 2.6 Hz, 1H, CH-8), 2.15 (s, 3H, CH3CO), 2.10 (s, 3H, CH3CO), 2.04 (s, 3H, CH3CO), 2.03 (s, 3H, CH3CO), 2.00 (s, 3H, CH3CO), 1.99 (s, 3H, CH3CO), 1.97 (s, 3H, CH3CO), 1.90 (q, J = 7.2 Hz, 2H, CH2-17), 1.35–1.21 (m, 10H, (CH2)5-18–22), 0.90–0.85 (m, 3H, CH3-23). 13C{1H} NMR (101 MHz, CDCl3) δ 170.7, 170.6, 170.3, 170.1, 169.8, 169.6, 122.7, 99.5, 95.6, 75.4, 72.7, 72.4, 72.2, 70.1, 69.4, 68.6, 68.1, 63.1, 62.8, 61.6, 50.5, 31.8, 30.4, 29.2, 29.1, 26.6, 22.7, 21.0, 20.83, 20.78, 20.74, 20.73, 20.71, 14.2. HRMS (ESI) m/z calcd for C37H56O18N3 [M + H]+, 830.3553; found, 830.3549. IR (ATR) ν (cm–1) thin film, CH2Cl2: 2960 (w), 2858 (w), 1751 (s), 1436 (w), 1369 (m), 1230 (s), 1043 (s). [α]25D = +28.7 (c = 0.50, CH2Cl2).
Propargyl-β-d-maltopyranoside (4)
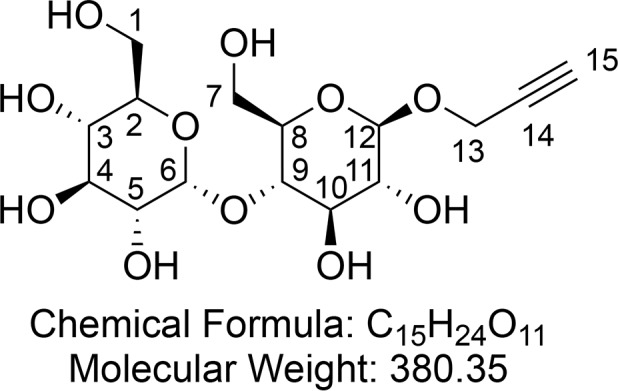
Synthesized according to general procedure 2 using protected maltose alkyne 18 (1.46 g, 2.16 mmol) and NaOMe (50 mg, 0.93 mmol). After concentration in vacuo propargyl-β-d-maltopyranoside 4 (809 mg, 2.13 mmol, 98%) was obtained as a hygroscopic, off-white foam.
1H NMR (400 MHz, CD3OD) δ 5.13 (d, J = 3.8 Hz, 1H, CH-6), 4.44 (d, J = 7.8 Hz, 1H, CH-12), 4.38 (dd, J = 4.1, 2.5 Hz, 2H, CH2-13), 3.86 (dd, J = 12.2, 2.1 Hz, 1H, CHaHb-7), 3.81–3.74 (m, 2H, CHaHb-1 and CHaHb-7), 3.67–3.62 (m, 2H, CHaHb-1 and CH-3), 3.61 (d, J = 5.8 Hz, 1H, CH-10), 3.59–3.54 (m, 1H, CH-4), 3.50 (t, J = 9.2 Hz, 1H, CH-9), 3.40 (dd, J = 9.7, 3.8 Hz, 1H, CH-5), 3.34 (ddd, J = 9.7, 4.8, 2.2 Hz, 1H, CH-8), 3.22 (ddd, J = 9.3, 8.4, 5.0 Hz, 2H, CH-2 and CH-11), 2.84 (t, J = 2.4 Hz, 1H). 13C{1H} NMR (101 MHz, CD3OD) δ 102.9, 102.0, 81.2, 80.0, 77.72, 76.68, 76.3, 75.0, 74.8, 74.4, 74.1, 71.5, 62.7, 62.1, 56.6. HRMS (ESI) m/z calcd for C15H24O11Na [M + Na]+, 403.1211; found, 403.1211. IR (ATR) ν (cm–1) thin film, MeOH: 3355 (s), 2924 (w), 1362 (w), 1146 (m), 1073 (s), 1029 (s), 640 (m). [α]25D = +29.9 (c = 1.00, MeOH).
1-Octyl-4-(propargyl-β-d-maltopyranosidyl) Triazole (6)
Synthesized according to general procedure 2 using protected surfactant 19 (2.00 g, 2.42 mmol) and NaOMe (50 mg, 0.93 mmol). After concentration 1-octyl-4-(propargyl-β-d-maltopyranosidyl) triazole 6 (790 mg, 1.48 mmol, 61%) was obtained as a hygroscopic, off-white foam.
1H NMR (400 MHz, CD3OD) δ 8.07 (s, 1H, CH-15), 5.12 (d, J = 3.8 Hz, 1H, CH-6), 4.94 (d, J = 12.6 Hz, 1H, CHaHb-13), 4.77 (d, J = 12.6 Hz, 1H, CHaHb-13), 4.31 (4.34–4.29 (m, 3H, CH-12 and CH2-16), 3.88 (dd, J = 12.2, 2.1 Hz, 1H, CHaHb-7), 3.84–3.73 (m, 2H, CHaHb-1 and CHaHb-7), 3.64 (ddd, J = 8.6, 5.8, 1.6 Hz, 2H, CHaHb-1 and CH-3), 3.60–3.52 (m, 2H, CH-10 and CH-4), 3.51–3.47 (m, 1H, CH-9), 3.43–3.35 (m, 2H, CH-5 and CH-8), 3.25–3.21 (m, 2H, CH-2 and CH-11), 1.88 (p, J = 6.8 Hz, 2H, CH2-17), 1.36–1.20 (m, 10H, (CH2)5-18–22), 0.89–0.83 (m, 3H, CH3-23). 13C{1H} NMR (101 MHz, CD3OD) δ 145.2, 125.7, 103.6, 102.9, 81.3, 77.7, 76.7, 75.0, 74.8, 74.6, 74.1, 71.4, 62.7, 62.2, 51.8, 32.9, 31.2, 30.2, 30.0, 27.4, 23.7, 14.4. HRMS (ESI) m/z calcd for C23H41O11N3Na [M + Na]+, 558.2633; found, 558.2630. IR (ATR) ν (cm–1) thin film, MeOH: 3362 (s), 2926 (s), 2857 (m), 1647 (w), 1458 (w), 1148 (m), 1106 (s), 1074 (s). [α]25D = +41.0 (c = 1.00, MeOH).
2-(But-3-yn-1-yloxy)-1,3,2-dioxaphospholane 2-Oxide (20)
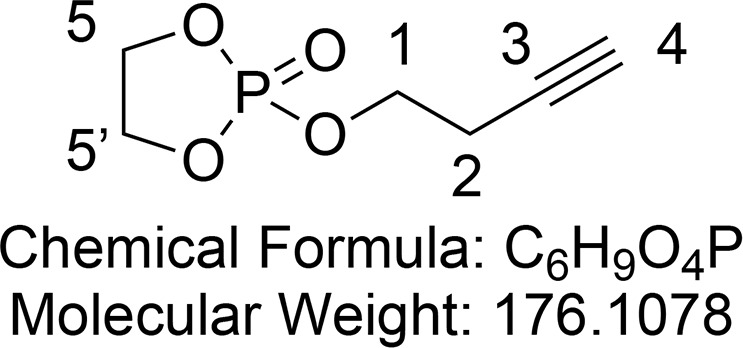
Synthesized according to an adapted procedure from Hu et al.67 To a solution of 3-butyn-1-ol (1.06 mL, 14.0 mmol, 1 equiv) in anhydrous THF (20 mL) was added triethylamine (2.15 mL, 15.4 mmol, 1.1 equiv) at 0 °C under an argon atmosphere. After slow addition of 2-chloro-2-oxo-1,3,2-dioxaphospholane (1.29 mL, 14.0 mmol, 1 equiv), the mixture was warmed to room temperature and stirred for 2 h. The white suspension was filtered over a sintered funnel, and the filtrate was concentraed by rotary evaporation and dried in vacuo to give phospholane 20 (2.30 g, 13.1 mmol, 93%) as a yellow oil. This was used without further purification due to decomposition of 20 on silica.
1H NMR (400 MHz, CDCl3) δ 4.50–4.32 (m, 4H, CH2-5 and CH2-5′), 4.24 (dt, J = 9.5, 6.8 Hz, 2H, CH2-1), 2.62 (td, J = 6.8, 2.7 Hz, 2H, CH2-2), 2.04 (t, J = 2.7 Hz, 1H, CH-4). 13C{1H} NMR (101 MHz, CDCl3) δ 79.2, 70.6, 66.4 (d, JCP = 5.7 Hz), 66.2 (d, JCP = 3.1 Hz, 2C), 20.9 (d, JCP = 6.6 Hz). 31P NMR (162 MHz, CDCl3) δ 17.4.
Consistent with reported literature values.68
But-3-yn-1-yl (2-(Trimethylammonio)ethyl) Phosphate (7)
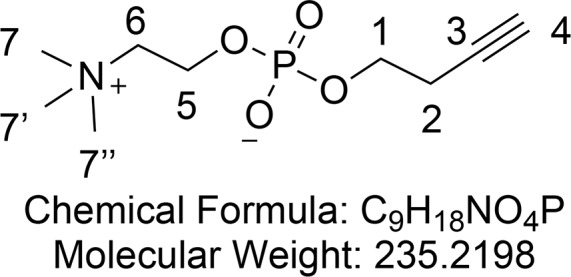
Synthesized according to an adapted procedure from Liu et al.69 Crude phospholane 20 (2.30 g, 13.1 mmol) was dissolved in dry MeCN (20 mL) in a 100 mL flame-dried flask under argon. After trimethylamine (21 mL, 21 mmol, 1.6 equiv, 1 M in THF) was added, the flask was closed and heated to 70 °C for 48 h. The crude mixture was concentrated in vacuo and purified by flash column chromatography (10% H2O and 40% MeOH in CH2Cl2) to yield phosphocholine 7 (2.42 g, 10.3 mmol, 79%) as a transparent oil that crystallizes in the freezer.
1H NMR (400 MHz, CD3OD) δ 4.29 (tq, J = 6.9, 2.7 Hz, 2H, CH2-5), 3.96 (q, J = 7.0 Hz, 2H, CH2-1), 3.67–3.62 (m, 2H, CH2-6), 3.23 (s, 9H, CH3-7 and CH3-7′ and CH3-7′′), 2.53 (td, J = 6.8, 2.7 Hz, 2H, CH2-2), 2.30 (t, J = 2.6 Hz, 1H, CH2-4). 13C{1H} NMR (101 MHz, CD3OD) δ 81.8, 71.0, 67.5–67.3 (m, JCN+ and JCP), 65.0 (d, JCP = 5.6 Hz), 60.4 (d, JCN+ = 4.9 Hz), 54.8–54.6 (m, 3C, JCN+), 49.8, 30.7, 24.2, 21.6 (d, JCP = 7.9 Hz). 31P NMR (162 MHz, CD3OD) δ −0.55. HRMS (ESI) m/z calcd for C9H19NO4P [M + H]+, 236.1046; found, 236.1045. IR (ATR) ν (cm–1) thin film, MeOH: 3273 (broad m), 2361 (w), 1654 (w), 1479 (w) 1229 (m), 1083 (s), 1051 (s), 970 (w), 926 (w).
2-(1-Octyl-1H-1,2,3-triazol-4-yl)ethyl (2-(Trimethylammonio)ethyl) Phosphate (8)
A solution of phosphocholine 7 (192 mg, 0.816 mmol, 1 equiv, 2 mL of 96 mg/mL standard solution in D2O) and CuSO4·5H2O (6 mg, 0.024 mmol, 0.03 equiv, 1 mL of 6 mg/mL standard solution in D2O) were added to t-BuOH (2 mL). The flask was capped with a septum, and the solution was degassed by bubbling argon through it for 30 min. Subsequently ligand B (25.5 mg, 0.6 equiv), azide 5 (288 μL, 1.632 mmol, 2 equiv), and sodium ascorbate (16.2 mg, 0.082 mmol, 0.1 equiv) were added. The crude mixture was concentrated in vacuo and purified by flash column chromatography (10% H2O and 40% MeOH in CH2Cl2) to yield phosphocholine 8 (263 mg, 0.672 mmol, 82%) as a colorless wax. Partial deuteration of the triazole occurred because the reaction was performed in the presence of deuterated water.
1H NMR (400 MHz, CD3OD) δ 7.88 (s, 1H, CH-4), 4.36 (t, J = 7.2 Hz, 2H, CH2-5), 4.26–4.17 (m, 2H, CH2-13), 4.13 (q, J = 6.4 Hz, 2H, CH2-1), 3.65–3.59 (m, 2H, CH2-14), 3.22 (s, 9H, CH3-15 and CH3-15′ and CH3-15′′), 3.04 (t, J = 6.3 Hz, 2H, CH2-2), 1.89 (p, J = 7.1 Hz, 2H, CH2-6), 1.41–1.21 (m, 10H, (CH2)5-7–11), 0.96–0.86 (m, 2H, CH3-12). 13C{1H} NMR (101 MHz, CD3OD) δ 67.6–67.2 (m, JCN+ and JCP), 65.6 (d, JCP = 5.2 Hz), 60.3 (d, JCN+ = 4.5 Hz), 55.42–52.40 (m, 3C, JCN+), 51.3, 32.9, 31.3, 30.2, 30.1, 28.2 (d, J = 7.4 Hz), 27.5, 23.6, 14.4. 31P NMR (162 MHz, CD3OD) δ −0.58. HRMS (ESI) m/z calcd for C17H34DO4N4P [M + H]+, 392.2532; found, 392.2534. IR (ATR) ν (cm–1) thin film, MeOH: 3377 (broad s), 2926 (m), 2856, (w), 2359 (m), 2342 (w), 1655 (w), 1469 (w) 1227 (m), 1086 (s), 970 (w).
Acknowledgments
The EPSRC (EP/M0025241/1) and the ERC (Consolidator Grant, Autocat, 681491) are gratefully acknowledged for financial support. We wish to thank Andrew Bissette for his insightful comments.
Supporting Information Available
The Supporting Information is available free of charge on the ACS Publications website at DOI: 10.1021/acs.joc.8b03149.
Relevant DOSY, fluorimetry, DLS, and kinetic data (PDF)
The authors declare no competing financial interest.
Supplementary Material
References
- Brinker U.; Mieusset J.. Molecular Encapsulation; Brinker U. H., Mieusset J.-L., Eds.; John Wiley & Sons, Ltd.: Chichester, U.K., 2010. [Google Scholar]
- Vriezema D. M.; Aragonès M. C.; Elemans J. A. A. W.; Cornelissen J. J. L. M.; Rowan A. E.; Nolte R. J. M. Self-Assembled Nanoreactors. Chem. Rev. 2005, 105 (4), 1445–1490. 10.1021/cr0300688. [DOI] [PubMed] [Google Scholar]
- Lipshutz B. H. Synthetic Chemistry in a Water World. New Rules Ripe for Discovery. Curr. Opin. Green Sustain. Chem. 2018, 11, 1–8. 10.1016/j.cogsc.2017.10.004. [DOI] [Google Scholar]
- Stano P.; Carrara P.; Kuruma Y.; Pereira de Souza T.; Luisi P. L. Compartmentalized Reactions as a Case of Soft-Matter Biotechnology: Synthesis of Proteins and Nucleic Acids inside Lipid Vesicles. J. Mater. Chem. 2011, 21 (47), 18887. 10.1039/c1jm12298c. [DOI] [Google Scholar]
- Kozak J. J. Chemical Reactions and Reaction Efficiency in Compartmentalized Systems. In Advances in Chemical Physics 2007, 115, 245–406. 10.1002/9780470141748.ch4. [DOI] [Google Scholar]
- Maddocks O. D. K.; Labuschagne C. F.; Vousden K. H. Localization of NADPH Production: A Wheel within a Wheel. Mol. Cell 2014, 55 (2), 158–160. 10.1016/j.molcel.2014.07.001. [DOI] [PubMed] [Google Scholar]
- Clark C.; Newgard C. B.. Hepatic Regulation of Fuel Metabolism. Mechanisms of Insulin Action; Springer New York: New York, NY, 2012; pp 90–109. [Google Scholar]
- Utter M. F.; Chuang D. T. Gluconeogenesis as a Compartmentalized Activity. Biochem. Soc. Trans. 1978, 6 (1), 11.2–16. 10.1042/bst0060011a. [DOI] [PubMed] [Google Scholar]
- Litschel T.; Ganzinger K. A.; Movinkel T.; Heymann M.; Robinson T.; Mutschler H.; Schwille P. Freeze-Thaw Cycles Induce Content Exchange between Cell-Sized Lipid Vesicles. New J. Phys. 2018, 20 (5), 055008 10.1088/1367-2630/aabb96. [DOI] [Google Scholar]
- Nuti N.; Verboket P. E.; Dittrich P. S. Multivesicular Droplets: A Cell Model System to Study Compartmentalised Biochemical Reactions. Lab Chip 2017, 17 (18), 3112–3119. 10.1039/C7LC00710H. [DOI] [PMC free article] [PubMed] [Google Scholar]
- Hamada T.; Fujimoto R.; Shimobayashi S. F.; Ichikawa M.; Takagi M. Molecular Behavior of DNA in a Cell-Sized Compartment Coated by Lipids. Phys. Rev. E - Stat. Nonlinear, Soft Matter Phys. 2015, 91 (6), 1–5. 10.1103/PhysRevE.91.062717. [DOI] [PubMed] [Google Scholar]
- Tanaka T.; Yamazaki M. Membrane Fusion of Giant Unilamellar Vesicles of Neutral Phospholipid Membranes Induced by La 3+. Langmuir 2004, 20 (13), 5160–5164. 10.1021/la049681s. [DOI] [PubMed] [Google Scholar]
- Andes-Koback M.; Keating C. D. Complete Budding and Asymmetric Division of Primitive Model Cells To Produce Daughter Vesicles with Different Interior and Membrane Compositions. J. Am. Chem. Soc. 2011, 133 (24), 9545–9555. 10.1021/ja202406v. [DOI] [PMC free article] [PubMed] [Google Scholar]
- Tsuda S.; Sakakura T.; Fujii S.; Suzuki H.; Yomo T. Shape Transformations of Lipid Vesicles by Insertion of Bulky-Head Lipids. PLoS One 2015, 10 (7), e0132963 10.1371/journal.pone.0132963. [DOI] [PMC free article] [PubMed] [Google Scholar]
- Buddingh’ B. C.; van Hest J. C. M. Artificial Cells: Synthetic Compartments with Life-like Functionality and Adaptivity. Acc. Chem. Res. 2017, 50 (4), 769–777. 10.1021/acs.accounts.6b00512. [DOI] [PMC free article] [PubMed] [Google Scholar]
- Zepik H. H.; Blöchliger E.; Luisi P. L. A Chemical Model of Homeostasis. Angew. Chem., Int. Ed. 2001, 40 (1), 199–202. . [DOI] [PubMed] [Google Scholar]
- Kurihara K.; Tamura M.; Shohda K.; Toyota T.; Suzuki K.; Sugawara T. Self-Reproduction of Supramolecular Giant Vesicles Combined with the Amplification of Encapsulated DNA. Nat. Chem. 2011, 3 (10), 775–781. 10.1038/nchem.1127. [DOI] [PubMed] [Google Scholar]
- Szostak J. W.; Bartel D. P.; Luisi P. L. Synthesizing Life. Nature 2001, 409, 387–390. 10.1038/35053176. [DOI] [PubMed] [Google Scholar]
- Varela F. G.; Maturana H. R.; Uribe R. Autopoiesis: The Organization of Living Systems, Its Characterization and a Model. BioSystems 1974, 5 (4), 187–196. 10.1016/0303-2647(74)90031-8. [DOI] [PubMed] [Google Scholar]
- Luisi P.; Autopoiesis L. A Review and a Reappraisal. Naturwissenschaften 2003, 90 (2), 49–59. [DOI] [PubMed] [Google Scholar]
- Bissette A. J.; Fletcher S. P. Mechanisms of Autocatalysis. Angew. Chem., Int. Ed. 2013, 52 (49), 12800–12826. 10.1002/anie.201303822. [DOI] [PubMed] [Google Scholar]
- Bachmann P. A.; Luisi P. L.; Lang J. Autocatalytic Self-Replicating Micelles as Models for Prebiotic Structures. Nature 1992, 357 (6373), 57–59. 10.1038/357057a0. [DOI] [Google Scholar]
- Bukhryakov K. V.; Almahdali S.; Rodionov V. O. Amplification of Chirality through Self-Replication of Micellar Aggregates in Water. Langmuir 2015, 31 (10), 2931–2935. 10.1021/la504984j. [DOI] [PubMed] [Google Scholar]
- Stano P.; Luisi P. L. Achievements and Open Questions in the Self-Reproduction of Vesicles and Synthetic Minimal Cells. Chem. Commun. 2010, 46, 3639–3653. 10.1039/b913997d. [DOI] [PubMed] [Google Scholar]
- Ruiz-Mirazo K.; Briones C.; De La Escosura A. Prebiotic Systems Chemistry: New Perspectives for the Origins of Life. Chem. Rev. 2014, 114 (1), 285–366. 10.1021/cr2004844. [DOI] [PubMed] [Google Scholar]
- Bissette A. J.; Odell B.; Fletcher S. P. Physical Autocatalysis Driven by a Bond-Forming Thiol–Ene Reaction. Nat. Commun. 2014, 5, 4607. 10.1038/ncomms5607. [DOI] [PubMed] [Google Scholar]
- Colomer I.; Morrow S. M.; Fletcher S. P. A Transient Self-Assembling Self-Replicator. Nat. Commun. 2018, 9 (1), 2239. 10.1038/s41467-018-04670-2. [DOI] [PMC free article] [PubMed] [Google Scholar]
- Ortega-Arroyo J.; Bissette A. J.; Kukura P.; Fletcher S. P. Visualization of the Spontaneous Emergence of a Complex, Dynamic, and Autocatalytic System. Proc. Natl. Acad. Sci. U. S. A. 2016, 113 (40), 11122–11126. 10.1073/pnas.1602363113. [DOI] [PMC free article] [PubMed] [Google Scholar]
- Takakura K.; Toyota T.; Sugawara T. A Novel System of Self-Reproducing Giant Vesicles. J. Am. Chem. Soc. 2003, 125 (27), 8134–8140. 10.1021/ja029379a. [DOI] [PubMed] [Google Scholar]
- Brea R. J.; Devaraj N. K. Continual Reproduction of Self-Assembling Oligotriazole Peptide Nanomaterials. Nat. Commun. 2017, 8 (1), 730. 10.1038/s41467-017-00849-1. [DOI] [PMC free article] [PubMed] [Google Scholar]
- Hardy M. D.; Yang J.; Selimkhanov J.; Cole C. M.; Tsimring L. S.; Devaraj N. K. Self-Reproducing Catalyst Drives Repeated Phospholipid Synthesis and Membrane Growth. Proc. Natl. Acad. Sci. U. S. A. 2015, 112 (27), 8187–8192. 10.1073/pnas.1506704112. [DOI] [PMC free article] [PubMed] [Google Scholar]
- Scroggins S. T.; Chi Y.; Fréchet J. M. J. Polarity-Directed One-Pot Asymmetric Cascade Reactions Mediated by Two Catalysts in an Aqueous Buffer. Angew. Chem., Int. Ed. 2010, 49, 2393–2396. 10.1002/anie.200902945. [DOI] [PubMed] [Google Scholar]
- Post E. A. J.; Bissette A. J.; Fletcher S. P. Self-Reproducing Micelles Coupled to a Secondary Catalyst. Chem. Commun. 2018, 54 (63), 8777–8780. 10.1039/C8CC02136H. [DOI] [PubMed] [Google Scholar]
- See ref (33) for a detailed discussion on the effect of seeding reactions with ligand A at different concentrations.
- Blackmond D. G. An Examination of the Role of Autocatalytic Cycles in the Chemistry of Proposed Primordial Reactions. Angew. Chem., Int. Ed. 2009, 48 (2), 386–390. 10.1002/anie.200804565. [DOI] [PubMed] [Google Scholar]
- Donnelly P. S.; Zanatta S. D.; Zammit S. C.; White J. M.; Williams S. J. ‘Click’ Cycloaddition Catalysts: Copper(I) and Copper(II) Tris(triazolylmethyl)amine Complexes. Chem. Commun. 2008, 233 (21), 2459–2461. 10.1039/b719724a. [DOI] [PubMed] [Google Scholar]
- Chan T. R.; Hilgraf R.; Sharpless K. B.; Fokin V. V. Polytriazoles as Copper(I)-Stabilizing Ligands in Catalysis. Org. Lett. 2004, 6 (17), 2853–2855. 10.1021/ol0493094. [DOI] [PubMed] [Google Scholar]
- Semenov S. N.; Belding L.; Cafferty B. J.; Mousavi M. P. S.; Finogenova A. M.; Cruz R. S.; Skorb E. V.; Whitesides G. M. Autocatalytic Cycles in a Copper-Catalyzed Azide–Alkyne Cycloaddition Reaction. J. Am. Chem. Soc. 2018, 140 (32), 10221–10232. 10.1021/jacs.8b05048. [DOI] [PubMed] [Google Scholar]
- Presolski S. I.; Hong V.; Cho S.; Finn M. G. Tailored Ligand Acceleration of the Cu-Catalyzed Azide - Alkyne Cycloaddition Reaction: Practical and Mechanistic Implications. J. Am. Chem. Soc. 2010, 132 (4), 14570–14576. 10.1021/ja105743g. [DOI] [PMC free article] [PubMed] [Google Scholar]
- Buckley B. R.; Dann S. E.; Harris D. P.; Heaney H.; Stubbs E. C. Alkynylcopper(i) Polymers and Their Use in a Mechanistic Study of Alkyne-Azide Click Reactions. Chem. Commun. 2010, 46 (13), 2274–2276. 10.1039/b924649e. [DOI] [PubMed] [Google Scholar]
- Meldal M. P.; Meldal M.; Tornøe C. W. Cu-Catalyzed Azide–Alkyne Cycloaddition Cu-Catalyzed Azide - Alkyne Cycloaddition. Chem. Rev. 2008, 108 (8), 2952–3015. 10.1021/cr0783479. [DOI] [PubMed] [Google Scholar]
- Hein J. E.; Fokin V. V. Copper-Catalyzed Azide-Alkyne Cycloaddition (CuAAC) and beyond: New Reactivity of Copper(i) Acetylides. Chem. Soc. Rev. 2010, 39 (4), 1302–1315. 10.1039/b904091a. [DOI] [PMC free article] [PubMed] [Google Scholar]
- Evans R.; Deng Z.; Rogerson A. K.; McLachlan A. S.; Richards J. J.; Nilsson M.; Morris G. A. Quantitative Interpretation of Diffusion-Ordered NMR Spectra: Can We Rationalize Small Molecule Diffusion Coefficients?. Angew. Chem., Int. Ed. 2013, 52 (11), 3199–3202. 10.1002/anie.201207403. [DOI] [PubMed] [Google Scholar]
- Miller C. C. The Stokes-Einstein Law for Diffusion in Solution. Proc. R. Soc. London, Ser. A 1924, 106 (740), 724–749. 10.1098/rspa.1924.0100. [DOI] [Google Scholar]
- Hashimoto T.; Maruoka K.. The Basic Principle of Phase-Transfer Catalysis and Some Mechanistic Aspects. Asymmetric Phase Transfer Catalysis; Wiley-VCH Verlag GmbH & Co. KGaA: Weinheim, Germany, 2008; pp 1–8. [Google Scholar]
- Starks C. M.; Liotta C. L.; Halpern M. E.. Phase-Transfer Catalysis: Fundamentals I. Phase-Transfer Catalysis; Springer Netherlands: Dordrecht, 1994; pp 23–47. [Google Scholar]
- Esikova I. A.; Sasson Y.; Neumann R. In Handbook of Phase Transfer Catalysis; Sasson Y., Neumann R., Eds.; Springer Netherlands: Dordrecht, 1997. [Google Scholar]
- Buhse T.; Lavabre D.; Nagarajan R.; Micheau J. C. Origin of Autocatalysis in the Biphasic Alkaline Hydrolysis of C-4 to C-8 Ethyl Alkanoates. J. Phys. Chem. A 1998, 102 (51), 10552–10559. 10.1021/jp982765n. [DOI] [Google Scholar]
- Buhse T.; Nagarajan R.; Lavabre D.; Micheau J. C. Phase-Transfer Model for the Dynamics of “‘micellar Autocatalysis.’. J. Phys. Chem. A 1997, 101, 3910–3917. 10.1021/jp9705838. [DOI] [Google Scholar]
- Berg R.; Straub B. F. Advancements in the Mechanistic Understanding of the Copper-Catalyzed Azide-Alkyne Cycloaddition. Beilstein J. Org. Chem. 2013, 9, 2715–2750. 10.3762/bjoc.9.308. [DOI] [PMC free article] [PubMed] [Google Scholar]
- Jin L.; Tolentino D. R.; Melaimi M.; Bertrand G. Isolation of Bis(Copper) Key Intermediates in Cu-Catalyzed Azide-Alkyne “Click Reaction". Sci. Adv. 2015, 1 (5), e1500304 10.1126/sciadv.1500304. [DOI] [PMC free article] [PubMed] [Google Scholar]
- Lewis W. G.; Magallon F. G.; Fokin V. V.; Finn M. G. Discovery and Characterization of Catalysts for Azide–Alkyne Cycloaddition by Fluorescence Quenching. J. Am. Chem. Soc. 2004, 126 (30), 9152–9153. 10.1021/ja048425z. [DOI] [PubMed] [Google Scholar]
- Nolte C.; Mayer P.; Straub B. F. Isolation of a Copper(I) Triazolide: A “Click” Intermediate. Angew. Chem., Int. Ed. 2007, 46 (12), 2101–2103. 10.1002/anie.200604444. [DOI] [PubMed] [Google Scholar]
- Rostovtsev V. V.; Green L. G.; Fokin V. V.; Sharpless K. B. A Stepwise Huisgen Cycloaddition Process: Copper(I)-Catalyzed Regioselective “Ligation” of Azides and Terminal Alkynes. Angew. Chem., Int. Ed. 2002, 41 (14), 2596–2599. . [DOI] [PubMed] [Google Scholar]
- Rodionov V. O.; Fokin V. V.; Finn M. G. Mechanism of the Ligand-Free CuI-Catalyzed Azide-Alkyne Cycloaddition Reaction. Angew. Chem., Int. Ed. 2005, 44 (15), 2210–2215. 10.1002/anie.200461496. [DOI] [PubMed] [Google Scholar]
- Bock V. D.; Hiemstra H.; van Maarseveen J. H. CuI-Catalyzed Alkyne-Azide “Click” Cycloadditions from a Mechanistic and Synthetic Perspective. Eur. J. Org. Chem. 2006, 2006 (1), 51–68. 10.1002/ejoc.200500483. [DOI] [Google Scholar]
- Rodionov V. O.; Presolski S. I.; Díaz Díaz D.; Fokin V. V.; Finn M. G. Ligand-Accelerated Cu-Catalyzed Azide–Alkyne Cycloaddition: A Mechanistic Report. J. Am. Chem. Soc. 2007, 129 (42), 12705–12712. 10.1021/ja072679d. [DOI] [PubMed] [Google Scholar]
- Interestingly, after around 6 h the seeded reaction appears to slow down and eventually is overtaken by the unseeded reaction. We have previously observed related behavior when coupling 1 to 1-hexyne or 1-octyne and seeding with large amounts of product (see ref (33)). The origins of this effect are unclear, but it may be caused by product inhibition at higher concentrations by binding of the triazole moiety to copper, or (as suggested by a referee) that one or more of the reactants is being sequestered in a phase that has limited access to the catalyst.
- Shao C.; Wang X.; Zhang Q.; Luo S.; Zhao J.; Hu Y. Acid-Base Jointly Promoted Copper(I)-Catalyzed Azide-Alkyne Cycloaddition. J. Org. Chem. 2011, 76 (16), 6832–6836. 10.1021/jo200869a. [DOI] [PubMed] [Google Scholar]
- Mahon E.; Aastrup T.; Barboiu M. Dynamic Glycovesicle Systems for Amplified QCM Detection of Carbohydrate-Lectin Multivalent Biorecognition. Chem. Commun. 2010, 46 (14), 2441–2443. 10.1039/b924766a. [DOI] [PubMed] [Google Scholar]
- Dangerfield E. M.; Northcote P. T.; Harvey J. E.; Batchelor R. Stereochemical Control in Carbohydrate Chemistry. J. Chem. Educ. 2008, 85 (5), 689–691. 10.1021/ed085p689. [DOI] [Google Scholar]
- Bissette A. J.Models for Prebiotically-Relevant Self-Reproducing Systems; University of Oxford, 2015. [Google Scholar]
- Loughlin W. A.; Jenkins I. D.; Karis N. D.; Healy P. C. Discovery of New Nanomolar Inhibitors of GPa: Extension of 2-Oxo-1,2-Dihydropyridinyl-3-Yl Amide-Based GPa Inhibitors. Eur. J. Med. Chem. 2017, 127, 341–356. 10.1016/j.ejmech.2016.12.049. [DOI] [PubMed] [Google Scholar]
- Michaels H. A.; Zhu L.. N,N,N-Tris[(1-benzyl-1H-1,2,3-triazol-4-yl)methyl]amine (TBTA). Encyclopedia of Reagents for Organic Synthesis; John Wiley & Sons, Ltd: Chichester, U.K., 2011; pp 1–7. [Google Scholar]
- Hong V.; Presolski S. I.; Ma C.; Finn M. G. Analysis and Optimization of Copper-Catalyzed Azide-Alkyne Cycloaddition for Bioconjugation. Angew. Chem., Int. Ed. 2009, 48 (52), 9879–9883. 10.1002/anie.200905087. [DOI] [PMC free article] [PubMed] [Google Scholar]
- Li W.; Jaroń-Becker A. a; Hogle C. W.; Sharma V.; Zhou X.; Becker A.; Kapteyn H. C.; Murnane M. M. Visualizing Electron Rearrangement in Space and Time during the Transition from a Molecule to Atoms. Proc. Natl. Acad. Sci. U. S. A. 2010, 107 (47), 20219–20222. 10.1073/pnas.1014723107. [DOI] [PMC free article] [PubMed] [Google Scholar]
- Hu G.; Emrick T. Functional Choline Phosphate Polymers. J. Am. Chem. Soc. 2016, 138 (6), 1828–1831. 10.1021/jacs.5b13156. [DOI] [PubMed] [Google Scholar]
- Zeynep E. Y.; Antoine D.; Brice C.; Frank B.; Christine J. Double Hydrophilic Polyphosphoester Containing Copolymers as Efficient Templating Agents for Calcium Carbonate Microparticles. J. Mater. Chem. B 2015, 3 (36), 7227–7236. 10.1039/C5TB00887E. [DOI] [PubMed] [Google Scholar]
- Liu L.; Lee M. E.; Kang P.; Choi M. G. Revisit to Synthesis of Allyl- and Propargyl-Phosphorylcholines: Crystal Structure of Allyl-Phosphorylcholine. Phosphorus, Sulfur Silicon Relat. Elem. 2015, 190 (9), 1525–1534. 10.1080/10426507.2014.996878. [DOI] [Google Scholar]
Associated Data
This section collects any data citations, data availability statements, or supplementary materials included in this article.


