Abstract
Microfluidic devices provide a low-input and efficient platform for single-cell RNA-seq (scRNA-seq). Existing microfluidic devices have a complicated multi-chambered structure for handling the multi-step process involved in RNA-seq and dilution between steps is used to negate the inhibitory effects among reagents. This makes the device difficult to fabricate and operate. Here we present microfluidic diffusion-based RNA-seq (MID-RNA-seq) for conducting scRNA-seq with a diffusion-based reagent swapping scheme. This device incorporates cell trapping, lysis, reverse transcription and PCR amplification all in one simple microfluidic device. MID-RNA-seq provides high data quality that is comparable to existing scRNA-seq methods while implementing a simple device design that permits multiplexing. The robustness and scalability of the MID-RNA-seq device will be important for transcriptomic studies of scarce cell samples.
Graphical Abstract
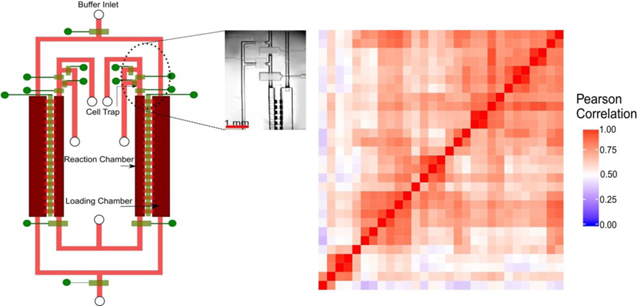
Scalable microfluidic devices containing reaction and loading chambers were developed to conduct single-cell transcriptomic studies.
Introduction
The expression levels of genes can vary widely within a cell population1 and conventional gene expression measurements on a bulk population of cells masks cell-to-cell heterogeneity2. Single cell RNA sequencing (scRNA-seq) is the state-of-the-art approach to study the gene expression (transcriptome) of a single cell3. This approach provides us i) the ability to analyze the transcriptome of rare cell types or scarce cell samples with insufficient amounts for conventional profiling 4 ii) the ability to cluster different subpopulations of cells within a large heterogeneous population 5. scRNA-seq has been conducted in various formats over the years, including by Tang et al. in 20096, CEL-seq27, Drop-seq8, MARS-seq9, STRT-seq10 and SMART-seq211. Drop-seq and MARS-seq have the capability of massively parallel high-throughput sequencing of thousands of cells by barcoding each individual cell. CEL-seq2 uses linear in-vitro transcription (IVT) to maintain fidelity during amplification and strand-specificity12. The STRT-seq method is another strand-specific protocol and offers the possibility to identify unique transcripts from PCR replicates.
Existing methods for scRNA-seq are not without limitations. For example, although shallow-depth methods are high throughput and cost-effective, these methods detect 50% fewer genes than competing methods13. Other methods do not provide full length transcript information and limits the possibility to detect SNPs or splice variants that are located outside the 5’ end 12. SMART-seq 211 stands out as being the most sensitive process with the least drop-out probability, even coverage of transcript and low variability among replicates 13. SMART-seq 2 uses a Template Switching Oligo (TSO) primer and a Moloney murine leukemia (M-MLV) reverse transcriptase which reverse-transcribes RNA into cDNA and initiates the formation of a second complementary chain of cDNA strand all in one step.
Several groups suggested that performing scRNA-seq in nanoliter volumes in a microfluidic device leads to a higher sensitivity and accuracy in the process than conventional tube-based processes 8, 14, 15. Microfluidic platforms such as the C1 by Fluidigm provides an integrated system for carrying out all steps of the scRNA-seq process in an automated or semi-automated fashion. One of the limitations of the Fluidigm C1 is that the cell trapping step is passive and doesn’t discard unhealthy or dead cells. There is also an associated size bias on the cells trapped because the C1 Fluidigm only supports cell traps of certain specific diameters 16, 17. Nevertheless, microfluidic devices typically perform better than tube-based methods with higher reproducibility due to reduction of stochastic variation caused by pipetting error and manual handling14. In addition, microfluidic isolation leads to less contamination and increases throughput14.
The Fluidigm C1 and other microfluidic platforms for RNA-seq often involve a device containing multiple connected chambers 14, 18–20. The chambers are kept empty at the beginning of the process before reagents involved in various steps are loaded into the system by opening an increasing number of these connected chambers. Special measures need to be in place to prevent the reagents in earlier steps from inhibiting the reactions in the later steps. For example, chemicals used for cell lysis (such as sodium dodecyl sulfate and Triton X-100) and the intracellular molecules such as proteins, polysaccharides and ions (including Ca2+, Fe3+) in the cell lysate may inhibit PCR by reducing polymerase activity 21–23. Several strategies such as bead-based methods and non-chemical lysis have been reported to overcome these inhibitory effects 18, 19, 24, 25. However, these strategies may not produce complete release of RNA as chemical lysis 26. Dilution typically has to be used to alleviate interference among reagents 19.
To overcome these limitations of existing microfluidic devices, we demonstrate a one-pot microfluidic device to perform scRNA-seq called MID-RNA-seq. Our approach takes advantage of concentration-gradient-driven diffusion to deliver reagents into the reaction chamber while diffusing out reagents from the previous step, thus eliminating the need for dilution. We show that the results obtained using MID-RNA-seq are comparable to competing scRNA-seq technologies. We demonstrate the utility of this approach with the SMART-seq2 steps and reagents and the device has the capacity for use with other scRNA-seq protocols.
Results and discussion
Device design and operation
We designed a diffusion-based microfluidic device for scRNA-seq (Fig. 1a). We applied diffusion-based reagent swapping for reagent loading 27, 28. The microfluidic device had two layers - a fluidic layer for the chambers and flow lines (indicated in red and pink) and a control layer of pneumatic microvalves (indicated in green). Each of the valves could be independently addressed. The device had two parallel units for processing two single cells simultaneously. Each unit contained three sections: 1) a reaction chamber (80 nl); 2) a loading chamber (200 nl) attached to the reaction chamber; and 3) a cell trapping structure upstream of the reaction chamber. The connection between the reaction and loading chambers could be changed by operating the microvalves that could open or close the diffusion channels in between the chambers.
Figure 1.
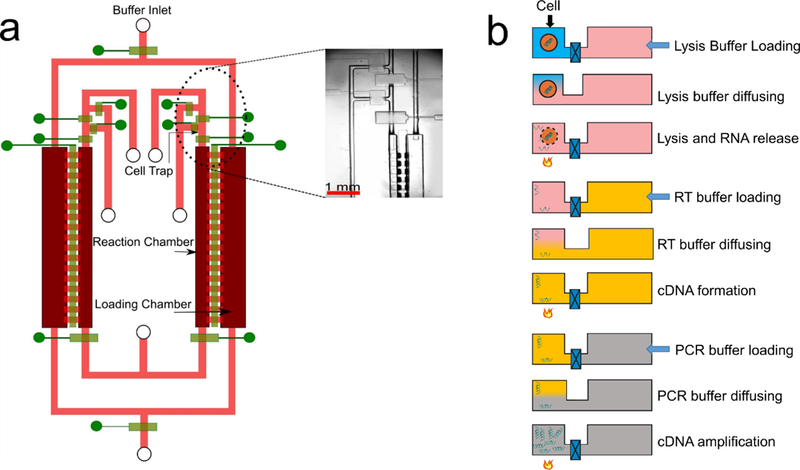
MID-RNA-seq device and operation. a) A schematic illustration of the two-layered microfluidic device in a top-down view (not to scale). The fluidic layer is labelled in red and pink and the control layer is in green. It shows two units running in parallel. It has an inner reaction chamber for cell, RNA and cDNA and an outer loading chamber for reagent loading. Microvalves are used to close/open fluidic channels. Inset: the circled area in Fig. 1a is seen under the microscope. The scale bar indicates 1mm. b) Steps involved in MID-RNA-seq. The schematic was drawn with a cross-sectional view of the two chambers involved. Only one unit of the two parallel units is shown.
The single-cell suspension was loaded onto a syringe pump and introduced into the device through the cell inlet (Fig. 1(a), Fig. S1). Single cells were trapped in the cell trapping chambers by operating the surrounding valves (Fig. S1). After a single cell was successfully trapped, the upstream channel of the cell-trapping chamber was first rinsed with PBS and then with Lysis Buffer to remove unwanted cells. Next, Lysis Buffer was flowed to push the trapped cell into the reaction chamber by slowly squeezing air out of the reaction chamber through gas-permeable PDMS while the downstream valve (the valve at the exit of the reaction chamber) and the diffusion valve (i.e. the valve between reaction and loading chambers) were closed. The entire process was monitored under a microscope to ensure the chamber was free of bubbles. The whole microfluidic chip was then mounted on a flat-plate thermocycler for lysis reaction (72℃, 3 min). In the next step, the reverse transcription buffer was filled into the loading chamber via the buffer inlet and the diffusion valve was then opened for 40 min for the RT reagents to diffuse into the reaction chamber. The lysis reagents diffused out during the same period to avoid interference with the RT reaction. Because of the relatively large size of mRNA-molecules (average size assumed to be 1.5 Kb 29), they diffused very slowly in the time scale of operation and the loss of RNA by diffusion was small.
Once the diffusion-based loading was complete, the diffusion valve was closed and the entire chip was placed on the flat-plate thermocycler for the RT reaction. For the PCR amplification step, the reagents in the loading chamber were replaced with fresh PCR buffer and the diffusion valves were again opened for 25 min and the chip was once more placed on the flat-plate thermocycler for PCR reaction to take place. The total reaction volume of the one-pot reaction chamber was 80 nl, which was about ~40% smaller in volume than a previous multi-chambered device for scRNA-seq 14. After cDNA synthesis and amplification, the units were independently flushed with elution buffer and the cDNA was collected at the cDNA outlet using a micropipettor and into a tube. The library preparation step was performed in a tube using conventional benchtop techniques. cDNA libraries were sequenced using Illumina HiSeq 4000/Illumina HiSeq X.
The reagent loading/exchange in MID-RNA-seq occurred via concentration-gradient-driven diffusion. The buffer containing reagents for each step was filled into the loading chamber via the buffer inlet (Fig. 1(a, b)) and then the diffusion valve separating the loading and reaction chamber was opened. This allowed for the reagents to diffuse into the reaction chamber and the reagents of the previous step to diffuse out thus preventing the interference of reagents from one step to the other. This process was then repeated for the subsequent steps.
There is considerable difference in diffusivity (D) between RNA and the other reagents so that the reagents diffuse in and out more quickly than RNA. At 25 °C, mRNA molecule averagely has a D value of 1 µm2s−1 30 whereas the RT enzyme (average size 71 KDa) has a D of ~50 µm2 s−1 (estimated from 31), primers (20–30 bp single stranded DNA) have D of 70 µm2 s−1, dNTPs of 370 µm2s−1, Triton X-100(lysis reagent) of 300 µm2s−1, small ions like Mg2+, K+, Cl− of 1000 µm2s−1 27. When delivering RT enzyme which has a small difference in diffusivity compared to RNA, a high concentration of the RT enzyme was applied in the loading chamber to accelerate delivery.
Fig. 2 shows COMSOL Multiphysics modeling of the diffusion process in the MID-RNA-seq device for visualization of the exchange of molecules between the reaction chamber and loading chamber for the reverse transcription step. The “transport of diluted species” model was used to carry out a 3D time-dependent simulation to analyze the concentration variations of different species in the chambers at 25 °C within the time-frame of 2400 s (40 min). The starting concentrations of Reverse Transcription Enzyme, Primers, dNTP, small ions like Mg2+, K+, Cl− in the reaction chamber were set at 0 and their initial concentrations in the loading chamber were set at 100 (arbitrary units). The increase in the species concentration in the reaction chamber over time was modeled. The same approach was used for simulation of species (RNA and Triton-X) diffusing out of the reaction chamber to the loading chamber (by setting their starting concentrations in the reaction chamber as 100 and the ones in the loading chamber as 0). Our results showed that only 5% of RNA diffuses out whereas 69.53% of Triton-X (lysis reagent) diffused out over 40 min period (Fig. 2). Over the same period, the concentrations of reverse-transcription enzyme, primer, dNTP and small ions increased to 18.05%, 24.96%, 61.48% and 65.02% of their starting concentrations in the loading chamber, respectively. This simulation was used to help determine the diffusion time and the loading concentrations of these reagents in order to reach desired concentrations in the reaction chamber.
Figure 2.
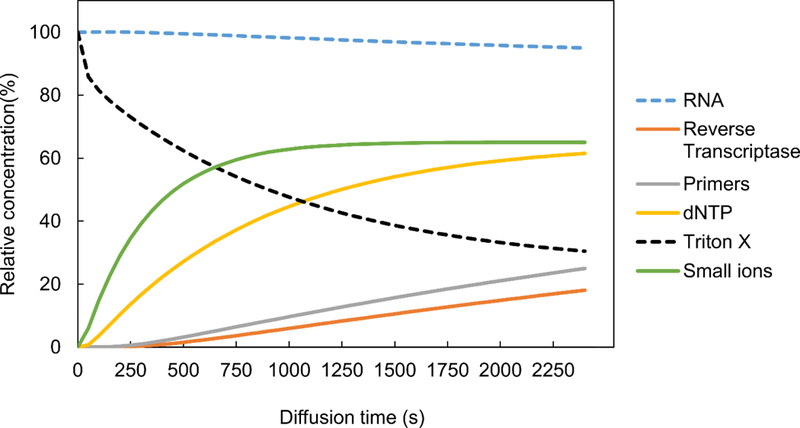
The loading and release of various molecules in and out of the reaction chamber as modeled by COMSOL Multiphysics. In the cases of entry into the reaction chamber (small ions, dNTP, primers, reverse transcriptase), the initial concentration in the loading chamber is set as 100%. In the cases of release out of the reaction chamber (RNA of 1.5 kb and triton X), the initial concentration in the reaction chamber is set to be 100%.
The optimization of the diffusion duration for each step involved a balance between maximizing delivery of reagents and minimizing RNA/cDNA loss. In addition to the COMSOL Multiphysics modelling, we also prepared some samples each containing 10 pg of RNA (equivalent to single-cell amount 32) for testing various diffusion durations in the 2- unit MID-RNA-seq device. We opened the diffusion valves for various durations to see how the total number of genes with Fragments Per Kilobase of transcript per Million mapped reads (FPKM) > 0 changed with different diffusion durations. There were two steps that involved diffusion – the reagent swapping during the reverse transcription step (denoted by R) and the reagent swapping during the PCR step (denoted by P). Fig. S2a shows that the number of genes detected increased as we increased the diffusion durations from 20 to 40 min for R, while keeping P constant at 20 min. Fig. S2b shows that the number of genes detected peaked at 20 min when the diffusion duration for P increased from 10 to 30 min, while keeping R constant at 40 min. Thus, in conjunction with the results obtained by COMSOL modelling, we chose a diffusion duration of 40 min for R and 25 min for P.
We also tested MID-RNA-seq devices containing 4 units spanning along horizontal direction (Fig. S3a) or 6 units connected in the vertical direction (Fig. S3b) to demonstrate the scalability along both directions. As seen in Fig. S3a, the diffusion, inlet and outlet valves are combined to ensure simultaneous operation of the four reactions. Four samples of 10 pg RNA each were processed in the device which was the equivalent of one single-cell worth of RNA 32. The time taken for the operation of the 4-unit device was similar to that of the 2-unit device. Fig. S4 shows a compilation of the results obtained from each unit. The results showed that on average 5743 genes (FPKM>1) were detected in each unit and 2503 were reproducibly detected in all units (Fig. S4). Between any two units, around 65% of the discovered expressed genes overlapped.
In the 6-unit device in Fig. S3b, we combined 6-units in the longitudinal direction with all loading chambers connected by common buffer inlet and outlet. Each reaction chamber was isolated to prevent cross-contamination across samples (single cells). There was a common cell trap upstream of the first unit, operating in the same fashion as described in Fig. S1. Single cells trapped were individually pushed into each reaction chamber while being observed under the microscope. The amplified cDNA output of each reaction was individually flushed out for subsequent library preparation steps.
MID-RNA-seq performance benchmarked against competing technologies
We totally produced 41 single-cell data sets using MID-RNA-seq technology on GM12878 human lymphoblastoid and Mouse Embryonic Fibroblast (MEF) cell lines (29 data sets on GM12878 by 5 runs on the 6-unit devices, 6 on GM12878 by 3 runs on the 2-unit devices, and 6 on MEF by 3 runs on the 2-unit device).
Sensitivity in scRNA-seq is typically measured by the total number of expressed genes per cell and the overlap between genes detected by the single-cell approach and bulk RNA-seq measurement14, 15. We compared our GM12878 data to a number of published datasets by ENCODE (GSM2343071/2, 31 single-cell datasets) and by Marinov et al. which uses SMART-seq (GSE44618, 15 single-cell datasets)1. In addition to these, we also compared it to the single-cell data on HCT116 Human Colon Cancer cell line by Fluidigm C1 technique using the SMART-seq2 protocol(GSE51254, 96 single-cell datasets) 15. The mouse MEF cell line datasets were compared to the ones produced by SMART-seq211(GSE49321,7 single-cell datasets), microfluidic scRNA-seq by Streets et al. 14(GSE47835, 8 single-cell datasets) and ones with CEL-seq2 on mouse ear fibroblast cells performed on the Fluidigm C1 platform 7 (GSE78779, 72 single-cell datasets). All of the raw data available were downloaded and processed with the same bioinformatics pipeline with the same number of sub-sampled reads (2 million for each data set).
Fig. 3 shows the total number of genes we detect at FPKM > 0 and FPKM > 1 from these datasets. With FPKM >0, our method detected 8908 genes with human datasets and 14726 genes with the mouse datasets. In the case of genes with FPKM>1, our method detected 4762 and 5338 genes respectively.
Figure 3.
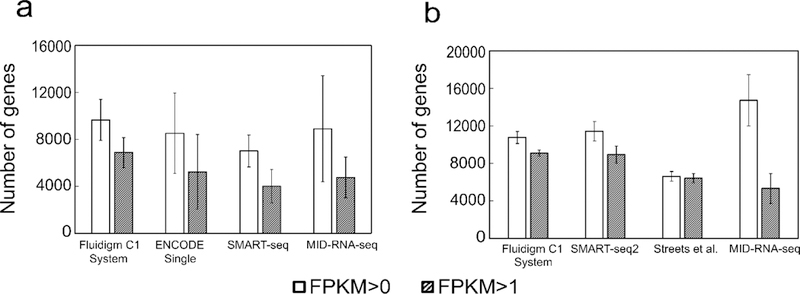
Sensitivity of the scRNA-seq techniques shown as the mean number of genes detected above two thresholds (FPKM of 0 and 1) for data on a) GM12878 cells (n = 35) data sets compared to results generated by competing technologies on human cells; b) MEF cells(n=6) compared to results generated by competing technologies on mouse cells. Sequencing depth was adjusted to 2 million reads for each data set for comparison. Human datasets include ENCODE datasets on GM12878 (GSM2343071/2, n=31), SMART-seq on GM12878 cells from Ref. 1 (n=15), Fluidigm C1 System on HCT116 cells from Ref. 16 (n=96). Mouse datasets include SMART-seq2 on MEF cells from Ref. 11 (n=7), Streets et al. on MEF cells from Ref. 5 (n=8) and Fluidigm C1 System on mouse ear fibroblast cells (n=72) from Ref. 7. Error bars indicate standard deviation among all replicates.
In Fig. 4 we further analyzed and compared the quality of the single-cell datasets completed by various methods in terms of their overlap with the bulk RNA-seq data from ENCODE on the same GM12878 cell line (GSE33480, “ENCODE bulk”) and produced in our lab using 1000 cells with SMART-seq2 (“Bulk GM12878”). All datasets were depth matched at 2 million reads and an average profile across all sample replicates (provided by Cuffdiff program which also controls for variability across replicates33) was used for comparison. In the first case of comparison with ENCODE bulk data, the percentage overlaps for genes with FPKM >1 were 43.89% for SMART-seq1, 44.48% for ENCODE-single cell, and 38.18% for MID-RNA-seq. In the case of overlap with Bulk GM12878 data generated in our lab, the percentage overlaps were found to be 46.58%, 47.08%, 41.69% for SMART-seq, ENCODE-single cell, and MID-RNA-seq respectively.
Figure 4.
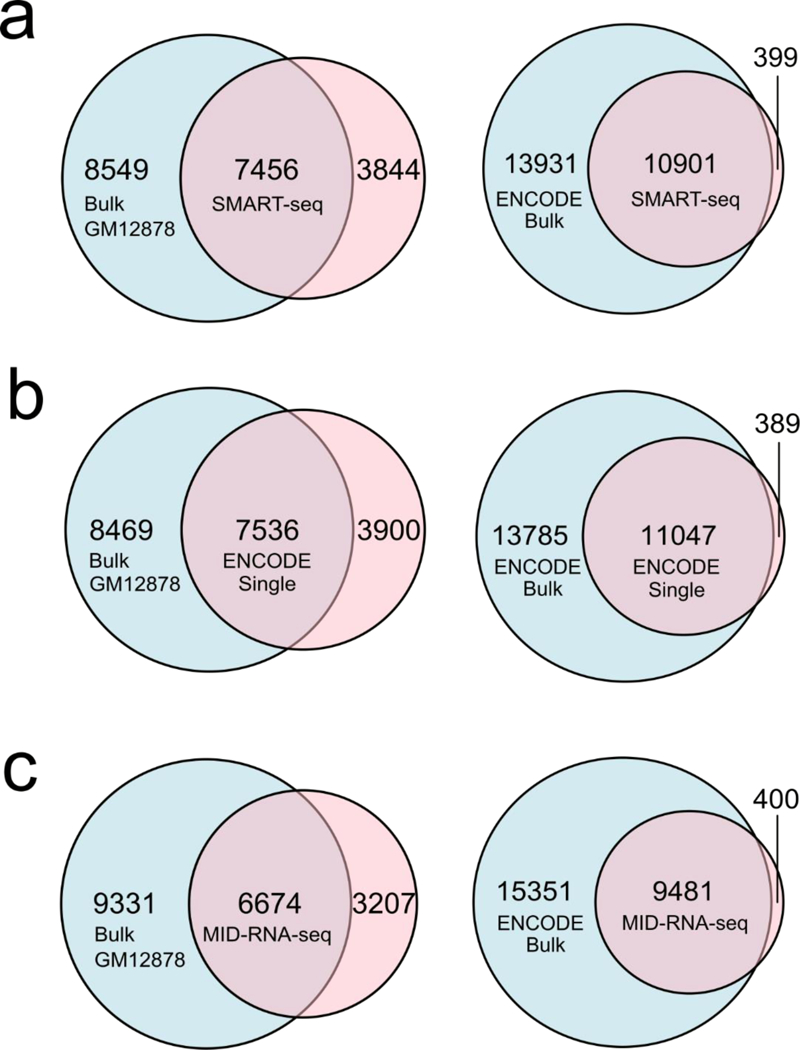
Sensitivity of various scRNA-seq techniques measured by overlap of genes between the single-cell data and the bulk RNA-seq data on GM12878 cell line. ENCODE bulk was produced using 100ng of mRNA from GM12878 cells (GSE33480) and Bulk GM12878 was produced in our lab using 1000 cells and SMART-seq2 protocol. Sequencing depth was adjusted to 2 million reads for each data set for comparison. a) SMART-seq single cell data (n=15); b) ENCODE single-cell data (n=31); c) MID-RNA-seq single-cell data (n=35). ENCODE single cell data was obtained from GSM2343071/2, SMART-seq from Ref.1.
In order to compare precision fairly among methods without biases, we calculated dropout probability 13. We created a set of 18842 human genes that were detected at FPKM>1 in at least one of four single-cell datasets (MID-RNA-seq, ENCODE_single cell, SMART-seq1, Fluidigm C1 System(human) 15). We then examined each dataset individually to determine how many genes from these genes were dropped out (FPKM=0). MID-RNA-seq was found to have one of the lowest dropout probability of 0.17 for human cell studies (Fig S5a). While comparing the mouse datasets, 13529 genes were included in the common set and MID-RNA-seq was again found to have the lowest dropout probability of 0.01 (Fig. S5b). The average measurements provided by Cuffdiff across all sample replicates and 2 million randomly-sampled reads were used for examination for fairness. The dropout probability of SMART-seq2 (0.23), Fluidigm C1 for human (0.44) were found to be similar to values reported in previous literature 13.
The correlation between pooled single-cell data (referred to as “MID-RNA-seq ensemble”) and bulk RNA-seq data produced in our lab using 1000 GM12878 cells by SMART-seq2 is shown in Fig. 5a. The ensemble was formed by computationally pooling all the raw reads from 29 single-cell data sets and randomly sampling 7 million reads. The same number of reads were randomly sampled from the pooled sequencing reads of the bulk RNA-seq data15. The Pearson correlation coefficient obtained was 0.72 which showed that the ensemble could partially recapitulate the bulk data. A Loess regression curve was fitted on the data and the curve was found to be almost linear with a R2 = 1(scripts to calculate this have been included in the supplementary notes). Fig 5b is another way of visualizing this overlap where 76.36% of the average number of genes detected lie in the common area.
Figure 5.
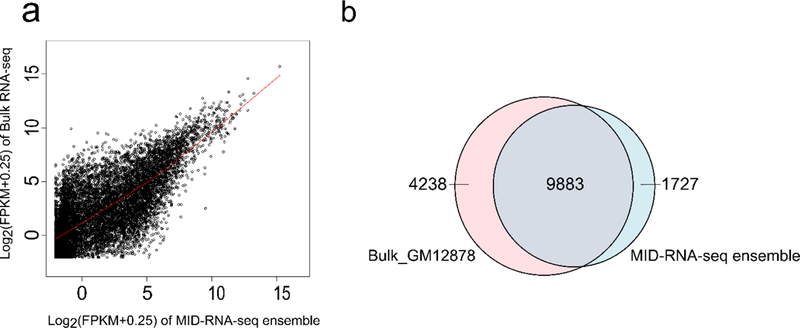
The comparison between pooled single-cell data (29 data sets) and bulk RNA-seq data taken using 1000 cells by SMART-seq2. Both samples were depth-matched with 7 million reads sampled out of all reads for each data set. a) Correlation of all genes with FPKM > 0 between pooled single cell data (MID-RNA-seq ensemble) and bulk RNA-seq data both from GM12878 cells. The Pearson correlation coefficient of gene expression is 0.72. A Loess regression curve fitted shows an almost linear trend with R2 = 1. b) The overlap of genes detected between the bulk RNA-seq data and MID-RNA-seq ensemble data. 76% of genes overlap between the two data sets.
Fig. 6 shows a heat map comparing the expression level of all genes at FPKM >0 across the 29 single-cell data sets (sequenced in the same batch) from 5 rounds of the 6-unit device. The Pearson correlation ranged from 0.34 to 1 among these samples with an average of 0.68. The variation could be attributed to heterogeneity in gene expression among single cells 14.
Figure 6.
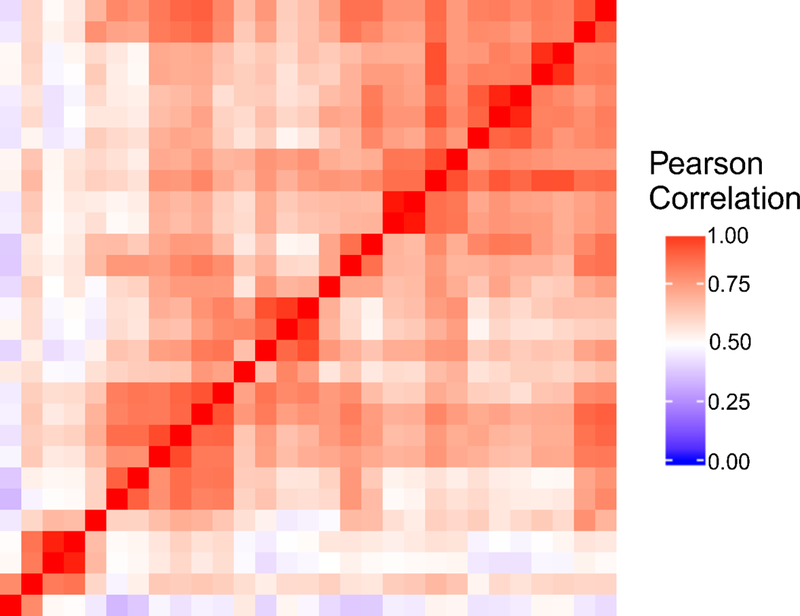
Heat map of Pearson correlation among all genes with FPKM > 0 for the 29 single-cell RNA-seq data sets produced using the 6-unit device. All samples were depth matched at 2 million reads each. The correlation coefficient between each sample pair represents the reproducibility of gene detection which is a combination of the technical variation on the device and the biological variation between single cells.
In order to assess accuracy in the mRNA expression level, exogenous spike-in of 92 polyadenylated synthetic RNA transcripts from the External RNA Controls Consortium (ERCC) was added to the mix. The expression level of each transcript in the spike-in mix was measured in the experiment to determine how well it correlated with its known concentration. The results (Fig. 7) showed a strong linear correlation (adjusted R2 ~ 0.9) between measured and original FPKMs of spike-in molecules detected across all 6 single cell datasets performed on a 2-unit device. The adjusted R2 value was used so that the value doesn’t depend on the number of data points used. This value of linear correlation corresponded well to values published in literature under similar settings 13, 34, 35. The number of ERCC molecules detected out of the 92 molecules is N = 89 which also corresponded well to guidelines (general ERCC guidelines indicate that a good quality library usually has an R2 value greater than 0.9 and a N value higher than 60).
Figure 7.
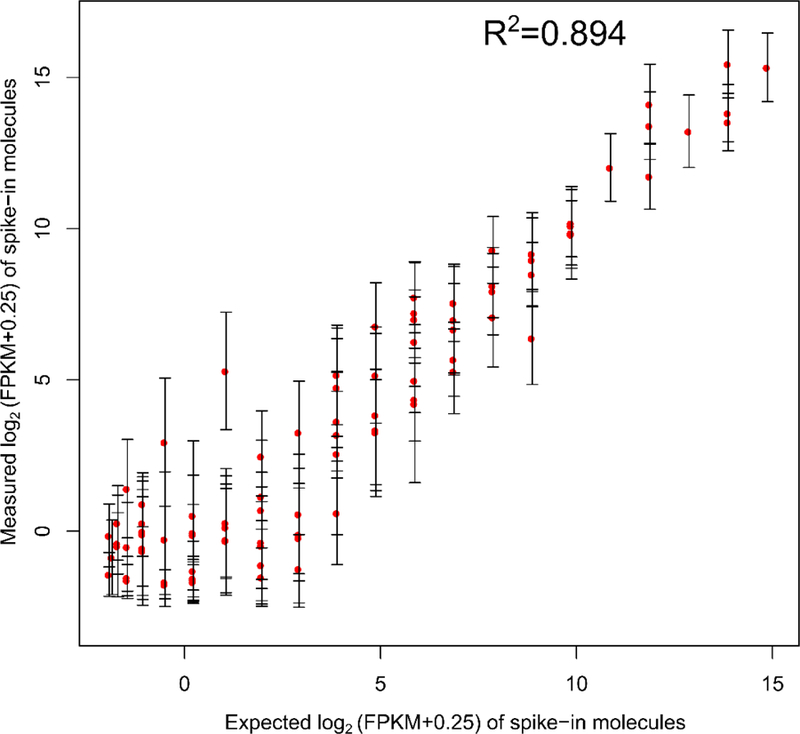
Correlation between measured values (in FPKM) of spike-in molecules detected versus expected values of these molecules. A linear response is observed over a wide range of FPKMs. During this experiment, spike-in mix (Thermo-Fisher cat. no. 4456740) was added at a concentration as per manufacturer’s recommendation into the lysis buffer and reverse transcription buffer.
In order to visualize the variability of transcript expression across samples and replicates, the gene expression variance (CV2, the squared coefficient of variation) was plotted against the mean expression log10FPKM (Fig. 8). The CV2 value is a measure of variability across replicates and is an indicator of data quality. The average profiling across replicates provided by Cuffdiff was used. 6 single-cell datasets were randomly picked for each method with each data set containing 2 million randomly sub-sampled reads. In Fig. 8a, for human cell samples, the CV2 for MID-RNA-seq data weaved in between the SMART-seq and ENCODE_single cell data while Fluidigm C1 (human) showed lower coefficient of variation. In Fig. 8b with the mouse cell line data, MID-RNA-seq shows the lowest CV2 out of all the technologies compared. Streets et al.14 (another microfluidic technology) also shows lower CV2 than other tube-based technologies.
Figure 8.
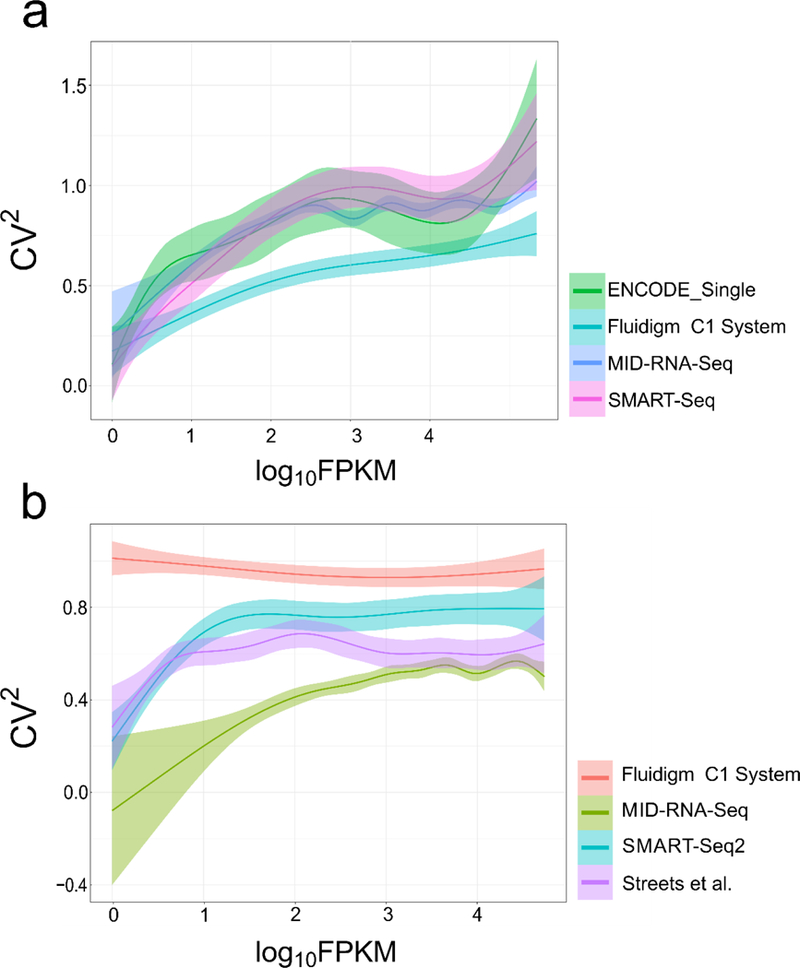
The relationship between variance (CV2) and FPKM of genes in single cells is shown for a) human and b) mouse cell line samples. Human datasets include ENCODE datasets(GSM2343071/2), SMART-seq from Ref.1, Fluidigm C1 System from Ref. 15. Mouse datasets include SMART-seq2 from Ref. 11, Streets et al. from Ref. 14 and Fluidigm C1 System from Ref. 7. 6 single-cell datasets were randomly picked for each method with each data set containing 2 million randomly sub-sampled reads.
Conclusions
In this paper we demonstrate a microfluidic platform for scRNA-seq referred to as MID-RNA-seq. The key advantage of MID-RNA-seq is that it eliminates the need of multiple chambers for multi-step treatment by using concentration-gradient-driven diffusion to deliver reagents into the reaction chamber and to remove reagents from previous steps. We also demonstrate that MID-RNA-seq as a scRNA-seq method is sensitive, precise and accurate when benchmarked against the state-of-the-art scRNA-seq techniques. The MID-RNA-seq protocol is complete from start to end: cell trapping, reverse transcription, amplification all take place on the microfluidic chip with very simple structures. Furthermore, the MID-RNA-seq device also offers other advantages associated with microfluidic platforms such as reduced reagent costs, scalability and multiplexity. Our microfluidic device is also compatible with essentially all scRNA-seq protocols. One drawback of our device is the additional time required for the associated diffusion-based reagent swapping steps. However, this processing time overhead averaged on each assay can be decreased by having a number of units working in parallel.
Materials and Methods
Microfluidic device fabrication
All microfluidic devices were made using multi-layer soft lithography 36–38. Briefly, a photomask containing the desired microscale patterns was designed on Layout Editor and printed on 10000 dpi films (Fineline Imaging, Colorado Springs, CO). The master mask was fabricated by spinning SU-8 2025 (Microchem, Newton, MA) and AZ P9260 (Clariant, Charlotte, NC) on a silicon wafer with the thickness being 50 μm for the reaction/loading chamber (made with SU-8) and 13 μm for fluidic channels (made with AZ P9260). The master was heated to 130℃ for 30 secs to form rounded cross-sectional profile for the channels made in AZ 9260. The control layer master was fabricated in SU-2025 with 24 μm thickness. The control layer PDMS was made by spinning PDMS (RTV615A: RTV615B=20:1 ratio, R. S. Hughes, Sunnyvale, CA) at 500 rpm for 10s and then at 1500 rpm 30s, which resulted a thickness of 65 µm. The fluidic layer PDMS was mixed in the ratio of RTV615A: RTV615B =5:1 and had a thickness of ~0.4 cm. Both layers of PDMS were cured at 80 ℃ for 15 min. The two layers were then aligned and thermally bonded for 1 h at 80 ℃. The two-layer PDMS device was then carefully peeled off from the master and access holes were punched to form the inlets and outlets for tubing attachment. Finally, the PDMS structure was bonded to clean thin cover glass (Thickness #1 (0.13 to 0.17mm), Ted Pella Inc.) after plasma oxidation of both surfaces (Harrick Plasma, Ithaca, NY). After bonding to glass, the device was baked at 80℃ overnight to strengthen the plasma bonding.
Cell culture
GM12878 cells were obtained from Coriell Institute for Medical Research. Cell line was grown in RPMI 1640 media (11875–093, Gibco) supplemented by 15% Fetal Bovine Serum (26140–079, Gibco) and 1% penicillin-streptomycin (15140–122, Gibco) at 37°C and 5% CO2, passaged every 2–3 days to maintain exponential growth. Before the scRNA-seq experiment, the concentration of the cell suspension was adjusted to 3.2 × 10⁵ /mL in PBS using a hemocytometer to facilitate single cell trapping.
MEF cells were obtained from ATCC (SCRC-1040) and cultured in DMEM (ATCC 30–2002) with 15% FBS and 1%PS at 37°C and 5% CO2. Cells were harvested at 80% confluence. They were detached by incubating with 0.25% trypsin with 0.1% EDTA (Thermo Fisher 25200056) for 1 min and then centrifuged at 120 × g for 5 min. Then, the supernatant was discarded, and cells were resuspended in fresh media and then adjusted to a concentration of 3.2 × 10⁵ /ml.
Microfluidic device operation
The control layer (indicated in green in Fig. 1, Fig. S1) was filled with deionized water before experiments. The pneumatic microvalves were actuated at 30psi by solenoid valves (18801003–12V, ASCO Scientific) that were connected to a compressed air supply. The operation of microvalves was controlled by a LabVIEW program on a computer and a data acquisition card (PCI-6509, National Instruments). We prepared double-stranded cDNA from mRNA of single cells using the protocol as described in Picelli et al. 11 after modification for compatibility with microfluidic platform.
Operation of the two-unit device:
The diluted cell suspension was loaded into the microfluidic device by a syringe pump through the inlet (Fig. S1). In order to do this, an air plug of about 1 cm long was created in a tubing filled with deionized water by aspiration before a plug of the cell suspension was aspirated into the same tubing. The tubing containing the cell suspension was then plugged into the inlet and the cell suspension was flowed into the cell trap at a flow rate of 5 µl/min while valves B and C were open (Fig. S1). The cell trapping chamber was observed under the microscope constantly to monitor the arrival of cells. Once a single cell was selected valve C followed by valve B were immediately closed to trap the cell. Next, the tubing delivering cells was taken out of the inlet and replaced with a fresh tubing delivering Lysis Buffer (0.33 U/µl of RNase inhibitor (Thermo Fisher Scientific, cat. no. N8080119), 0.95% Triton X-100 solution (Sigma-Aldrich, cat. no. T9284), 3.33 μM oligo-dT primer (IDT), 1.66 mM dNTP (Thermo-Fisher cat. no. R0192)). Valve A was opened and any residual cells upstream were flushed out at a flow rate of 30 µl/min. Next, the flow of the syringe pump was halted and valve A was closed. This was followed by opening of valves B and D. Built-up pressure in the system pushed the trapped cell in lysis buffer into the reaction chamber while pushing out air in the reaction chamber through gas-permeable PDMS. The outlet valve of the reaction chamber remained closed at all times to ensure no cell escape. Once this was complete, the valves B and D were closed to generate complete isolation of the cell in the reaction chamber. This process was conducted in both units of the device (2-unit device). The device was placed on a flat-plate thermocycler (Techne TC-4000) for lysis to take place at 72 °C for 3 min and then held at 4 °C until next step. Paraffin oil (18512, Sigma Aldrich) was used to facilitate thermal conduction between the flat plate and the glass substrate of the microfluidic device. After lysis was complete, the reverse transcription (RT) buffer (50U/µl Superscript II (Invitrogen, cat. no. 18064–014), 0.122 %Tween-20 (Thermo-Fisher Scientific cat. no. 85113), 0.5U/µl RNase inhibitor, 1X First Strand Buffer (Invitrogen, cat. no. 18064–014)), 3µM TSO primer(Exiqon), 5mM DTT (Invitrogen, cat. no. 18064–014), 1 M Betaine (Sigma-Aldrich, cat. no. 61962), 10mM MgCl2, 1mM dNTP mix) was then loaded into loading chambers of both units using the syringe pump at a flow rate of 10 µl/min through the buffer inlet. We ensured that no bubbles were trapped anywhere in the device. Once the buffer loading was complete, the valves close to buffer loading inlet were closed to ensure isolation of the loading chambers. The diffusion valves separating the reaction and loading chambers were then opened for 40 min to allow diffusion-based exchange to deliver the RT reagents and move out the lysis reagents. After completion of this exchange, the diffusion valves were closed and the flat-plate thermocycler was programmed for reverse transcription to take place at 42°C for 90 min, 10 cycles of (50°C for 2 min, 42°C 2 min), 70°C for 15 min. The device was held at 4 °C until the next step. For the PCR amplification step, the reagent mix in the loading chamber was replaced with fresh PCR buffer (0.3 µM PCR primer, 1X of Fidelity Buffer (Kapa Biosystems cat. No. KK2502), 0.3 mM dNTP, 0.1 U/µl HiFi Hot Start DNA Polymerase (Kapa Biosystems cat. no. KK2502)) using a syringe pump at the flow rate of 10 µl/min. The diffusion valves were then opened for 25 min and closed. The device was placed on the thermocycler and the reaction was carried out at 98 °C for 3 min, 18 cycles of (98 °C for 20 s,67 °C for 15 s, 72 °C for 6 min), 72 °C for 5 min. The device was held at 4 °C until next step. In order to prevent evaporation of water during long PCR cycles, water droplets were placed on top of the microfluidic device making sure to cover all access holes. Once the PCR reaction was over, for each unit, a tubing filled with Tris-EDTA buffer was attached to the cell inlet and the upstream was flushed out (by opening valve A) to remove any residual lysis buffer/debris at 20 µl/min. Then valves B, D and outlet were opened while valves A and C were closed and the amplified cDNA was flushed out of the reaction chamber and collected via pipette into an Eppendorf tube. The entire microfluidic process of cDNA preparation from cell trapping to flushing out of the amplified cDNA took about 6–7 h. This was just about 1 h of additional time compared to a standard bench-top SMART-seq2 protocol39. A schematic of this process in cross-sectional view can be seen in Fig. 1b.
Operation of the four-unit device:
The four-unit device had no single cell trapping modules attached. The operation was otherwise the same as the two-unit device. The four units were loaded sequentially with RNA solution that was extracted from GM12878 cells that were lysed off-chip. The RNA solution was diluted to 0.125 pg/nl to ensure 10 pg per 80 nl of reaction chamber volume for each unit. The amplified cDNA was extracted sequentially from each unit to prevent any cross-contamination across units.
Operation of the six-unit device:
The operation of the 6-unit device was similar to those of the 2-unit and 4-unit devices. A common cell trap upstream of the first unit trapped cells in a similar fashion with a side outlet for flushing out excess cells. Once a cell was trapped, a syringe attached to a tubing filled with lysis buffer pushed the trapped cell into each unit individually with the help of a syringe pump. During this process, the other units were sealed off using the micro valves to prevent any interference. The action was repeated 6 times to trap single cells in each unit. Once cells were trapped, buffers were loaded into the outer loading chambers through the buffer inlet. The common diffusion valve was then opened to allow diffusion to take place followed by closing of the diffusion valve and flat-plate thermocycler based reactions. The time for operation of the 6-unit device was slightly longer than that of the 2-unit or 4-unit devices with additional 10–15 min for trapping 6 cells instead of 2.
Primer sequences used in the process are as given below:
TSO Primer: (5′-AAGCAGTGGTATCAACGCAGAGTACATrGrG+G-3′) from Exiqon
Oligo dT Primer: (5′–AAGCAGTGGTATCAACGCAGAGTACT30VN-3′) from IDT
PCR Primer:(5′-AAGCAGTGGTATCAACGCAGAGT-3′) from IDT
Library Preparation and sequencing
After clean-up of amplified cDNA using Ampure XP Beads (Beckman Coulter A63881), the sample was quantified using Qubit Assay and the appropriate amount of cDNA (100–300 pg) was used for preparing a library using the NEXTERA XT (Illumina, cat. no. FC-131–1096) kit following the manufacturer’s protocol. Bulk GM12878 samples were prepared using the SMART-seq v4 Kit from Takara Bio (cat. no. 634894) in the high input mode followed by library preparation using the same NEXTERA XT kit. We checked library fragment size using high sensitivity DNA analysis kit (5067–4626, Agilent) on an Agilent 2200 Tape Station. The libraries were sent out for Illumina HiSeq 4000 sequencing with single-end 50 bp reads with the exception of data produced using the 6-unit device (by Illumina HiSeq X sequencing with 2×150 bp paired end reads). Averagely, each single-cell data set had a sequencing depth of 11.45 million reads and bulk RNA-seq data sets had a sequencing depth of 3.5 million reads.
Analysis of Sequencing Data
Quality check of the sequencing data was performed using FASTQC. The sequencing reads were trimmed by Cutadapt 0.4.1 and Trim_galore 1.12 to discard low-quality reads. Adaptors and overrepresented sequences were also trimmed. If trimmed reads were less than 25 bp they were discarded. In order to ensure a fair comparison among methods with differences in sequencing depths, we sub-sampled reads to two million reads each 13, 15. The cleaned reads were then mapped to hg19 human genome or the mm9 mouse genome using Tophat v2.1.1. For all libraries the percentage of mapped reads were between 80–90%. The mapped reads were then converted to fragments per kilobases transcript per million mapped reads(FPKM value) using the well-established Tuxedo suite pipeline as described in the paper by Trapnell et al. 40. R scripts were used to perform further downstream analysis of the Cufflinks and Cuffdiff files to generate other supporting figures.
Supplementary Material
Acknowledgement
This work was supported by US National Institutes of Health grants EB017235, CA214176, HG009256, and a grant from Jeffress Trust Awards Program.
Footnotes
Accession codes
Gene Expression Omnibus: MID-RNA-seq data are deposited under accession number GSE119271.
https://www.ncbi.nlm.nih.gov/geo/query/acc.cgi?acc=GSE119271
Competing interests
The authors declare no competing financial interests.
References
- 1.Marinov GK, Williams BA, McCue K, Schroth GP, Gertz J, Myers RM and Wold BJ, Genome Res, 2014, 24, 496–510. [DOI] [PMC free article] [PubMed] [Google Scholar]
- 2.Porter JR, Telford WG and Batchelor E, J. Vis. Exp, 2017, 120, e55219. [DOI] [PMC free article] [PubMed] [Google Scholar]
- 3.Saliba A-E, Westermann AJ, Gorski SA and Vogel J, Nucleic Acids Res, 2014, 42, 8845–8860. [DOI] [PMC free article] [PubMed] [Google Scholar]
- 4.Zhao Q-Y, Gratten J, Restuadi R and Li X, Quantitative Biology, 2016, 4, 22–35. [Google Scholar]
- 5.Kalisky T, Blainey P and Quake SR, Annu. Rev. Genet, 2011, 45, 431–445. [DOI] [PMC free article] [PubMed] [Google Scholar]
- 6.Tang F, Barbacioru C, Wang Y, Nordman E, Lee C, Xu N, Wang X, Bodeau J, Tuch BB, Siddiqui A, Lao K and Surani MA, Nat. Methods, 2009, 6, 377–382. [DOI] [PubMed] [Google Scholar]
- 7.Hashimshony T, Senderovich N, Avital G, Klochendler A, de Leeuw Y, Anavy L, Gennert D, Li S, Livak KJ, Rozenblatt-Rosen O, Dor Y, Regev A and Yanai I, Genome Biol, 2016, 17, 77. [DOI] [PMC free article] [PubMed] [Google Scholar]
- 8.Macosko EZ, Basu A, Satija R, Nemesh J, Shekhar K, Goldman M, Tirosh I, Bialas AR, Kamitaki N, Martersteck EM, Trombetta JJ, Weitz DA, Sanes JR, Shalek AK, Regev A and McCarroll SA, Cell, 2015, 161, 1202–1214. [DOI] [PMC free article] [PubMed] [Google Scholar]
- 9.Jaitin DA, Kenigsberg E, Keren-Shaul H, Elefant N, Paul F, Zaretsky I, Mildner A, Cohen N, Jung S, Tanay A and Amit I, Science, 2014, 343, 776–779. [DOI] [PMC free article] [PubMed] [Google Scholar]
- 10.Hochgerner H, Lönnerberg P, Hodge R, Mikes J, Heskol A, Hubschle H, Lin P, Picelli S, La Manno G, Ratz M, Dunne J, Husain S, Lein E, Srinivasan M, Zeisel A and Linnarsson S, Sci. Rep, 2017, 7, 16327. [DOI] [PMC free article] [PubMed] [Google Scholar]
- 11.Picelli S, Björklund ÅK, Faridani OR, Sagasser S, Winberg G and Sandberg R, Nat. Methods, 2013, 10, 1096–1098. [DOI] [PubMed] [Google Scholar]
- 12.Picelli S, RNA Biol, 2017, 14, 637–650. [DOI] [PMC free article] [PubMed] [Google Scholar]
- 13.Ziegenhain C, Vieth B, Parekh S, Reinius B, Guillaumet-Adkins A, Smets M, Leonhardt H, Heyn H, Hellmann I and Enard W, Molecular cell, 2017, 65, 631–643. [DOI] [PubMed] [Google Scholar]
- 14.Streets AM, Zhang X, Cao C, Pang Y, Wu X, Xiong L, Yang L, Fu Y, Zhao L, Tang F and Huang Y, Proceedings of the National Academy of Sciences, 2014, 111, 7048–7053. [DOI] [PMC free article] [PubMed] [Google Scholar]
- 15.Wu AR, Neff NF, Kalisky T, Dalerba P, Treutlein B, Rothenberg ME, Mburu FM, Mantalas GL, Sim S, Clarke MF and Quake SR, Nat. Methods, 2013, 11, 41–46. [DOI] [PMC free article] [PubMed] [Google Scholar]
- 16.Zilionis R, Nainys J, Veres A, Savova V, Zemmour D, Klein AM and Mazutis L, Nat. Protoc, 2017, 12, 44–73. [DOI] [PubMed] [Google Scholar]
- 17.Papalexi E and Satija R, Nat. Rev. Immunol, 2018, 18, 35–45. [DOI] [PubMed] [Google Scholar]
- 18.Toriello NM, Douglas ES, Thaitrong N, Hsiao SC, Francis MB, Bertozzi CR and Mathies RA, Proceedings of the National Academy of Sciences, 2008, 105, 20173–20178. [DOI] [PMC free article] [PubMed] [Google Scholar]
- 19.White AK, VanInsberghe M, Petriv OI, Hamidi M, Sikorski D, Marra MA, Piret J, Aparicio S and Hansen CL, Proceedings of the National Academy of Sciences, 2011, 108, 13999–14004. [DOI] [PMC free article] [PubMed] [Google Scholar]
- 20.Pollen AA, Nowakowski TJ, Shuga J, Wang X, Leyrat AA, Lui JH, Li N, Szpankowski L, Fowler B, Chen P, Ramalingam N, Sun G, Thu M, Norris M, Lebofsky R, Toppani D, Kemp Ii DW, Wong M, Clerkson B, Jones BN, Wu S, Knutsson L, Alvarado B, Wang J, Weaver LS, May AP, Jones RC, Unger MA, Kriegstein AR and West JAA, Nature Biotechnology, 2014, 32, 1053. [DOI] [PMC free article] [PubMed] [Google Scholar]
- 21.Wilson IG, Appl. Environ. Microbiol, 1997, 63, 3741–3751. [DOI] [PMC free article] [PubMed] [Google Scholar]
- 22.Trombley Hall A, McKay Zovanyi A, Christensen DR, Koehler JW and Devins Minogue T, PLoS One, 2013, 8, e73845. [DOI] [PMC free article] [PubMed] [Google Scholar]
- 23.Al-Soud WA and Rådström P, J. Clin. Microbiol, 2001, 39, 485–493. [DOI] [PMC free article] [PubMed] [Google Scholar]
- 24.Marcus JS, French Anderson W and Quake SR, Anal. Chem, 2006, 78, 3084–3089. [DOI] [PubMed] [Google Scholar]
- 25.Legendre LA, Bienvenue JM, Roper MG, Ferrance JP and Landers JP, Anal. Chem, 2006, 78, 1444–1451. [DOI] [PubMed] [Google Scholar]
- 26.Gilbert T, Sellaro T and Badylak S, Biomaterials, 2006, 27, 3675–3683. [DOI] [PubMed] [Google Scholar]
- 27.Ma S, Loufakis DN, Cao Z, Chang Y, Achenie LE and Lu C, Lab Chip, 2014, 14, 2905–2909. [DOI] [PMC free article] [PubMed] [Google Scholar]
- 28.Ma S, de la Fuente Revenga M, Sun Z, Sun C, Murphy TW, Xie H, González-Maeso J and Lu C, Nature Biomedical Engineering, 2018, 2, 183–194. [PMC free article] [PubMed] [Google Scholar]
- 29.Miura F, Kawaguchi N, Yoshida M, Uematsu C, Kito K, Sakaki Y and Ito T, BMC Genomics, 2008, 9, 574–574. [DOI] [PMC free article] [PubMed] [Google Scholar]
- 30.Milo R and Phillips R, Cell Biology by the Numbers, Garland Science, 2015.
- 31.Young ME, Carroad PA and Bell RL, Biotechnol. Bioeng, 1980, 22, 947–955. [Google Scholar]
- 32.Ramsköld D, Luo S, Wang Y-C, Li R, Deng Q, Faridani OR, Daniels GA, Khrebtukova I, Loring JF, Laurent LC, Schroth GP and Sandberg R, Nat. Biotechnol, 2012, 30, 777–782. [DOI] [PMC free article] [PubMed] [Google Scholar]
- 33.Trapnell C, Hendrickson DG, Sauvageau M, Goff L, Rinn JL and Pachter L, Nature Biotechnology, 2012, 31, 46. [DOI] [PMC free article] [PubMed] [Google Scholar]
- 34.Krishnaswami SR, Grindberg RV, Novotny M, Venepally P, Lacar B, Bhutani K, Linker SB, Pham S, Erwin JA, Miller JA, Hodge R, McCarthy JK, Kelder M, McCorrison J, Aevermann BD, Fuertes FD, Scheuermann RH, Lee J, Lein ES, Schork N, McConnell MJ, Gage FH and Lasken RS, Nat. Protoc, 2016, 11, 499–524. [DOI] [PMC free article] [PubMed] [Google Scholar]
- 35.Hashimshony T, Wagner F, Sher N and Yanai I, Cell Rep, 2012, 2, 666–673. [DOI] [PubMed] [Google Scholar]
- 36.Geng T, Zhan Y, Wang J, Lu C, Nature Protocols, 2011, 6, 1192–1208. [DOI] [PubMed] [Google Scholar]
- 37.Ma S, Hsieh Y-P, Ma J, Lu C, Science advances, 2018, 4, eaar8187. [DOI] [PMC free article] [PubMed] [Google Scholar]
- 38.Murphy TW, Hsieh YP, Ma S, Zhu Y and Lu C, Anal Chem, 2018, 90, 7666–7674. [DOI] [PMC free article] [PubMed] [Google Scholar]
- 39.Picelli S, Faridani OR, Björklund ÅK, Winberg G, Sagasser S and Sandberg R, Nature Protocols, 2014, 9, 171. [DOI] [PubMed] [Google Scholar]
- 40.Trapnell C, Roberts A, Goff L, Pertea G, Kim D, Kelley DR, Pimentel H, Salzberg SL, Rinn JL and Pachter L, Nat. Protoc, 2012, 7, 562–578. [DOI] [PMC free article] [PubMed] [Google Scholar]
Associated Data
This section collects any data citations, data availability statements, or supplementary materials included in this article.


