Abstract
Protactinium-233 (233Pa) is used as a tracer for radiochemical analysis and is of particular interest as an isotope dilution mass spectrometry (IDMS) spike for 231Pa/235U radio-chronometry. To this end, we present massic activity determinations by two methods for a 233Pa solution, which was prepared at Lawrence Livermore National Laboratory (LLNL) and is being characterized at multiple labs as part of a 231Pa reference material production project. One activity determination method was 4πβ-γ anti-coincidence counting in a multi-dimensional extrapolation model, with Monte Carlo corrections. An independent massic activity determination was completed by γ-ray spectrometry using 5 HPGe detectors using 5 γ-ray lines. The anti-coincidence and γ-ray spectrometry results agree and have combined standard uncertainties of about 0.33 % and 1.0 % respectively. In addition, the two methods were combined to derive γ-ray emission probabilities from 233Pa decay.
Keywords: Protactinium-233, Pa-233, 233Pa, activity, IDMS spike, gamma-ray emission probability
Introduction
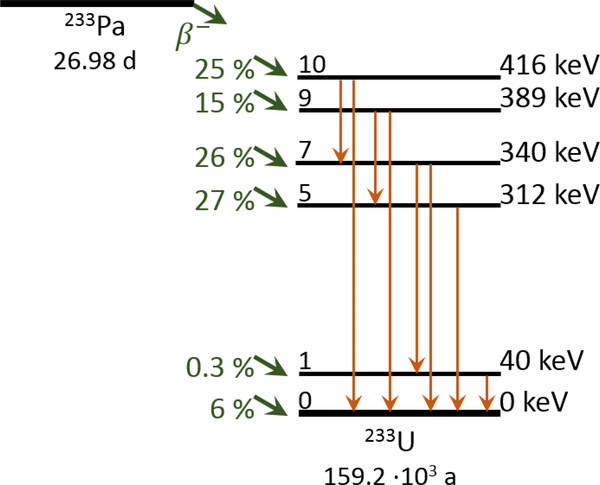
Protactinium-233 (233Pa) is an important tracer for radiochemical analysis of 231Pa [1–3]. Whereas 231Pa undergoes alpha decay without significant γ-ray emission, 233Pa decays by β-particle emission accompanied by numerous γ-rays (Figure 1); as such the 231Pa γ-ray signal can be used for monitoring Pa separations.
Figure 1.
In the field of nuclear forensics, there is an outstanding challenge for producing well-characterized 233Pa solutions for use as a spike in Isotope Dilution Mass Spectrometry (IDMS) analysis of 231Pa for 231Pa/235U dating [4,5]. The present work is motivated by a project led by Lawrence Livermore National Laboratory (LLNL) to produce a reference material characterized for amount of 231Pa. This reference material will allow for traceable calibrations of the necessary short-lived 233Pa spikes (half-life: 26.98 d ± 0.02 d [6,7]). That project requires a 233Pa spike with well characterized concentration (mol/g) for reverse-IDMS measurements. One method for obtaining that concentration is to measure the 233Pa massic activity (Bq/g) of the spike solution and then use the half-life to convert to concentration. To that end, LLNL sent aliquots of their spike solution to multiple radionuclide metrology labs for assay. Here, we report the results from the National Institute of Standards and Technology (NIST).
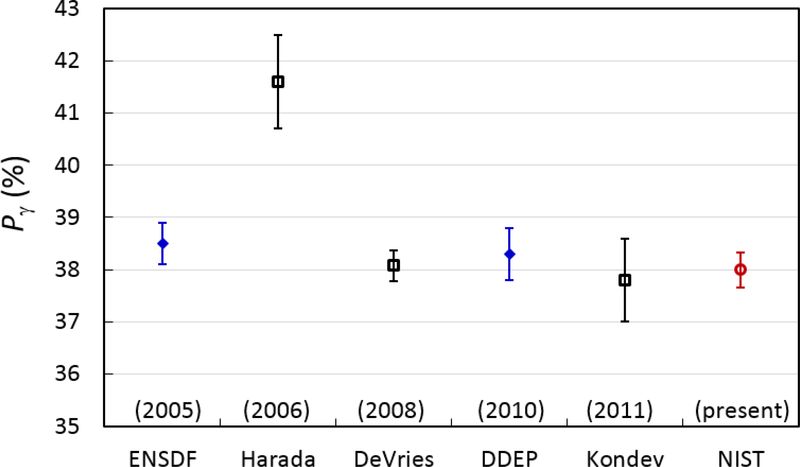
This project presented an opportunity to measure the massic activity by live-timed 4πβ-γ anticoincidence counting (LTAC) of a very pure 233Pa solution. Previous standardizations have relied on the equilibrium conditions of 233Pa with its parent 237Np, taking advantage of the relative ease of measuring absolute alpha decay of 237Np rather than beta decay of 233Pa [8–17]. In some of those works, both nuclides were measured in equilibrium using 4παβ-γ coincidence [15,16]. The γ-ray emission probabilities ( ) for 233Pa decay have been evaluated [14,7,18]. The Pγ for the 312 keV transition as measured by [17] differs significantly from the evaluated value. A subsequent study [10] agrees with the evaluated value. The Pγ in question has implications for the 237Np and 232Th neutron capture cross sections. The present work provides an independent measurement of the 312-keV Pγ.
Experimental
Source Preparation
The final purification of the 233Pa solution occurred at LLNL on 27 June 2017 at 15:50 PDT, which serves as the reference time for the activity measurements reported here. The solution consisted of 2 mol L−1 HNO3 + 0.1 mol L−1 HF. The activity ratio of 237Np to 233Pa at separation was < 1 ⋅ 10−8 [Williams, R.W.; personal communication 2017]. Approximately 5.3 g of the 233Pa solution was shipped to NIST in a Teflon vial.
In July 2017, the LLNL vial was opened at NIST. Approximately 0.04 g to 0.16 g was transferred gravimetrically into each of 8 liquid scintillation (LS) vials containing 4 mL of either “Ultima Gold”1 (2 vials) or “Ultima Gold AB” scintillants (Perkin Elmer, Waltham, MA, USA). Additional 2 mol L−1 HNO3 carrier was added to bring the aqueous content of the LS sources up to 2 % for Ultima Gold and 6 % for Ultima Gold AB. The 233Pa solution was diluted with carrier by a factor of 1.2960 ± 0.0006 for gravimetrically filling a standard 5 mL NIST ampoule [19] for which our HPGe detectors are calibrated. All of the gravimetric transfers were done by measuring by difference the masses of solution dispensed from an aspirating polyethylene pipette (“pycnometer”) using a 6-digit microbalance.
4πβ-γ anticoincidence measurements
The 4πβ-γ anticoincidence (LTAC) method was used to determine the massic activity of the 233Pa solution. The NIST LTAC system and Monte Carlo analysis method have been described previously [20,21]. In brief, the 4πβ detector consists of a liquid scintillation (LS) source coupled to a single photomultiplier tube. The γ-ray (and x-ray) detector is a NaI(Tl) well detector. A digital data acquisition system is used to record the pulse heights and time stamps from both detectors. The data are processed offline by the multiple channel anticoincidence method with shared, controllable extending deadtime [22]. The LS efficiency is varied by changing the lower-level discriminator for the LS amplitude in the software.
Up to 3 NaI(Tl) gates were used in anti-coincidence mode to monitor the LS inefficiency for three different subsets of decays. The output of the data processing was the LS rate (NLS), and the NaI(Tl) anticoincident-to-total ratios (Yi) for each of the 3 gates. A linear combination of the Yi is adopted as the effective LS inefficiency,
| (1) |
where the ai are weighting factors. Either a linear or quadratic least-squares fit of the LS rate (NLS) vs. Yeff is carried out and extrapolated to Yeff=0, to obtain the nominal source decay rate (N0). The linear fit equation with free parameters N0, k, and the ai is,
| (2) |
Due to the complex decay scheme, N0 from the fit can differ from the true activity. To correct for this, a Monte Carlo simulation, using Geant4 library [23], of the entire experiment was performed with identical extrapolations as for the data. A correction factor, F, was derived by the ratio of N0 to the “true” activity input to the Monte Carlo.
The final massic activity (A) was determined for each source from N0, F, and mass, m of the 233Pa solution in the source.
| (3) |
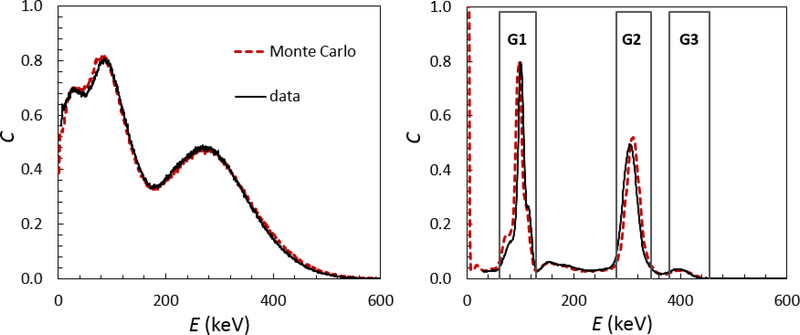
The free parameter in the Monte Carlo simulation is the scintillation efficiency, which was set to 4500 UV photons per MeV of electron energy, which matched the experimental LS spectrum (Figure 2). The three NaI(Tl) gates were set to be sensitive to various decay pathways (Table 1), such that the LS efficiency for each path could be extrapolated to 100 % (Yi = 0). Since 233Pa does have a significant β branch to the 233U ground state (β0), without emission of a photon, the LS efficiency of that branch is not monitored by any of the gates. However, since all the β spectra are of similar shape, (same nucleus, all first-forbidden), one can use a linear combination of Yi′s from other transitions to represent the inefficiency for detecting β0 [22]. However, given the complicated decay scheme, including numerous conversion electrons, achieving a linear extrapolation using the three Yi values is not necessarily possible. Therefore, the Monte Carlo correction, F, was employed throughout.
Figure 2.
Measured (solid black lines) and simulated (dashed red lines) spectra from LS (left) and NaI(Tl) (right) detectors, where C is counts with arbitrary scaling and E is approximate energy, proportional to pulse height. In the LS spectrum, the three peaks correspond to conversion electrons. In the NaI(Tl) spectrum, the three gates used for LTAC are shown.
Table 1.
Energy gates in the LTAC NaI(Tl) detector. For each gate, we list the photon energy range encompassed by the gate, the major γ-ray and x-ray photons detected in the gate, and correlated LS events, whose efficiency is monitored by the coincident photon events. Subscripts correspond to energy levels shown in Figure 1.
| Gate | E (keV) | photons | Correlated LS events |
|---|---|---|---|
| 1 | 60 to 130 |
γ10,7 γ9,5 XK |
β10 → γ7,0 β9 → γ5,0 βi≥5 → CE5,0 |
| 2 | 280 to 345 |
γ7,0 γ5,0 γ7,1 |
β7; β10 → CE10,7 β5; β7 → CE7,5 β7 → CE1,0 |
| 3 | 380 to 455 |
γ10,0 γ9,0 |
β10 β9 |
HPGe detector measurements
Gamma-ray spectrometry measurements were carried out to determine the γ-ray emitting impurities in the source and the source activity. Five different HPGe detectors (both n-type and p-type detectors) with well-characterized efficiency curves [24] were used to determine the source activity. A total of ten measurements were performed for the standard 5 mL NIST ampoule using seven different source measurement geometries. For these different measurement geometries, the sources were placed above and on the side of the HPGe detectors at several source-to-detector distances varying between 20 cm and 50 cm. For each measurement, the live time was 1 day. The activity was calculated based on the 300.129 keV, 311.904 keV, 340.476 keV, 398.492 keV and 415.764 keV γ-ray peaks and the 2010 DDEP (Decay Data Evaluation Project) evaluated emission probabilities (Pγ’s) and half-life [6,7]. The full-energy-peak efficiency values for the HPGe detectors were previously determined using standard 5 mL NIST ampoules containing calibrated solutions of radionuclides that cover an energy range from 35 keV to 1.8 MeV and which were placed at the same source-to-detector distances as those used in the present measurements. The efficiency curves were fitted using two different methods (sixth degree polynomial and dual polynomial fit (spline function) with a cross-over point at around 200 keV) in order to assess possible variability in the calculated values for the different γ-ray energies for 233Pa.
Results
4πβ-γ anticoincidence measurements
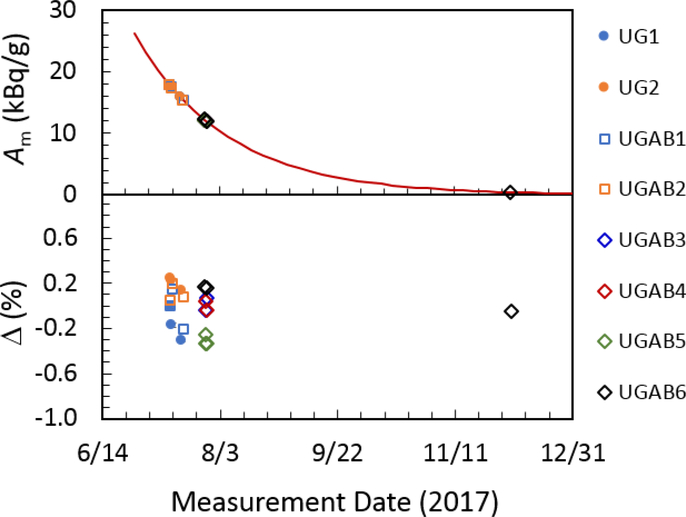
Each of the 8 LS sources was measured either 2 or 3 times between 7 July 2017 and 28 July 2017. No systematic difference was seen between the results for the two LS cocktails, and the source-to-source standard deviation was 0.17 %. There was no statistically-significant trend in activity measurement vs. time for a given source, averaged over all sources. However, for the four sources that were measured over a longer (5 day) period, three of them showed a decreasing trend of intercept value over time. To conservatively account for any LS cocktail instability, the average decrease in intercept value for those 4 sources was included as an uncertainty component in the massic activity determination.
To check for long-lived impurities, one source was measured again on 4 December 2017, after the 233Pa had decayed by 6 half-lives. The measured activity differed from the mean of the earlier measurements by (−0.5 ± 1.4) %2. This uncertainty would correspond to a limit on long-lived α- or β-emitting impurities of about 0.04 % at the midpoint of the July measurements (2017–07-20 07:00 EST).
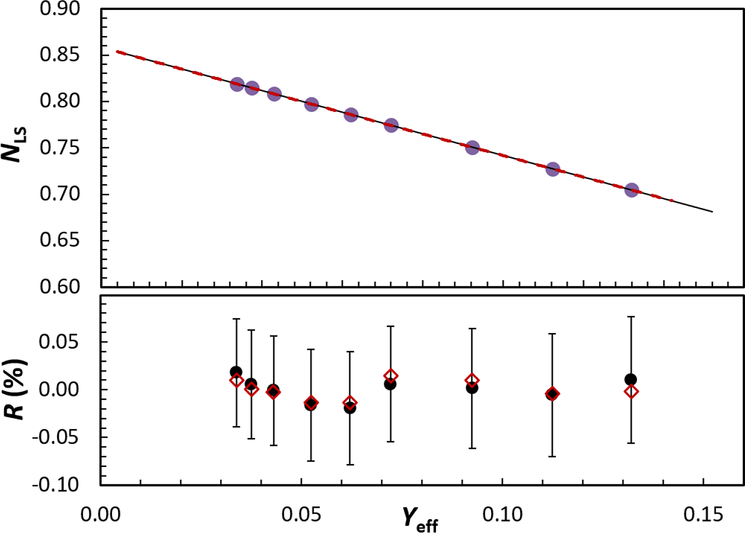
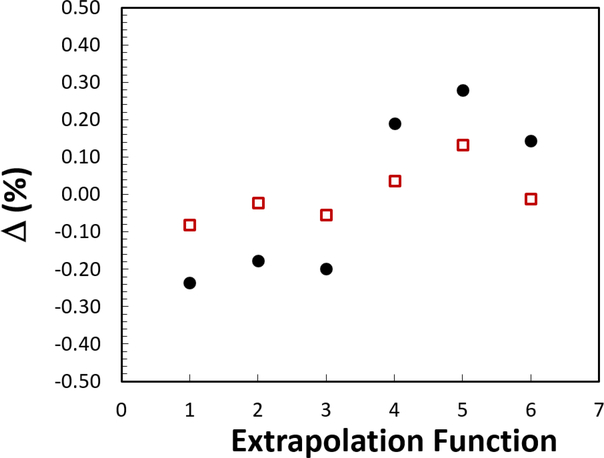
Various efficiency extrapolation functions were used to test the sensitivity of the extrapolation intercept to the functional form (linear or quadratic) and number of γ-ray gates (up to 3) included. Example efficiency extrapolations and fit residuals are shown in Figure 4. The various fits are summarized in Table 2 and the relative results are shown in Figure 5.
Figure 4.
Example efficiency extrapolation from source UGAB1. Linear (solid black line) and quadratic (dashed red line) are indistinguishable by eye. Residuals for linear (black circles) and quadratic (red diamonds) are shown
Table 2.
Summary of extrapolation functions used to analyze the LTAC data. In cases where the ai were not free, they were fixed by the best fit to the Monte Carlo simulation results.
| Function | Energy Range (keV) | Order | Free Parameters |
|---|---|---|---|
| 1 | 14 to 50 | Linear | N0, k |
| 2 | 14 to 50 | Linear | a1, a2, a3, N0, k |
| 3 | 14 to 50 | Quadratic | N0, k |
| 4 | 30 to 100 | Linear | N0, k |
| 5 | 30 to 100 | Linear | a1, a2, a3, N0, k |
| 6 | 30 to 100 | Quadratic | N0, k |
Figure 5.
Percent difference (Δ) from the average result for 6 different extrapolation functions, without (●) and with (□) Monte Carlo correction factor (F). The corrected values show less model-dependence
The final value for the LTAC 233Pa massic activity determination was taken as the mean of methods 1, 2, and 3 in Table 2. Those three values were chosen since they included the highest-efficiency LS data, therefore had the shortest extrapolation in Yeff. However, the standard deviation of all 6 values were used in the uncertainty analysis. The final LTAC 233Pa massic activity at the reference time of 27 June 2017 15:50 PDT was 2.361 ⋅ 104 Bq g−1 with a combined standard uncertainty of 0.33 %. The uncertainty analysis is summarized in Table 3.
Table 3.
| Uncertainty component | ui (%) | Evaluation |
|---|---|---|
| Source stability: Average deviation between measured activity for the same source measured 5 days apart, averaged over 4 sources. | 0.15 | A |
| Source-to-source variability: Standard deviation of the distribution (N=5) for the extrapolation intercepts of 5 sources. The value for each source was an average of 2 or 3 measurements. | 0.17 | A |
| Least-squares fit: uncertainty on extrapolation value due to the fit | 0.07 | A |
| Extrapolation range and function: Standard deviation of the distribution (N = 6) for 6 fits spanning 2 LS efficiency ranges, each with its own Yeff weighting. For each range, three fits were carried out: Linear Yeff, Linear 3gate, Quadratic Yeff. Results were then corrected for bias using Geant4. | 0.06 | A |
| Geant4 model uncertainty: Uncertainty on the corrections (−0.09 % to 0.22 %) using Geant4 model due to nuclear data and matching of model to data. | 0.17 | B |
| Background: Standard deviation in mean intercept from using various background measurements (7 background measurements made). | 0.06 | A |
| Gravimetric links: Estimated uncertainty in the mass of 233Pa solution added to the LS hemispheres based on previous tests. | 0.05 | B |
| Live-time: Estimated uncertainty in the live time of the counting system, based on limits of previous systematic tests | 0.10 | B |
| Half-life: Uncertainty due to DDEP half-life (26.98 +/− 0.02) d. | 0.002 | B |
| Impurities: None seen. From limit on LTAC and HPGe analyses. | 0.03 | B |
| Combined standard uncertainty: uc (%) | 0.33 |
HPGe detector impurity measurements
No γ-ray emitting impurities were observed in the source. The estimated limits of detection for the photon-emitting impurities as of August 1, 2017 were: 90 γ s−1 for energies between 15 keV and 35 keV, 20 90 γ s−for energies between 40 keV and 55keV, 30 90 γ s−for energies between 60 keV and 180 keV, 18 90 γ s−for energies between 185 keV and 280 keV, 40 90 γ s−for energies between 258 keV and 330 keV, 14 90 γ s−for energies between 340 keV and 430 keV, and 4.8 90 γ s−for energies between 440 keV and 2000 keV.
HPGe detector activity determination
The peak areas used to determine the 233Pa activity were obtained using Genie 2000 (Canberra Industries, Inc., Meriden, CT, USA) (using interactive peak fit without the fit singlet option). Due to the low counting rates, no pile-up corrections were necessary. Decay corrections during the measurement time and to the reference time were performed for all measurements. The dilution mass of solution in the HPGe ampoule and dilution factor were used to calculate a massic activity of the NIST-1 solution. The measured massic activity of 233Pa at the reference time was 2.611 ⋅ 104 Bq g−1 with a combined standard uncertainty of 0.93 %. The uncertainty evaluation is summarized in Table 4.
Table 4.
Uncertainty analysis for the 233Pa massic activity determined by HPGe γ-ray spectrometry.
| Uncertainty component | ui (%) | Evaluation |
|---|---|---|
| Peak fitting and counting statistics: Standard deviation of the mean value of the peak areas | 0.11 | A |
| Gamma-ray emission probabilities: Standard deviation of the mean value of Pγ(E) | 0.73 | B |
| Efficiency: HPGe detector full-energy peak efficiency fit based on measured efficiency curve | 0.57 | B |
| Decay correction during measurement: Uncertainty due to the application of a decay correction during the measurement time. | 0.0005 | B |
| Decay factor: Uncertainty due to the application of a decay factor correction for the source activity from the reference time to the measurement time. | 0.04 | B |
| Combined Standard Uncertainty: uc (%) | 0.93 |
HPGe detector γ-ray emission probability (Pγ) determination
The HPGe measurements of the 233Pa source and the LTAC massic activity determination were used to determine the emission probability of five of the main γ-ray lines. For the determination of the Pγ values, the same corrections as for the HPGe activity determination were applied. The activity of the source used for the HPGe measurements was (59.420 ± 0. 196) kBq at the reference time of 20 July 2017, 7:00 AM EST. The Pγ values determined in this work are listed in Table 5 together with the most-recent values from DDEP [7,6]. The result for the 312 keV Pγ is shown in Figure 6, along with recent experimental and evaluation results. The present work is in good agreement with recent evaluations, though disagrees with the anomalously-high Pγ from [17].
Table 5.
Measured Pγ values for five main γ-ray lines of 233Pa
Figure 6.
Recent Pγ results for the 312 keV γ-ray in 233Pa decay. Blue diamonds are evaluations, open squares are previous experimental results and the red open circle is the present work. ENDSF refers to [18] and DDEP to [7,6].
Discussion
The LTAC determination of 233Pa massic activity using multiple γ-ray gates proved robust against a variety of extrapolation functions. By implementing Monte Carlo correction factors, the variance in extrapolation intercepts among extrapolation functions and efficiency domains was reduced significantly. Furthermore, the lack of radionuclidic impurities detected by both HPGe γ-ray analysis and the consistent LTAC 233Pa activity results over 6 half-lives, indicate that the 233Pa solution is quite pure, making it an excellent reference material.
By combining the 4πβ-γ anticoincidence result with the evaluated half-life of 233Pa (26.98 ± 0.02) d, and Avogadro’s number, we obtain a concentration of the measured 233Pa atom mole concentration at the reference date of 1.471 ⋅ 10−10 mol/kg with a combined standard uncertainty of 0.34 %. This can now be used as a reference for isotope dilution mass spectrometry of 231Pa, which was carried out using the solution shortly after separation. The HPGe γ-ray measurement result for the massic activity of 231Pa agrees with the LTAC value, differing by (−0.8 ± 1.1) %, where the uncertainty is the combined standard uncertainty on the difference, ignoring small correlations due to half-life. This excellent agreement confirms the LTAC activity value and is also an indication that the uncertainty on the γ-ray emission probabilities used in the HPGe analysis were reasonable. Conversely, by combining LTAC and HPGe measurements, our derived values for the Pγ values are in good agreement with published values. Our value for the strong 312 keV γ-ray agrees with, and has a smaller uncertainty than, the evaluated value. In essence, that result validates our direct measurement of 233Pa by LTAC, compared to earlier indirect values based on 237Np parent measurements and equilibrium assumptions.
Figure 3.
Decay-corrected LTAC measurement results for 8 LS sources (named in caption). Top: massic activity, Am. Bottom: decay-corrected Am plotted as a percent difference (Δ) from the average (excluding the final measurement, used only as an impurity check). Results from linear efficiency extrapolations (Function 1 in Table 2) are shown.
Acknowledgements
The authors wish to acknowledge Ross Williams and his colleagues at LLNL who provided the 233Pa solution along with leading the larger 231Pa reference material project and our NIST colleague Richard Essex who coordinated the 233Pa and 231Pa measurements at NIST. This work was supported in part by the Department of Homeland Security.
Footnotes
References
- 1.La Rosa J, Outola I, Crawford E, Nour S, Kurosaki H, Inn K (2008) Radiochemical measurement of 237Np in a solution of mixed radionuclides: Experiences in chemical separation and alpha-spectrometry. J Rad Nucl Chem 277 (1):11–18. doi: 10.1007/s10967-008-0702-y [DOI] [Google Scholar]
- 2.Sill CW (1978) Radiochemical Determination of Protactinium-231 in Environmental and Biological Materials. Analytical Chemistry 50 (11):1559–1571 [DOI] [PubMed] [Google Scholar]
- 3.Morgenstern AA,C;Mayer K; (2002) Age Determination of Highly Enriched Uranium: Separation and Analysis of 231Pa. Analytical Chemistry 74:5513–5516 [DOI] [PubMed] [Google Scholar]
- 4.Eppich GR, Williams RW, Gaffney AM, Schorzman KC (2013) 235U–231Pa age dating of uranium materials for nuclear forensic investigations. Journal of Analytical Atomic Spectrometry 28 (5):666. doi: 10.1039/c3ja50041a [DOI] [Google Scholar]
- 5.Kristo MJ, Williams R, Gaffney AM, Kayzar-Boggs TM, Schorzman KC, Lagerkvist P, Vesterlund A, Ramebäck H, Nelwamondo AN, Kotze D, Song K, Lim SH, Han S-H, Lee C-G, Okubo A, Maloubier D, Cardona D, Samuleev P, Dimayuga I, Varga Z, Wallenius M, Mayer K, Loi E, Keegan E, Harrison J, Thiruvoth S, Stanley FE, Spencer KJ, Tandon L (2018) The application of radiochronometry during the 4th collaborative materials exercise of the nuclear forensics international technical working group (ITWG). J Rad Nucl Chem 315 (2):425–434. doi: 10.1007/s10967-017-5680-5 [DOI] [Google Scholar]
- 6.Bé M-MC,V; Dulieu C; Mougeot X; Browne E; Chechev V; Kuzmenko N; Kondev F; Luca A; Galán M; Arinc A; Huang X (2010) Table of Radionuclides. BIPM Monographie, vol 5 Sévres [Google Scholar]
- 7.Chechev VP, Kuzmenko KN (2010) DDEP Evaluation of Pa-233. Table of Radionuclides [Google Scholar]
- 8.Luca AE,M; Morel J (2000) Emission probabilities of the main g-rays of 237Np in equilibrium with 233Pa. Appl Rad Isot 52:481–486 [DOI] [PubMed] [Google Scholar]
- 9.DeVries D, Griffin H (2008) X- and gamma-ray emissions observed in the decay of 237Np and 233Pa. Appl Radiat Isot 66 (5):668–675. doi: 10.1016/j.apradiso.2007.07.019 [DOI] [PubMed] [Google Scholar]
- 10.Kondev FG, Ahmad I, Greene JP, Nichols AL, Kellett MA (2011) Measurements of absolute gammaray emission probabilities in the decay of 233Pa. Nuclear Instruments and Methods in Physics Research Section A: Accelerators, Spectrometers, Detectors and Associated Equipment 652 (1):654–656. doi: 10.1016/j.nima.2011.01.147 [DOI] [Google Scholar]
- 11.Schötzig US,E; Janszen H Standardisation and photon emission probabilities in the decay of 237Np/233Pa. Appl Rad Isot 52:883–889 [DOI] [PubMed] [Google Scholar]
- 12.Shchukin G, Iakovlev K, Morel J (2004) Analysis of the 237Np-233Pa photon spectrum using the full response function method. Appl Radiat Isot 60 (2–4):239–246. doi: 10.1016/j.apradiso.2003.11.024 [DOI] [PubMed] [Google Scholar]
- 13.Vaninbroukx RB,G;Denecke B (1984) Determination of Photon-Emission Probabilities in the Decay of 237Np and its Duaghter 233Pa. International Journal of Applied Radiation and Isotopes 9:905–906 [Google Scholar]
- 14.Xiaolong H, Ping L, Baosong W (2005) Evaluation of 233Pa decay data. Appl Radiat Isot 62 (5):797–804. doi: 10.1016/j.apradiso.2004.11.005 [DOI] [PubMed] [Google Scholar]
- 15.Woods MJW,DH;Woods SA; et al. (2002) Standardization and decay data of 237Np. Appl Rad Isot 56:415–420 [DOI] [PubMed] [Google Scholar]
- 16.Woods SAW,DH;de Lavison P; Jerome SM;Makepeace JL;Woods MJ; Husband LJ; Lineham S (2000) Standardisation and measurement of the decay scheme data of 237Np. Appl Rad Isot 52:475–479 [DOI] [PubMed] [Google Scholar]
- 17.Harada H, Nakamura S, Ohta M, Fujii T, Yamana H (2006) Emission Probabilities of Gamma Rays from the Decay of233Pa and238Np, and the Thermal Neutron Capture Cross Section of237Np. Journal of Nuclear Science and Technology 43 (11):1289–1297. doi: 10.1080/18811248.2006.9711223 [DOI] [Google Scholar]
- 18.Singh B, Tuli JK (2005) Nuclear Data Sheets for A = 233. Nuclear Data Sheets 109 [Google Scholar]
- 19.NIST Ampoule Specifications and Opening Procedure. NIST PML Radiation Physics Division. https://www.nist.gov/pml/radiation-physics/ampoule-specifications-and-opening-procedure. 2018
- 20.Fitzgerald R (2016) Monte Carlo based approach to the LS–NaI 4πβ–γ anticoincidence extrapolation and uncertainty. Appl Rad Isot 109:308–313. doi: 10.1016/j.apradiso.2015.11.107 [DOI] [PMC free article] [PubMed] [Google Scholar]
- 21.Lucas LL (1998) Calibration of hte Massic Activity of a Solution of 99Tc. Appl Rad Isot 49 (911):1061–1064 [Google Scholar]
- 22.Baerg AP (1981) Multiple Channel 4pb-g anti-coincidence counting. Nuclear Instruments and Methods 190:345–349 [Google Scholar]
- 23.Agostinelli S, Allison J, Amako K, Apostolakis J, Araujo H, Arce P, Asai M, Axen D, Banerjee S, Barrand G, Behner F, Bellagamba L, Boudreau J, Broglia L, Brunengo A, Burkhardt H, Chauvie S, Chuma J, Chytracek R, Cooperman G, Cosmo G, Degtyarenko P, Dell’Acqua A, Depaola G, Dietrich D, Enami R, Feliciello A, Ferguson C, Fesefeldt H, Folger G, Foppiano F, Forti A, Garelli S, Giani S, Giannitrapani R, Gibin D, Gómez Cadenas JJ, González I, Gracia Abril G, Greeniaus G, Greiner W, Grichine V, Grossheim A, Guatelli S, Gumplinger P, Hamatsu R, Hashimoto K, Hasui H, Heikkinen A, Howard A, Ivanchenko V, Johnson A, Jones FW, Kallenbach J, Kanaya N, Kawabata M, Kawabata Y, Kawaguti M, Kelner S, Kent P, Kimura A, Kodama T, Kokoulin R, Kossov M, Kurashige H, Lamanna E, Lampén T, Lara V, Lefebure V, Lei F, Liendl M, Lockman W, Longo F, Magni S, Maire M, Medernach E, Minamimoto K, Mora de Freitas P, Morita Y, Murakami K, Nagamatu M, Nartallo R, Nieminen P, Nishimura T, Ohtsubo K, Okamura M, O’Neale S, Oohata Y, Paech K, Perl J, Pfeiffer A, Pia MG, Ranjard F, Rybin A, Sadilov S, Di Salvo E, Santin G, Sasaki T, Savvas N, Sawada Y, Scherer S, Sei S, Sirotenko V, Smith D, Starkov N, Stoecker H, Sulkimo J, Takahata M, Tanaka S, Tcherniaev E, Safai Tehrani E, Tropeano M, Truscott P, Uno H, Urban L, Urban P, Verderi M, Walkden A, Wander W, Weber H, Wellisch JP, Wenaus T, Williams DC, Wright D, Yamada T, Yoshida H, Zschiesche D (2003) Geant4—a simulation toolkit. Nuclear Instruments and Methods in Physics Research Section A: Accelerators, Spectrometers, Detectors and Associated Equipment 506 (3):250–303. doi: 10.1016/s01689002(03)01368-8 [DOI] [Google Scholar]
- 24.Pibida L, Hsieh E, Fuentes-Figueroa A, Hammond MM, Karam L (2006) Software studies for germanium detectors data analysis. Appl Radiat Isot 64 (10–11):1313–1318. doi: 10.1016/j.apradiso.2006.02.076 [DOI] [PubMed] [Google Scholar]
- 25.Taylor BN, Kuyatt CE (1994) Guidelines for Evaluating and Expressing the Uncertainty of NIST Measurement Results. NIST TN 1297 [Google Scholar]
- 26.BIPM, IEC, BIPM, ILAC, ISO, IUPAC, IUPAP, OIML (2008) Evaluation of measurement data Guide to the expression of uncertainty in measurement. JCGM [Google Scholar]


