

Abstract
Pyridoxal 5′‐phosphate (PLP)‐dependent β‐transaminases (βTAs) reversibly catalyze transamination reactions by recognizing amino groups linked to the β‐carbon atoms of their substrates. Although several βTA structures have been determined as holo forms containing PLP, little is known about the effect of PLP on the conversion of the apo structure to the holo structure. We determined the crystal structure of the apo form of a βTA from Mesorhizobium sp. strain LUK at 2.2 Å resolution to elucidate how PLP affects the βTA structure. The structure revealed three major disordered regions near the active site. Structural comparison with the holo form also showed that the disordered regions in the apo form are ordered and partially adopt secondary structures in the holo form. These findings suggest that PLP incorporation into the active site contributes to the structural stability of the active site architecture, thereby forming the complete active site. Our results provide novel structural insights into the role of PLP in terms of active site formation.
Keywords: pyridoxal 5′‐phosphate, β‐transaminase, apo form, Mesorhizobium sp. strain LUK, disorder‐to‐order transition
Short abstract
PDB Code(s): 6IZ9
Introduction
β‐Transaminases (βTAs) recognize amino groups linked to the β‐carbon atoms of amino acids and primary amines devoid of the carboxylic acid group as substrates. They reversibly catalyze the transamination reaction by utilizing amino group donors and acceptors. Via one pathway of the reversible reaction, βTAs are able to produce β‐amino acids, which have gained much attention on account of their industrial value in the field of pharmaceutics.1 β‐Amino acids constitute essential building blocks for antibiotics2, 3, 4 and pesticides.5, 6, 7, 8 Among the plethora of TAs, including βTAs, a βTA from the soil bacterium Mesorhizobium sp. strain LUK (Ms‐βTA) possesses high enzymatic activities for aromatic and aliphatic β‐amino acids.9 Accordingly, biochemical and structural studies on Ms‐βTA are indispensable not only for understanding its catalytic mechanism but also for applications in protein engineering for improving its activity.
Similar to other TAs, Ms‐βTA is a pyridoxal 5′‐phosphate (PLP)‐dependent enzyme.9 As a cofactor, PLP plays a vital role in the catalytic reaction of TAs.10 In the “resting period” of the catalytic cycle, PLP is covalently linked to the ε‐amino group of a Lys residue in the active site. The substitution of an amino group from a primary substrate for the ε‐amino group results in the conversion to pyridoxamine phosphate, the amino group of which is transferred to a secondary substrate such as pyruvate or 2‐oxoglutarate. As such, PLP serves as a pivotal molecule directly associated with the catalytic reaction by mediating the amino group transfer between the amino group donor and acceptor.
Kim et al. first reported the ability of Ms‐βTA to catalyze the transamination reaction of (S)‐3‐amino‐3‐phenylpropionic acid.11 Subsequently, Ms‐βTA was shown to be utilized for the asymmetric synthesis of optically pure β‐amino acids.9 Along with these biochemical studies, several structures of Ms‐βTA have also been reported.12 They include the PLP‐bound structure (PDB ID: 2YKU) and the complex forms with the substrates (S)‐β‐Phe (PDB ID: 2YKY), (R)‐3‐amino‐5‐methylhexanoic acid (PDB ID: 4AO4), and 2‐oxoglutarate (PDB ID: 2YKX) and the inhibitor 2‐aminooxyacetic acid (PDB ID: 2YKV). These structures elucidated how Ms‐βTA recognizes its substrates and possesses (S)‐enantioselectivity toward the substrates. All these structures are the holo forms of Ms‐βTA (hMs‐βTAs), which contain PLP molecules.
However, the apo form of Ms‐βTA (aMs‐βTA) has not been reported until now, which has withheld comparative studies between the aMs‐βTA and hMs‐βTA structures thus far. The structure of aMs‐βTA can provide information on the effect of PLP on the overall architecture or local regions of Ms‐βTA. Some studies have discussed the structural differences between the respective apo and holo forms of the PLP‐dependent ω‐TA from Vibrio fluvialis JS1713 and ω‐TA from Chromobacterium violaceum.14 However, studies on the structural comparison between the apo form and holo form with regard to PLP‐dependent TAs have been insufficient. Therefore, in this study, we determined the crystal structure of aMs‐βTA at 2.2 Å resolution and performed a structural comparison between aMs‐βTA and hMs‐βTA.
Results and Discussion
Overall structure of aMs‐βTA
The structure of Ms‐βTA was determined in the apo form at 2.2 Å resolution. The X‐ray diffraction data collection and refinement statistics are presented in Table 1. Although we did not intend to prepare the apo form ab initio, we were able to determine the crystal structure as the apo form. Considering that the protein solution was colored yellow immediately after the size‐exclusion chromatography (SEC) purification but the resulting crystal was colorless, it is assumed that PLP bound to the enzyme was spontaneously dissociated and diffused into the buffer in the crystallization step. The chemical composition or concentration of the buffer may have accelerated the diffusion rate of PLP.
Table 1.
Data Collection and Refinement Statistics for aMs‐βTA
| Data collection | |
| Resolution range (Å)a | 50.00–2.20 (2.24–2.20) |
| Total reflections | 217,333 |
| Unique reflectionsa | 37,878 (1906) |
| Multiplicitya | 5.7 (5.7) |
| Completeness (%)a | 100 (100) |
| Mean I/σ(I)a | 21.5 (4.7) |
| R merge (%)a , b | 14.4 (51.7) |
| Wilson B‐factor (Å)b | 22.6 |
| Space group | P31 |
| Unit cell parameters a, b, and c (Å) | 62.4, 62.4, and 171.0 |
| Refinement | |
| Resolution range (Å) | 39.22–2.20 |
| Reflections | 37,831 |
| Reflections (test set) | 1860 |
| R work (%) | 24.0 |
| R free (%) | 28.9 |
| Number of molecules in the asymmetric unit | 2 |
| Number of protein atoms/water molecules | 5681/379 |
| Average B‐factor values of protein/water (Å)b | 28.7/28.5 |
| Ramachandran plot: favored/outliers (%) | 97.2/0.0 |
| Rotamer outliers (%) | 0.0 |
| RMSD bonds (Å)/angles (°) | 0.003/0.683 |
Values for the outermost resolution shell in parentheses.
R merge = Σh Σi |I(h)i − <I(h) > |/Σh Σi I(h)i, where I(h) is the observed intensity of reflection h and <I(h)> is the average intensity obtained from multiple measurements.
The crystal structure of Ms‐βTA revealed that it exists as a homodimer consisting of two subunits in the asymmetric unit [Fig. 1(A)]. In a previous study, native polyacrylamide gel electrophoresis (PAGE) analysis indicated Ms‐βTA to be in a dimeric form.9 However, information on the multimeric state in solution is required to accurately ascertain the functional unit of Ms‐βTA. Our SEC‐coupled multiangle light scattering (SEC‐MALS) analysis here confirmed that Ms‐βTA is a dimeric protein in solution (91 kDa). This result strongly suggests that Ms‐βTA plays a biological role in the cell as a dimer. To investigate structural differences between the two subunits, their Cα backbone structures were superimposed. The result showed that the root‐mean‐square deviation (RMSD) value over 400 Cα atoms of each subunit is 0.84 Å, which means that the two subunits are structurally almost identical to each other.
Figure 1.
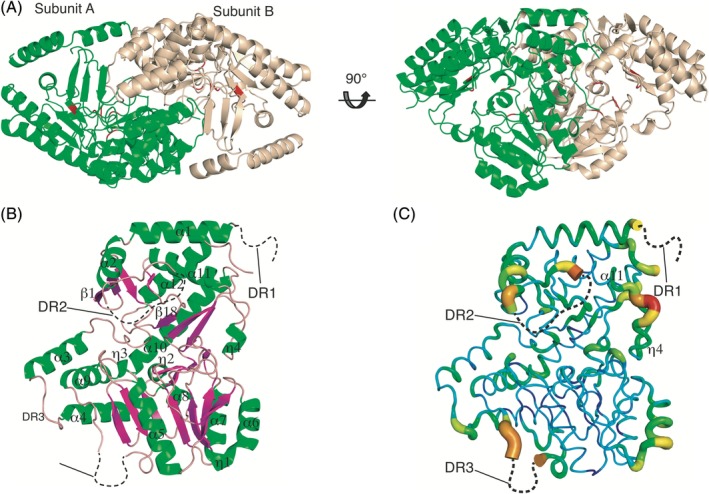
Crystal structure of aMs‐βTA. (A) Overall structure of aMs‐βTA. The dimeric structure is shown in a cartoon representation and viewed from two different directions. Subunits A and B are colored green and light yellow, respectively. Residues forming the active site are marked with red. (B) Subunit A structure of aMs‐βTA. Three disordered regions are depicted as black dashed curves. Secondary structures are labeled at the corresponding positions. Marks from β2 to β17 are omitted for clarity. (C) B‐factor distribution of aMs‐βTA. The structure is presented in a putty representation and rainbow colored from red to violet in B‐factor value order.
One subunit of aMs‐βTA is composed of 12 α‐helices (α1–α12), four 310‐helices (η1–η4), 18 β‐strands (β1–β18), and several loops, as shown in Figure 1(B). Intriguingly, we found that the crystal structure of aMs‐βTA has three major disordered regions: DR1 (residues 1–16), DR2 (residues 48–59), and DR3 (residues 300–311) [Fig. 1(B)]. In particular, DR2 and DR3 are assumed to affect the formation of the active site upon the binding of PLP in that DR2 and DR3 are located near the active site (as addressed in the next section in detail). The models of these regions could not be built owing to poor electron density. The presence of the disordered regions implies the necessity of an investigation into the overall atomic displacement distribution of the aMs‐βTA structure. Our B‐factor analysis revealed that the edges of DR2 and DR3, including the loop between η4 and α11, exhibited high B‐factor values, implying that these regions are intrinsically flexible [Fig. 1(C)].
Structural comparison between aMs‐βTA and hMs‐βTA
To investigate the structural differences between the apo and holo forms, the structure of aMs‐βTA was compared with that of hMs‐βTA (PDB ID: 2YKU). The superimposition result showed that their overall structures are similar to each other, exhibiting the RMSD value of 1.68 Å for 400 Cα atoms of each structure. However, we found that the three major DR regions in the apo form are structured in the holo form [Fig. 2(A)]. In the holo form, the N‐terminal region (DR1 in the apo form) is more extended, and the regions corresponding to DR2 and DR3 in the apo form are ordered and partly adopt secondary structures [Fig. 2(A)]. These findings imply that the binding of PLP to aMs‐βTA contributes to the structural stabilization of the corresponding regions (DR1–DR3).
Figure 2.
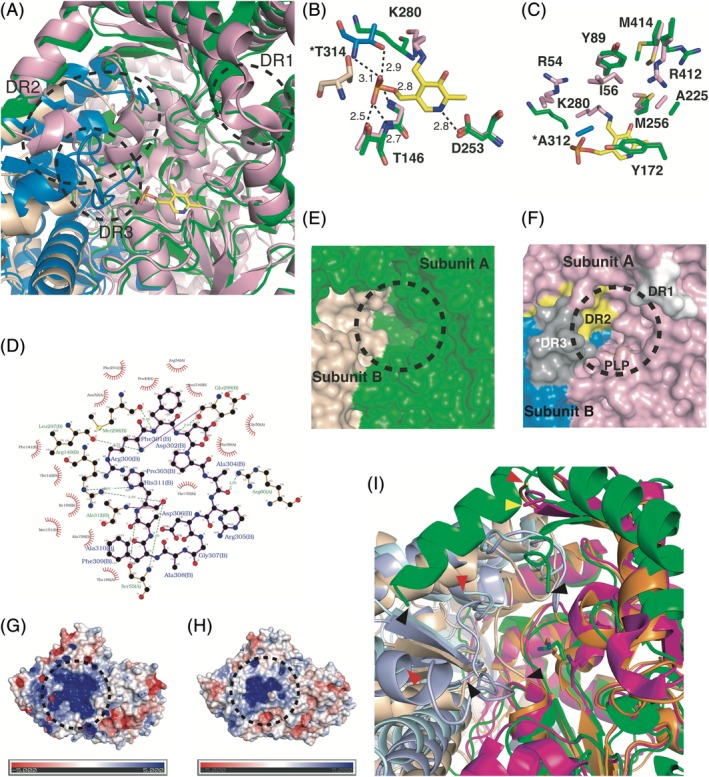
Structural comparison between the apo and holo forms of Ms‐βTA. (A) Structural comparison between aMs‐βTA and hMs‐βTA with a focus of the active site. The structure of hMs‐βTA is superimposed onto that of aMs‐βTA. Subunits A and B of aMs‐βTA are colored green and light yellow, respectively. Subunits A and B of hMs‐βTA are colored pink and marine, respectively. The PLP molecule in hMs‐βTA is shown in a stick representation. (B) PLP coordination to adjacent residues. The PLP molecule and its binding residues are depicted as sticks. The residues of aMs‐βTA (Subunit A) and hMs‐βTA (Subunit B) and the PLP molecule are colored green, pink, and yellow, respectively. The residues of aMs‐βTA (Subunit B) and hMs‐βTA (Subunit B) are colored light yellow and marine, respectively. The asterisk of T314 denotes a residue from the other subunit. (C) Active site residues. The display mode and color code are the same as that of panel (B). The asterisk of A312 denotes a residue from the other subunit. (D) Diagram for interactions between the two disordered regions. The DR3 residues from Subunit B interact with adjacent residues, including the DR2 residues from Subunit A. Surface representation of the active site of aMs‐βTA (E) and hMs‐βTA (F). The color code is the same as that of panel (A) except DR1–DR3. The black dashed circles denote the active site entrances. The DR1–DR3 regions in panel (F) corresponding to disordered regions in aMs‐βTA are structured in hMs‐βTA. The DR1 (Subunit A), DR2 (Subunit A), and DR3 (Subunit B) regions are colored white, yellow, and gray, respectively. The asterisk of DR3 indicates that it belongs to Subunit B. Surface electrostatic potential of aMs‐βTA (G) and hMs‐βTA (H). The respective surface electrostatic distributions are represented. The scale ranges from −5 kT/e (red) to 5 kT/e (blue). The black dashed circles indicate the active site entrances. (I) Structural comparison between three apo forms: Subunits A (green) and B (light yellow) of aMs‐βTA, Subunits A (magenta) and B (light blue) of aVf‐ωTA, and Subunits A (orange) and B (palecyan) of aCv‐ωTA. The key Lys residues are represented as sticks. The black, yellow, and red triangles indicate the edges of disordered regions of aMs‐βTA, aVf‐ωTA, and aCv‐ωTA, respectively.
In addition, we examined whether the structural deviations of residues in the vicinity of the PLP position occur between aMs‐βTA and hMs‐βTA. Remarkably, it was observed that the side chain of Lys280 as a key residue for catalysis significantly deviated from the PLP position in aMs‐βTA, whereas the side chain of Lys280 was covalently linked to the C4′ atom of PLP in hMs‐βTA [Fig. 2(B)]. The Thr146 and Asp253 residues forming hydrogen bonds with PLP in hMs‐βTA were spatially well‐conserved [Fig. 2(B)]. It is also noteworthy that the Thr314 residues from the other subunits exhibited somewhat different positions [Fig. 2(B)]. This spatial displacement of Thr314 in aMs‐βTA renders the formation of the hydrogen bonds with PLP difficult. The spatial differences of Lys280 and Thr314 suggest that they undergo structural adjustments upon PLP binding.
The residues that interact with substrates in hMs‐βTA are well‐known owing to earlier research.12 That study showed that the active site pocket is composed of Arg54, Ile56, Tyr89, Tyr172, Ala225, Met256, Arg412, and Met414 from one subunit and Ala312 from the other subunit. Structural comparison of the pocket‐forming residues between aMs‐βTA and hMs‐βTA revealed other structural differences between the two forms. Interestingly, we found that three residues, namely, Arg54, Ile56, and Ala312, are disordered in the apo form, indicating that aMs‐βTA does not form the active site completely [Fig. 2(C)]. Another notable feature concerning the formation of the active site pocket is that the DR2 region interacts with the DR3 region from the other subunit in the holo form. As shown in Figure 2(D), a series of residues corresponding to DR3 form hydrogen bonds and hydrophobic interactions with several residues in DR2 in the case of the holo form. Accordingly, the DR3 region along with DR2 constitutes an essential component comprising the active site by forming an “insertion loop” at the interface between the two subunits in the presence of PLP.
Effect of PLP on active site formation
The architectures in the proximity of the active site revealed distinct structural differences between the apo and holo forms. Although the active site of aMs‐βTA appears nebulous owing to the disordered regions [Fig. 2(E)], the active site of hMs‐βTA showed a well‐organized shape [Fig. 2(F)]. Notably, the formation of the active site is associated with all the DR1, DR2, and DR3 regions [Fig. 2(F)]. They constitute the active site funnel, sequentially from the top to the bottom. In particular, as stated earlier, the DR3 region from the other subunit is directly involved in the formation of the active site.
As mentioned earlier, the DR2 and DR3 regions mainly consist of loops, which adopt partial secondary structures. Disordered regions such as DR2 and DR3 probably retain a wave‐shaped free energy landscape without a separate minimum point, exhibiting diverse conformers. Upon PLP binding, appropriate conformers might be selected for the formation of the active site, adopting the minimum point of a funnel‐shaped free energy landscape. This scenario might explain the “disorder‐to‐order transition” phenomenon observed in the case of Ms‐βTA.
Surface electrostatic potential analysis provides another novel insight into the effect of PLP on the active site formation. As shown in Figure 2(G,H), the cavity of the active site comprises positively charged residues. These residues are dominantly distributed both in the apo and holo forms. Given that PLP and substrates such as pyruvate and 2‐oxoglutarate retain strong negative charges, such electrostatic distribution might play a significant role in the attraction of PLP and the substrates into the active site. In addition, the structuration of the entrance to the active site by PLP incorporation presumably renders the cavity more specific, thereby distinguishing its own substrates from other molecules. Considering the sequence regarding PLP and substrate binding, it is reasonable to assume that the entrance structure to the active site needs to be flexible for the PLP binding beforehand and exquisite for the substrate binding thereafter. Accordingly, it is inferred that the disorder‐to‐order transition by PLP insertion might be an evolutionary consequence for PLP‐dependent βTAs to comply with the sequence in terms of the acceptance of PLP and substrates.
Lastly, we compared our structure with hitherto known other apo structures of transaminases to investigate whether our results can be generalized to other apo forms. The apo forms of an ω‐transaminase from V. fluvialis JS17 (aVf‐ωTA; PDB ID 5ZTX) and an ω‐transaminase from C. violaceum (aCv‐ωTA; PDB ID 4A6U) were selected for structural comparison. The comparative analysis showed that the RMSD values for aVf‐ωTA and aCv‐ωTA are 3.5 Å and 3.7 Å, respectively. Although the overall structural comparison exhibited somewhat high deviations, the respective regions corresponding to DR2 and DR3 of aMs‐βTA showed a structural tendency to constitute disordered regions or have extremely high B‐factor values (aVf‐ωTA; the maximal value of 102 Å2 in the region corresponding to DR3), albeit partially ordered [Fig. 2(I)]. However, other factors such as crystal environment and structural features depending on organism species might affect the formation pattern of disordered regions.
Conclusion
In summary, we determined the apo structure of Ms‐βTA at 2.2 Å resolution and performed structural comparison between aMs‐βTA and hMs‐βTA. The aMs‐βTA structure revealed three major disordered regions at or near the interface between the two subunits. The structural comparison with the holo form showed that these disordered regions are ordered and structured in the holo form, constituting the active site architecture. On the basis of these structural analyses, we conclude that the binding of PLP to aMs‐βTA renders the disordered regions (DR1–DR3) ordered and stable, thereby generating the appropriate geometry for the active site. However, some questions on the PLP effect remain unsolved. Does the disorder‐to‐order transition by the PLP fixation occur concurrently or in a stepwise manner between the disordered regions? Is it possible that the structural stabilization accompanying PLP is applied to all PLP‐dependent enzymes? Further studies should address these issues. Nonetheless, our results here provide invaluable information on the effect of PLP on the structural stabilization of Ms‐βTA.
Materials and Methods
Overproduction and purification
Ms‐βTA as an apo form was produced and purified for crystallization as previously described15 with some modifications. Briefly, the expression vector for Ms‐βTA was constructed by inserting the polymerase chain reaction (PCR) gene product digested at the BamHI and HindIII restriction sites into a pET24a(+) vector. The plasmids encoding the gene were delivered into Escherichia coli BL21(DE3) expression cells for transformation. A single colony was selected and cultured in lysogeny broth medium containing 50 μg/mL kanamycin at 37°C overnight, after which the cells were transferred and cultured on a large scale. When the optical density value at 600 nm reached approximately 0.6 and 0.5 mM isopropyl β‐d‐1‐thiogalactopyranoside was added to the medium to induce the gene expression, and the cells were further cultured at 20°C overnight. The resulting cells were harvested by centrifugation, washed with buffer A (20 mM Tris‐HCl [pH 7.9], 500 mM NaCl, and 20 mM imidazole), flash‐frozen with liquid N2, and stored at −80°C until use.
For purification, the frozen cells were thawed, resuspended with buffer A supplemented with phenylmethanesulfonyl fluoride (a serine protease inhibitor; Sigma‐Aldrich), and disrupted by sonication on ice with six bursts of 30 s each, with a 1 min interval between each burst. The lysed cell suspension was centrifuged at 10,000g for 30 min at 4°C to remove the cell debris. The supernatant was mixed with nickel nitrilotriacetic acid resin solution (Qiagen) by gentle agitation at 4°C overnight. The resulting mixture was applied onto a gravity‐flow column pre‐equilibrated with buffer A. The column was washed with buffer B (20 mM Tris‐HCl [pH 7.9], 500 mM NaCl, and 60 mM imidazole) to remove unbound proteins. Then, buffer C (20 mM Tris‐HCl [pH 7.9], 500 mM NaCl, and 250 mM imidazole) was loaded onto the column to elute the bound protein. The resulting eluate was sequentially subjected to SEC. SEC purification was conducted using an ÄKTA explorer system (GE Healthcare) equipped with a Superdex 200 Increase 10/300 GL 24 mL column (GE Healthcare) pre‐equilibrated with buffer D (20 mM Tris‐HCl [pH 8.0] and 150 mM NaCl). Protein fractions were collected, concentrated to 7 mg/mL, flash‐frozen in liquid N2, and stored at −80°C until use. The purity of the protein was assessed by sodium dodecyl sulfate PAGE.
Crystallization and data collection
The initial conditions for crystallization were screened and applied as previously described. Briefly, 1 μL of protein solution was mixed with an equal volume of reservoir solution, and the droplet was allowed to equilibrate against 400 μL of the mother liquor using the hanging drop vapor diffusion method at 20°C. Crystals were initially obtained from a buffer condition comprising 0.3M sodium citrate tribasic dihydrate and 0.1M HEPES (pH 7.6). The crystallization condition was optimized and finally adjusted to a buffer composition of 0.3M sodium citrate tribasic dihydrate, 0.1M HEPES (pH 7.6), and 0.1M cadmium chloride hydrate. Diffraction‐quality crystals appeared in 2 days and grew to a maximum size of 0.1 × 0.4 × 0.1 mm. For X‐ray data collection, the crystals were soaked in the mother liquor supplemented with 30% (v/v) glycerol as a cryoprotectant solution, mounted, and flash‐cooled in a N2 stream at −178°C. X‐ray diffraction data for Ms‐βTA were collected at the Pohang Accelerator Laboratory 5C beamline (Pohang, Korea) at a wavelength of 0.98732 Å. The diffraction data were indexed, integrated, and scaled with the HKL2000 program.16
Structure determination and refinement
The initial phase of Ms‐βTA was determined by the molecular replacement method using Phaser‐MR17 in Phenix.18 The structure of glutamate‐1‐semialdehyde 2,1‐aminomutase from Thermus thermophilus (PDB ID: 2E7U) was used as a search model for phase determination. The initial model of Ms‐βTA was automatically built with AutoBuild19 in Phenix, and partial residues were manually built using Coot.20 Model refinement was iteratively performed using phenix.refine21 in Phenix and finished when R work and R free values reached 24.0% and 28.9%, respectively. The final model was validated using MolProbity,22 and its atomic coordinates and structure factors have been deposited in the Protein Data Bank (http://www.rcbs.org) under access code 6IZ9. All the structural figures in this article were generated using the programs Pymol23 and LigPlot+.24
SEC‐MALS analysis
The absolute molecular weight of Ms‐βTA in solution was measured by SEC‐MALS analysis. The protein solution filtered with a 0.2 μm syringe‐filter was applied to a Superdex 200 10/300 GL 24 mL column pre‐equilibrated with a buffer comprising 20 mM Tris‐HCl (pH 8.0) and 150 mM NaCl. The mobile phase buffer was flowed at a rate of 0.4 mL/min at room temperature. A DAWN‐treos MALS detector (Wyatt) was interconnected with an ÄKTA explorer system. The molecular weight of bovine serum albumin was used for a reference value. Data for absolute molecular weights were assessed using the ASTRA program.
Significance statement: The structural effect of pyridoxal 5′‐phosphate (PLP) as a cofactor on β‐transaminases (βTAs) has not been elucidated. In a βTA from Mesorhizobium sp. strain LUK, we found the apo structure to have three major disordered regions, which were ordered in the holo structure. Comparative analysis with the holo structure suggests that PLP plays a critical role in the formation of the active site by contributing to the stabilization of the disordered regions.
REFERENCES
- 1. Rudat J, Brucher BR, Syldatk C (2012) Transaminases for the synthesis of enantiopure beta‐amino acids. AMB Express 2:11. [DOI] [PMC free article] [PubMed] [Google Scholar]
- 2. Sugawara T, Tanaka A, Tanaka K, Nagai K, Suzuki K, Suzuki T (1998) YM‐170320, a novel lipopeptide antibiotic inducing morphological change of colonies in a mutant of Candida tropicalis pK233. J Antibiot (Tokyo) 51:435–438. [DOI] [PubMed] [Google Scholar]
- 3. Sathe M, Thavaselvam D, Srivastava AK, Kaushik MP (2008) Synthesis and antimalarial evaluation of cyclic beta‐amino acid‐containing dipeptides. Molecules 13:432–443. [DOI] [PMC free article] [PubMed] [Google Scholar]
- 4. Nurbo J, Peterson SD, Dahl G, Danielson UH, Karlén A, Sandström A (2008) Beta‐amino acid substitutions and structure‐based CoMFA modeling of hepatitis C virus NS3 protease inhibitors. Bioorg Med Chem 16:5590–5605. [DOI] [PubMed] [Google Scholar]
- 5. Miura K, Sawa T, Takeuchi T, Umezawa H (1986) Effects of enzyme‐inhibitors in inhibiting the growth and inducing the differentiation of human promyelocytic leukemia‐cells, HL‐60. J Antibiot (Tokyo) 39:734–735. [DOI] [PubMed] [Google Scholar]
- 6. Corbett TH, Valeriote FA, Demchik L, Lowichik N, Polin L, Panchapor C, Pugh S, White K, Kushner J, Rake J, Wentland M, Golakoti T, Hetzel C, Ogino J, Patterson G, Moore R (1997) Discovery of cryptophycin‐1 and BCN‐183577: examples of strategies and problems in the detection of antitumor activity in mice. Invest New Drugs 15:207–218. [DOI] [PubMed] [Google Scholar]
- 7. Suzuki K, yamaizumi M, Tateishi S, Monnal Y, Uyeda M (1999) Topostatin, a novel inhibitor of topoisomerases I and II produced by Thermomonospora alba strain no. 1520. III. Inhibitory properties. J Antibiot (Tokyo) 52:460–465. [DOI] [PubMed] [Google Scholar]
- 8. Nandy JP, Rakic B, Sarma BV, Babu N, Lefrance M, Enright GD, Leek DM, Daniel K, Sabourin LA, Arya P (2008) Benzofuran‐derived cyclic beta‐amino acid scaffold for building a diverse set of flavonoid‐like probes and the discovery of a cell motility inhibitor. Org Lett 10:1143–1146. [DOI] [PubMed] [Google Scholar]
- 9. Kim J, Kyung D, Yun H, Cho BK, Seo JH, Cha M, Kim BG (2007) Cloning and characterization of a novel β‐transaminase from Mesorhizobium sp. strain LUK: a new biocatalyst for the synthesis of enantiomerically pure β‐amino acids. Appl Environ Microbiol 73:1772–1782. [DOI] [PMC free article] [PubMed] [Google Scholar]
- 10. Bezsudnova EY, Boyko KM, Popov VO (2017) Properties of bacterial and archaeal branched‐chain amino acid aminotransferases. Biochemistry (Mosc) 82:1572–1591. [DOI] [PubMed] [Google Scholar]
- 11. Kim J, Kyung D, Yun H, Cho BK, Kim BG (2006) Screening and purification of a novel transaminase catalyzing the transamination of aryl β‐amino acid from Mesorhizobium sp. LUK. J Microbiol Biotechnol 16:1832–1836. [Google Scholar]
- 12. Wybenga GG, Crismaru CG, Janssen DB, Dijkstra BW (2012) Structural determinants of the β‐selectivity of a bacterial aminotransferase. J Biol Chem 287:28495–28502. [DOI] [PMC free article] [PubMed] [Google Scholar]
- 13. Shin YC, Yun H, Park HH (2018) Structural dynamics of the transaminase active site revealed by the crystal structure of a co‐factor free omega‐transaminase from Vibrio fluvialis JS17. Sci Rep 8:11454. [DOI] [PMC free article] [PubMed] [Google Scholar]
- 14. Humble MS, Cassimjee KE, Håkansson M, Kimbung YR, Walse B, Abedi V, Federsel HJ, Berglund P, Logan DT (2012) Crystal structures of the Chromobacterium violaceum ω‐transaminase reveal major structural rearrangements upon binding of coenzyme PLP. FEBS J 279:779–792. [DOI] [PubMed] [Google Scholar]
- 15. Kim B, Park OK, Bae JY, Jang TH, Yoon JH, Do KH, Kim BG, Yun H, Park HH (2011) Crystallization and preliminary X‐ray crystallographic studies of β‐transaminase from Mesorhizobium sp. strain LUK. Acta Crystallogr Sect F Struct Biol Cryst Commun 67:231–233. [DOI] [PMC free article] [PubMed] [Google Scholar]
- 16. Otwinowski Z, Minor W (1997) Processing of X‐ray diffraction data collected in oscillation mode. Methods Enzymol 276:307–326. [DOI] [PubMed] [Google Scholar]
- 17. McCoy AJ, Grosse‐Kunstleve RW, Adams PD, Winn MD, Storoni LC, Read RJ (2007) Phaser crystallographic software. J Appl Cryst 40:658–674. [DOI] [PMC free article] [PubMed] [Google Scholar]
- 18. Adams PD, Afonine PV, Bunkóczi G, Chen VB, Davis IW, Echols JJ, Headd LW, Hung LW, Kapral GL, Grosse‐Kunstleve RW, McCoy AJ, Moriarty NW, Oeffner R, Read RJ, Richardson DC, Richardson JS, Terwilliger TC, Zwart PH (2010) PHENIX: a comprehensive python‐based system for macromolecular structure solution. Acta Crystallogr D Biol Crystallogr 66:213–221. [DOI] [PMC free article] [PubMed] [Google Scholar]
- 19. Terwilliger TC, Grosse‐Kunstleve RW, Afonine PV, Moriarty NW, Zwart PH, Hung LW, Read RJ, Adams PD (2008) Iterative model building, structure refinement and density modification with the PHENIX AutoBuild wizard. Acta Crystallogr D Biol Crystallogr 64:61–69. [DOI] [PMC free article] [PubMed] [Google Scholar]
- 20. Emsley P, Cowtan K (2004) Coot: model‐building tools for molecular graphics. Acta Crystallogr D Biol Crystallogr 60:2126–2132. [DOI] [PubMed] [Google Scholar]
- 21. Afonine PV, Grosse‐Kunstleve RW, Echols N, Headd JJ, Moriarty NW, Mustyakimov M, Terwilliger TC, Urzhumtsev A, Zwart PH, Adams PD (2012) Towards automated crystallographic structure refinement with phenix.refine. Acta Crystallogr D Biol Crystallogr 68:352–367. [DOI] [PMC free article] [PubMed] [Google Scholar]
- 22. Chen VB, Arendall WB, Headd JJ, Keedy DA, Immormino RM, Kapral GJ, Murray LW, Richardson JS, Richardson DC (2010) MolProbity: all‐atom structure validation for macromolecular crystallography. Acta Crystallogr D Biol Crystallogr 66:12–21. [DOI] [PMC free article] [PubMed] [Google Scholar]
- 23. DeLano WL. The PyMOL molecular graphics system. SanCarlos, CA: DeLano Scientific, 2002. [Google Scholar]
- 24. Laskowski RA, Swindells MB (2011) LigPlot+: multiple ligand‐protein interaction diagrams for drug discovery. J Chem Inf Model 51:2778–2786. [DOI] [PubMed] [Google Scholar]