Abstract
Purpose:
To investigate the binding potential of newly developed Annexin V-conjugated ultrasmall superparamagnetic iron oxide (V-USPIO) for detection of drug-induced apoptosis in vitro and in vivo.
Methods:
Apoptotic cells induced by camptothecin were incubated with or without Annexin V-USPIO at a concentration of 0.089 mmol Fe/L in vitro. T2 values of the two cell suspensions were measured by 0.47T nuclear magnetic resonance (NMR) spectrometer. Tumor-bearing mice were subjected to 1.5T MR scanner at 2 h after intraperitoneal injection of etoposide and cyclophosphamide. Following the pre-contrast T1- and T2-weighted imaging (0 h), the post-contrast scan was performed at 2, 4, 6 and 24 h after intravenous injection of Annexin V-USPIO (100 μmol Fe/kg). As a control, MRI was also obtained at 4 h after injection of USPIO without Annexin V. The ratio of tumor signal intensity (SI) on post-MRI for that on pre-MRI (Post/Pre-SI ratio) was calculated. After scanning, tumors were resected for pathological analysis to evaluate the distribution of iron and apoptotic cells.
Results:
The suspension of apoptotic cells incubated with Annexin V-USPIO showed shorter T2 value than that without it. On T1-weighted imaging post/pre-SI ratio at 4 h after injection of Annexin V-USPIO showed 1.46, while after injection of USPIO without Annexin V was 1.17. The similar distribution of iron and apoptotic cells was observed in concordance with high signal intensity area on post-T1-weighted imaging.
Conclusion:
A newly developed Annexin V-USPIO could have the potential for detection of drug-induced apoptosis.
Keywords: Annexin V-conjugated, ultrasmall superparamagnetic iron oxide, apoptosis, chemotherapy, magnetic resonance imaging
Introduction
Apoptosis is associated with various pathological disorders including cancer, autoimmunity, and neurodegenerative diseases.1 It is of great clinical value to detect apoptotic changes non-invasively. Especially, early detection of treatment-induced apoptosis in malignant tumors contributes to the decision of therapeutic strategy.
Phosphatidylserine (PS) on the cell membrane is a marker of apoptotic cells and is bound by Annexin V.2 Therefore, apoptotic cells can be detected with an Annexin V-conjugated probe. Several researchers have investigated the detection of diseased tissue, for example, with radioactively labeled Annexin V.3–6
Ultrasmall superparamagnetic iron oxide (USPIO) has been used as a contrast agent for molecular MRI. Generally, USPIO-based contrast agents have higher T1- and T2- relaxivities than gadolinium (Gd)-based agents,7,8 which suggest appropriate properties as probes on MRI. In addition, they have no concern of radiation exposure and can be used in cases with renal dysfunction.9
Herein, we developed a new MR contrast agent, that is, Annexin V-conjugated USPIO (V-USPIO) for the detection of apoptosis. The purpose of this study was to investigate the binding potential of Annexin V-USPIO to apoptotic cells in vitro and in vivo.
Materials and Methods
Contrast agent
Annexin V binding carboxymethyl diethylaminoethyl dextran magnetite (CMEADM) USPIO particle (Annexin V-USPIO, Meito Sangyo Co., Ltd., Aichi, Japan) were newly developed for this study (Fig. 1). Annexin V was prepared by a commercial protein expression kit (pET systems, Merck KGaA, Darmstadt, Germany) and complementary DNA (cDNA) for Annexin V (National Institute of Technology and Evaluation, Biotechnology Center, Tokyo, Japan). The crude Annexin V was purified on nickel-nitrilotriacetic acid (Ni-NTA) agarose affinity columns (QIAGEN, Hiden, Germany). CMEADM USPIO was synthesized according to a method described in US Patent 6165378, and chosen smaller size particles (<20 nm) for this study. Annexin V and CMEADM USPIO were bound with amide bond using EDC/HCl (Chemical Dojin Co., Ltd, Kumamoto, Japan) and N-hydroxysuccinimide (NHS; Wako FUJIFILM Wako Pure Chemical Corporation, Osaka, Japan) in water solution according to the following method:
Fig. 1.
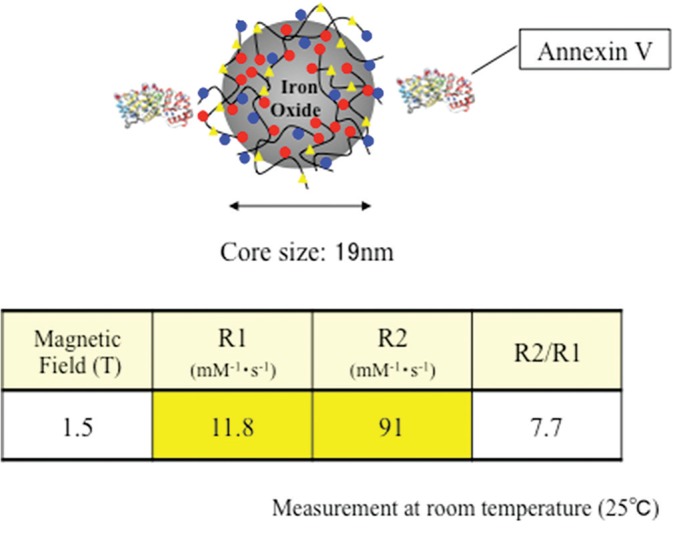
Characteristics of Annexin V-conjugated ultrasmall superparamagnetic iron oxide (V-USPIO).
About 0.15 mg of NHS and 0.15 mg of EDC/HCl were added, respectively to 0.24 mL of CMEADM USPIO solution (conc. 25 mg Fe/mL). The mixture was reacted at 40°C in 30 min to form NHS-ester. Then, 3.1 mL of Annexin V in water solution (conc. 7.6 mg/mL) was added to the mixture and incubated at 40°C in 5 h. After the incubation, the mixture was purified by ultrafiltration cartridge (VIVASPIN 20 MWCO:100000, Sartorius Stedim, Surrey, UK) with 0.01 M tetraborate buffer pH 8.0 to remove the remaining reagents and unbound Annexin V. Finally, Annexin V-CMEADM conjugation was prepared as conc. 3.0 mg Fe/mL solution.
The hydrodynamic core size was 19 nm (Zetasizer Nano ZS, Malvern, UK) and one or two Annexin V bond per particle. The number of Annexin V was calculated from each mole ratio that Annexin V was 0.143 μmol/mL and CMEADM USPIO was 0.093 μmol/mL in that solution (= 1.5:1). The content of Annexin V was measured by BCA protein assay kit (Pierce #23227, Thermo Fisher Scientific, Waltham, MA USA) and CMEADM USPIO was determined by spinel-type crystal theory. According to this theory, 574 of Fe atom is contained in the magnetite particle with a diameter of 3 nm. Therefore, the molecular weight of the magnetite particle is ca.32100 and the mole amount of CMEADM USPIO in that solution was calculated.
The contrast had T1 and T2 relaxivities of 11.8/mM/s (R1) and 91/mM/sec (R2) at 1.5T, respectively. Several phantoms including water with or without different concentrations of Annexin V-USPIO (0–1 mmol Fe/L) were scanned with a 1.5T commercial MR scanner using spin echo sequence with variable repetition and echo times. The signal intensity of each phantom was measured, and T1 and T2 values of each contrast concentration were calculated by fitting. R1 and R2 were estimated by plotting inverse numbers of T1 and T2 values and contrast concentrations.
In vitro binding assay
Jurkat cells were incubated with 15 μM camptothecin (Camptothecin, FUJIFILM Wako Pure Chemical Industries Ltd.,) for 6 h to induce apoptosis. After washing them with phosphate buffered saline twice, apoptotic cells (5 × 10⁷ cells/ml) were suspended with 1 × binding buffer (10 × binding buffer: 50 mM CaCl2, 100 mM 4-(2-hydroxyethyl)-1-piperazineethanesulfonic acid (HEPES), 1.4 M NaCl, pH7.4) and incubated with Annexin V-USPIO at a concentration of 0.089 mmol Fe/L for 60 min. Subsequently, free Annexin V-USPIO was removed by centrifuge (4°C, 210 × g, 5 min), and only Annexin V-USPIO binding apoptotic cells were extracted. After washing them with 1 × binding buffer twice, the extracted cells were suspended with 0.6 mL of 1 × binding buffer. T2 relaxation of the cell suspension was measured by 0.47T nuclear magnetic resonance (NMR) spectrometer (Minispec mq20, Bruker, Billerica, MA, USA). T2 relaxation was also measured as control when no incubation with Annexin V-USPIO was performed.
Apoptosis model in vivo
The ethical committee on animal research at our institution approved this study. Six female C57BL/6 mice, which were seven weeks old, were prepared for in vivo study. EL-4 cells (2 × 10⁶) were injected subcutaneously in their flank (Charles River Laboratories Japan, Inc., Kanagawa, Japan). At 2 weeks after implantation of EL-4 cells (Fig. 2), tumor-bearing mice received an intraperitoneal injection of both etoposide (67 mg/kg) (Etoposide Intravenous Infusion 100 mg, SANDOZ, SANDOS K.K., Tokyo, Japan) and cyclophosphamide monohydrate (100 mg/kg) (Endoxan, Shionogi & Co., Ltd., Osaka, Japan).10 Subsequently, Annexin V-USPIO (100 μmol Fe/kg) was intravenously injected after administration of anti-tumor drugs. The interval between administration of anti-tumor drugs and Annexin V-USPIO was 2 h.
Fig. 2.
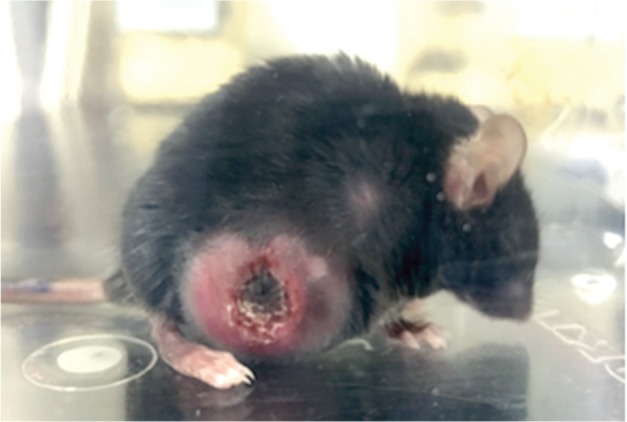
A tumor-bearing C57BL/6 mouse in which EL-4 cells were injected subcutaneously in its flank 2 weeks ago.
Magnetic resonance imaging
At first, pre-MRI was scanned before Annexin V-USPIO injection at 1.5T animal imager (MR VivoL VA, DS Pharma Biomedical Co., Ltd., Osaka, Japan). Post- MRI was obtained at 2, 4, 6, and 24 h after intravenous injection of Annexin V-USPIO. As a control, post-MRI, in addition to pre-MRI, was also obtained at 4 h after injection of USPIO without Annexin V at a dose of 100 μmol Fe/kg. The scan range included the greatest tumor dimension. Mice were sacrificed after post-MRI, and the tumors were surgically removed. The tumor of another mouse was removed at 6 h after injection of anti-tumor drugs without administration of USPIO. The experimental time schedule was summarized in Table 1. Cases 5 and 6 were additionally set up based on the results of Cases 1–4.
Table 1.
Summary of experimental time schedule
| Case | Interval (hours) | Interval (hours) | |||
|---|---|---|---|---|---|
| 1 | 2 | Pre-MRI Injection of Annexin V-USPIO | 2 | Post-MRI Resection of tumors | |
| 2 | 2 | 4 | |||
| 3 | Injection of anti-tumor drugs | 2 | 6 | ||
| 4 | 2 | 24 | |||
| 5 | 2 | Pre-MRI Injection of USPIO | 4 | ||
| 6 | Injection of anti-tumor drugs | 6 | Resection of tumors |
As a control, ultrasmall superparamagnetic iron oxide (USPIO) without Annexin V was injected in Case 5.
Imaging parameters are shown as follows: (T1WI) gradient echo sequence, TR/TE = 130/2.5 ms, flip angle 90°, number of acquisition 10, acquisition time 2 min 44 s, FOV 35 mm, slice thickness 1 mm, 5 slices, matrix 128 × 128, (T2WI) fast spin echo sequence, TR/TE = 4000/60 ms, echo train length 16, number of acquisition 5, acquisition time 2 min 51 s, FOV 35 mm, slice thickness 1 mm, 5 slices, matrix 128 × 128.
Image analysis
Signal intensities (SIs) of tumors on pre- and post-MRI were measured on 1.5T MR animal imager in a consensus fashion by two observers (N.K. and S.Y.). As large round or oval ROI as possible was placed in a tumor and a phantom (water) on each of 5 slices scanned (Fig. 3). Tumor SI was normalized with SI of a phantom. An average value of 5 normalized tumor SIs was used for evaluation. The ratio of normalized tumor SI on post-MRI for that on pre-MRI (post/pre SI ratio) was calculated.
Fig. 3.
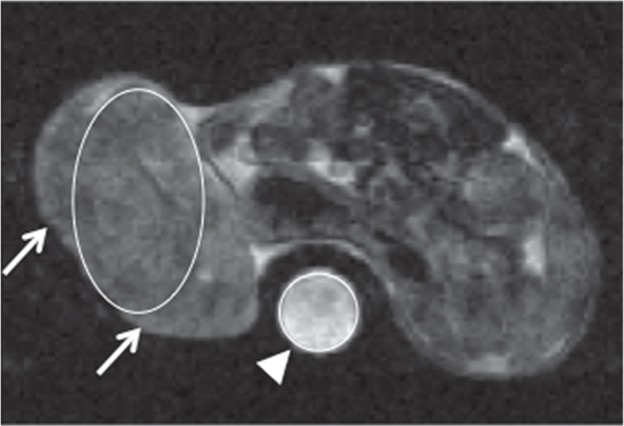
T2-weighted Pre-MRI at 2 h after treatment with anti-tumor drugs. For signal intensity (SI) measurement on pre- and post-MRI, as large round or oval ROI as possible was placed in a tumor (arrows) and a phantom (water) (arrowhead) on each of 5 slices scanned. Tumor SI was normalized with SI of a phantom. An average value of 5 normalized tumor SIs was used for evaluation.
Assessment of tumor reduction
The short and long diameters of each tumor were manually measured with calipers at the times of anti-tumor drug injection and post-MRI (C.T.). The tumor volume was estimated with the following formula: Tumor volume (mm3) = [short diameter (mm)]2 × [long diameter (mm)] /2.11 Tumor volume change ratio (%) was defined as tumor volume at post-MRI/tumor volume at anti-tumor drug injection × 100.
Pathological assessment
The resected tumors were sliced with the same direction with MRI. In all mice, the entire area of the cut surface containing the greatest tumor dimension was submitted for the pathological assessment. These specimens were fixed in 10% formalin neutral buffer solution, embedded in paraffin, cut into 4-μm sections, and stained with hematoxylin-eosin. They were also stained by TdT-mediated dUTP nick end labeling (TUNEL) for detection of apoptotic cells and by Perls DAB for detection of iron. An area of positive cells for apoptotic cells or iron was automatically measured by software WinROOF (Mitani cooperation, Fukui, Japan). A percentage of this area to an area of the whole tumor was calculated. We named as TUNEL (%) and Perls DAB (%), respectively. A percentage of a necrotic area to an area of the whole tumor in hematoxylin-eosin staining, named as Necrosis (%), was also obtained. A necrotic area was calculated by encircling a ROI by visual inspection on software WinROOF. Finally, careful pathological assessment focusing on the distribution of apoptotic cells and iron was performed (A.N. and O.T.).
Results
In vitro binding assay
T2 relaxation time of the suspension containing apoptotic cells treated with Annexin V-USPIO was 286 ms, while that of control was 620 ms.
Apoptosis model in vivo
The image and pathological data were summarized in Table 2.
Table 2.
Summary of image analysis and pathological assessment
| Case | Pre tumor volume (cm3) | Post tumor volume (cm3) | Tumor volume change ratio (%) | Pre SI on T1WI | Post SI on T1WI | Post/Pre SI ratio on T1WI | Pre SI on T2WI | Post SI on T2WI | Post/Pre SI ratio on T2WI | Perls DAB (%) | TUNEL (%) | Necrosis (%) |
|---|---|---|---|---|---|---|---|---|---|---|---|---|
| 1 | 3.48 | 2.77 | 79.8 | 2.42 | 2.30 | 0.95 | 0.46 | 0.41 | 0.90 | 3.6 | 0.1 | 12.6 |
| 2 | 3.54 | 3.50 | 98.9 | 1.90 | 2.77 | 1.46 | 0.49 | 0.47 | 0.97 | 7.7 | 0.6 | 13.9 |
| 3 | 3.81 | 3.18 | 83.5 | 2.10 | 2.38 | 1.13 | 0.48 | 0.48 | 0.99 | 4.2 | 0.8 | 18.0 |
| 4 | 4.62 | 2.90 | 62.7 | 2.09 | 2.62 | 1.25 | 0.47 | 0.43 | 0.91 | 23.7 | 0.1 | 44.5 |
| 5 | – | – | – | 2.04 | 2.40 | 1.17 | 0.50 | 0.47 | 0.94 | 2.1 | 1.0 | 28.1 |
| 6 | – | – | – | – | – | – | – | – | – | 4.4 | 0.1 | 18.3 |
Tumor volume change ratio (%) was defined as tumor volume at post MRI/tumor volume at anti-tumor drug injection ×100. Perls DAB (%) and TdT-mediated dUTP nick end labeling (TUNEL) (%) represent percentages of positive-cell area to an area of the whole tumor in each immunohistochemical staining. Necrosis (%) was defined as a percentage of a necrotic area to an area of the whole tumor in hematoxylin-eosin staining. SI, signal intensity.
Tumor volume change ratio, which was measured in cases 1–4, ranged from 62.7% to 98.9%.
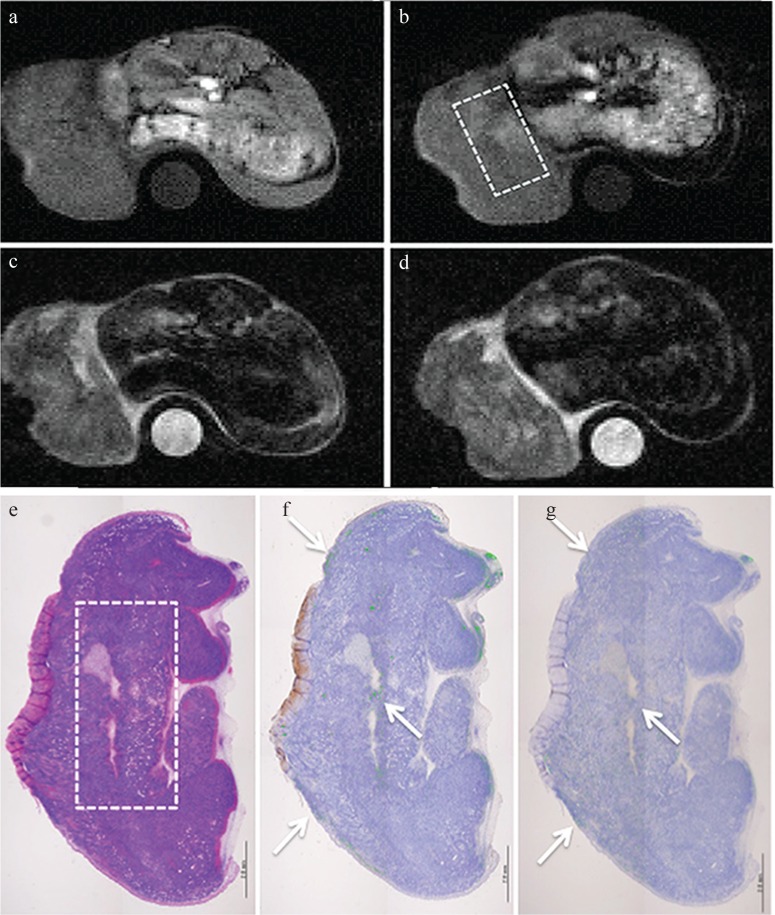
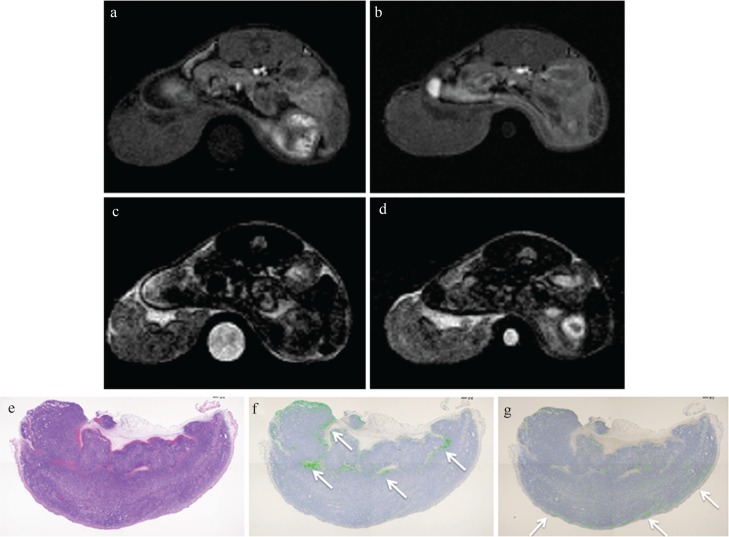
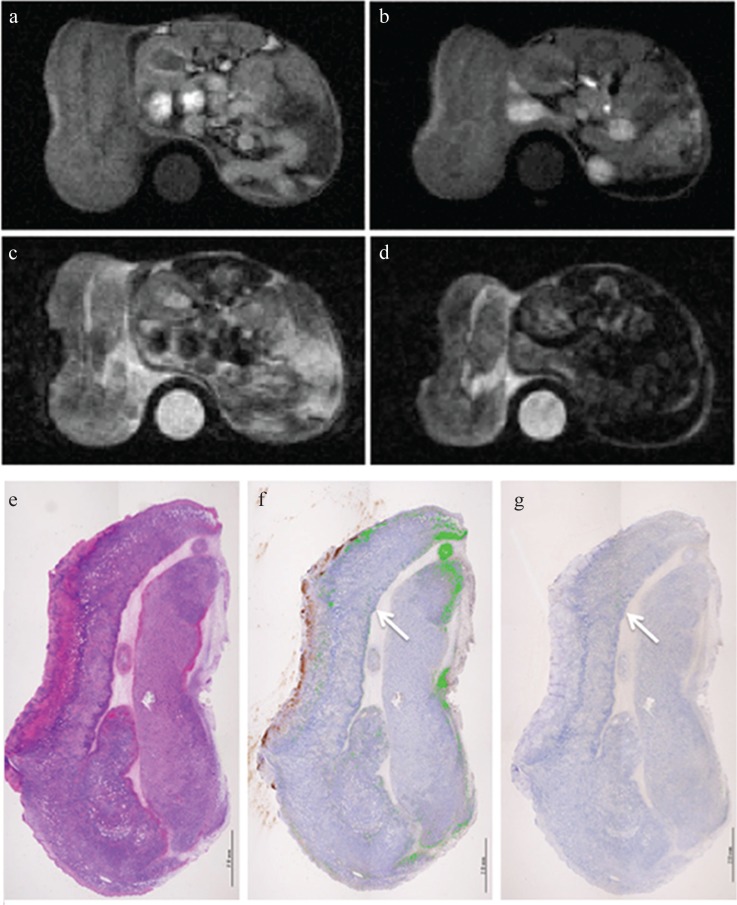
On T1WI the post/pre-SI ratio of the whole tumor at 4 h after injection of Annexin V-USPIO showed 1.46 (Fig. 4a and 4b: Case 2), while that after injection of USPIO without Annexin V was 1.17 (Fig. 5a and 5b: Case 5). The post/pre-SI ratio of the whole tumor at 24 h after injection of Annexin V-USPIO was 1.25 and did not show a high value (Fig. 6a and 6b: Case 4). No gross difference in post/pre-SI ratio on T2WI was observed at any times (Figs. 4c, 4d, 5c, 5d, 6c, and 6d).
Fig. 4.
MRI and pathology at 4 h after injection of Annexin V-conjugated ultrasmall superiron oxide (V-USPIO) for the mouse treated with anti-tumor drugs (Case 2). Tumor volume change ratio (%) was 98.9%. The tumor signal intensity signal intensity (SI) on post-T1-weighted MRI (T1WI) (b) was heterogeneously increased compared with that on pre- T1WI (a). The post/pre-SI ratio of the whole tumor on T1WI was 1.46. The tumor signal on post T2-weighted MRI (T2WI) (d) was similar to that on pre-T2WI (c). The post/pre-SI ratio of the whole tumor on T2WI was 0.97. A round-shaped phantom (water) was also described at the side of the berry in (a–d). (e–g) represent hematoxylin-eosin, Perls DAB and TdT-mediated dUTP nick end labeling (TUNEL) staining, respectively. Perls DAB (%), TUNEL (%) and Necrosis (%) were 7.7, 0.6 and 13.9, respectively. The area of rectangular dotted line in (b) is concordant with that in (e). The similar distribution of iron and apoptotic cells was observed in concordance with the high SI area on post T1WI (arrows).
Fig. 5.
MRI and pathology at 4 h after injection of Ultrasmall superparamagnetic iron oxide (USPIO) without Annexin V for the mouse treated with anti-tumor drugs (Case 5). The tumor signal intensity (SI) on post-T1-weighted MRI (T1WI) (b) was similar to that on pre-T1WI (a). The post/pre-SI ratio of the whole tumor on T1WI was 1.17. The tumor signal on post T2-weighted MRI (T2WI) (d) was also similar to that on pre T2WI (c). The post/pre-SI ratio of the whole tumor on T2WI was 0.94. A round-shaped phantom (water) was also described at the side of the berry in (a–d). (e–g) represent hematoxylin-eosin, Perls DAB and TdT-mediated dUTP nick end labeling (TUNEL) staining, respectively. Perls DAB (%), TUNEL (%) and Necrosis (%) were 2.1, 1.0, and 28.1, respectively. The distribution of iron and apoptotic cells was quite different (arrows).
Fig. 6.
MRI and pathology at 24 h after injection of Annexin V-conjugated ultrasmall superparamagnetic iron oxide (V-USPIO) for the mouse treated with anti-tumor drugs (Case 4). Tumor volume change ratio (%) was 62.7%. The tumor signal intensity (SI) on post-T1-weighted MRI (T1WI) (b) was similar or heterogeneously increased compared with that on pre T1WI (a). The post/pre-SI ratio of the whole tumor on T1WI was 1.25. The tumor signal on post T2-weighted MRI (T2WI) (d) was similar or slightly decreased compared with that on pre T2WI (c). The post/pre-SI ratio of the whole tumor on T2WI was 0.91. A round-shaped phantom (water) was also described at the side of the berry in (a–d). (e–g) represent hematoxylin-eosin, Perls DAB and TdT-mediated dUTP nick end labeling (TUNEL) staining, respectively. Perls DAB (%), TUNEL (%) and Necrosis (%) were 23.7, 0.1 and 44.5, respectively. Although the area in which apoptotic cells are observed is limited, the similar distribution of iron and apoptotic cells was observed (arrows). In this case, small foci of hemorrhage were scattered along with a large necrotic area.
Perls DAB (%) was the highest at 26 h after injection of anti-tumor drugs (at 24 h after injection of USPIO: Case 4). TUNEL (%) was high at 6 or 8 h after injection of anti-tumor drugs (at 4 or 6 h after injection of USPIO: Cases 2 and 3) and was low at 26 h after injection of anti-tumor drugs (at 24 h after injection of USPIO: Case 4). Necrosis (%) increased as the interval from injection of anti-tumor drugs increased. Perls DAB (%) and TUNEL (%) in Case 2 were 7.7% and 0.6%, respectively, while those in Case 5 were 2.1% and 1.0%, respectively.
The similar distribution of iron and apoptotic cells was observed in concordance with the high SI area on post T1WI in all of the Cases 1–4 (Figs. 4e–4g and 6e–6g). Contrarily, the distribution of iron and apoptotic cells was quite different in case 5 (Fig. 5e–5g).
Discussion
Annexin V-USPIO had T1 and T2 relaxivities of 11.8/mM/s (R1) and 91 /mM/s (R2) at 1.5T, respectively. Although Annexin V-SPIO was also reported, its R1 and R2 were measured only at 3T and could not be compared.12 However, the R1 and R2 at 1.5T of Ferucarbotran were 8.7/mM/s and 61/mM/s, respectively.7 Referring to the values of R1 and R2, Annexin V-USPIO was considered to be superior to Ferucarbotran for the detectability of iron particles. MR-based approach with USPIO to apoptosis has no concern of radiation exposure and no effect on renal function. Therefore, this method can be repeated even during chemotherapy without little resistance in comparison with the nuclear medicine examination. Another potential advantage may be the visualization of the detailed localization of apoptosis within a tumor.
In this study, the suspension of apoptotic cells incubated with Annexin V-USPIO showed shorter T2 value compared with control (without incubation with Annexin V-USPIO), suggesting the binding potential of Annexin V-USPIO to apoptotic cells in vitro. Therefore, we decided to evaluate the binding potential of Annexin V-USPIO to apoptotic cells in vivo.
In vivo, the post/pre-SI ratio of the whole tumor on T1WI was increased and reached the maximum at 4 h after injection of Annexin V-USPIO. On the other hand, the post/pre-SI ratio after injection of USPIO without Annexin V did not show a high value. The specific binding of Annexin V-USPIO to apoptotic cells is suggested. In fact, the similar distribution of iron and apoptotic cells was observed in concordance with the high SI area on post T1WI. Contrarily, the distribution of iron and apoptotic cells was quite different when USPIO without Annexin V was injected instead. This results support the feasibility of Annexin V-USPIO for detection of apoptotic cells in vivo as well.
USPIO can be used as a T1-shortening agent due to its high T1-relaxivity. Previous studies used USPIO for T1WI in MR angiography and brain tumor imaging.13–16 It is considered to be reasonable to evaluate the localization of USPIO on T1WI. Contrarily, no gross difference in post/pre-SI ratio on T2WI was observed at any times. The imaging parameters of T2WI may need to be optimized. Perls DAB (%) was the highest at 26 h after injection of anti-tumor drugs (at 24 h after injection of USPIO). In this Case, 4 post/pre-SI ratio on T2WI was relatively low (0.91), while post/pre-SI ratio on T1WI was not so high (1.25) in spite of high Perls DAB (%). Pathologically, this tumor had a large necrosis (44.5%) after resection, and some degree of hemorrhage was also confirmed within the tumor. Probably, the diversity of endogenous and treatment-related hemorrhage within each tumor may account for less correlation between Perls DAB (%) and TUNEL (%). Acute cerebral hemorrhage some hours to less than 1 week old shows isointense to slightly hypointense relative to the surrounding grey matter on T1WI, but hypointense relative to the white matter on T2WI.17 Such a hemorrhagic change might decrease the SI on T2WI. On the other hand, the SI on T1WI appears to be less affected by acute hemorrhage. We consider that T1WI could be more specific to the presence of USPIO than T2WI. Although -weighted imaging is sensitive to heterogeneity in magnetic field, it was not available due to its poor image quality in this study.
A previous in vitro study using EL-4 showed that Annexin V-positive cells rapidly increased by 20% at 1 h after stimulation and reached 80% at 6 h.18 Furthermore, apoptosis (the translocation of PS to the outer leaflet) is reported to initiate at 2 h after administration of anti-tumor drugs, to reach the maximum at 12–16 h and to continue until 24 h.19 Therefore, we set up several time points for evaluation. As a result, the post/pre-SI ratio of the whole tumor on T1WI was the highest at 4 h after injection of Annexin V-USPIO (at 6 h after injection of anti-tumor drugs). This timing can be appropriate to detect apoptotic cells in vivo. On the other hand, the post/pre-SI ratio of the whole tumor on T1WI was low at 24 h after injection of Annexin V-USPIO (at 26 h after injection of anti-tumor drugs). Although the reasons why these results were obtained are unclear, some plausible hypotheses can be proposed. They include (1) decreased binding of Annexin V-USPIO to apoptotic cells, (2) decreased amount of PS on the outer leaflet of apoptotic cells,12 (3) phagocytosis of apoptotic cells by activated macrophage,20,21 and (4) decreased amount of Annexin V-USPIO due to uptake by the liver and the spleen, at 4 h or later after injection. Further investigation is necessary to prove them to be correct.
There are a few limitations in this study. First, the lack of confirmation for the presence of apoptotic cells in vitro. Second, the number of mice used in vivo was small, and a statistical analysis was not performed. Further development of Annexin V-USPIO itself, MRI parameters, injection amount of contrast and scan timing should be considered for better assessment. Although this was a preliminary study, the similar distribution of iron and apoptotic cells was observed in concordance with the region suggesting the presence of Annexin V-USPIO on MRI. Contrarily, the distribution of iron and apoptotic cells was quite different when USPIO without Annexin V was injected instead. We believe that these results obtained have a positive meaning in terms of clinical feasibility of Annexin V-USPIO in the future. Double staining of Perls DAB and TUNEL might clearly describe the difference in distribution of iron and apoptotic cells.
Conclusion
A newly developed Annexin V-USPIO could have the potential for detection of drug-induced apoptosis in vitro and in vivo.
Footnotes
Conflicts of Interest
Satoshi Nohara and Yoshio Ito are employees of Meito Sangyo Co., Ltd. Naoki Kato and Satoshi Yoshise are employees of Guerbet Japan KK. The other authors declare that they have no conflicts of interest.
References
- 1.Blankenberg FG. In vivo detection of apoptosis. J Nucl Med 2008; 49 Suppl 2:81S–95S. [DOI] [PubMed] [Google Scholar]
- 2.Blankenberg FG, Norfray JF. Multimodality molecular imaging of apoptosis in oncology. AJR Am J Roentgenol 2011; 197:308–317. [DOI] [PubMed] [Google Scholar]
- 3.Qin H, Zhang MR, Xie L, et al. PET imaging of apoptosis in tumor-bearing mice and rabbits after paclitaxel treatment with 18F-Labeled recombinant human His10-annexin V. Am J Nucl Med Mol Imaging 2015; 5:27–37. [PMC free article] [PubMed] [Google Scholar]
- 4.Boersma HH, Kietselaer BL, Stolk LM, et al. Past, present, and future of annexin A5: from protein discovery to clinical applications. J Nucl Med 2005; 46:2035–2050. [PubMed] [Google Scholar]
- 5.Vangestel C, van de Wiele C, van Damme N, et al. 99mTc-(CO)3 His-annexin A5 micro-SPECT demonstrates increased cell death by irinotecan during the vascular normalization window caused by bevacizumab. J Nucl Med 2011; 52:1786–1794. [DOI] [PubMed] [Google Scholar]
- 6.Lu C, Jiang Q, Hu M, Tan C, Yu H, Hua Z. Preliminary biological evaluation of 18F-FBEM-Cys-Annexin V a novel apoptosis imaging agent. Molecules 2015; 20:4902–4914. [DOI] [PMC free article] [PubMed] [Google Scholar]
- 7.Rohrer M, Bauer H, Mintorovitch J, Requardt M, Weinmann HJ. Comparison of magnetic properties of MRI contrast media solutions at different magnetic field strengths. Invest Radiol 2005; 40:715–724. [DOI] [PubMed] [Google Scholar]
- 8.Sasaki M, Shibata E, Kanbara Y, Ehara S. Enhancement effects and relaxivities of gadolinium-DTPA at 1.5 versus 3 Tesla: a phantom study. Magn Reson Med Sci 2005; 4:145–149. [DOI] [PubMed] [Google Scholar]
- 9.Mukundan S, Steigner ML, Hsiao LL, et al. Ferumoxytol-Enhanced magnetic resonance imaging in late-stage CKD. Am J Kidney Dis 2016; 67:984–988. [DOI] [PMC free article] [PubMed] [Google Scholar]
- 10.Krishnan AS, Neves AA, de Backer MM, et al. Detection of cell death in tumors by using MR imaging and a gadolinium-based targeted contrast agent. Radiology 2008; 246:854–862. [DOI] [PubMed] [Google Scholar]
- 11.Kitakata H, Nemoto-Sasaki Y, Takahashi Y, Kondo T, Mai M, Mukaida N. Essential roles of tumor necrosis factor receptor p55 in liver metastasis of intrasplenic administration of colon 26 cells. Cancer Res 2002; 62:6682–6687. [PubMed] [Google Scholar]
- 12.Dash R, Chung J, Chan T, et al. A molecular MRI probe to detect treatment of cardiac apoptosis in vivo. Magn Reson Med 2011; 66:1152–1162. [DOI] [PMC free article] [PubMed] [Google Scholar]
- 13.Varallyay P, Nesbit G, Muldoon LL, et al. Comparison of two superparamagnetic viral-sized iron oxide particles ferumoxides and ferumoxtran-10 with a gadolinium chelate in imaging intracranial tumors. AJNR Am J Neuroradiol 2002; 23:510–519. [PMC free article] [PubMed] [Google Scholar]
- 14.Reimer P, Bremer C, Allkemper T, et al. Myocardial perfusion and MR angiography of chest with SH U 555 C: results of placebo-controlled clinical phase i study. Radiology 2004; 231:474–481. [DOI] [PubMed] [Google Scholar]
- 15.Vellinga MM, Oude Engberink RD, Seewann A, et al. Pluriformity of inflammation in multiple sclerosis shown by ultra-small iron oxide particle enhancement. Brain 2008; 131:800–807. [DOI] [PubMed] [Google Scholar]
- 16.Nitta N, Tsuchiya K, Sonoda A, et al. Negatively charged superparamagnetic iron oxide nanoparticles: a new blood-pooling magnetic resonance contrast agent. Jpn J Radiol 2012; 30:832–839. [DOI] [PubMed] [Google Scholar]
- 17.Grossman RI, Gomori JM, Goldberg HI, et al. MR imaging of hemorrhagic conditions of the head and neck. Radiographics 1988; 8:441–454. [DOI] [PubMed] [Google Scholar]
- 18.Jessel R, Haertel S, Socaciu C, Tykhonova S, Diehl HA. Kinetics of apoptotic markers in exogeneously induced apoptosis of EL4 cells. J Cell Mol Med 2002; 6:82–92. [DOI] [PMC free article] [PubMed] [Google Scholar]
- 19.Guo MF, Zhao Y, Tian R, et al. In vivo99mTc-HYNIC-annexin V imaging of early tumor apoptosis in mice after single dose irradiation. J Exp Clin Cancer Res 2009; 28:136. [DOI] [PMC free article] [PubMed] [Google Scholar]
- 20.Schutters K, Reutelingsperger C. Phosphatidylserine targeting for diagnosis and treatment of human diseases. Apoptosis 2010; 15:1072–1082. [DOI] [PMC free article] [PubMed] [Google Scholar]
- 21.Hanshaw RG, Smith BD. New reagents for phosphatidylserine recognition and detection of apoptosis. Bioorg Med Chem 2005; 13:5035–5042. [DOI] [PubMed] [Google Scholar]


