Abstract
We evaluated 3D pseudo-continuous arterial spin labeling (pCASL) using turbo spin echo with a pseudo-steady-state (PSS) readout in comparison with the other major readout methods of 3D spiral and 2D echo-planar imaging (EPI). 3D-PSS produced cerebral blood flow (CBF) values well correlated to those of the 3D spiral readout. By visual evaluation, the image quality of 3D-PSS pCASL was superior to that of 2D-EPI. The 3D-PSS technique was suggested useful as pCASL readout.
Keywords: arterial spin labeling, cerebral blood flow, pseudo-steady state
Introduction
Arterial spin-labeling (ASL) perfusion MRI enables absolute quantification of cerebral blood flow (CBF) without the use of contrast agents.1 In particular, pseudo-continuous arterial spin labeling (pCASL) is widely used because it provides continuous labeling of arterial blood with a low specific absorption ratio (SAR) via a train of rapidly repeating low-tip radiofrequency (RF) pulses.2 For pCASL, 2D gradient-echo (GRE) echo planar imaging (EPI), 3D fast-spin echo interleaved stack-of-spirals (FSE spiral) imaging and 3D gradient and spin echo (GRASE) imaging are used as common readout schemes.2,3 A high signal-to-noise ratio (SNR) is usually required in ASL acquisition because ASL is encumbered by its intrinsically low SNR.4 Low SNR is caused mainly by the short lifetime of the labeled blood by T1 decay and the small volume fraction of blood vessels in the human brain,5 ultimately leading to a high variability of calculated CBF values. The use of a 3D readout module is widely recognized as an important approach to improving SNR. In contrast, one of the weaknesses of 2D-EPI is its high sensitivity to the susceptibility effect, especially in regions, such as the orbitofrontal cortices, the inferotemporal cortices, and the cerebellum, resulting in signal loss caused by susceptibility effects and thus low-SNR images.2,3,5–7 Another weakness is the different slice acquisition times; each slice exhibits a longer effective post-labeling delay (PLD) than the one before.6 This results in several slices acquired with inappropriate timing that was apart from the optimized timing with effective background suppression. The 3D readout module can overcome these problems because it simultaneously obtains all imaging slices with identical PLD times, with numerous numbers of encoding steps leading to high SNR. Together, these allow for an improvement in ASL imaging in terms of sequence efficiency, slice coverage, SNR, physiologic timing, substantially reduced acquisition times, reduced distortion, and susceptibility artifacts.2,3,6 FSE spiral imaging is frequently used as a 3D readout in pCASL.2 This readout provides high-SNR images because the largest signal through the signal sampling is located in the center of k-space. However, this readout is sometimes problematic because the signal level in the periphery of the k-space is very low. This can lead to images with a blurred outline. As another 3D readout, 3D-GRASE has been also introduced as a combination of FSE and EPI readout. This readout was less sensitive to local inhomogeneity and susceptibility effects compared to the gradient echo-based EPI sequence while preserving the acquisition speed, although a certain degree of image distortion may be present depending on the parameter settings of the EPI factor.
Recently, pCASL using turbo spin echo (TSE) with pseudo-steady state (PSS) readout has become available. One advantage of TSE with PSS readout is that it obtains a high signal echo in the periphery of k-space, as well as its center using an optimized-variable flip-angle (FA) scheme. A calculated refocusing FA is continuously served to adjust the effective rate of T1 and T2 relaxation. It is expected that 3D-pCASL using a PSS readout module provides high SNR and spatial resolution with sharpened outlines. To our knowledge, there is no report that has described 3D-pCASL using TSE with a PSS readout module.
The aim of the current study was to assess the CBF value and imaging quality obtained by 3D-PSS readout in comparison to those of 2D-EPI and 3D spiral readouts.
Materials and Methods
Subjects
The study protocol was approved by our Institutional Review Board. Ten healthy volunteers (seven men, three women, mean age, 29 years; range 24–36 years) participated in this study after providing written informed consent. All participants underwent 3T MRI scanning including pCASL sequences.
MRI data acquisition
All volunteers were scanned by a 3T MR scanner (Achieva TX; Philips Healthcare, Best, The Netherlands) using an 8-channel head coil. In addition, all volunteers also received an additional MR scan by a different 3T unit (Discovery MR750w, GE Healthcare, Milwaukee, WI, US) using a 12-channel head coil on the same day. pCASL by the Philips scanner was performed using the following readout modules and scanning parameters:
2D-EPI: Gradient echo sequence; TR, 4500 ms; TE, 15 ms; FA, 90°; number of signal average (NSA), 10 (10 label and 10 control images); slice thickness, 5 mm; slice gap, 0.5 mm; sensitivity encoding (SENSE) factor, 2.5; FOV, 240 mm; image matrix, 80 × 80; number of slices, 25; label duration, 1650 ms; post-labeling delay (PLD), 1525 ms; PLD increase per slice, 28.3 ms; background suppression consisting of a saturation pulse before labeling and inversion pulses at 1710 and 2860 ms after the saturation pulse; scan time, 1′38″.
3D-PSS: volume isotropic turbo spin echo acquisition (VISTA) sequence: TR, 5393 ms; TE, 19 ms; FA, 90°; refocusing FA, FA trains with explicit control from a minimum FA of 120° to a maximum FA of 180°; NSA, 1; slice thickness, 3 mm; TSE factor (number of echo trains per one TR), 100; SENSE factor, 2.5; FOV, 240 mm; image matrix, 80 × 80; number of slices, 40; label duration, 1650 ms; PLD, 1525 ms; background suppression, which consisted of a saturation pulse before labeling and inversion pulses at 1680 and 2730 ms after the saturation pulse; scan time, 1′47″.
In contrast, pCASL by the GE scanner was performed using the following readout module and scanning parameters:
3D spiral: FSE readout: TR, 5393 ms; TE, 19 ms; FA, 90°; refocusing FA 111°; NSA, 1; slice thickness, 4 mm; FOV, 240 mm; image matrix, 8 spirals × 512 sampling points with the reconstructed matrix of 128 × 128; number of slices, 36; label duration, 1450 ms; PLD, 1525 ms; scan time, 1′47″.
In this study, a much shorter scan time compared to the conventional ASL scan (typically around 3–4 min) was intentionally chosen considering the fact that the older population with cerebrovascular disease presents much lower SNR than the young healthy subjects who participated in this study. The scanning range of these three pCASL acquisitions was placed to cover the whole brain including the cerebellum at the lower end. The labeling slab was set 20 mm below the lowest image slices.
Refocusing FA modulation techniques
The transition of refocusing FA with the PSS readout module using the variable refocusing FA is illustrated in Fig. 1. In the PSS readout module with the variable refocusing FA, the refocusing FA first decreases rapidly from around 180° to the minimum (αmin), then remains constant for the specified number of echoes located at the center of the k-space (αcen), and the PSS conditions can be established at the same time.8 The signal intensity approaches a temporary steady-state condition due to the balance of T1 and T2 relaxation in this refocusing FA; this condition is called a PSS condition because the steady-state condition is actually temporary only.9 Thereafter, the refocusing FA gradually increases linearly until the end of the echo train, when the refocusing FA reaches αmax. In this study, we set the details of input in refocusing FA as follows: αmin= 120°, αcen= 120°, αmax= 180°. Using this style of refocusing FA, we were able to obtain stable output signal intensity without decreases; this profile is characterized by stable high signal acquisition in the peripheral area, as well as in the center of the k-space, although the SAR tended to be a little higher.
Fig. 1.
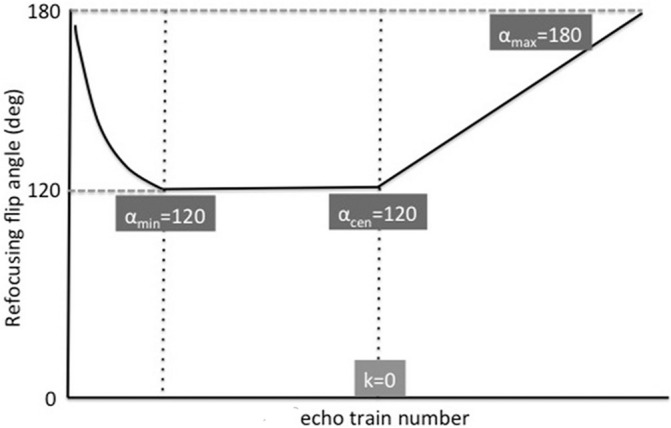
Variable refocusing flip-angle (FA) profile in the 3D pseudo-steady state (PSS) readout module. The refocusing FA rapidly decreases from around 180° to the minimum (αmin), then remains constant for the specified number of echoes in the center of the k-space (αcen); at the same time, PSS conditions can be established due to the balance of T1 and T2 relaxation. Thereafter, the refocusing FA increases gradually and linearly until the end of the echo train to obtain a higher-level signal at the periphery, as well as the center of the k-space, with the following FA settings: αmin = 120°, αcen = 120°, αmax = 180°.
Data analysis
Quantitative evaluation
By using the obtained data from all subjects, labeled and control images were pairwise subtracted and averaged to obtain perfusion-weighted images, and then, CBF map was generated pixel by pixel basis from the perfusion-weighted images. For the data obtained by Philips scanner, the CBF was calculated using the following equation:2
| (1) |
where λGM is the gray matter (GM) brain/blood partition coefficient in mL/g (0.9), SIcontrol and SIlabel are the time-averaged signal intensities in the control label images, respectively, T1,blood is the longitudinal relaxation time of blood (1650 ms), α is the labeling efficiency (0.85), SIPD is the signal intensity of a proton density-weighted image, e is the base of the natural logarithm (Napier’s number), and τ is the label duration (1650 ms). PLD is the post-labeling delay (1525 ms).
For the data obtained by GE scanner, a CBF map was obtained directly from the console with the scanner using the following equations:10
| (2) |
| (3) |
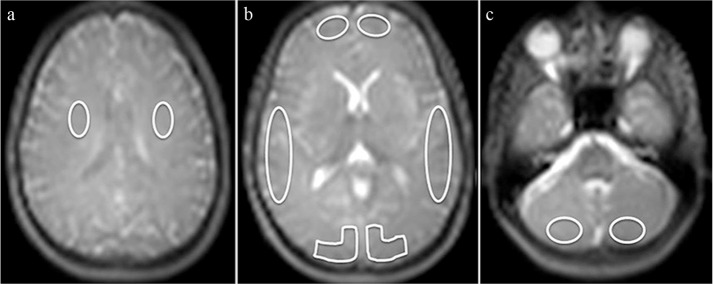
where ΔM represents the difference of signal intensity between control and labeled images, M0,blood is the equilibrium magnetization of arterial blood, T1,blood is the longitudinal relaxation time of blood (1650 ms) in seconds, α is the labeling efficiency (0.8), αinv corrects for the decrease in the labeling efficiency due to background suppression pulses (0.75), and τ is the label duration (1450 ms), PLD is the post-labeling delay (1525 ms), PD is the image signal intensity of control images provided by the console with the scanner, tsat is the saturation recovery time (2000 ms), T1GM is the relaxation time of GM tissue (1200 ms) and λGM is the GM brain/blood partition coefficient in mL/g (0.9). All data analyses were performed using Image J software (National Institute of Health Image, Bethesda, MD, USA). For each imaging, 10 ROI were manually placed: 2 (bilaterally) in the white matter on the level of the centrum semiovale, 2 each in GM in the flow territory of the anterior (ACA), middle (MCA), and posterior cerebral artery (PCA) at the level of basal ganglia, and 2 in the GM at the level of the cerebellum. All ROIs were placed on the ASL control images (Fig. 2), and then copied on the perfusion map. Mean CBF value in each ROI was calculated, respectively.
Fig. 2.
ROI placement. On Arterial spin-labeling (ASL) control images, manual ROI were placed bilaterally in the white matter at the level of the centrum semiovale (two ROIs) (a), in the gray matter (GM) in the flow territory of the anterior (ACA), middle (MCA), and posterior cerebral artery (PCA) at the level of basal ganglia (six ROIs) (b), and in the GM at the level of the cerebellum (two ROIs) (c).
Visual evaluation
The visual evaluation of ASL perfusion imaging was respectively performed by three raters with more than 8 years of experience in neuroimaging based on the overall imaging quality in terms of image sharpness, clearness, the degree of the depiction in cortical and deep gray matter, and also the presence of artifact. The image evaluation was performed using the following 4-point scoring system: 0, poor (the overall poor imaging quality with signal defect of cortical perfusion and the unclearness of the outline of the deep gray matter or severe artifact); 1, moderate (the overall slightly poor-moderate imaging quality with only the unclearness of the cortical or deep gray matter perfusion or moderate artifact); 2, good (the overall good image quality with the sufficient depiction of cortical and deep gray matter but only a little artifact was present); 3 excellent (the overall good image quality with almost no artifact) (Fig. 3).
Fig. 3.
Examples of 4-point scoring system for the image evaluation. The evaluation was performed based on the depiction of cortical and deep gray matter, and also the degree of the artifact. The score 0 (poor) represent the overall poor imaging quality with signal defect of cortical perfusion (a: arrows) and the unclearness of the outline of the deep gray matter (a: arrowhead) or severe artifact, the score 1 (moderate) represent the overall slightly poor-moderate imaging quality with only the unclearness of the cortical or deep gray matter perfusion (b: arrows) or moderate artifact, the score 2 (good) represent the overall good image quality with the sufficient depiction of cortical and deep gray matter but only a little artifact was present (c: arrows), and score 3 (excellent) represent the image with overall good image quality with almost no artifact (d). In this figure, case example of pseudo-continuous arterial spin labeling (pCASL) with 3D spiral-fast-spin echo (FSE) (a), 2D echo planar imaging (EPI) (b), 3D pseudo-steady state (PSS) (c and d) was respectively used.
Statistical analysis
From 10 participants, a total of 80 data points in the cerebrum (three gray-matter ROIs and one white-matter ROI per subject) and 20 data points in the cerebellum (two gray-matter ROIs per patient) were analyzed. In each ROI, the mean CBF value was used for the analysis. In all CBF analyses, data comparison was performed separately on the cerebrum and cerebellum data points.
First, correlation analysis of CBF values among different readout modules of 2D-EPI, 3D-PSS, and 3D-spiral FSE was performed using Pearson correlation coefficient. Pearson correlation coefficients were set as follows: r < 0.2, poor correlation/agreement; r = 0.2–0.4, fair correlation/agreement; r = 0.41–0.6, moderate correlation/agreement; r = 0.61–0.8, good correlation/agreement; r > 0.81, excellent correlation/agreement. In addition, linear mixed effects model correlation analysis was performed to account for CBF value clustering induced by the respective patient. In this model, CBF value correlation analysis was performed with considering the effect of the individual volunteer’s intraclass CBF values correlation to the total correlation analysis. We also conducted a Bland-Altman analysis to determine the mean difference (bias) in CBF in each pair of three different readout modules.
In addition, the grading score of visual evaluation in each rater was respectively compared among the three different readout modules using the Kruskal-Wallis test. The weighted-kappa (κ) score was calculated between raters to estimate the inter-observer agreement in a visual evaluation.
All statistical analyses were performed using JMP 11 software (subarachnoid space [SAS] Institute Inc., Cary, NC, USA). Statistical significance was set to P < 0.05 for all tests.
Results
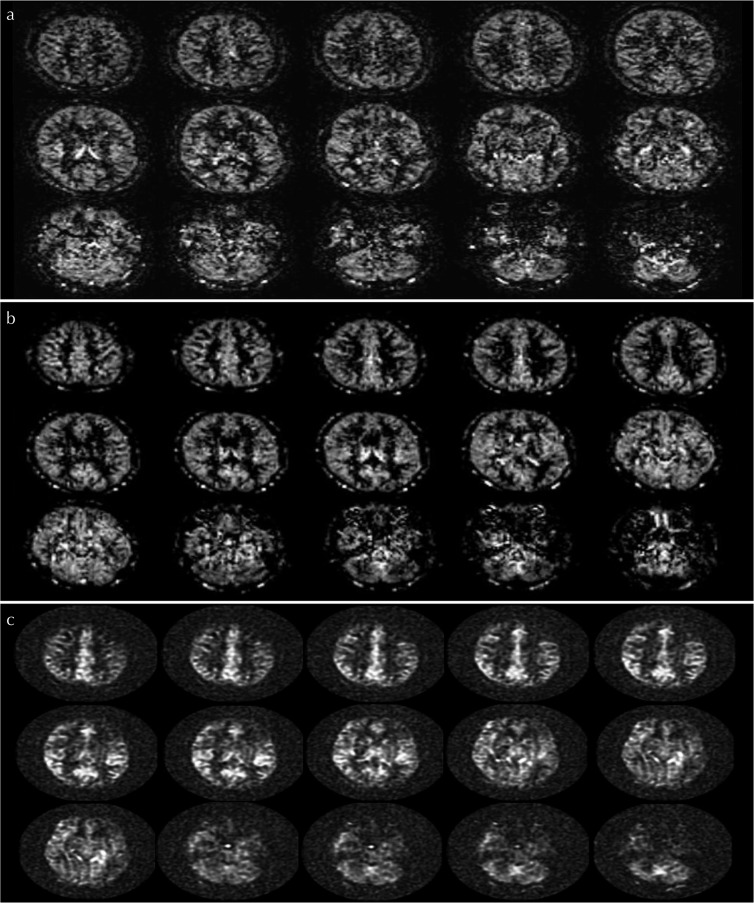
All ASL scanning was successfully performed. Case examples of ASL perfusion image obtained by three different readout modules in the same volunteer were presented in Fig. 4.
Fig. 4.
Arterial spin-labeling (ASL) perfusion images among 2D-echo planar imaging (EPI), 3D-pseudo steady state (PSS), and 3D spiral-fast-spin echo (FSE) readout. Case examples of ASL perfusion image obtained by 2D-EPI (a), 3D-PSS (b) and 3D-spiral FSE (c) in the same volunteer were respectively presented.
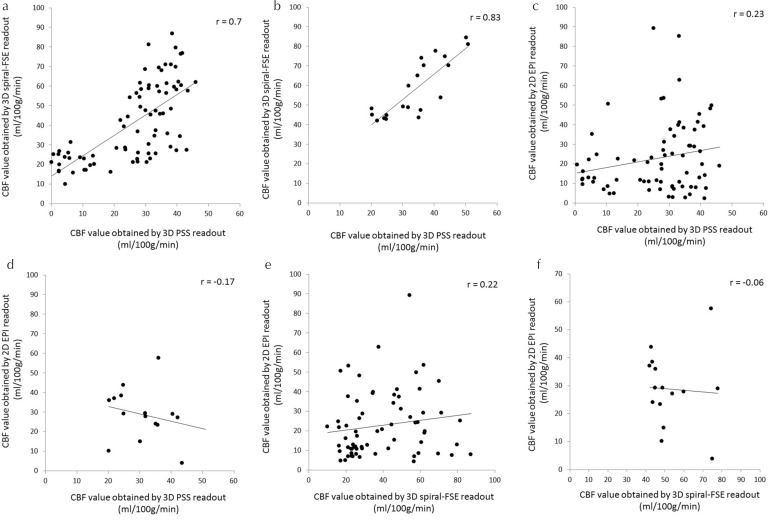
In the correlation analysis, CBF values from 3D-spiral FSE and 3D-PSS showed good correlation in the cerebrum (P < 0.0001, r = 0.7) and excellent correlation in the cerebellum (P < 0.0001, r = 0.83). In contrast, CBF values from 2D-EPI and 3D-PSS showed fair correlation in the cerebrum (P = 0.03, r = 0.23) but no significant correlation in the cerebellum (P = 0.12, r = −0.17). In addition, CBF values of 3D-spiral FSE and 2D-EPI showed fair correlation in the cerebrum (P = 0.04, r = 0.22), but no significant correlation in the cerebellum (P = 0.46, r = −0.06). A scatter plot graph of 3D-spiral FSE values is presented in Fig. 5. Linear mixed effects model analyses revealed that the individual CBF cluster in each volunteer was not significantly related to the total correlation of CBF values (all of P > 0.05). The adjusted correlation coefficients using linear mixed effects model were not largely different from simple Pearson correlation coefficients as follows; 0.7 (cerebrum) and 0.82 (cerebellum) between 3D-spiral FSE and 3D-PSS, 0.27 (cerebrum) and −0.11 (cerebellum) between 3D-PSS and 2D-EPI, 0.22 (cerebrum) and −0.02 (cerebellum) between 3D-FSE spiral and 2D-EPI, respectively.
Fig. 5.
Scatterplot of the CBF values between two different readout methods. Scatterplot graph of CBF values between 3D-PSS and 3D spiral readouts in the cerebrum (a) and cerebellum (b); between 3D-PSS and 2D-EPI readouts in the cerebrum (c) and cerebellum (d) and between 3D spiral and 2D-EPI readouts in the cerebrum (e) and cerebellum (f). Correlation coefficients were particularly high in the comparison of 3D-PSS and 3D spiral readouts. CBF, cerebral blood flow; EPI, echo planar imaging; FSE, fast-spin echo; PSS, pseudo-steady state.
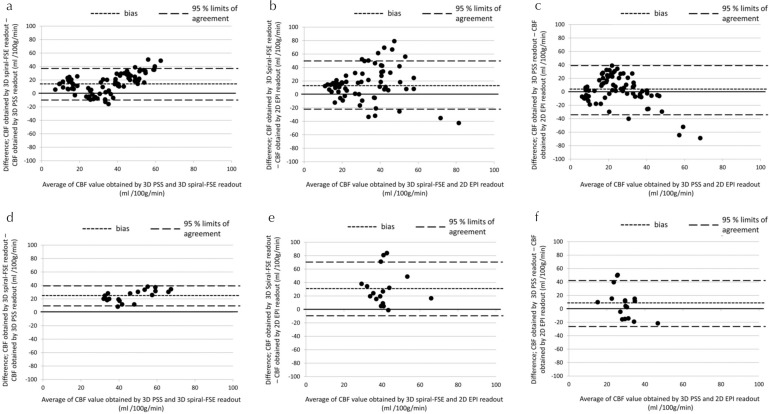
In Bland-Altman analysis, a mean bias was revealed in CBF values obtained with 3D-spiral FSE, which were markedly higher than those obtained by 3D-PSS in both the cerebrum and cerebellum analysis. A mean bias was also revealed in CBF values obtained with 2D-EPI, which were remarkably lower than those obtained by 3D-spiral FSE. The 95% CI of the upper and lower limits showed a wide range in Bland-Altman plot graph of 2D-EPI and 3D-spiral FSE, and also that of 2D-EPI and 3D-PSS, whereas it was small range in that of 3D-spiral FSE and 3D-PSS. These results are summarized in Fig. 6.
Fig. 6.
Bland-Altman plots of CBF values differences between two different readout methods. Bland-Altman plot graphs show CBF value differences in the cerebrum between the 3D-PSS and 3D spiral readouts (a), the 3D spiral and 2D-EPI readouts (b), and the 3D-PSS and 2D-EPI readouts (c). CBF value differences in the cerebellum between the 3D-PSS and 3D spiral readouts (d), the 3D spiral and 2D-EPI readouts (e), and the 3D-PSS and 2D-EPI readouts (f) are also shown. CBF, cerebral blood flow; EPI, echo planar imaging; FSE, fast-spin echo; PSS, pseudo-steady state.
In the visual evaluation, all raters gave significantly higher scores in 3D-PSS than 2D-EPI (P = 0.006, 0.02, and 0.01, respectively). In addition, all raters gave scores of 3D-PSS which was higher than those of the 3D-PSS spiral readout, although statistical significance was not observed (P = 0.15, 0.97, and 0.52, respectively). All results of visual evaluation were presented in Fig. 7. Calculated weighted-Kappa (κ) scores between raters were as follows; 0.70 (rater 1 and 2), 0.75 (rater 2 and 3) and 0.63 (rater 1 and 3).
Fig. 7.
The results of visual evaluation by four grading system among three readout methods. The results of visual evaluation by three raters were respectively presented (a–c). In all raters, significantly higher scores were found in 3D-PSS than 2D-EPI (*a: P = 0.006, b: P = 0.02, and c: P = 0.01, respectively). In addition, visual scores of 3D-PSS tended to be higher than those of the 3D spiral readout, although statistical significance was not observed (a: P = 0.15, b: 0.97, and c: 0.52, respectively). EPI, echo planar imaging; PSS, pseudo-steady state.
Discussion
In this study, CBF values obtained with pCASL were compared among different readout sequences: 2D-EPI, 3D spiral, and 3D-PPS, in which a much shorter scan time was intentionally chosen considering the fact that the older population with cerebrovascular disease presents much lower SNR than the young healthy subjects who participated in this study. In such a situation, significantly good or excellent correlation was observed between the CBF values obtained using the two different readout modules of 3D-PSS and 3D-spiral FSE, which has been described as one of the most standard techniques for ASL perfusion imaging.2 The results of the current study indicated that the reliability of the CBF value calculated by the 3D-PSS readout method is of a sufficient level compared to the 3D-spiral FSE. In contrast, the CBF value obtained by pCASL with 2D-EPI readout showed only fair correlation with the 3D spiral readout. We speculate the cause of this was that the 2D GRE EPI sequence suffered from very low SNR as a result of the intentional short scan time, and the small ROIs used in the current study may have led to large variations in the measured CBF value. In addition, EPI generally generates a stronger signal compared to an FSE-type sequence. From these points of view, it might be better to use the standard clinical protocol with longer scan time typically around 4 min especially in using the 2D-EPI readout. In contrast, a 3D FSE sequence can improve the SNR with its multiple encoding steps. This different type of echo may also influence the result.
In the Bland-Altman plot analysis, a mean bias between CBF values obtained by 3D-PSS and 3D spiral imaging was observed, with a tendency for higher CBF value in the 3D spiral readout. In addition, a mean bias and a tendency for higher CBF value were observed in 3D spiral readout compared to the 2D-EPI readout. In contrast, no marked difference of mean bias was observed the CBF values between the 3D-PSS and 2D-EPI readout. It is likely that these results were caused by the difference in the equation for the CBF quantification, because several coefficients and defined values were different between the equations. In particular, the quantification equation used in the 3D-spiral FSE readout had slightly lower labeling efficiency (=0.8) compared to the 2D-EPI and 3D-PSS and the decrease in the labeling efficiency due to background suppression pulses (αinv); these coefficients can lead to a calculated CBF value that was higher in 3D-spiral FSE. In addition, the difference in the obtained perfusion signal compared to the reference proton density (i.e., the signal intensity of ASL perfusion image divided by the proton density signal of M0) depending on the respective readout module of 2D-EPI, 3D-PSS, and 3D-spiral FSE will also affect the calculated CBF values. We speculate that the mixture of these factors will provide the mean bias of calculated the CBF values. On the other hand, the 95% CI showed a remarkably large range when 2D-EPI was analyzed in comparison to the 3D-PSS or 3D spiral readout. We speculate that the reason for this was that the signals obtained in several ROIs by 2D-EPI included a lot of noise, especially in the cerebellum; the overall deviation became large because of such noisy ROIs. Compared to this, the 95% CI was quite small in the comparison between 3D-PSS and 3D spiral readouts. This result suggested that both 3D sequences consisted of a relatively stable, low-variation signal profile.
In the results of visual score, the 3D-PSS readout was superior to 2D-EPI. In addition, the visual score tended to be slightly higher for 3D-PSS than for 3D-spiral FSE although the statistical significance was not observed. From this result, the 3D-PSS might provide sharper-outline images compared to 3D-spiral FSE. We speculate that these results were influenced by the difference in their point spread function (PSF). 3D-spiral FSE generally presents a wider PSF because it provides a very low signal profile in the peripheral area of the k-space whereas the center of the k-space is very high; this results in image blurring and a larger effective voxel size, which causes unclear margins of several brain structures.11 The higher SNR of 3D-spiral FSE compared to 2D-EPI observed in this study is also explained by this wide PSF. One advantage of the 3D-PSS readout is that a high signal echo is placed in the periphery of the k-space as well as at the center; thus, it can be expected to provide sharper-outline images as well as high SNR. This sequence presents a streamlined technique to generate a sequence of refocusing FA on a per-prescription basis, producing a relatively high SNR and preventing blurring in a wide range. Such differences between these two 3D ASL readout modules are likely responsible for the slight image quality differences between them.
This study has several limitations. First, the number of subjects was quite small. Second, only the CBF in normal subjects was used for image evaluation. Patients with cerebrovascular disease should be evaluated in future studies. Third, we did not compare the CBF values obtained from pCASL to those obtained by the gold standard, H215O positron emission tomography (PET), for validation.12 Fourth, the values of PLD for all sequences were equalized; the majority of the 2D-EPI slices will have a higher effective PLD due to the different slice acquisition time of the 2D readout compared to the 3D sequences. However, the difference in the effective PLD may be considered around 100–150 ms, and we therefore believe that a serious error did not occur in the comparison of the 2D and other 3D readouts. Fifth, a variation of the arrangement in 3D-PSS refocusing FA was not fully investigated, but recommended values were only used. Ideal refocusing FA might be different based on the kind of target disease. Further optimization study will be needed.
Conclusion
3D-PSS readout-based pCASL provided CBF values that were well correlated with those of 3D-spiral FSE imaging, which is generally considered one of the standard readout modules in ASL scanning. Our present findings suggest that 3D-PSS readout-based pCASL can also be used as another standard readout.
Footnotes
Conflicts of Interest
Yuriko Suzuki is a former employees of Philips Electronics Japan. Akira Suwa is currently employed by Philips Electronics Japan. The other authors declare that they have no conflicts of interest.
References
- 1.Detre JA, Rao H, Wang DJ, Chen YF, Wang Z. Applications of arterial spin labeled MRI in the brain. J Magn Reson Imaging 2012; 35:1026–1037. [DOI] [PMC free article] [PubMed] [Google Scholar]
- 2.Alsop DC, Detre JA, Golay X, et al. Recommended implementation of arterial spin-labeled perfusion MRI for clinical applications: a consensus of the ISMRM perfusion study group and the European consortium for ASL in dementia. Magn Reson Med 2015; 73:102–116. [DOI] [PMC free article] [PubMed] [Google Scholar]
- 3.Vidorreta M, Wang Z, Rodríguez I, Pastor MA, Detre JA, Fernández-Seara MA. Comparison of 2D and 3D single-shot ASL perfusion fMRI sequences. Neuroimage 2013; 66:662–671. [DOI] [PMC free article] [PubMed] [Google Scholar]
- 4.van Osch MJ, Teeuwisse WM, van Walderveen MA, Hendrikse J, Kies DA, van Buchem MA. Can arterial spin labeling detect white matter perfusion signal? Magn Reson Med 2009; 62:165–173. [DOI] [PubMed] [Google Scholar]
- 5.Günther M, Oshio K, Feinberg DA. Single-shot 3D imaging techniques improve arterial spin labeling perfusion measurements. Magn Reson Med 2005; 54:491–498. [DOI] [PubMed] [Google Scholar]
- 6.Ye FQ, Frank JA, Weinberger DR, McLaughlin AC. Noise reduction in 3D perfusion imaging by attenuating the static signal in arterial spin tagging (ASSIST). Magn Reson Med 2000; 44:92–100. [DOI] [PubMed] [Google Scholar]
- 7.Deichmann R, Josephs O, Hutton C, Corfield DR, Turner R. Compensation of susceptibility-induced BOLD sensitivity losses in echo-planar fMRI imaging. Neuroimage 2002; 15:120–135. [DOI] [PubMed] [Google Scholar]
- 8.Busse RF, Hariharan H, Vu A, Brittain JH. Fast spin echo sequences with very long echo trains: design of variable refocusing flip angle schedules and generation of clinical T2 contrast. Magn Reson Med 2006; 55:1030–1037. [DOI] [PubMed] [Google Scholar]
- 9.Alsop DC. The sensitivity of low flip angle RARE imaging. Magn Reson Med 1997; 37:176–184. [DOI] [PubMed] [Google Scholar]
- 10.Mutsaerts HJ, Steketee RM, Heijtel DF, et al. Inter-vendor reproducibility of pseudo-continuous arterial spin labeling at 3 Tesla. PLoS ONE 2014; 9:e104108. [DOI] [PMC free article] [PubMed] [Google Scholar]
- 11.Vidorreta M, Balteau E, Wang Z, et al. Evaluation of segmented 3D acquisition schemes for whole-brain high-resolution arterial spin labeling at 3 T. NMR Biomed 2014; 27:1387–1396. [DOI] [PMC free article] [PubMed] [Google Scholar]
- 12.Heijtel DF, Mutsaerts HJ, Bakker E, et al. Accuracy and precision of pseudo-continuous arterial spin labeling perfusion during baseline and hypercapnia: a head-to-head comparison with 15O H2O positron emission tomography. Neuroimage 2014; 92:182–192. [DOI] [PubMed] [Google Scholar]


