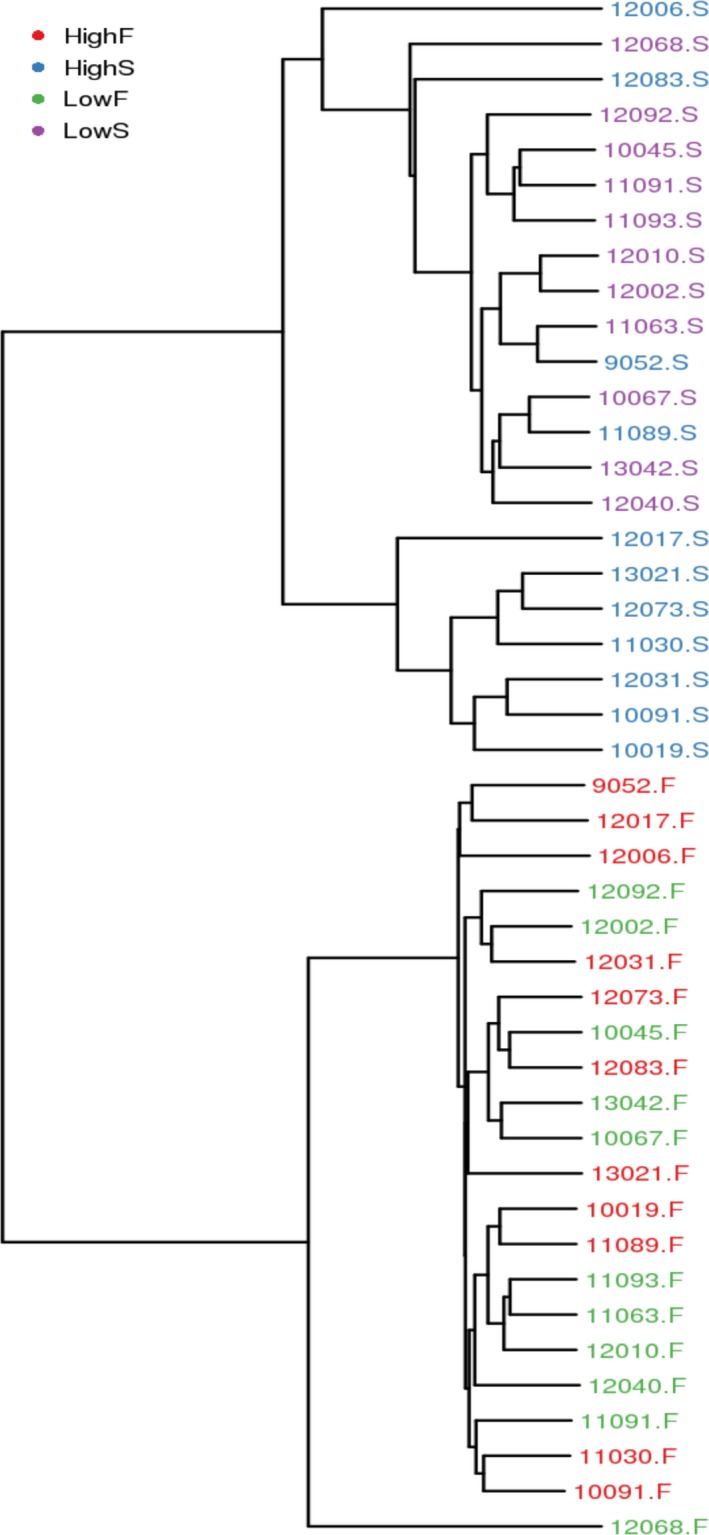
Figure 4.

Weighted_unifrac cluster tree of rumen fluid and fecal samples. Note. The same color represents the samples in the same group. Short distance between samples represents high similarity. HighS and LowS represent rumen fluid from high‐yield and low‐yield cows, respectively. HighF and LowF represent groups of high‐yield and low‐yield cow feces, respectively
