

Abstract
Multiple sclerosis (MS) is a central nervous system (CNS) inflammatory demyelinating disease impacted by the interplay of genetic and environmental factors. It is presumed to be autoimmune. MS is more common in western countries and differences in diet could contribute to its particular geographical distribution. Studies relating diet to MS have been inconclusive. A mechanism through which diet can influence immune responses is the gut microbiome, which is emerging as a critical contributor in numerous human diseases. Here we show that intermittent fasting (IF) ameliorated clinical course and pathology of the MS animal model, experimental autoimmune encephalomyelitis (EAE), leading to less inflammation, demyelination and axonal damage. IF changed the gut microbiome resulting in increased bacteria richness and enrichment of the Lactobacillaceae, Bacterioidaceae and Prevotellaceae families. Gut microbiome richness was inversely correlated with leptin levels. Microbial metabolic pathway analysis revealed that IF-induced changes to the gut microbiome increased ketone formation and glutathione metabolism, enhancing anti-oxidative pathways. Furthermore, IF had direct effects on the composition of T cells in the gut lamina propria with a reduction of IL-17 producing T cells and an increase in the number of regulatory T cells. These effects might modulate systemic immune responses. Importantly, fecal microbiome transplantation from mice on IF ameliorated EAE in immunized recipient mice on a normal diet, suggesting that IF immunomodulatory effects are at least partially mediated by the gut flora. We translated our findings to MS patients in a pilot clinical trial in MS patients undergoing relapse to test the safety, feasibility and effects of IF on clinical and laboratory measures. Potentially beneficial effects on levels of several immune inflammatory parameters as well as gut flora that resembled the protective changes observed in mice in EAE were observed. In conclusion, IF has potent immunomodulatory effects that are at least partially mediated by the gut microbiome.
One Sentence Summary:
Intermittent fasting (IF) confers protection in the multiple sclerosis animal model through effects on the gut microbiota, with similar changes to gut microbiota observed in relapsing MS patients undergoing short-term IF.
INTRODUCTION
Multiple sclerosis (MS) is a central nervous system (CNS) inflammatory demyelinating disease characterized by varying degrees of axon and neuron injury triggered presumably by autoimmune mechanisms. MS affects 2.5 million people worldwide, with significant personal and socioeconomic burden. Clinically, MS can be relapsing-remitting (RRMS), or can have a progressive course characterized by accumulating neurological disability with or without superimposed relapse activity (Dendrou et al., 2015). Genetic risk factors do not account fully for disease development. Environmental factors including some infections, low vitamin D levels, smoking and obesity have each been associated with increased MS risk (Ascherio, 2013). Experimental autoimmune encephalomyelitis (EAE) is a MS animal model that has been instrumental in the development of several MS therapies (Steinman and Zamvil, 2005). T lymphocytes, in particular CD4+ T cells, are key players in EAE and are thought to be major contributors to MS pathogenesis. CD4+ T helper (Th) cells are characterized by distinct cytokine profiles and expression of master transcription factors, which are used to define T cell subsets (Wang et al., 2015). Several lines of evidence indicate the pathogenic role in MS and EAE of CD4+ T cells producing IL-17 (Th17), IFN-γ (Th1) and GM-CSF while regulatory T cells (Tregs) have immunomodulatory and protective functions.
MS is more common in western countries. Dietary habits have been considered as a potential factor contributing to MS epidemiology (Manzel et al., 2014). Different diets and dietary supplements have been implicated in MS risk, but the field is lacking robust scientific data to support this risk. Indeed, many studies highlight the importance of the complex interplay between nutrition, metabolic state and immune-inflammatory responses in MS (Carbone et al., 2016). Obesity during childhood/young adulthood is a risk factor for MS development as shown in several recent studies (Hedstrom et al., 2014; Hedstrom et al., 2012; Langer-Gould et al., 2013; Munger et al., 2013; Munger et al., 2009; Wesnes et al., 2015). This might be related to a low-grade chronic inflammatory state in obesity that could promote autoimmunity through altered adipokine production (Calder et al., 2011). An additional link between nutrition and immune-inflammatory responses is the gut microbiome. Diet is a critical determinant of the gut microbial composition. Gut commensal bacteria and their metabolites have the potential to exert both pro- and anti-inflammatory responses by regulating T cell differentiation and immune responses in the gut (Furusawa et al., 2015). Ultimately, this can have systemic effects and either drive or protect from autoimmune diseases, including in the EAE model (Berer et al., 2011; Lee et al., 2011; Ochoa-Reparaz et al., 2009; Vieira et al., 2014; Wu et al., 2010). Recently it has been reported that the gut microbiome in RRMS patients is altered compared to healthy controls (Chen et al., 2016; Jangi et al., 2016). Further, calorie restriction (CR) has potent anti-inflammatory effects (Meydani et al., 2016). Studies including our own demonstrated that chronic CR significantly inhibited EAE (Piccio et al., 2008). However, chronic CR is not likely to be feasible for most people. Intermittent fasting (IF) induces many of the same changes observed by chronic CR and would possibly be more acceptable.
We therefore undertook studies of IF in the EAE model and in MS patients experiencing a relapse and showed that IF ameliorated EAE through effects at least in part mediated by changes in the gut flora. IF induced protective changes in gut microbiome metabolic pathways and lamina propria lymphocytes as demonstrated by the fact that gut microbiome transplantation from mice on IF ameliorated EAE in recipient mice after immunization. To translate our findings in patients, we performed a small pilot randomized controlled trial. IF in MS patients having a relapse was a safe and feasible intervention associated with short term metabolic and gut microbiome changes that recapitulated what observed in the animal model.
RESULTS
IF ameliorated EAE clinical course.
We previously showed that chronic CR ameliorates EAE when initiated before immunization (Piccio et al., 2008). However, a high level of CR might be difficult to translate to people with MS on a continuous basis. Thus, the effects on EAE of IF were examined. Mice were fasted every other day (IF group) or fed ad libitum (control group) for 4 weeks. IF group body weights fluctuated depending on whether mice were weighed on fasting or feeding days (Figure S1) and were significantly different between groups at time of immunization as they were assessed after a fasting day. Body composition studies by EchoMRI showed a significant reduction of both body fat and lean mass in the IF compared to the control group after four weeks on the intervention and after a fasting day (Figure S2). IF resulted in amelioration of EAE clinical course and severity compared to ad libitum diet (all EAE experiments are summarized in Table 1 and S1). In a representative EAE experiment (Figure 1A) disease incidence was 100% in the control group, whereas only 7 out of 10 mice in the IF group developed clinical EAE. Mean EAE day of onset was significantly delayed in the IF group vs. the control group (P<0.05; Table 1, Exp. 1) and disease course was significantly less severe in the IF group compared to controls (P<0.005). Results of the sensitivity analysis which summarize all EAE experiments had consistent results with significant differences in delayed onset (P=0.04), decreased incidence (P<0.007) and lower cumulative clinical EAE score (P=0.004) observed between the IF versus ad libitum cages (Table S1).
Table 1.
Comparisons of EAE clinical characteristics and weights between diet groups.
| Exp. # | Group | N | Incidence | Mortality | Day of onset mean± SD | Maximum clinical score median (25–75%) | Cumulative clinical score mean± SD | Weight Baseline (gr) | Weight Pre-immunization | Weight Post-immunization |
|---|---|---|---|---|---|---|---|---|---|---|
| 1 | IF | 10 | 7/10 | 0/10 | 21.5 ± 3*** | 4 (0–4) | 21.2 ± 17.6*** | 17.2 ± 0.8 | 16.5 ± 0.7** | 14.9 ± 1.7** |
| Ad libitum | 10 | 10/10 | 0/10 | 12.6 ± 2.3 | 4 (3.75–4) | 58.6 ± 13 | 16.8 ± 1.2 | 18.7 ± 1.2 | 17.7 ± 2.1 | |
| 2 | IF | 10 | 4/10 | 0/10 | 14 ± 1.1 | 0 (0–3.62) | 4.1 ± 6.2* | 18.3 ± 1.6 | 19.6 ± 1.5 | 17.1 ± 2.2 |
| Ad libitum | 10 | 8/10 | 0/10 | 11.3 ± 2.1 | 4 (2.25–4) | 13.9 ± 9.9 | 18.2 ± 1.7 | 19.7 ± 1.5 | 19.3 ± 2.3 | |
| 3 | IF | 10 | 2/10** | 0/10 | 19.5 ± 2.1 | 0 (0–0.87)** | 3.2 ± 6.9** | 17.7 ± 1.1 | 18.1 ± 1.2* | 19.6 ± 2.1 |
| Ad libitum | 10 | 9/10 | 0/10 | 17.2 ± 4.5 | 4 (3–4) | 22.5 ± 17 | 17.6 ± 0.9 | 19.6 ± 1 | 18.6 ± 2.6 | |
| 4 | IF | 10 | 6/10 | 1/10 | 22 ± 3.2 | 3.5 (2–4) | 2.1 ± 2.9* | 18.2 ± 1.2 | 18 ± 1.3** | 19.2 ± 2.4 |
| Ad libitum | 10 | 10/10 | 1/10 | 19.3 ± 4.2 | 4 (3.75–4) | 13.3 ± 11.4 | 19.4 ± 0.7 | 20.8 ± 1 | 18.5 ± 3.8 |
Incidence is reported as number of mice that developed EAE in each individual experiments (n=10/group in all experiments); mortality is reported as number of mice that died from EAE per group. Each individual experiment had a different duration; cumulative clinical scores were calculated for all mice over 30 days in Exp. #1, 17 days in Exp. #2, 24 days in Exp. #3 and 22 days in Exp. #4. Weights were measured after a day of fasting. Reported values are means ± SD.
P≤0.05;
P≤0.005;
P≤ 0.0005 by Mann-Whitney test or Fisher’s exact test (for incidence analyses).
Figure 1. Intermittent fasting (IF) ameliorates EAE clinical course and pathology.
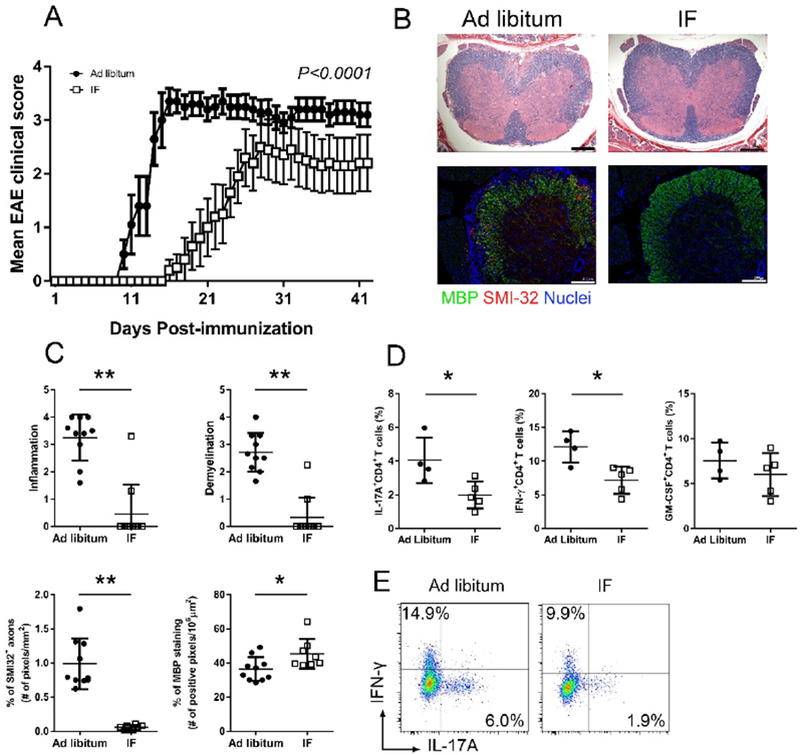
C57BL/6 mice underwent IF or were fed ad libitum (control group) for a month before immunization (n=10/group). (A) EAE clinical course of a representative experiment (dots represent the mean clinical scores for all 10 mice in each group, error bars are SEM.; P<0.0001 by two-way ANOVA). Four EAE experiments were performed with similar results. (B) Spinal cord pathology: the upper panel shows a histological staining (solochrome cyanine) for myelin (in blue) and the lower panel is an immuno-staining for SMI-32+ damaged axons (in red) and MBP (in green). (C) Quantification of inflammation, demyelination (evaluated by histology and MBP staining) and axonal damage (evaluated by SMI-32+ staining) in the spinal cord in the two groups (n=10/group) on day 26 post-immunization. Each dot represents a mouse and the bars are means ± SD. (D) Percentages of CD4+ T cells producing IL-17A, IFN-γ and GM-CSF measured by flow cytometry in lymph nodes draining the immunization site on day 6 post-immunization. Each dot represents a mouse and the bars are means ± SD. This is one of three different experiments performed with similar results (n=4–5/group in each experiment; Table S2 reports the results of all experiments performed). (E) Representative flow-cytometry plots for T cell production of IL-17A and IFN-γ in CD4+ T cells isolated from the draining lymph nodes at day 6 post-immunization in the two groups. * P<0.05; ** P<0.005. All P values were calculated by Mann-Whitney test.
IF ameliorated EAE pathology and inhibited production of pro-inflammatory T cell cytokines
In accord with the reduced clinical severity, mice in the IF group had less inflammatory cell infiltration and demyelination (evaluated by histology and myelin basic protein staining) in the spinal cord (site of most pathology in the model). SMI-32+ damaged axons were reduced in the spinal cord in the IF group (Figure 1B–C). CNS inflammation in EAE is driven by T cells activated in the peripheral lymph nodes draining immunization sites. CD4+ T cells from draining lymph nodes in IF-treated mice produced less IL-17A and IFN-γ (P<0.05), cytokines relevant in EAE pathogenesis (Jager et al., 2009). A trend toward reduced production of GM-CSF, another cytokine that is pathogenic in EAE (Codarri et al., 2011) was noted in the IF group (Figure 1D–E; Table S2). Overall, IF reduced EAE clinical severity and CNS pathology, along with immunomodulation characterized by reduced T cell production of pathogenic cytokines.
IF led to significant changes in serum levels of adipokines, corticosterone and ketones.
Serum was collected from mice at baseline (before starting IF-T1), after 4 weeks of IF or ad libitum diet (before immunization-T2) and during clinical EAE [day 18–20 post-immunization (pi)-T3] after a fasting day. Baseline levels of corticosterone, leptin and adiponectin, each measured by ELISA, were not different in the two groups. Serum leptin levels were significantly decreased in the IF group after 4 weeks (T2) of IF [IF vs.ad libitum, respectively: 1.3 ± 0.6 (SD) and 3.6 ± 1.7 ng/ml; P=0.008], but were not significantly different between the 2 groups during clinical EAE (Figure 2A). Adiponectin levels were increased in the IF group vs. ad libitum (28,425 ± 3107 and 14,865 ± 4,900 ng/ml, respectively; P=0.007) at T2 before immunization (Figure 2B). Analyses for leptin and adiponectin were also performed controlling for body weights with similar results. Corticosterone levels were higher in the IF group before immunization (T2: 172 ± 89 vs. 62 ± 51ng/ml in the IF and ad libitum groups, respectively) and during EAE (T3: 270 ± 111 vs. 147 ± 46 ng/ml) (Figure 2C). Serum levels of ketones were measured because they were expected to change with IF and possibly to impact EAE (Kim et al., 2012). Beta-hydroxybutyrate was dramatically increased in mice on IF compared to those on an ad libitum diet at both T2 and T3 (1.8 ± 0.2 vs. 0.2 ± 0.1 mM and 1 ± 0.4 vs. 0.1 ± 0.08 mM, respectively) (Figure 2D). We have also performed measurements in serum samples collected at 4 weeks on the intervention after a feeding day with changes that were comparable to after fasting for all analytes, but for leptin and corticosterone that were decreased and increased respectively, only after a fasting day and not after a feeding day (Figure S3).
Figure 2. IF was associated with decreased leptin and increased adiponectin, corticosterone and β-hydroxybutyrate.
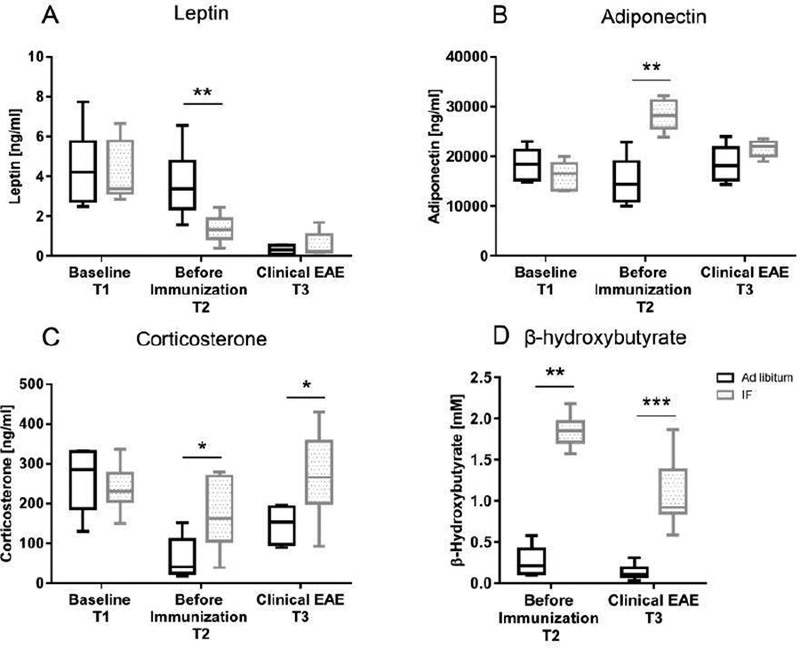
Serum levels of (A) leptin (n=6/group), (B) adiponectin (n=5/group), (C) corticosterone (n=6/group) and (D) β-hydroxybutyrate (n=10/group) were measured by ELISA at different time points during the experiment: baseline before starting the diet (IF or ad libitum feeding-T1), after 4 weeks on the diet but before immunization (T2), during clinical EAE (day 18–20 post-immunization-T3). The box in the graphs extends from the 25th to 75th % percentiles, the bars are median, the whiskers indicate the smallest and largest values. Measurements for leptin, adiponectin and corticosterone were performed in 3 different experiments with similar results (Table S2 reports the results of all experiments performed); β−hydroxybutyrate was measured in 2 different experiments with similar results. In the ELISA assays each sample was run in duplicate. * P<0.05; ** P<0.005, *** P<0.0005. All P values were calculated by Mann-Whitney test.
IF increased diversity and alters composition of the gut microbiome.
Stool samples were collected at the time points T1, T2 and T3. No significant differences in the gut microbiota from the 16S rRNA gene sequencing were seen at baseline between the two groups (Figure 3A–T1). The gut microbiota were significantly different in the two groups at T2 and T3 (18 days pi; Figure 3A-T2, T3) (P<0.01 by PERMANOVA analysis). Richness is a measure of alpha diversity for microbial community (Lozupone and Knight, 2008). It reflects complexity of a microbial community with higher diversity being associated with healthier gut microbiome (Chang et al., 2008; Heiman and Greenway, 2016; Le Chatelier et al., 2013; Turnbaugh et al., 2006). Bacterial richness was not significantly different at baseline (T1) between groups. In the ad libitum group, diversity did not change significantly over the three time points. In contrast, IF increased diversity at the T2 and T3 time (Figure 3B, P<0.05 by mixed linear regression, and Figure S4). Gut microbiota might modulate systemic metabolic responses (Sonnenburg and Backhed, 2016). Indeed, blood leptin levels in the IF and ad libitum groups were negatively correlated with gut microbiome diversity (r=−0.51, P<0.005, Pearson correlation; Figure 3C), consistent with a previous study (Le Chatelier et al., 2013). Adiponectin levels showed a trend toward a positive association with gut microbiome diversity, but did not reach statistical significance (data not shown).
Figure 3. IF increases diversity and has a profound effect on gut microbiome composition.
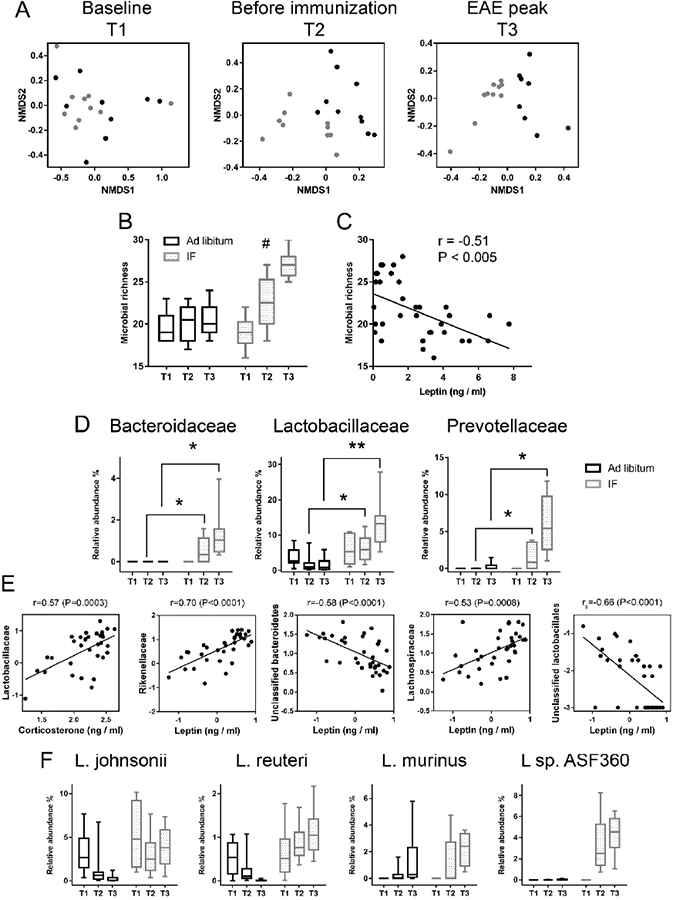
Stool samples were collected from the IF and ad libitum groups at T1 (baseline, n=10 in the IF group, n=9 in the ad libitum group), T2 (after 4 weeks on the diet, prior to immunization, n=9 in IF, n=10 in ad libitum) and T3 (clinical EAE, n=10 in IF, n=8 in ad libitum). (A) Non-metric multidimensional scaling (NMDS) plots illustrate microbiome similarity in IF and ad libitum groups (each dot is one sample; X-axis and Y-axis are first and second dimension of microbiome data). At T1, samples from two groups intermingled, indicating similar microbiome (P>0.05, PERMANOVA test). At T2 and T3, samples from the two groups clustered separately, indicating two distinct microbiome communities (P<0.05, PERMANOVA test). (B) Richness is a measure of alpha diversity for microbial community. Bacterial richness increased significantly over the three time points in the IF group, but not in the ad libitum group (linear mixed regression #P<0.05; Y-axis is number of different bacteria families); (C) Blood leptin level was negatively correlated with bacterial richness (r=−0.51; P<0.005, Pearson correlation). (D) Bacterial families with significantly different relative abundance between the two groups at T2 and T3. Reported here only those bacterial families with the same direction of difference at T2 and T3 between the two groups. Y-axis is the relative abundance of the bacterial family (q<0.05, ANCOVA). * q<0.05; ** q<0.01. (E) Pearson or Spearman correlations of corticosterone or leptin and microbiome (data were log transformed). All samples from IF and ad libitum groups are included. (F) Different trajectories of Lactobacillus species in the IF and ad libitum groups were seen over the three time points. In the IF group, L. sp are significantly higher at the T2 and T3 time points (P<0.05, linear mixed regression). In b-d, IF is in grey and ad libitum in black.
Next, the specific taxa that were differentially represented in IF and ad libitum groups were identified. Several families displayed significantly different abundance in the two groups at T2 and/or T3 (Figure S5). Among these, the abundance of the Bacteroidaceae, Lactobacillaceae and Prevotellaceae microbial families increased in the IF compared to the ad libitum group at T2, 4 weeks on the specific diet (q=0.05, q=0.04 and q=0.05 for Bacteroidaceae, Lactobacillaceae and Prevotellaceae, respectively) and even more striking during clinical EAE (T3: q=0.02, q=0.006 and q=0.006 for Bacteroidaceae, Lactobacillaceae and Prevotellaceae, respectively) (Figure 3D). The abundance of these microbes did not differ between groups at baseline. Serum corticosterone levels correlated positively with the abundance of Lactobacillaceae. Unclassified Lactobacillaceae and Bacteroidetes were negatively associated with leptin level, while serum leptin levels were positively correlated with the abundance of Rikenellaceae and Lachnospiraceae (Figure 3E). Probiotic strains, such as Lactobacillus species, have been shown to lessen EAE severity (Stanisavljevic et al., 2016). Although not all the bacteria can be classified to the species level using 16S rRNA gene sequencing, the hypervariable regions of 16S gene allow distinction of different species in Lactobacillaceae (Ravel et al., 2011). Lactobacillaceae species that were over-represented in the IF samples were L. Johnsonii, L. Reuteri, L. Murinus and L sp. ASF360, identified by aligning the Lactobacillaceae sequence to NCBI database (with >99% identity and 100% coverage). Strikingly, the relative abundance of the four Lactobacillus species showed different trajectories over the T1, T2 and T3 time points between the two diet groups (Figure 3F). Specifically, the relative abundances of the Lactobacillus species (except L. Murinus) decreased or remained the same in the ad libitum group, but increased in the IF group, especially L sp. ASF360. Bacteroides Fragilis was reported to be protective in EAE (Ochoa-Reparaz et al., 2010). No B. Fragilis was found in the samples. However, B. Caecimuris, a major species in the Bacteroidaceae family was undetectable at T1 in either group while it increased to 0.4% and 0.9% (median relative abundance) at T2 and T3 in the IF group, respectively, while remaining undetectable in the ad libitum group. These species classification was further supported by our whole genome shotgun sequencing (mWGS) (n=5 mice/group, at T3). In addition, mWGS data revealed that Bifidobacterium Pseudolongum in IF was more than twice as abundant in the ad libitum group at T3 (2.1 % vs 0.8%). 16S sequencing did not identify Bifidobacterium, likely because of the 16S primers bias towards its underrepresentation (Torrazza et al., 2013). Overall, IF had a profound impact on the gut microbiome composition and abundance, with particular enrichment of beneficial bacteria, which are also used as probiotics.
IF alters metabolic pathways of the gut microbiome
The gut microbiome is involved in nutrient absorption, metabolism and storage. mWGS of the gut microbiome allows for characterization of bacterial metabolic pathways to infer the functional potential of the whole stool bacterial community. Here, mWGS reads from two groups at T3 were mapped to the KEGG database to determine the metabolic potential. Twenty-seven metabolic pathways implicated in carbohydrate metabolism, lipid metabolism and amino acid metabolism were differentially represented in the microbiome between IF and ad libitum diet groups (LEfSe, P<0.01; Figure 4). Eleven of these pathways were enriched in stool samples of intermittently fasted mice vs. the ad libitum group. Interestingly, IF was associated with increased relative abundance of the synthesis and degradation of ketone bodies (ko00072) and glutathione metabolism (ko00480) pathways suggesting that IF might modulate the anti-oxidant signaling pathway of the gut microbiome which in turn could also affect the host. Sixteen pathways were less represented in stool samples of IF mice and these were mainly implicated in metabolism of cofactors and vitamins. Notably, the Lipopolysaccharide_biosynthesis pathway (ko00540) was significantly decreased in the IF group which could potentially benefit EAE, through less stimulation of innate immune system.
Figure 4. IF results in significantly different metabolic pathways in the gut microbiome.
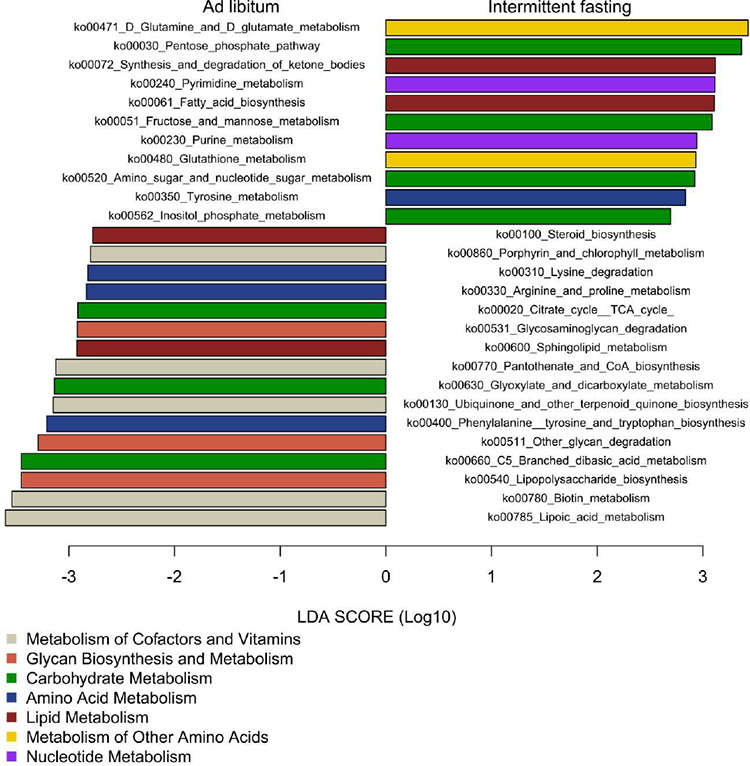
Metagenomic whole genome shotgun was performed for stool samples collected at T3 in each group (n=5/group). A linear discriminate analysis (LDA) was conducted to identify differentially represented pathways in the two groups. Pathways with LDA score >2.5 (x-axis) and P<0.01 are shown. The right side of the figure represents pathways whose abundance was significantly higher in IF group. The left side of the figure represents pathways whose abundance was significantly higher in the ad libitum group. The absolute LDA value is the effect size between two groups for a particular pathway. The color of the bar represents main metabolic functions to which the different pathways belong to as indicated in the legend.
Fecal microbiota transplantation (FMT) from IF mice to naive recipients ameliorates EAE clinical course.
The mechanisms by which IF decreases the severity of EAE is not fully understood. FMT experiments were performed to test the hypothesis that EAE amelioration by IF may, at least in part, be mediated by changes in the gut microbiota. Fecal matter from mice on IF or ad libitum were transferred by oral gavage into antibiotic-treated recipients, which were subsequently immunized to induce EAE. Overall disease severity and spinal cord pathology were significantly reduced in recipients of FMT from the IF mice compared to recipients of FMT from ad libitum fed mice (Figure 5A–C). Thus, modulation of the gut microbiome likely plays a mechanistic role in the beneficial effects of IF in EAE.
Figure 5. Fecal microbiota transplantation (FMT) from mice on IF is protective in EAE.
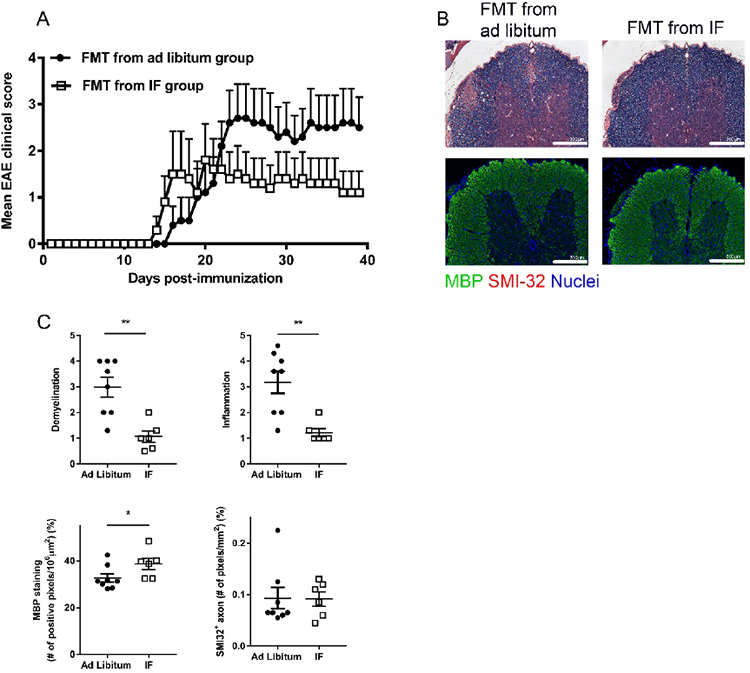
Mice were pre-treated with an antibiotic cocktail for a week, and then subjected to FMT from donor mice that were on IF (for 4 weeks) or fed ad libitum. FMT was administered for a week before and a week after EAE immunization. (A) EAE clinical course in mice transferred with fecal matters from mice on IF or fed ad libitum. Shown is one representative experiment out of two performed with similar results (each dot represent the mean clinical scores for all 5 mice in each group; error bars are SEM.; P<0.0001 by two-way ANOVA; Table S2 reports clinical characteristics for the two experiments performed). (B) Spinal cord pathology: the upper panel shows histological staining (solochrome cyanine) for myelin (in blue) and the lower panel shows immuno-staining for SMI-32+ damaged axons (in red) and MBP (in green). (C) Quantification of inflammation, demyelination (evaluated by histology and MBP staining) and axonal damage (evaluated by SMI-32+ staining) in the spinal cord in the two groups (n=10/group). Each dot represents a mouse and the bars are means ± SD.
IF reduced the proportion of IL-17-producing T cells and increased Tregs in gut-associated lymphoid tissues.
Gut microbiota are believed to directly influence immune cells residing in the gut lamina propria (Ivanov and Littman, 2010) which may in turn modulate local and systemic immune responses, including in EAE (Gaboriau-Routhiau et al., 2009; Lee et al., 2011). IL-17-producing T cells and T regs normally reside in the intestinal lamina propria (Atarashi et al., 2011; Ivanov and Littman, 2010). Thus, phenotype and cytokine profiles of small-intestine lamina propria (SI LP) T cells were characterized after 4 weeks on IF versus ad libitum diet. Numbers of CD4+ and CD8+ T cells and level of CD44 expression on effector T cells in the SI LP were not different between the 2 groups (data not shown). However, the proportion of Th17 CD4+ cells in the SI LP from the IF group was reduced vs. the ad libitum group (Figure 6A). No significant differences were noted in the percentages of GM-CSF and IFN-γ producing CD4+ T cells. Assay of CD4+CD25+ Foxp3+ Tregs in the SI LP and mesenteric lymph nodes (MLN) at T2 (Figure 6B–C) revealed significantly increased proportions of Tregs in SI LPL and PLN of the IF group (Figure 6B–C). A trend towards increased percentages of Tregs in MLN of IF mice was noted, whereas no significant differences were seen in the spleen (Figure 6C).
Figure 6. Reduced proportion of IL-17- producing T cells and increased proportion of Tregs in the gut lamina propria after 4 weeks of IF.
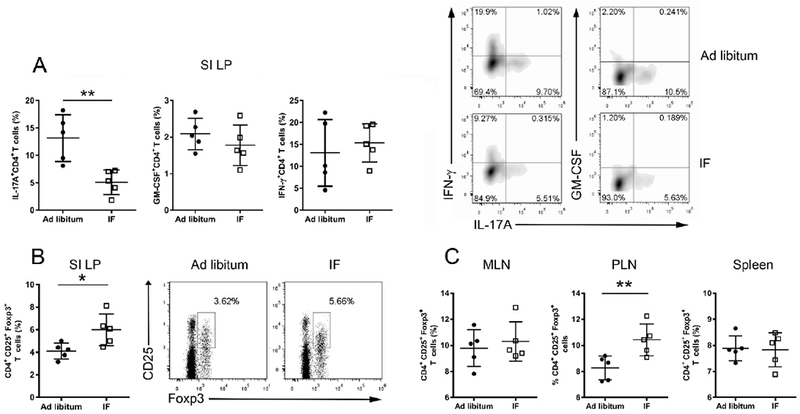
(A) Intracellular cytokine production by CD4+ T cells in the small intestine lamina propria (SI LP) after 4 weeks on IF or normal ad libitum analyzed by flow cytometry. (B) Proportion of T regs in the SI LP in the 2 groups. Representative flow cytometry plots for one mouse/group are shown on the right panel. (C) Proportion of Tregs in mesenteric lymph nodes (MLN), peripheral lymph nodes (PLN) and spleen. Each dot represents a mouse, bars are mean ± SD. These results are from one experiment out of two (in A) or three (in B-C) performed with similar results (Table S2 reports the results of all experiments performed). * P<0.05; ** P<0.005, ***P<0.0005. All P values were calculated by Mann-Whitney test.
Translation to MS: a randomized controlled trial of IF in subjects with RRMS.
Based on our beneficial results using CR and IF in murine EAE, we initiated a small randomized controlled pilot trial to examine the effects on laboratory and clinical measures of IF in RRMS patients. Goals of this pilot study were to assess safety, feasibility and compliance with IF in MS patients and to obtain preliminary data on IF effects on blood adipokine levels and other metabolic or immune-inflammatory markers in RRMS patients. Seventeen MS subjects undergoing relapse were enrolled and randomized 50:50 to IF vs. ad libitum control diet between 2014 and 2016, of which sixteen completed the trial (one person randomized to control diet withdrew). The groups were similar with no significant differences in age, race, body mass index (BMI) and expanded disability status scale (EDSS) (Table 2). IF was well tolerated; no person in the IF group dropped out. The average number of days that the subjects in the IF group fasted was 6 ± 1 (SD) days of the 7 intended during the 2 study weeks [86 ± 17 (SD) % adherence to the diet] based on the dietary recall diary. No safety concerns were uncovered by routine complete blood count (CBC) and comprehensive metabolic panel (CMP) testing. We observed an increase of white blood cells, mainly driven by an increase in neutrophils on day 15 compared to baseline in both groups which was expected given the steroid treatment. Furthermore, there was a significant difference in BMIs on day 15 in the two groups after controlling for baseline BMI (P=0.03 by ANCOVA). Expanded disability status scale (EDSS) improvement was seen in both groups (likely due to both natural recovery and corticosteroid treatment of the MS relapse) without any significant difference in the degree of amelioration. No significant differences between the groups were observed for changes in the multiple sclerosis functional composite (MSFC, which components are the 25-foot timed walk, paced auditory serial addition test and the 9-hole peg test) and the symbol digit modality test (SDMT), which was expected for a small patient-unblinded trial of short duration.
Table 2.
Baseline characteristics of MS patients enrolled in the IF study.
| AD LIBITUM | INTERMITTENT FASTING | P value | ||
|---|---|---|---|---|
| Number | 8 | 8 | ||
| Demographic characteristics | ||||
| Age, y, mean±SD | 42 ± 8.2 | 40 ± 12 | 0.7 | |
| Gender, F:M | 7:1 | 5:3 | 0.2 | |
| Race, Caucasian : African American | 1:7 | 1:7 | ||
| Antropometric characteristics | ||||
| BMI, kg/m2, mean±SD | 31.2 ± 6.4 | 30.2 ± 5.8 | 0.7 | |
| Waist circumference, cm, mean±SD | 106.6 ± 13.7 | 96.9 ± 10.2 | 0.2 | |
| Clinical characteristic | ||||
| Disease duration (years; mean±SD) | 8.5 ± 8.1 | 7.8 ± 6.4 | 0.8 | |
| EDSS, median (25th-75th percentile) | 3.7 (2.7–5.2) | 3.7 (3.2–4) | 0.5 | |
| Annual relapse rate (2y before entry) | 0.6 (0.5) | 0.75 (0.7) | 0.5 | |
| DMT: | ||||
| Interferon beta | 1 | 3 | ||
| Fingolimod | 1 | 1 | ||
| Tecfidera | 0 | 1 | ||
| Aubagio | 1 | 0 | ||
| None | 5 | 3 | ||
| Steroids given at the relapse: | ||||
| iv steroids (3 days) and oral taper (7 days) | 2 | 2 | ||
| oral steroids (dexamethasone or prednisone-10 days) | 6 | 6 | ||
| PASAT, median (25th-75th percentile) | 53 (39–57) | 38 (24–52.5) | 0.2 | |
| 25FTW, sec, median (25th-75th percentile) | 5.7 (5.1–8.1) | 7.3 (5.1–8.9) | 0.6 | |
| 9HPT, sec, median (25th-75th percentile) | ||||
| Dominant hand | 24.6 (17.8–61) | 23.3 (20.6–32.2) | 0.3 | |
| Non dominant hand | 22.1 (16.1–24.9) | 22.6 (19.6–30.1) | 0.3 | |
| SDMT median (25th-75th percentile) | 36.5 (27.2–65.2) | 42.5 (34.7–54) | 0.9 |
Abbreviations: BMI=Body Mass Index; EDSS=Expanded Disability Status Scale; DMT= Disease Modifying Therapies; PASAT= Paced Auditory Serial Addition Test; 25FTW= 25-Foot Timed Walk reported as the mean of the 2 trials/subject; 9HPT=9-Hole Peg Test reported as the mean of 2 trials for each hand; SDMT=Symbol Digit Modalities Test.
Effects of IF on serum adipokines and other metabolites
Differences in serum metabolites at day 15 between the IF and control groups were assessed after controlling for baseline (day 1) levels and change in BMI, focusing on metabolites altered by IF in the EAE studies. These included leptin, adiponectin, and β-hydroxybutyrate. Cortisol was not measured, since all patients were being treated with corticosteroids. IF group showed reduced leptin levels at day 15 compared to baseline, where a significantly greater reduction of leptin levels at day 15 was observed in the IF group (P=0.006) after adjusting for baseline levels and change in BMI (Figure 7A; Table 3). Adiponectin levels increased in both groups; no significant difference between the IF and the ad libitum group was detected (P=0.46). No effect of intermittent low calorie intake on β-hydroxybutyrate was seen after adjusting for baseline and change in BMI (Table 3). This was not unexpected given that it takes multiple consecutive days of low carbohydrate intake to increase serum levels of ketone bodies in humans (Cahill et al., 1966).
Figure 7. Changes of blood metabolites and the gut microbiome after 15 days of IF in RRMS patients.
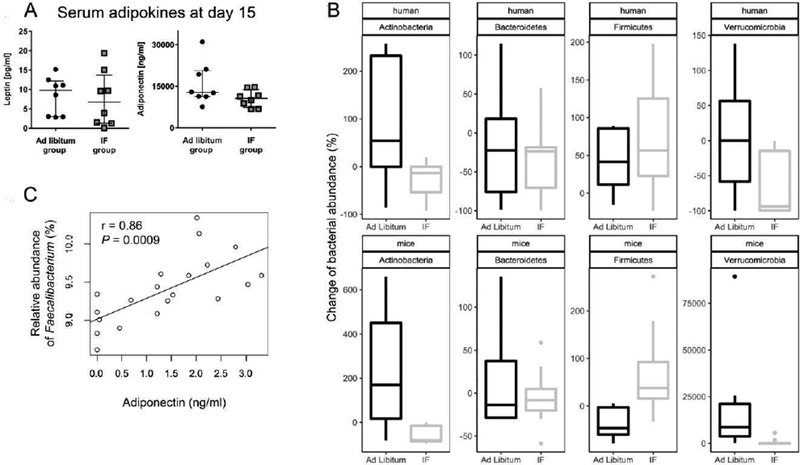
(A) Comparison of serum levels of leptin and adiponectin on day 15 in RRMS patients in the IF and ad libitum groups in the human trial. (B) At phylum level, the alteration of the gut microbiome after IF for 15 days in RRMS patients (n=5 patients/group, top panel) shows similar trends as that in mice (n=8 mice/group, bottom panel). Y-axis represents the percentage of change of the relative abundance of the gut microbiome. In human studies, the percentage change is calculated based on the microbial abundance at baseline and day 15. In mouse studies, the percent change is calculated based on the microbial abundance on T2 and T3. (c) Levels of serum adiponectin are strongly positively correlated with the relative abundance of Faecalibacterium in the MS study participants (r=0.86, P=0.009 Pearson correlation).
Table 3.
Baseline and day 15 BMI and serum levels of adipokines and β-hydroxybutyrate in the human IF study.
| Ad libitum | IF | ||||||
|---|---|---|---|---|---|---|---|
| N | Baseline | Day 15 | N | Baseline | Day 15 | P value * | |
| BMI (Kg/m2), mean ± SD | 8 | 31.2 ± 6.4 | 31.1 ± 6.5 | 8 | 30.2 ± 5.8 | 29.1 ± 5.3 | 0.03 |
| Serum analyte, mean ± SD | |||||||
| Leptin (ng/ml) | 8 | 11.3 ± 7.7 | 8.9 ± 4.4 | 8 | 13.6 ± 12.9 | 7.5 ± 7 | 0.006 |
| Adiponectin (mg/ml) mean ± SD | 8 | 11.9 ± 6.1 | 15.9 ± 7.5 | 8 | 8.9 ± 2.9 | 10.5 ± 3 | 0.45 |
| β-hydroxybutyrate mM | 8 | 0.27 ± 0.1 | 0.22 ± 0.04 | 8 | 0.21 ± 0.05 | 0.24 ± 0.04 | 0.94 |
Values are means ± SD;
Comparisons on day 15 were conducted using an analysis of covariance: (i) for BMI after controlling for baseline BMI values; (ii) for serum analytes after controlling for baseline serum levels and change in BMI.
Effects of IF on peripheral blood leukocytes
At baseline and day 15, blood was also collected to better characterize any possible effects of IF on circulating immune cell subsets including naïve and memory T lymphocytes, B lymphocytes, monocytes, NK cells, myeloid and plasmocytoid dendritic cells and Tregs (Table S3). Absolute numbers of T and B lymphocytes increased on day 15 in the ad libitum control diet group, whereas in the IF group, absolute numbers of T and B cells were stable or decreased compared to baseline. B cell numbers were statistically significantly different between the two groups (P=0.02) and some suggestion for a difference in CD4+ and CD8+ T cells (P=0.07 and 0.08, respectively) were observed. This effect seemed to be mainly driven by changes in the numbers of naïve CD4+ and CD8+ T cells which on day 15 were lower in the IF groups compared to the ad libitum group, with a difference that was statistically significant for the CD4+ (P=0.04) and close to for CD8+ (P=0.07). Absolute counts of circulating T regs were unchanged between the 2 groups at day 15, although the percentage of Treg decreased slightly in the control group, but remained stable in the IF group leading to a significant difference on day 15 between the two groups (P=0.03). Interestingly, in vitro functional studies of T regs on day 15 showed significant more suppression of effector T cell proliferation at different Teff:Treg ratios in the IF compared to the ad libitum group (P=0.012 by two-way ANOVA), while no difference were noted at baseline (P=0.18; Figure S6). No differences in memory and effector T cells and the other immune cell subsets between the two groups on day 15 were noted (Table S3).
IF-induced gut microbiome changes in RRMS patients recapitulate observations in EAE.
Stool samples were collected from the MS patients in the control and IF groups at baseline and 15 days after IF. Mice and humans harbor different gut microbiomes at lower taxonomic levels, but the vast majority of the microbes in both species belong to two phyla, Bacteroidetes and Firmicutes (Dethlefsen et al., 2007). Less abundant, Actinobacteria and Verrucomicrobia are also shared by mouse and human. Change of the relative abundances of four phyla in mice undergoing IF and in RRMS patients after 15 days of IF were compared. Similar directions of relative abundance changes of the four phyla were observed in mice and humans with IF (Figure 7B). It should be noted that corticosteroid treatment in the human study may have influenced the changes in gut microbiome observed. However, the magnitude of change was much lower in corticosteroid group than IF plus corticosteroid. No bacteria were significantly different at day 15 between the two groups, but the abundance of Faecalibacterium, Lachnospiracea_incertae_sedis and Blautia showed an increasing trend after 15 days of IF. Moreover, Faecalibacterium was strongly correlated with the level of adiponectin in blood (r=0.86, P=0.0009) (Figure 7C).
DISCUSSION
Only recently have humans had constant access to food. Early in human evolution, people ate only intermittently. Hundreds of studies have shown that CR without malnutrition exerts a strong anti-inflammatory and immunomodulatory effect. Neuroprotective and anti-inflammatory effects of IF were shown in animal models of stroke (Arumugam et al., 2010) and systemic infection (Vasconcelos et al., 2014) as well as in humans with inflammatory systemic conditions (Johnson et al., 2007). However, few reports address the effects of IF on immune function and autoimmune diseases such as MS. In studies herein, we show that IF reduced inflammation, demyelination and axonal damage in murine EAE which is in agreement with previous reports (Kafami et al., 2010; Razeghi Jahromi et al., 2016). Immune cells from peripheral lymph nodes had reduced antigen-specific immune responses and reduced pro-inflammatory cytokine production. In addition, IF affected the composition of T cells in the gut lamina propria with a reduction of IL-17 producing T cells and increased numbers of Tregs. IF increased gut bacteria richness and activated microbial metabolic pathways that modulate systemic immune responses. Importantly, we found that transplantation of microbiota from mice on IF into immunized recipient mice reduced myelin antigen-specific lymphocyte proliferation and EAE severity in the normal chow-fed recipients. These data strongly suggest that IF-induced changes in the gut microbiome can mediate a systemic immunomodulatory response to myelin antigens in vivo.
Microbiota transplantation from mice on IF into normally-fed mice was able to transfer protection from EAE. This striking finding strongly supported that the beneficial effect of IF could be mediated by the gut microbiome, at least in part. FMT is an effective treatment for recurrent C. difficile infection (van Nood et al., 2013). Manipulation of the gut microbiota might also be a potential treatment for other diseases. Interestingly, a case report of FMT used to treat gastrointestinal symptoms in three MS patients was reported to improve their neurological symptoms (Borody et al., 2014).
Accumulating evidence highlights the close interplay between nutrition, metabolism and immune responses (Sonnenburg and Backhed, 2016). In a small study, treatment of the metabolic syndrome in MS patients with metformin (a CR mimetic) reduced inflammation evidenced by reduced brain MRI activity and peripheral immunological markers (Negrotto et al., 2016). Our prior work showed that chronic CR inhibited EAE, with an associated modulation of endogenous corticosteroids and systemic adipokines/cytokines (Piccio et al., 2008). In humans, chronic CR has been reported to induce similar metabolic changes, including lower concentrations of white blood cells, reduced inflammatory cytokines and leptin and increased circulating levels of cortisol and adiponectin. However, chronic CR in humans is difficult to sustain, and data from preliminary human studies suggest that IF would be a better and more physiologic option.
That nutrition plays a major role in modulating gut microbiome is well known (Muegge et al., 2011). Accumulating data implicate gut microbiota dysbiosis in the pathogenesis of several diseases, including human autoimmune diseases (Berer et al., 2011; Guinane and Cotter, 2013; Lee et al., 2011). Long-term CR has been shown to influence gut microbial community structure in mice (Zhang et al., 2013) and humans (Griffin et al., 2017). Indeed, the fecal microbiota of individuals practicing long-term CR was significantly richer and more diverse than in people eating ad libitum western diets. In the present studies we found that IF also increased bacteria richness, and that the microbiome richness was inversely correlated with circulating levels of leptin. These results are in accord with published data showing that reduced gut microbiota richness is associated with higher leptin and lower adiponectin serum levels, consistent with a pro-inflammatory systemic phenotype (Le Chatelier et al., 2013).
IF had a striking effect on gut microbiota composition with enrichment of the Bacteroidaceae, Lactobacillaceae and Prevotellaceae families. In EAE, alteration of the gut microbiota or their metabolites can modulate inflammation and demyelination (Berer et al., 2011; Lee et al., 2011). Of particular interest was the IF-induced enrichment in Lactobacilli, which are commonly used in probiotics because of their positive effects including reduction of inflammatory immune responses (Umbrello and Esposito, 2016). Oral administration of Lactobacilli with myelin antigens has been shown to induce tolerance in the EAE model (Maassen et al., 2003) and enrichment of gut microbiota with Lactobacilli has been associated with resistance to EAE (Stanisavljevic et al., 2016). In the present studies, Lactobacillus species that were over-represented in the setting of IF included L. Johnsonii and L. reuteri, which are well-known to have immunomodulatory properties (Delcenserie et al., 2008; Owaga et al., 2015). Additionally, enrichment in Prevotella family members with IF may be beneficial because of its enhancement of production of protective short chain fatty acids (SCFAs), such as butyrate (De Filippo et al., 2010). This is important because SCFAs are bacterial metabolites derived from indigestible carbohydrates that have been reported to inhibit EAE by expanding gut Tregs. In contrast, administration of long-chain fatty acids, abundant components of the western diet, worsened EAE by enhanced differentiation of pathogenic Th1 and Th17 cells (Bhutia and Ganapathy, 2015; Haghikia et al., 2015). In accord with these reports, in our mouse studies IF led to increased anti-inflammatory T regs and decreased T cells producing IL-17 and IFN-γ in the gut and systemically. These changes may be the main mechanism by which IF ameliorates EAE. Another function of the gut microbiome is to regulate host metabolism. Our mouse studies found correlations between the abundance of certain bacterial families with leptin and corticosterone levels. SCFAs derived from the gut microbiome can regulate the function of adipocytes, and subsequently affect production of adipokines such as leptin (Le Poul et al., 2003; Samuel et al., 2008; Tilg and Kaser, 2011; Xiong et al., 2004; Zaibi et al., 2010). Furthermore, in the metagenomic analysis the ketone pathway was enhanced in the gut microbiome by IF. This suggests that the gut microbiome regulates its own ketone body metabolism during fasting of the host. We could speculate that the gut microbiome may have contributed to the markedly elevated levels of serum β-hydroxybutyrate in the IF group, seen both before immunization and during clinical EAE. Notably, a ketogenic diet was reported to be neuroprotective in EAE (Kim do et al., 2012). Furthermore, the enhancement of glutathione metabolism in the gut microbiome by IF suggests modulation of the anti-oxidant signaling pathway, which could also have secondary effects on the host. In contrast, the “Lipopolysaccharide (LPS)_biosynthesis” pathway was significantly decreased in the IF group. LPS is a major component of the outer membrane in gram-negative bacteria which induces a strong pro-inflammatory innate immune response. This might promote systemic inflammation.
Manipulating the gut microbiome may offer a novel way to control autoimmune responses. Remarkably, in our small randomized, controlled study of IF in MS patients undergoing relapse, IF for only fifteen days induced changes in leptin levels and gut microbiota that were similar to what was observed in mice with EAE. Our results from the human pilot study showed a trend towards increased abundance of Faecalibacterium, and Blautia which belong to the Clostridium XIV and XIVa (in the Firmicutes phylum), shown to promote Treg accumulation in the colon (Atarashi et al., 2011), and implicated in disorders such as IBD and obesity (Fujimoto et al., 2013; Verdam et al., 2013; Walters et al., 2014). These bacteria play an important role in producing butyrate in the gut, and have been reported to be reduced in MS patients (Miyake et al., 2015). The observed increase of Clostridia clusters XIV and XIVa with IF might serve to counterbalance this reported dysbiosis in MS. The present studies observed a strong correlation between the Faecalibacterium and serum adiponectin in MS patients. Studies suggest that gram positive cell wall components stimulate adiponectin production (Taira et al., 2015). Whether the presence of Faecalibacterium in the gut microbiome has a direct or indirect role in modulation of serum adiponectin warrants further investigation. Collectively, findings from the present studies demonstrate a consistent trend in metabolic and gut microbiome changes in mice and MS patients undergoing IF, and support the translational potential of IF. Limitations of the human study include its small size, the short duration and the inability to blind the enrolled patients as to their diet assignment. Thus, it was not surprising that no differences in clinical outcomes were noted between the two diet groups. However, laboratory measurements were objective, and performed in blinded fashion. The short duration of the human study may have limited the ability to detect effects. In this initial study, we chose the time of an MS exacerbation for the IF diet intervention to somewhat mimic the EAE paradigm. However, concomitant corticosteroid treatment (of both patient groups) created an additional metabolic change. Despite the above limitations, we observed effects of IF on leptin levels and on the gut microbiome. It is possible that these results may have been spurious. They might also indicate effects of IF on metabolic biomarkers of inflammation with potential benefit in MS. These results warrant confirmation in a larger clinical study to test IF and microbiome manipulation as a potential treatment in MS.
STAR METHODS
CONTACT FOR REAGENT AND RESOURCE SHARING
Further information and requests for resources and reagents should be directed to and will be fulfilled by the Lead Contact, Laura Piccio (picciol@wustl.edu).
EXPERIMENTAL MODEL AND SUBJECT DETAILS
Animals
Female C57BL/6J mice (Jackson Labs) were housed in accordance with University and National Institutes of Health (NIH) guidelines, and animal protocols were approved by the Washington University Animal Studies Committee (study approval number: 20150105). After one week of acclimation, 7 week old female mice were randomly assigned to one of two experimental groups, IF or control fed ad libitum (n=10/group, 5 mice/cage). Both groups were fed with the regular chow (4.3% fat; PicoLab Rodent Diet 20 #5053, Purina).
IF study in RRMS patients: participants and study design
In 2014 we initiated a single-center randomized controlled pilot trial to examine the feasibility and effects of IF on laboratory and clinical measures in RRMS patients during a relapse. This project was approved by the Human Research Protection Office (HRPO) at Washington University in St. Louis (HRPO approval number: 201307106) and it was registered on www.clinicaltrials.gov (NCT02411838). Relapsing MS patients were recruited at the John L. Trotter MS Center, Washington University School of Medicine (St. Louis Missouri, USA). All subjects provided informed consent. Inclusion criteria for the study were: 1) diagnosis of RRMS (2010 McDonald criteria) (Polman et al., 2011) and experiencing a relapse as identified by their neurologist and a candidate for steroid treatment; 2) age 18–60 years; 3) a body mass index (BMI) of 23 or higher; 4) absence of ongoing diseases in other systems. Patients were excluded if treated with insulin or warfarin (who must limit intake of some vegetables) or required to follow a special diet or food restriction (e.g. diabetic, gastric bypass). Patients treated with disease modifying therapies (DMT) continued the medication during the study. Randomization was conducted using a set of random numbers and assigning even or odd numbers to one of two groups: (1) ad libitum control group in which patients received corticosteroid treatment (standard therapy for MS relapses), and continue on their regular diet for 15 days, or (2) IF group, who underwent alternate-day fasting for 15 days plus the same steroid regimen as the control group. Corticosteroid treatment for the relapse was a 10-day course of oral steroids (dexamethasone or prednisone) or 3 days of intravenous methyl prednisolone (1000mg/day) followed by 7 days of oral corticosteroid taper. After randomization, study participants, caring neurologists (LP), the principal study coordinator and the dietician knew the group assignments. The assessing neurologists (LG and AHC) and study coordinator and the laboratory personnel who analyzed the samples were blinded to the group assignment.
METHOD DETAILS
Intermittent fasting and EAE immunization
Mice in the IF group were fed every other day (food pellets were provided or removed at 9 am each day), while the control mice had unrestricted access to food. Following 4 weeks on the assigned diet, mice were immunized to induce EAE subcutaneously (sc) with 50 μg of myelin oligodendrocyte glycoprotein (MOG)35–55 (MOG aa 35–55: MEV GWY RSP FSRVVH LYR NGK; Sigma Genosys), emulsified in incomplete Freund’s adjuvant (IFA) containing 50 μg/mouse Mycobacterium tuberculosis (strain H37RA). Mice also received pertussis toxin (300 ng/mouse; List Biological Laboratories) i.v. at the time of immunization and 72 h later (Piccio et al., 2008). IF was continued after immunization and body weights were recorded (three times/week) throughout the experiment before and after immunization. Body composition was evaluated by EchoMRI at baseline and at 4 weeks of the diet intervention after a fasting or a feeding day to assess any variation based on food intake. After immunization, mice were evaluated clinically in a blinded fashion using a disease severity scale that iss scored on a 5-point scale: 0 = no disease; 1 = tail weakness; 2 = paraparesis; 3 = paraplegia; 4 = paraplegia with forelimb weakness or paralysis; 5 =moribund or dead animal, as described (Mycko et al., 2014). Clinical course in the two groups was evaluated for ≥ 17 days after immunization in four replicate EAE experiments (Table 1 and Table S1). In most experiments, serum and stool samples were collected in the morning between 9 am and 12 noon after a fasting day. In the experiment shown in Figure S3, serum samples were collected at 4 weeks on the intervention after fasting and after feeding days to compare analyte levels based on food intake.
Histological and immunohistochemistry analyses
CNS tissues were dissected from mice perfused with buffered 4% paraformaldehyde, then embedded in paraffin. Thick sections (4 μm) were placed on glass slides and stained with solochrome cyanine to stain myelin as previously described (Kiernan, 1984). Briefly, sections were stained with Eriochrome Cyanine R (Sigma), washed, differentiated in 10% iron (III) chloride (Sigma), and counter-stained with Van Gieson’s stain. Quantification of inflammation and demyelination was performed in a blinded fashion as previously reported (Piccio et al., 2013). Distributions of injured axons and demyelinated axons were identified with double-staining experiments using antibodies to nonphosphorylated neurofilaments (clone SMI-32 at 1:200; Sternberger Monoclonals) and myelin basic protein (MBP; at 1:200; Abcam), respectively. MBP and SMI-32 staining were analyzed as the percentage area of positive staining (number of positive pixels/1 mm2) within the area of interest. Images were acquired using a Nikon Eclipse 90i fluorescent and bright field microscope and analyzed for quantification with the Metamorph 7.7 software.
Fecal microbiota transplantation
Six-week-old C57BL/6 female mice were treated with a cocktail of antibiotics to deplete their gut flora and then used as recipient of fecal microbiota transplantation (FMT). Antibiotic treatment consisted of a mix of metronidazole, vancomycin, neomycin and ampicillin which were administered in the drinking water for one week (antibiotics per 1L of water: metronidazole 1 g, vancomycin 500 mg, neomycin 1g, ampicillin 1 g). In addition, 200 μl of the antibiotic mix was administered by oral gavage every other day for another week. For transplantation, fecal matter from mice maintained on IF or ad libitum for 4 weeks (donor mice) was administered by oral gavage daily for one week to the recipient mice before immunization. Briefly, one stool pellet from each donor in the cage was collected, dissolved in 2 mL of sterile PBS, centrifuged at 500 g for 30” and then the soluble fraction was administered by oral gavage (100 μl/mouse). Next, recipient mice were immunized with MOG35–55 to induce EAE and FMT was performed daily for another week after immunization. Clinical course was followed from EAE onset.
Isolation of the small intestine lamina propria (SI LP)
Small intestines of mice were dissociated by combining mechanical dissociation with enzymatic degradation using the lamina propria dissociation Kit (Miltenyi Biotec) per manufacturer’s protocol. First intraepithelial lymphocytes (IELs) were dissociated from mucosa by shaking the tissue in a predigestion solution consisting of Hank’s balanced salt solution (HBSS) with 10 mM Hepes, 5 mM EDTA, 5% fetal bovine serum, and 1 mM 1–4 dithiothreitol (DTT). Then, the SI LP tissue was enzymatically and mechanically dissociated into a single-cell suspension using the gentleMACSTM Dissociators (Miltenyi Biotec). The resulting cells were further purified using a Percoll gradient (40%/70%).
Study procedures and specimen collection in RRMS patients
After enrollment and randomization, subjects from both groups met with the dietician who collected a 7 days food recall diary. Only those subjects randomized to the IF group were instructed on the IF diet by the study dietician. During the fasting days, patients were allowed to eat one or two salads (fresh or steamed non starchy vegetables) with a light dressing, not to go over 500 calories/day following the scheme implemented by author LF in his studies. The first day of fasting for the patients in the IF groups was the second day of corticosteroid (day 2 in the study) after which they were instructed to eat no more than 500 calories every other day until day 15 when they had the second and final study visit (total of 7 days of fasting in the study). Between the 2 visits the dietician kept phone/email contact with the subjects to provide encouragement and additional instructions as needed. Patients randomized to the control group continued their regular diet and were not given any specific diet instructions. All patients provided blood and stool samples before initiating steroids (baseline/day 1 visit) and on the day 15 visit. At each visit the blood was drawn in the morning between 9 and 11 am after a 12 hour fast for patients in the control group, and after a fasting day for the patients in the IF group. Blood samples were used to perform research studies and safety analyses, including a complete blood count (CBC) and comprehensive metabolic panel (CMP). Research studies included flow cytometry analyses on fresh blood, and in vitro assays of suppression of T cell proliferation with Tregs. Aliquots of serum and stool samples from each time point were frozen at - 80° C for ELISA and gut microbiome analyses later. On day 1 and day 15 visits body weight, BMI, and waist circumference were recorded. Blinded assessing neurologist (LG and AHC) performed general physical and neurological assessments including the EDSS (Kurtzke, 1983). A blinded study coordinator administered the multiple sclerosis functional composite (MSFC) (Fischer et al., 1999) and the Symbol Digit Modality Test (SDMT) (Cutter et al., 1999; Drake et al., 2010). Adverse events and MS quality of life (MS QOL) inventory were also collected at each visit (Cella et al., 1996).
Serum ELISAs
In murine studies, serum samples were collected at baseline before starting the diet (named T1), after four weeks on the diet but before immunization (T2), and during clinical EAE (T3). Serum samples were immediately frozen and aliquoted. The levels of corticosterone (Arbor assays), adiponectin (EMD Millipore), leptin (EMD Millipore) and β-Hydroxybutyrate (Cayman Chemical Company) were determined using commercially available ELISAs. In the human study, commercially available ELISA kits were used to test serum levels of leptin (EMD Millipore), adiponectin (EMD Millipore), and β - Hydroxybutyrate (Cayman Chemical Company).
Flow cytometry analyses
In mouse studies, cells isolated from murine peripheral lymph nodes, spleen and SI LP were stained by flow cytometry using antibodies to CD4 (Biolegend), CD3 (Biolegend), and CD45 (Biolegend), CD62L (eBioscience), CD25 (Biolegend), CD44 (eBioscience), CD8 (Biolegend), FoxP3 (eBioscience) and the survival marker Zombie Dye for 25 min at 4°C. Next, the samples were washed, and analyzed on the Gallios Flow Cytometer. Staining for intracellular cytokines encompassed anti-mouse antibodies to IL-17A (Biolegend), IL-10 (Biolegend), GM-CSF (Biolegend) and IFN-γ (Biolegend). Isolated cells were incubated in 96 well-plates for 5–6 hours with 50 ng/ml of PMA and 750 ng/ml of Ionomicin (both from Sigma) and Monensin (eBioscience) at 37°C. Surface staining was performed for 25 min at 4°C. Subsequently, cells were fixed in 2% PFA for 10 min at room temperature (RT) and then permeabilized in saponin buffer for another 10 min at RT. Cytokine staining was performed in permeabilization buffer for 25 min at 4 °C. Samples were run on the Gallios Flow Cytometer and data were analyzed using Kaluza 1.3 (BeckmanCoulter). Dead cells were excluded using zombie acqua (Biolegend). Analysis was done gating based on forward and side scatter, singlets and then on live and CD45+ cells. Specific markers were used to identify T cells (CD3+ and CD4+ or CD8+), naïve (CD62L+CD44−), memory, (CD62L+CD44+) and effector CD4+ or CD8+ T cells (CD62L−CD44+). Regulatory T cells were identified by staining for surface markers CD3, CD4 and CD25, and for intracellular FoxP3 using a kit (eBioscience). In human studies, flow cytometry analyses were performed using anti-human antibodies to BDCA-2 (Biolegend), BDCA-4 (Biolegend), Lin 1 (eBioscience), CD86 (BD Pharmigen), CD1c (Biolegend), HLA-DR (BeckmanCoulter), CCR6 (eBioscience), CD56 (eBioscience), CD4 (BeckmanCoulter), CD14 (eBioscience), CD19 (Biolegend), CD8 (BeckmanCoulter), CD39 (BD Pharmigen), CD25 (Biolegend), Foxp3 (Biolegend), CD45RA (BD Pharmigen), CD45RO (BD Pharmigen), CD62L (eBioscience), CCR7 (BD Pharmigen) and 7-aminoactinomycin (7-AAD) (BD Pharmigen) starting from 100 μl of heparinized whole human blood which was incubated with the antibodies for 30 min at RT. Subsequently, samples were fixed and lysed with Step Fix/Lyse Solution (Affimetrix, eBioscience) for 30 minutes at RT. FoxP3 intracellular staining in human whole blood was performed using PerFix-nc Kit (Beckman Coulter) according to manufacturer instructions. To calculate absolute cell numbers, 100 microliters of 123count eBeads solution (Affimetrix, eBioscience) were added to each sample before flow cytometric analysis according to manufacture instructions. 7-AAD was used as viability marker only for surface staining. All the samples were run on the Gallios Flow Cytometer. For analysis, cells were first gated on lymphocyte-monocyte population, alive cells and then specific markers were used to define the different peripheral blood immune cell subsets including: T lymphocytes (CD3+CD4+ or CD8+), naïve T lymphocytes (CD45RA+CCR7+), central memory T lymphocytes (CD45RA+CCR7−), effector memory T lymphocytes (CD45RA−CCR7−), myeloid dendritic cells (Lin1−HLA-DR+CD1c+BDCA2−), plasmacytoid cells (Lin1−HLA-DR+BDCA2+BDCA4+), monocytes (CD3−CD14+), natural killer cells (CD3−CD56high/low) and Tregs (CD4+CD25+FoxP3+).
Treg functional assays
Heparinized blood was collected from MS patients, and peripheral blood mononuclear cells (PBMCs) were isolated on ficoll density gradient. Tregs were obtained by magnetic bead isolation (Miltenyi) for CD4+CD25+CD127dim/- cells (purity > 98%). Effector CD4+ CD25− T cells (Teff) were separated by magnetic bead isolation (Miltenyi) (purity > 95%) and co-cultured with sorted Treg cells at a 2:1, 4:1, 8:1 ratios (Teff:Tregs). Teff cells were activated with plate bound anti-CD3 (10 μg/ml) and anti-CD28 (10 μg/μl-eBioscience) in RPMI 1460 containing 5% autologous serum in round-bottom 96-well plates for 96 hours. To assess T cell proliferation 3H-thymidine incorporation during the final 18 h in culture was counted (Microbeta Trilux, PerkinElmer LAS, Shelton, CT).
Gut microbiota sequencing in murine and human samples
Murine stool pellets were collected at baseline (T1-after randomization of the mice into the two groups), before immunization (T2) and during clinical EAE (T3) and were immediately frozen at −80°C until DNA extraction. Stool samples from RRMS patients were collect at baseline before steroid treatment and at day 15 after starting corticosteroids. Metagenomic DNA was extracted using the PowerSoil DNA Isolation Kit (Mo Bio Laboratories, Carlsbad, CA, USA) according to manufacturer’s instruction. The V1–V3 region of the 16S rRNA gene were sequenced at Illumina Miseq v3 platform (2×300bp paired-end reads) to comprehensively catalogue composition and abundance of the bacteria in the stool samples. 16S gene sequences were subjected to primer trimming, assembly by FLASH with default parameters (Magoc and Salzberg, 2011) and taxonomic assignment by RDP classifier (Wang et al., 2007). The workflow for processing the 16S rRNA gene data analysis is illustrated in Figure S7. Because 16S rRNA gene v13 region has the capacity to distinguish Lactobacillus into specific species (Fettweis et al., 2012; Tarnberg et al., 2002), we further classified the Lactobacillus reads to species by blasting the reads to the Lactobacillus species from all the reference genomes database. Diversity and richness in gut microbiota was measured as described (Zhou et al., 2013). Metagenomic shotgun sequencing was conducted at Illumina Hiseq 2500 platform to produce 2×150bp paired-end reads, at a targeted sequencing depth of 5Gb/sample. Shotgun sequences are subjected to host contamination removal, quality filtering and low complexity screening (Nobel et al., 2015). The cleaned reads were aligned to KEGG database using HUMAnN (Abubucker et al., 2012), a pipeline developed for obtaining pathway abundance from metagenomic communities. The workflow for processing the whole shotgun sequencing data was illustrated in Figure S8. The sequence data will be available under Bioproject PRJNA388060. Sequence submission is in progress.
QUANTIFICATION AND STATISTICAL ANALYSIS
EAE studies.
EAE experiments were analyzed separately for disease incidence, mortality, day of onset and disease severity. Day of onset was considered as the first day in which neurological signs appear. Cumulative clinical score was the sum of all scores from onset to day 30 post-immunization (pi) or to the end of the experiment if the duration was < 30 days pi. Day of onset and cumulative clinical scores were summarized using the mean ± SD. Maximum clinical score was calculated as the maximal score reached over the course of the disease for ≥ 1 day and was presented as median and range. Differences in disease incidence between diet groups were analyzed by Fisher exact test. Disease clinical course was analyzed by two-way ANOVA in which the two factors were time and group. Other outcomes were analyzed using t-tests or the non-parametric Mann-Whitney test to compare differences between the two diet groups. An ANOVA or the equivalent non-parametric Kruskal-Wallis tests were used to analyze data with more than two groups. A P ≤ 0.05 was considered significant. Analyses were performed using Prism v.6.03 software, GraphPad Prism 6 and SAS v9.4. In order to account for the statistical dependency between mice in the same cage, we performed a sensitivity analysis on all EAE experiments performed using each cage as the experimental unit as recommended for EAE studies (Festing and Altman, 2002). The mean of each cage (each with 5 mice/cage and 2 cages/group) for all four replicate EAE experiments were analyzed together, rather than the individual mouse. Results of this analysis are summarized in Table S1.
Human studies.
Demographic, anthropometric and clinical characteristic at baseline of the patients assigned to each group are presented (as mean ± SD or median and 25th-75th percentile) in Table 2. Differences in these characteristics between the two groups were compared using t-tests or the Mann-Whitney test, as appropriate. The treatment effect for laboratory measures (serum levels of different metabolites and flow cytometry results) were evaluated using an analysis of covariance (ANCOVA). The ANCOVA model is a recommended approach for analyzing baseline and follow-up measurements (Vickers and Altman, 2001). Differences between the diet groups were evaluated using the serum levels of each metabolite or immune cell subset flow cytometry result at day 15 as the dependent outcome and the model adjusted for the baseline levels of the respective outcome. For the serum metabolites, an additional model was constructed which controlled for the change in BMI and the baseline level of the outcome. This was intended to further explore the effect of the diet on the metabolites beyond the changes in weight which may have occurred. Model assumptions were verified using the appropriate diagnostics and Box Cox transformations were conducted for flow cytometry measures as needed. A two-way ANOVA was used to examine in Treg functional assays the effect of different Teff:Treg ratios on Teff cell proliferation and differences between groups. Analyses were performed using SAS v9.4.
Microbiome studies.
16S rRNA gene reads from each sample were down-sampled to a read depth of 11745 reads/sample for mice and 15800 reads/sample for human (the lowest read depth among all samples). The abundance of a taxon in a sample was indicated as the relative abundance, which was calculated by dividing the number of reads for a taxon by the total read counts of the sample. Nonmetric multidimensional scaling (NMDS) is an ordination technique that aims to discover the data pattern in N-dimensional spaces. It represents the major variation among objects in a reduced dimensional space. It is used to explore the microbiome data structure on the basis of dissimilarity measurement (Bray-Curtis dissimilarity) among samples (Ramette, 2007). Permutational multivariate ANOVA (PERMANOVA) is used for formal statistical testing to investigate the whole microbial community difference between groups. The differences between relative abundances of a given taxon between two groups were tested using ANCOVA that adjusts the baseline difference of the relative abundance. ANCOVA was conducted only for those taxa with average relative abundance >0.05%. The changes of diversity over time between two groups are tested using linear mixed regression, with time points and groups as fixed variable and subjects as random variable. Pearson or Spearman correlation was conducted to correlate log transformed relative abundance of gut microbiome and metabolites in the serum. Data with correlation coefficient > 0.4 or < (−0.4) were shown. The statistical analysis was performed using R https://cran.r-project.org/. Differential analysis of the gut microbiome metabolic pathways between two groups in mice at T3 was performed using LEfSe, a software to support high-dimensional class comparisons for microbiome data (Segata et al., 2011). A P < 0.05 or FDR q value (in the condition of multiple comparison) was considered significant in all of the microbiome data analysis.
DATA AND SOFTWARE AVAILABILITY
The 16S and the whole genome shotgun microbiome data are deposited in the SRA database (PRJNA388060).
ADDITIONAL RESOURCES
Supplementary Material
KEY RESOURCES TABLE
| REAGENT or RESOURCE | SOURCE | IDENTIFIER |
|---|---|---|
| Antibodies | ||
| Purified anti-Neurofilament H (NF-H), Nonphosphorylated Antibody, SMI-32 | Sternberger Monoclonals | Cat 801701 |
| Rat Anti-Myelin Basic Protein antibody | Abcam | Cat ab7349 |
| CD4 Brilliant Violet 421 | Biolegend | Clone: GK1.5 Cat 100437 |
| CD3 PE | Biolegend | Clone 17A2 Cat 100215 |
| CD62L AF700 | eBioscience | Clone MEL-14 Cat 56-0621-82 |
| CD25 AF647 | Biolegend | Clone PC61 Cat 102019 |
| CD44 APC | Biolegend | Clone IM7 Cat 103011 |
| CD8a AF488 | Biolegend | Clone 53–6.7 Cat 100726 |
| CD45 APC/Cy7 | Biolegend | Clone 30F11 Cat 103115 |
| FoxP3 FITC | eBioscience | Clone PCH101 Cat 11-4776-42 |
| IL-17A FITC | Biolegend | Clone TC11–18H10.1 Cat 506907 |
| IFN-γ APC | Biolegend | Clone XMG1.2 Cat 505809 |
| IL-10 PercP | Biolegend | Clone JES5–16E3 Cat 505027 |
| GM-CSF PE | Biolegend | Clone MP1–22E9 Cat 505405 |
| Zombie Acqua | Biolegend | Cat 423101 |
| Human CD303 (BDCA-2) FITC | Biolegend | Clone 201A Cat 354208 |
| Human CD304 (BDCA-4) PE | Biolegend | Clone 12C2 Cat 354504 |
| Human Lin-1 APC | eBioscience | Cat 22-7778-72 |
| Human CD86 AF700 | BD Biosciences | Clone FUN-1 Cat 561124 |
| Human Cd1c BV421 | Biolegend | Clone L161 Cat 331526 |
| Human HLA-DR Krome Orange | Beckman Coulter | Cat B00070 |
| Human CD196 (CCR6) Pe/Cy7 | eBioscience | Clone R6H1 Cat 25-1969-42 |
| Human CD56 PE | eBioscience | Cat 555516 |
| Human CD4 ECD | Beckman Coulter | Clone T4 Cat 6604727 |
| Human CD14 Pe/Cy7 | eBioscience | Clone 61D3 Cat 25-0149-42 |
| Human CD19 APC | Biolegend | Clone SJ25C1 Cat 363007 |
| Human CD8 Krome Orange | Beckman Coulter | Clone B9.11 Cat B00067 |
| Human CD39 FITC | BD Pharmigen | Clone TU66 Cat 561444 |
| Human CD25 PE | Biolegend | Clone M-A251 Cat 356104 |
| Human FoxP3 APC | Biolegend | Clone 259D Cat 320216 |
| Human CD45RA FITC | BD Pharmigen | Clone SK3 Cat 555488 |
| Human CD45RO PE | BD Pharmigen | Clone UCHL1 Cat 560607 |
| Human CD62L PercP710 | eBioscience | Clone DREG-56 Cat 46-0629-42 |
| Human CD197 (CCR7) AF647 | eBioscience | Clone 150503 Cat 581143 |
| 7-aminoactinomycin (7-AAD) | BD Pharmigen | Cat 559925 |
| Bacterial and Virus Strains | ||
| Mycobacterium tuberculosis (strain H37RA) | Fisher-scientific | Cat BD™ 231141 |
| Biological Samples | ||
| Human Whole blood | John L. Trotter MS Center | NCT02411838 |
| Stool samples of reference cohort used for 16S rDNA amplification and sequencing | John L. Trotter MS Center | NCT02411838 |
| Chemicals, Peptides, and Recombinant Proteins | ||
| MOG aa 35–55 MEV GWY RSP FSR VVH LYR NGK | GenScript | ID: 126711–1 |
| Metronidazole 99% | ACROS Organics | Cat 443-48-1 |
| Vancomycin hydrochloride | Sigma-Aldrich | Cat 1404-93-9 |
| Neomycin trisulfate salt hydrate | Sigma-Aldrich | Cat N6386 |
| Ampicillin | Sigma-Aldrich | Cat A9393 |
| Phorbol 12-myristate 13-acetate (PMA) | Sigma-Aldrich | Cat P8139 |
| Ionomycin calcium salt from Streptomyces conglobatus | Sigma-Aldrich | Cat I0634 |
| Monensin | eBioscience | Cat 00-4505-51 |
| Pertussis Toxin from B. pertussis, Lyophilized in Buffer | List Biological laboratories, Inc | Cat 180 |
| Eriochrome cyanine R (C.I. 43820) | Sigma-Aldrich | Cat 1.03164 |
| Iron(III) chloride | Sigma-Aldrich | Cat 451649 |
| Hepes Buffer | Corning | Cat 25060CI |
| Fetal bovine serum, FBS | Gibco | Cat 2614–079 |
| EDTA 0.5 M | Corning | Cat 40–034Cl |
| Dithiothreitol (DTT) | Bio-Rad | Cat 1610610 |
| Percoll | GE Healthcare | Cat 17-0891-01 |
| Hank’s balanced salt solution (+) | Gibco | Cat 24020–117 |
| Hank’s balanced salt solution (−) | Gibco | Cat 14175–079 |
| Critical Commercial Assays | ||
| Lamina Propria Dissociation Kit, mouse | Miltenyi Biotec | Cat 130-097-410 |
| Corticosterone EIA Kit | Arbor Assays | Cat K014-H1 |
| Foxp3 Staining Buffer Set | eBioscience | Cat 00-5523-00 |
| Mouse Adiponectin ELISA | EMD Millipore | Cat Mill-EZMADP-60K |
| Mouse Leptin ELISA | EMD Millipore | Cat Mill-EZML-82K |
| β-Hydroxybutyrate (Ketone Body) Colorimetric Assay Kit | Cayman Chemical Company | Cat 700190 |
| Adiponectin Human ELISA, High Sensitivity (Sandwich) | BioVendor | Cat RD191023100 |
| Human Leptin “Dual Range” ELISA | EMD Millipore | Cat EZHL-80SK |
| Deposited Data | ||
| 16S and Shotgun microbiome data | SRA database | PRJNA388060 |
| Experimental Models: Organisms/Strains | ||
| C57BL/6, Black 6 | Jackson Laboratory | Cat 000664 |
| Software and Algorithms | ||
| Metamorph 7.7 software | Molecular Devices | ftp://ftp.meta.moleculardevices.com/pub/uic/software/CDROM/MM77.iso |
| Kaluza 1.3 | BeckmanCoulter | https://www.beckman.com/coulter-flow-cytometers/software/kaluza |
| GraphPad Prism, 7 | GraphPad Software | https://www.graphpad.com/scientific-software/prism/ |
| FlowJo_V10 | FlowJo, LLC | https://www.flowjo.com/ |
| R for microbiome analysis- R version 3.2.2 (2015-08-14) | R team | https://www.r-project.org/ |
| SAS v9.4 | SAS | https://www.sas.com/en_us/software/sas9.html |
| Other | ||
| Gentle MACS TM Dissociators | Miltenyi Biotec | Cat 130-096-427 |
AKNOWLEDGMENTS
We thank Kathleen Obert for assistance as the nutritionist of the human study; Bob Mikesell, Bryan Bollman, Mike Ramsbottom and Neville Rapp for technical assistance; Drs. Erin Longbrake, Becky Parks, Robert Naismith, Gregory Wu for referring patients to the human study; Dr. John Holloszy for advices; all MS patients that participated in this study; the study coordinators Linda Heinrich, Courtney Dula, Samantha Lancia, Susan Fox and Bridgette Clay. This work was supported by the Office of the Assistant Secretary of Defense for Health Affairs, through the Multiple Sclerosis Research Program under Award No. W81XWH-14-1-0156. Opinions, interpretations, conclusions and recommendations are those of the author and are not necessarily endorsed by the Department of Defense. Additional funding for this study was also provided by Fondazione Italiana Sclerosi Multipla (FISM; 2014/R/15) and the Longer Life Foundation (a RGA/Washington University Partnership) that provided support for the initial part of the human study in MS patients). AHC was supported in part by the Manny & Rosalyn Rosenthal – Dr. John L. Trotter MS Center Chair in Neuroimmunology of the Barnes-Jewish Hospital Foundation. LP was supported by the Harry Weaver Neuroscience Scholar of the National Multiple Sclerosis Society (NMSS, JF 2144A2/1). CC was supported during the course of this study by a FISM fellowship (2012/B/1) and subsequently by a NMSS fellowship (FG 2010-A1/2). Patients were seen for this study in the Neuroclinical Research Unit (NCRU) supported by grant C06RR014513.
Footnotes
COMPETING FINANCIAL INTERESTS
The authors declare no competing financial interests. AHC has served as a paid consultant for: AbbVie, Bayer, Biogen, EMD Serono, Genentech/Roche, Genzyme, Novartis and Teva.
REFERENCES
- Abubucker S, Segata N, Goll J, Schubert AM, Izard J, Cantarel BL, Rodriguez-Mueller B, Zucker J, Thiagarajan M, Henrissat B, et al. (2012). Metabolic reconstruction for metagenomic data and its application to the human microbiome. PLoS Comput Biol 8, e1002358. [DOI] [PMC free article] [PubMed] [Google Scholar]
- Arumugam TV, Phillips TM, Cheng A, Morrell CH, Mattson MP, and Wan R (2010). Age and energy intake interact to modify cell stress pathways and stroke outcome. Annals of neurology 67, 41–52. [DOI] [PMC free article] [PubMed] [Google Scholar]
- Ascherio A (2013). Environmental factors in multiple sclerosis. Expert review of neurotherapeutics 13, 3–9. [DOI] [PubMed] [Google Scholar]
- Atarashi K, Tanoue T, Shima T, Imaoka A, Kuwahara T, Momose Y, Cheng G, Yamasaki S, Saito T, Ohba Y, et al. (2011). Induction of colonic regulatory T cells by indigenous Clostridium species. Science 331, 337–341. [DOI] [PMC free article] [PubMed] [Google Scholar]
- Berer K, Mues M, Koutrolos M, Rasbi ZA, Boziki M, Johner C, Wekerle H, and Krishnamoorthy G (2011). Commensal microbiota and myelin autoantigen cooperate to trigger autoimmune demyelination. Nature 479, 538–541. [DOI] [PubMed] [Google Scholar]
- Bhutia YD, and Ganapathy V (2015). Short, but Smart: SCFAs Train T Cells in the Gut to Fight Autoimmunity in the Brain. Immunity 43, 629–631. [DOI] [PMC free article] [PubMed] [Google Scholar]
- Borody TJ, Brandt LJ, and Paramsothy S (2014). Therapeutic faecal microbiota transplantation: current status and future developments. Curr Opin Gastroenterol 30, 97–105. [DOI] [PMC free article] [PubMed] [Google Scholar]
- Cahill GF Jr., Herrera MG, Morgan AP, Soeldner JS, Steinke J, Levy PL, Reichard GA Jr., and Kipnis DM (1966). Hormone-fuel interrelationships during fasting. The Journal of clinical investigation 45, 1751–1769. [DOI] [PMC free article] [PubMed] [Google Scholar]
- Calder PC, Ahluwalia N, Brouns F, Buetler T, Clement K, Cunningham K, Esposito K, Jonsson LS, Kolb H, Lansink M, et al. (2011). Dietary factors and low-grade inflammation in relation to overweight and obesity. The British journal of nutrition 106 Suppl 3, S5–78. [DOI] [PubMed] [Google Scholar]
- Carbone F, La Rocca C, De Candia P, Procaccini C, Colamatteo A, Micillo T, De Rosa V, and Matarese G (2016). Metabolic control of immune tolerance in health and autoimmunity. Seminars in immunology 28, 491–504. [DOI] [PubMed] [Google Scholar]
- Cella DF, Dineen K, Arnason B, Reder A, Webster KA, karabatsos G, Chang C, Lloyd S, Steward J, and Stefoski D (1996). Validation of the functional assessment of multiple sclerosis quality of life instrument. Neurology 47, 129–139. [DOI] [PubMed] [Google Scholar]
- Chang JY, Antonopoulos DA, Kalra A, Tonelli A, Khalife WT, Schmidt TM, and Young VB (2008). Decreased diversity of the fecal Microbiome in recurrent Clostridium difficile-associated diarrhea. The Journal of infectious diseases 197, 435–438. [DOI] [PubMed] [Google Scholar]
- Chen J, Chia N, Kalari KR, Yao JZ, Novotna M, Soldan MM, Luckey DH, Marietta EV, Jeraldo PR, Chen X, et al. (2016). Multiple sclerosis patients have a distinct gut microbiota compared to healthy controls. Scientific reports 6, 28484. [DOI] [PMC free article] [PubMed] [Google Scholar]
- Codarri L, Gyulveszi G, Tosevski V, Hesske L, Fontana A, Magnenat L, Suter T, and Becher B (2011). RORgammat drives production of the cytokine GM-CSF in helper T cells, which is essential for the effector phase of autoimmune neuroinflammation. Nat Immunol 12, 560–567. [DOI] [PubMed] [Google Scholar]
- Cutter GR, Baier ML, Rudick RA, Cookfair DL, Fischer JS, Petkau J, Syndulko K, Weinshenker BG, Antel JP, Confavreux C, et al. (1999). Development of a multiple sclerosis functional composite as a clinical trial outcome measure. Brain : a journal of neurology 122 (Pt 5), 871–882. [DOI] [PubMed] [Google Scholar]
- De Filippo C, Cavalieri D, Di Paola M, Ramazzotti M, Poullet JB, Massart S, Collini S, Pieraccini G, and Lionetti P (2010). Impact of diet in shaping gut microbiota revealed by a comparative study in children from Europe and rural Africa. Proceedings of the National Academy of Sciences of the United States of America 107, 14691–14696. [DOI] [PMC free article] [PubMed] [Google Scholar]
- Delcenserie V, Martel D, Lamoureux M, Amiot J, Boutin Y, and Roy D (2008). Immunomodulatory effects of probiotics in the intestinal tract. Current issues in molecular biology 10, 37–54. [PubMed] [Google Scholar]
- Dendrou CA, Fugger L, and Friese MA (2015). Immunopathology of multiple sclerosis. Nature reviews. Immunology 15, 545–558. [DOI] [PubMed] [Google Scholar]
- Dethlefsen L, McFall-Ngai M, and Relman DA (2007). An ecological and evolutionary perspective on human-microbe mutualism and disease. Nature 449, 811–818. [DOI] [PMC free article] [PubMed] [Google Scholar]
- Dodt M, Roehr JT, Ahmed R, and Dieterich C (2012). FLEXBAR-Flexible Barcode and Adapter Processing for Next-Generation Sequencing Platforms. Biology 1, 895–905. [DOI] [PMC free article] [PubMed] [Google Scholar]
- Drake AS, Weinstock-Guttman B, Morrow SA, Hojnacki D, Munschauer FE, and Benedict RH (2010). Psychometrics and normative data for the Multiple Sclerosis Functional Composite: replacing the PASAT with the Symbol Digit Modalities Test. Mult Scler 16, 228–237. [DOI] [PubMed] [Google Scholar]
- Edgar RC (2010). Search and clustering orders of magnitude faster than BLAST. Bioinformatics 26, 2460–2461. [DOI] [PubMed] [Google Scholar]
- Edgar RC, Haas BJ, Clemente JC, Quince C, and Knight R (2011). UCHIME improves sensitivity and speed of chimera detection. Bioinformatics 27, 2194–2200. [DOI] [PMC free article] [PubMed] [Google Scholar]
- Festing MF, and Altman DG (2002). Guidelines for the design and statistical analysis of experiments using laboratory animals. ILAR J 43, 244–258. [DOI] [PubMed] [Google Scholar]
- Fettweis JM, Serrano MG, Sheth NU, Mayer CM, Glascock AL, Brooks JP, Jefferson KK, Vaginal Microbiome C, and Buck GA (2012). Species-level classification of the vaginal microbiome. BMC genomics 13 Suppl 8, S17. [DOI] [PMC free article] [PubMed] [Google Scholar]
- Fischer JS, Rudick RA, Cutter GR, and Reingold SC (1999). The Multiple Sclerosis Functional Composite Measure (MSFC): an integrated approach to MS clinical outcome assessment. National MS Society Clinical Outcomes Assessment Task Force. Multiple sclerosis 5, 244–250. [DOI] [PubMed] [Google Scholar]
- Fujimoto T, Imaeda H, Takahashi K, Kasumi E, Bamba S, Fujiyama Y, and Andoh A (2013). Decreased abundance of Faecalibacterium prausnitzii in the gut microbiota of Crohn’s disease. Journal of gastroenterology and hepatology 28, 613–619. [DOI] [PubMed] [Google Scholar]
- Furusawa Y, Obata Y, and Hase K (2015). Commensal microbiota regulates T cell fate decision in the gut. Seminars in immunopathology 37, 17–25. [DOI] [PubMed] [Google Scholar]
- Gaboriau-Routhiau V, Rakotobe S, Lecuyer E, Mulder I, Lan A, Bridonneau C, Rochet V, Pisi A, De Paepe M, Brandi G, et al. (2009). The key role of segmented filamentous bacteria in the coordinated maturation of gut helper T cell responses. Immunity 31, 677–689. [DOI] [PubMed] [Google Scholar]
- Griffin NW, Ahern PP, Cheng J, Heath AC, Ilkayeva O, Newgard CB, Fontana L, and Gordon JI (2017). Prior Dietary Practices and Connections to a Human Gut Microbial Metacommunity Alter Responses to Diet Interventions. Cell Host Microbe 21, 84–96. [DOI] [PMC free article] [PubMed] [Google Scholar]
- Guinane CM, and Cotter PD (2013). Role of the gut microbiota in health and chronic gastrointestinal disease: understanding a hidden metabolic organ. Therapeutic advances in gastroenterology 6, 295–308. [DOI] [PMC free article] [PubMed] [Google Scholar]
- Haghikia A, Jorg S, Duscha A, Berg J, Manzel A, Waschbisch A, Hammer A, Lee DH, May C, Wilck N, et al. (2015). Dietary Fatty Acids Directly Impact Central Nervous System Autoimmunity via the Small Intestine. Immunity 43, 817–829. [DOI] [PubMed] [Google Scholar]
- Hedstrom AK, Lima Bomfim I, Barcellos L, Gianfrancesco M, Schaefer C, Kockum I, Olsson T, and Alfredsson L (2014). Interaction between adolescent obesity and HLA risk genes in the etiology of multiple sclerosis. Neurology 82, 865–872. [DOI] [PMC free article] [PubMed] [Google Scholar]
- Hedstrom AK, Olsson T, and Alfredsson L (2012). High body mass index before age 20 is associated with increased risk for multiple sclerosis in both men and women. Mult Scler. [DOI] [PubMed] [Google Scholar]
- Heiman ML, and Greenway FL (2016). A healthy gastrointestinal microbiome is dependent on dietary diversity. Molecular metabolism 5, 317–320. [DOI] [PMC free article] [PubMed] [Google Scholar]
- Ivanov II, and Littman DR (2010). Segmented filamentous bacteria take the stage. Mucosal immunology 3, 209–212. [DOI] [PMC free article] [PubMed] [Google Scholar]
- Jager A, Dardalhon V, Sobel RA, Bettelli E, and Kuchroo VK (2009). Th1, Th17, and Th9 effector cells induce experimental autoimmune encephalomyelitis with different pathological phenotypes. Journal of immunology 183, 7169–7177. [DOI] [PMC free article] [PubMed] [Google Scholar]
- Jangi S, Gandhi R, Cox LM, Li N, von Glehn F, Yan R, Patel B, Mazzola MA, Liu S, Glanz BL, et al. (2016). Alterations of the human gut microbiome in multiple sclerosis. Nature communications 7, 12015. [DOI] [PMC free article] [PubMed] [Google Scholar]
- Johnson JB, Summer W, Cutler RG, Martin B, Hyun DH, Dixit VD, Pearson M, Nassar M, Telljohann R, Maudsley S, et al. (2007). Alternate day calorie restriction improves clinical findings and reduces markers of oxidative stress and inflammation in overweight adults with moderate asthma. Free radical biology & medicine 42, 665–674. [DOI] [PMC free article] [PubMed] [Google Scholar]
- Kafami L, Raza M, Razavi A, Mirshafiey A, Movahedian M, and Khorramizadeh MR (2010). Intermittent feeding attenuates clinical course of experimental autoimmune encephalomyelitis in C57BL/6 mice. Avicenna journal of medical biotechnology 2, 47–52. [PMC free article] [PubMed] [Google Scholar]
- Kiernan JA (1984). Chromoxane cyanine R. II. Staining of animal tissues by the dye and its iron complexes. Journal of microscopy 134, 25–39. [DOI] [PubMed] [Google Scholar]
- Kim do Y, Hao J, Liu R, Turner G, Shi FD, and Rho JM (2012). Inflammation-mediated memory dysfunction and effects of a ketogenic diet in a murine model of multiple sclerosis. PloS one 7, e35476. [DOI] [PMC free article] [PubMed] [Google Scholar]
- Kim DY, Hao J, Liu R, Turner G, Shi FD, and Rho JM (2012). Inflammation-mediated memory dysfunction and effects of a ketogenic diet in a murine model of multiple sclerosis. PloS one 7, e35476. [DOI] [PMC free article] [PubMed] [Google Scholar]
- Kurtzke JF (1983). Rating neurologic impairment in multiple sclerosis: an expanded disability status scale (EDSS). Neurology 33, 1444–1452. [DOI] [PubMed] [Google Scholar]
- Langer-Gould A, Brara SM, Beaber BE, and Koebnick C (2013). Childhood obesity and risk of pediatric multiple sclerosis and clinically isolated syndrome. Neurology. [DOI] [PMC free article] [PubMed] [Google Scholar]
- Le Chatelier E, Nielsen T, Qin J, Prifti E, Hildebrand F, Falony G, Almeida M, Arumugam M, Batto JM, Kennedy S, et al. (2013). Richness of human gut microbiome correlates with metabolic markers. Nature 500, 541–546. [DOI] [PubMed] [Google Scholar]
- Le Poul E, Loison C, Struyf S, Springael JY, Lannoy V, Decobecq ME, Brezillon S, Dupriez V, Vassart G, Van Damme J, et al. (2003). Functional characterization of human receptors for short chain fatty acids and their role in polymorphonuclear cell activation. J Biol Chem 278, 25481–25489. [DOI] [PubMed] [Google Scholar]
- Lee PH, and Shatkay H (2006). BNTagger: improved tagging SNP selection using Bayesian networks. Bioinformatics 22, e211–219. [DOI] [PubMed] [Google Scholar]
- Lee YK, Menezes JS, Umesaki Y, and Mazmanian SK (2011). Proinflammatory T-cell responses to gut microbiota promote experimental autoimmune encephalomyelitis. Proc Natl Acad Sci U S A 108 Suppl 1, 4615–4622. [DOI] [PMC free article] [PubMed] [Google Scholar]
- Lozupone CA, and Knight R (2008). Species divergence and the measurement of microbial diversity. FEMS microbiology reviews 32, 557–578. [DOI] [PMC free article] [PubMed] [Google Scholar]
- Maassen CB, Laman JD, van Holten-Neelen C, Hoogteijling L, Groenewegen L, Visser L, Schellekens MM, Boersma WJ, and Claassen E (2003). Reduced experimental autoimmune encephalomyelitis after intranasal and oral administration of recombinant lactobacilli expressing myelin antigens. Vaccine 21, 4685–4693. [DOI] [PubMed] [Google Scholar]
- Magoc T, and Salzberg SL (2011). FLASH: fast length adjustment of short reads to improve genome assemblies. Bioinformatics 27, 2957–2963. [DOI] [PMC free article] [PubMed] [Google Scholar]
- Manzel A, Muller DN, Hafler DA, Erdman SE, Linker RA, and Kleinewietfeld M (2014). Role of “Western diet” in inflammatory autoimmune diseases. Current allergy and asthma reports 14, 404. [DOI] [PMC free article] [PubMed] [Google Scholar]
- Meydani SN, Das SK, Pieper CF, Lewis MR, Klein S, Dixit VD, Gupta AK, Villareal DT, Bhapkar M, Huang M, et al. (2016). Long-term moderate calorie restriction inhibits inflammation without impairing cell-mediated immunity: a randomized controlled trial in non-obese humans. Aging 8, 1416–1431. [DOI] [PMC free article] [PubMed] [Google Scholar]
- Miyake S, Kim S, Suda W, Oshima K, Nakamura M, Matsuoka T, Chihara N, Tomita A, Sato W, Kim SW, et al. (2015). Dysbiosis in the Gut Microbiota of Patients with Multiple Sclerosis, with a Striking Depletion of Species Belonging to Clostridia XIVa and IV Clusters. PloS one 10, e0137429. [DOI] [PMC free article] [PubMed] [Google Scholar]
- Morgulis A, Gertz EM, Schaffer AA, and Agarwala R (2006). A fast and symmetric DUST implementation to mask low-complexity DNA sequences. Journal of computational biology : a journal of computational molecular cell biology 13, 1028–1040. [DOI] [PubMed] [Google Scholar]
- Muegge BD, Kuczynski J, Knights D, Clemente JC, Gonzalez A, Fontana L, Henrissat B, Knight R, and Gordon JI (2011). Diet drives convergence in gut microbiome functions across mammalian phylogeny and within humans. Science 332, 970–974. [DOI] [PMC free article] [PubMed] [Google Scholar]
- Munger KL, Bentzen J, Laursen B, Stenager E, Koch-Henriksen N, Sorensen T, and Baker JL (2013). Childhood body mass index and multiple sclerosis risk: a long-term cohort study. Mult Scler 19, 1323–1329. [DOI] [PMC free article] [PubMed] [Google Scholar]
- Munger KL, Chitnis T, and Ascherio A (2009). Body size and risk of MS in two cohorts of US women. Neurology 73, 1543–1550. [DOI] [PMC free article] [PubMed] [Google Scholar]
- Mycko MP, Sliwinska B, Cichalewska M, Cwiklinska H, Raine CS, and Selmaj KW (2014). Brain glycolipids suppress T helper cells and inhibit autoimmune demyelination. The Journal of neuroscience : the official journal of the Society for Neuroscience 34, 8646–8658. [DOI] [PMC free article] [PubMed] [Google Scholar]
- Negrotto L, Farez MF, and Correale J (2016). Immunologic Effects of Metformin and Pioglitazone Treatment on Metabolic Syndrome and Multiple Sclerosis. JAMA neurology 73, 520–528. [DOI] [PubMed] [Google Scholar]
- Nobel YR, Cox LM, Kirigin FF, Bokulich NA, Yamanishi S, Teitler I, Chung J, Sohn J, Barber CM, Goldfarb DS, et al. (2015). Metabolic and metagenomic outcomes from early-life pulsed antibiotic treatment. Nature communications 6, 7486. [DOI] [PMC free article] [PubMed] [Google Scholar]
- Ochoa-Reparaz J, Mielcarz DW, Ditrio LE, Burroughs AR, Foureau DM, Haque-Begum S, and Kasper LH (2009). Role of gut commensal microflora in the development of experimental autoimmune encephalomyelitis. J Immunol 183, 6041–6050. [DOI] [PubMed] [Google Scholar]
- Ochoa-Reparaz J, Mielcarz DW, Wang Y, Begum-Haque S, Dasgupta S, Kasper DL, and Kasper LH (2010). A polysaccharide from the human commensal Bacteroides fragilis protects against CNS demyelinating disease. Mucosal immunology 3, 487–495. [DOI] [PubMed] [Google Scholar]
- Owaga E, Hsieh RH, Mugendi B, Masuku S, Shih CK, and Chang JS (2015). Th17 Cells as Potential Probiotic Therapeutic Targets in Inflammatory Bowel Diseases. International journal of molecular sciences 16, 20841–20858. [DOI] [PMC free article] [PubMed] [Google Scholar]
- Piccio L, Cantoni C, Henderson JG, Hawiger D, Ramsbottom M, Mikesell R, Ryu J, Hsieh CS, Cremasco V, Haynes W, et al. (2013). Lack of adiponectin leads to increased lymphocyte activation and increased disease severity in a mouse model of multiple sclerosis. European journal of immunology 43, 2089–2100. [DOI] [PMC free article] [PubMed] [Google Scholar]
- Piccio L, Stark JL, and Cross AH (2008). Chronic calorie restriction attenuates experimental autoimmune encephalomyelitis. Journal of leukocyte biology 84, 940–948. [DOI] [PMC free article] [PubMed] [Google Scholar]
- Polman CH, Reingold SC, Banwell B, Clanet M, Cohen JA, Filippi M, Fujihara K, Havrdova E, Hutchinson M, Kappos L, et al. (2011). Diagnostic criteria for multiple sclerosis: 2010 revisions to the McDonald criteria. Annals of neurology 69, 292–302. [DOI] [PMC free article] [PubMed] [Google Scholar]
- Ramette A (2007). Multivariate analyses in microbial ecology. FEMS Microbiol Ecol 62, 142–160. [DOI] [PMC free article] [PubMed] [Google Scholar]
- Ravel J, Gajer P, Abdo Z, Schneider GM, Koenig SS, McCulle SL, Karlebach S, Gorle R, Russell J, Tacket CO, et al. (2011). Vaginal microbiome of reproductive-age women. Proc Natl Acad Sci U S A 108 Suppl 1, 4680–4687. [DOI] [PMC free article] [PubMed] [Google Scholar]
- Razeghi Jahromi S, Ghaemi A, Alizadeh A, Sabetghadam F, Moradi Tabriz H, and Togha M (2016). Effects of Intermittent Fasting on Experimental Autoimune Encephalomyelitis in C57BL/6 Mice. Iran J Allergy Asthma Immunol 15, 212–219. [PubMed] [Google Scholar]
- Samuel BS, Shaito A, Motoike T, Rey FE, Backhed F, Manchester JK, Hammer RE, Williams SC, Crowley J, Yanagisawa M, et al. (2008). Effects of the gut microbiota on host adiposity are modulated by the short-chain fatty-acid binding G protein-coupled receptor, Gpr41. Proc Natl Acad Sci U S A 105, 16767–16772. [DOI] [PMC free article] [PubMed] [Google Scholar]
- Segata N, Izard J, Waldron L, Gevers D, Miropolsky L, Garrett WS, and Huttenhower C (2011). Metagenomic biomarker discovery and explanation. Genome biology 12, R60. [DOI] [PMC free article] [PubMed] [Google Scholar]
- Sonnenburg JL, and Backhed F (2016). Diet-microbiota interactions as moderators of human metabolism. Nature 535, 56–64. [DOI] [PMC free article] [PubMed] [Google Scholar]
- Stanisavljevic S, Lukic J, Sokovic S, Mihajlovic S, Mostarica Stojkovic M, Miljkovic D, and Golic N (2016). Correlation of Gut Microbiota Composition with Resistance to Experimental Autoimmune Encephalomyelitis in Rats. Frontiers in microbiology 7, 2005. [DOI] [PMC free article] [PubMed] [Google Scholar]
- Steinman L, and Zamvil SS (2005). Virtues and pitfalls of EAE for the development of therapies for multiple sclerosis. Trends in immunology 26, 565–571. [DOI] [PubMed] [Google Scholar]
- Taira R, Yamaguchi S, Shimizu K, Nakamura K, Ayabe T, and Taira T (2015). Bacterial cell wall components regulate adipokine secretion from visceral adipocytes. J Clin Biochem Nutr 56, 149–154. [DOI] [PMC free article] [PubMed] [Google Scholar]
- Tarnberg M, Jakobsson T, Jonasson J, and Forsum U (2002). Identification of randomly selected colonies of lactobacilli from normal vaginal fluid by pyrosequencing of the 16S rDNA variable V1 and V3 regions. APMIS : acta pathologica, microbiologica, et immunologica Scandinavica 110, 802–810. [DOI] [PubMed] [Google Scholar]
- Tilg H, and Kaser A (2011). Gut microbiome, obesity, and metabolic dysfunction. The Journal of clinical investigation 121, 2126–2132. [DOI] [PMC free article] [PubMed] [Google Scholar]
- Torrazza RM, Ukhanova M, Wang X, Sharma R, Hudak ML, Neu J, and Mai V (2013). Intestinal microbial ecology and environmental factors affecting necrotizing enterocolitis. PloS one 8, e83304. [DOI] [PMC free article] [PubMed] [Google Scholar]
- Turnbaugh PJ, Ley RE, Mahowald MA, Magrini V, Mardis ER, and Gordon JI (2006). An obesity-associated gut microbiome with increased capacity for energy harvest. Nature 444, 1027–1031. [DOI] [PubMed] [Google Scholar]
- Umbrello G, and Esposito S (2016). Microbiota and neurologic diseases: potential effects of probiotics. J Transl Med 14, 298. [DOI] [PMC free article] [PubMed] [Google Scholar]
- van Nood E, Vrieze A, Nieuwdorp M, Fuentes S, Zoetendal EG, de Vos WM, Visser CE, Kuijper EJ, Bartelsman JF, Tijssen JG, et al. (2013). Duodenal infusion of donor feces for recurrent Clostridium difficile. The New England journal of medicine 368, 407–415. [DOI] [PubMed] [Google Scholar]
- Vasconcelos AR, Yshii LM, Viel TA, Buck HS, Mattson MP, Scavone C, and Kawamoto EM (2014). Intermittent fasting attenuates lipopolysaccharide-induced neuroinflammation and memory impairment. Journal of neuroinflammation 11, 85. [DOI] [PMC free article] [PubMed] [Google Scholar]
- Verdam FJ, Fuentes S, de Jonge C, Zoetendal EG, Erbil R, Greve JW, Buurman WA, de Vos WM, and Rensen SS (2013). Human intestinal microbiota composition is associated with local and systemic inflammation in obesity. Obesity 21, E607–615. [DOI] [PubMed] [Google Scholar]
- Vickers AJ, and Altman DG (2001). Statistics notes: Analysing controlled trials with baseline and follow up measurements. Bmj 323, 1123–1124. [DOI] [PMC free article] [PubMed] [Google Scholar]
- Vieira SM, Pagovich OE, and Kriegel MA (2014). Diet, microbiota and autoimmune diseases. Lupus 23, 518–526. [DOI] [PMC free article] [PubMed] [Google Scholar]
- Walters WA, Xu Z, and Knight R (2014). Meta-analyses of human gut microbes associated with obesity and IBD. FEBS Lett 588, 4223–4233. [DOI] [PMC free article] [PubMed] [Google Scholar]
- Wang C, Collins M, and Kuchroo VK (2015). Effector T cell differentiation: are master regulators of effector T cells still the masters? Current opinion in immunology 37, 6–10. [DOI] [PubMed] [Google Scholar]
- Wang Q, Garrity GM, Tiedje JM, and Cole JR (2007). Naive Bayesian classifier for rapid assignment of rRNA sequences into the new bacterial taxonomy. Applied and environmental microbiology 73, 5261–5267. [DOI] [PMC free article] [PubMed] [Google Scholar]
- Wesnes K, Riise T, Casetta I, Drulovic J, Granieri E, Holmoy T, Kampman MT, Landtblom AM, Lauer K, Lossius A, et al. (2015). Body size and the risk of multiple sclerosis in Norway and Italy: the EnvIMS study. Mult Scler 21, 388–395. [DOI] [PubMed] [Google Scholar]
- Wu HJ, Ivanov II, Darce J, Hattori K, Shima T, Umesaki Y, Littman DR, Benoist C, and Mathis D (2010). Gut-residing segmented filamentous bacteria drive autoimmune arthritis via T helper 17 cells. Immunity 32, 815–827. [DOI] [PMC free article] [PubMed] [Google Scholar]
- Xiong Y, Miyamoto N, Shibata K, Valasek MA, Motoike T, Kedzierski RM, and Yanagisawa M (2004). Short-chain fatty acids stimulate leptin production in adipocytes through the G protein-coupled receptor GPR41. Proc Natl Acad Sci U S A 101, 1045–1050. [DOI] [PMC free article] [PubMed] [Google Scholar]
- Zaibi MS, Stocker CJ, O’Dowd J, Davies A, Bellahcene M, Cawthorne MA, Brown AJ, Smith DM, and Arch JR (2010). Roles of GPR41 and GPR43 in leptin secretory responses of murine adipocytes to short chain fatty acids. FEBS letters 584, 2381–2386. [DOI] [PubMed] [Google Scholar]
- Zhang C, Li S, Yang L, Huang P, Li W, Wang S, Zhao G, Zhang M, Pang X, Yan Z, et al. (2013). Structural modulation of gut microbiota in life-long calorie-restricted mice. Nature communications 4, 2163. [DOI] [PMC free article] [PubMed] [Google Scholar]
- Zhou Y, Gao H, Mihindukulasuriya KA, La Rosa PS, Wylie KM, Vishnivetskaya T, Podar M, Warner B, Tarr PI, Nelson DE, et al. (2013). Biogeography of the ecosystems of the healthy human body. Genome biology 14, R1. [DOI] [PMC free article] [PubMed] [Google Scholar]
Associated Data
This section collects any data citations, data availability statements, or supplementary materials included in this article.
Supplementary Materials
Data Availability Statement
The 16S and the whole genome shotgun microbiome data are deposited in the SRA database (PRJNA388060).