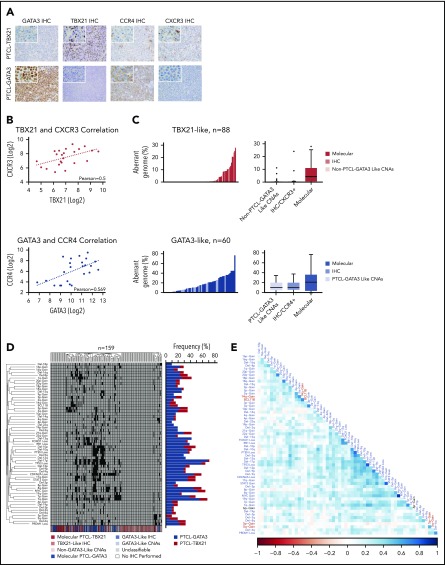
Figure 4.
Unsupervised HC of CNAs in PTCL. (A) IHC staining of GATA3, TBX21, CCR4, and CXCR3 in a molecularly classified case of PTCL-TBX21 (upper panels) or PTCL-GATA3 (lower panels). Original magnification of ×200 with an inset magnification of ×400. (B) Positive correlation of TBX21 and CXCR3 mRNA expression in the PTCL-TBX21 subgroup (upper panel) and GATA3 and CCR4 mRNA expression in the PTCL-GATA3 subgroup (lower panel). (C) Histograms (left panels) and boxplots (right panels) of the percent aberrant genome of PTCL-GATA3 and PTCL-TBX21 molecularly classified cases, along with PTCL-GATA3–like and PTCL-TBX21–like cases, from 2 published series.22,23 (D) Unsupervised HC of 3 PTCL-NOS series22,23 by recurrent CNAs observed in the PTCL-GATA3 or PTCL-TBX21 molecular subgroups at a frequency ≥10%. The molecular PTCL-GATA3/GATA3–like cases (blue shades) dominate the central clusters, whereas the outside clusters, which tend to lack frequent CNAs, are predominately molecular PTCL-TBX21/TBX21–like cases (red shades). The frequency of these aberrations in the molecularly classified PTCL-NOS subgroups from the present study are depicted to the right of the cluster. (E) Matrix of Pearson correlation coefficients for co-occurring CNAs. Abnormalities depicted in blue type are more frequent in PTCL-GATA3, whereas abnormalities depicted in red type are more frequent in PTCL-TBX21. The black type (6p-Gain) represents a CNA that was observed at near-equal frequencies in the 2 molecular subgroups.

