

Abstract
Background
Essential hypertension can cause many kinds of cardiovascular diseases. The pathogenesis of essential hypertension is very complex, and the mechanism is still unclear. The microRNAs have been identified as novel biomarkers for pre-diagnosis and prognosis of hypertension. However, the kinds of microRNAs that can be used as specific biomarkers for hypertension are unknown.
Methods and results
Plasma samples were isolated from Uyghur subjects with essential hypertension and the healthy individuals. Microarray was used to identify differentially expressed microRNAs. The microarray data were clustered and annotated with online software. The target genes of differentially expressed microRNAs were also analyzed. The microarray results were further verified by quantitative real-time PCR. We identified 257 microRNAs that were differentially expressed between patients with essential hypertension and the healthy individuals. These microRNAs had a total of 6580 target genes. The 47 microRNAs that had target genes, including 24 up-regulated and 23 down-regulated microRNAs, were further screened out to construct a reference set of potential microRNA biomarkers. Most of the 47 microRNAs were located at chromosome 19 (40 microRNAs) and chromosome 1 (45 microRNAs). Their target genes were mainly enriched in metal ion binding, transcription regulation, cell adhesion and junction, indicating that these candidate microRNAs may regulate mineral ion binding and cell communication process of essential hypertension. The quantitative real-time PCR results of miR-198 and miR-1183 (which were the two most significantly up-regulated microRNAs by microarray), and, miR-30e-5p and miR-144-3p (which were the two most significantly down-regulated microRNAs by microarray) were consistent with the microarray results.
Conclusions
A reference set of potential microRNA biomarkers that may be involved in essential hypertension is constructed. Our study may provide experimental evidence for further studying the mechanism of essential hypertension.
Electronic supplementary material
The online version of this article (10.1186/s12944-019-1028-1) contains supplementary material, which is available to authorized users.
Keywords: Essential hypertension, Uyghur population, microRNA, Biomarker
Introduction
Essential hypertension is not only one of the main causes but also one of the clinical manifestations of cardiovascular diseases. It is a highly complex disease that can be induced by both environmental and genetic factors [1, 2]. The mechanism of essential hypertension is still unclear. There are still no precise pre-diagnosis methods or efficient treatment options for essential hypertension [2–4]. Thus, it is necessary to identify specific markers for essential hypertension.
MicroRNA is a kind of small non-coding RNA with about 20 bp in length that can regulate gene expression at the post-transcriptional level [4–6]. Previous studies demonstrate that microRNAs can be used as diagnostic biomarkers for hypertension and cardiovascular diseases [2, 4]. The abnormal expression of microRNAs in tissues and body fluids has also been reported [2, 4, 6]. It is also found that there were 27 microRNAs differentially expressed in patients with essential hypertension and that the relationship between hmcv-miR-UL122 and hypertension was identified [7]. In addition, the increased expression of miR-505 may play important roles in essential hypertension [8]. Tissue-based studies also illustrate that several microRNAs play remarkable roles in hypertension, such as miR-181a [1, 9], miR-1, miR-21, miR-9 and miR-126 [10, 11].
MicroRNA array and quantitative PCR are two main techniques for detection and examination of microRNAs [2–4, 6]. The microRNA profile of hypertension has been investigated. However, different microRNA biomarker sets were obtained due to the diversity of experiment methods and research subjects [1–4]. More microRNA markers for essential hypertension remain to be identified. In this study, we screened the microRNA profile of essential hypertension in Uyghur population. Our study may provide experimental evidence for investigating the possible role and mechanism of microRNAs in essential hypertension.
Materials and methods
Sample collection and processing
Eight Uyghur subjects aged between 30 and 40 years old were recruited. Four subjects, including 2 males and 2 females, with untreated essential hypertension were included in the hypertension group. Inclusion criteria: 1) blood pressure should meet one of the following criteria: Sitting blood pressure was higher than or equal to 140/90 mill Hg (1 mmHg = 0.133 kPa) measured by Mercury sphygmomanometer; and/or, average daily blood pressure was higher than or equal to 135/85 mill Hg by 24-h ambulatory blood pressure monitor; 2) patients diagnosed with essential hypertension for the first time; 3) patients were untreated. Exclusion criteria: 1) patients with secondary hypertension; 2) patients with cardiac function III, IV, coronary heart disease, severe pulmonary insufficiency, rheumatic diseases, diabetes, endocrine disorders, severe liver or kidney dysfunction, stroke, peripheral arterial disease, or, mental illness; 3) pregnant or lactating women. Four age and gender matched healthy individuals with normal blood pressure (2 males and 2 females) were included in the control group. Healthy subjects did not smoke and had no history of cancer, diabetes, kidney failure, stroke or peripheral arterial disease. For verification of microRNA expression, another 15 patients with essential hypertension (8 males and 7 females) and 15 healthy individuals (4 males and 11 females) were included. The inclusion and exclusion criteria were same as above.
All subjects were fasted before sampling and sampled at the same time in the morning. They were asked to sit still for 10 min before blood collection. Totally, 3 mL of peripheral blood was collected from each subject and the plasma was then isolated.
All subjects or their families signed the informed consent. The study was approved by Ethical committee of Xinjiang Medical University.
RNA extraction and miRNA microarray analysis
Total RNAs were extracted from plasma using mirVana PARIS kit (Ambion-1556) and quantified by NanoDrop ND-2000 (Thermo Scientific). RNA quality was checked by Bioanalyzer 2100 (Agilent, G2939A). MicroRNA expression was detected by Agilent Human miRNA Microarray (Agilent, 8*60 K, ID070156). RNAs were hybridized with the array in hybridization oven (Agilent, G2545A). Then, array signals were scanned by Agilent Scanner (Agilent, G2505C). All processes were performed in accordance with the standard guidelines provided by the manufacturer.
The signals were then analyzed by Feature Extraction software (version10.7.1.1, Agilent Technologies). Raw data was obtained, and normalized with the quartile algorithm using Genespring software (version 12.5; Agilent Technologies) to calculate the microRNA expression. MicroRNAs with fold changes greater than two and a p-value below 0.05 were defined as differentially expressed.
MicroRNA annotation
MicroRNAs were clustered using the Hierarchical Clustering method. The chromosome loci of microRNAs were annotated by miRBase (http://www.mirbase.org/) and HGNC (Hugo Gene Nomenclature Committee) (http://www.genenames.org/). Cytogenetic locations of microRNAs and OMIM (Online Mendelian Inheritance in Man) record of essential hypertension were retrieved from OMIM database (http://www.omim.org/).
Target gene prediction, GO annotation and pathway analysis
Target genes of microRNAs were predicted using three databases of Targetscan, (http://www.targetscan.org/), microRNAorg, (http://www.microrna.org/), and pita, (https://genie.weizmann.ac.il/pubs/mir07/), respectively. The resulted genes shared by three databases were selected and then analyzed using Gene Ontology (GO) and KEGG (Kyoto Encyclopedia of Genes and Genomes) pathway. Furthermore, genes were clustered according to the annotation information by DAVID analysis tool (https://david.ncifcrf.gov/).
Quantitative real-time PCR
Quantitative real-time PCR (qPCR) was conducted to verify microRNA expression. MicroRNAs were extracted using QIAzol Lysis Reagent (QIAGEN, 5346994), miRNeasy Serum/Plasma Spike-In Control (QIAGEN, 219610) and miRNeasy Serum/Plasma Kit (QIAGEN,217184). cDNA was prepared using miScript II RT Kit (QIAGEN, 218161). MicroRNA expression was detected using miScript SYBR Green PCR Kit (QIAGEN, 218073) on ABI7500 (ABI). Four pairs of Primers were used in qPCR assays, including hsa-miR-1183 (CD201–0149, TIANGEN BIOTECH), hsa-miR-198 (CD201–0085, TIANGEN BIOTECH), hsa-miR-30e-5p (CD201–0340, TIANGEN BIOTECH) and hsa-miR-144-3p (CD201–0011, TIANGEN BIOTECH). miRNA39 was used for normalization in the qRT-PCR assays. The relative gene expression was calculated with 2-ΔΔCt method.
Statistical analysis
Prism statistical software (GraphPad Software Inc) was used for data analysis. Difference in microRNA expression between essential hypertension group and control group was analyzed by student t-test. A value of p ≤ 0.05 was considered to be statistically significant.
Results
The expression profile of microRNAs in the essential hypertension group
Totally, 257 microRNAs that showed differential expression between patients with essential hypertension and the control group were obtained (Table 1). The number of up-regulated microRNAs (161) was higher than that of down-regulated microRNAs (96) (Table 1). Furthermore, fold change distribution of the differentially expressed microRNAs showed distinct pattern. Up-regulated microRNAs changed much more than the down-regulated microRNAs (Fig. 1). The change of hsa-miR-1183 expression (up-regulated, fold change = 44.41) and hsa-miR-30e-5p expression (down-regulated, fold change = 24) were the most significant (Table 2). Cluster analysis classified samples into separate groups based on the microRNA expression in each sample. The microRNA expression of patients in the essential hypertension group was obviously different from that of healthy controls (Fig. 2). Overall, nearly 2/3 microRNAs showed higher level in the essential hypertension samples (Fig. 2).
Table 1.
Number of differentially expressed microRNA
| Classification | Total | UP | DOWN |
|---|---|---|---|
| Differentially expressed miRNA | 257 | 161 | 96 |
| Differentially expressed miRNA that possess target genes | 47 | 24 | 23 |
Fig. 1.

Fold change distribution of differentially expressed microRNA. a The left distribution chart illustrates fold changes of all differentially expressed microRNAs. b The right chart shows fold change of differentially expressed microRNAs that possess target genes. Pink represents the down-regulated microRNAs. Blue represents the up-regulated miRNAs
Table 2.
List of screened differentially expressed microRNAs
| Up-regulated miRNA | p-value | Fold change | Down-regulated miRNA | P-value | Fold Change |
|---|---|---|---|---|---|
| hsa-miR-1183 | 1.07E-07 | 44.41 | hsa-miR-30e-5p | 0.001839 | 24.00 |
| hsa-miR-198 | 3.88E-04 | 42.16 | hsa-miR-144-3p | 0.042303 | 19.41 |
| hsa-miR-936 | 0.001909 | 35.16 | hsa-miR-92b-3p | 0.001416 | 17.29 |
| hsa-miR-601 | 0.001846 | 30.83 | hsa-miR-483-3p | 0.002414 | 15.37 |
| hsa-miR-1224-5p | 5.42E-04 | 29.21 | hsa-miR-1260a | 0.006716 | 14.46 |
| hsa-miR-659-3p | 7.51E-04 | 25.28 | hsa-miR-1224-3p | 0.002259 | 13.07 |
| hsa-miR-1182 | 3.07E-05 | 23.79 | hsa-miR-129-2-3p | 0.026973 | 9.70 |
| hsa-miR-557 | 0.020267 | 22.84 | hsa-miR-1825 | 9.39E-04 | 9.28 |
| hsa-miR-877-5p | 9.32E-08 | 19.28 | hsa-miR-22-3p | 1.44E-05 | 9.04 |
| hsa-miR-575 | 0.045361 | 17.53 | hsa-miR-766-3p | 3.21E-07 | 8.89 |
| hsa-miR-371a-5p | 0.03657 | 14.30 | hsa-miR-933 | 0.007722 | 7.57 |
| hsa-miR-765 | 0.007593 | 13.26 | hsa-miR-1281 | 1.49E-04 | 7.36 |
| hsa-miR-874-3p | 0.029926 | 12.98 | hsa-miR-149-5p | 6.17E-04 | 6.02 |
| hsa-miR-498 | 8.55E-05 | 12.58 | hsa-miR-223-3p | 0.038506 | 4.91 |
| hsa-miR-564 | 0.035705 | 9.26 | hsa-miR-361-5p | 0.012961 | 4.29 |
| hsa-miR-484 | 2.52E-08 | 7.34 | hsa-miR-92a-3p | 0.016414 | 4.19 |
| hsa-miR-769-3p | 0.013364 | 5.92 | hsa-miR-494-3p | 0.002235 | 3.56 |
| hsa-miR-623 | 0.004244 | 5.07 | hsa-miR-30d-5p | 4.70E-04 | 3.38 |
| hsa-miR-378a-3p | 0.031318 | 5.02 | hsa-miR-574-5p | 0.036495 | 3.19 |
| hsa-miR-1323 | 0.040302 | 3.15 | hsa-miR-1238-3p | 6.79E-04 | 2.68 |
| hsa-miR-516a-5p | 0.040504 | 2.53 | hsa-miR-940 | 5.81E-04 | 2.64 |
| hsa-miR-526b-5p | 0.041922 | 2.48 | hsa-miR-1237-3p | 0.012315 | 2.23 |
| hsa-miR-939-5p | 0.003595 | 2.42 | hsa-miR-1234-3p | 3.41E-04 | 2.09 |
| hsa-miR-636 | 0.029636 | 2.08 | – | – | – |
Four microRNAs of interest are shown in bold. All microRNAs screened above have a fold change of at least 2 and their target genes could be searched in database
Fig. 2.

Hierarchical clustering analysis of circulating microRNA expression data from samples of essential hypertension patients (n = 4) and the healthy (n = 4). MicroRNA expression data are illustrated by the heat map after cluster analysis. X-axis represents sample names. Y-axis represents micro-RNA names. Each lane indicates microRNA expression. The left our lanes represents the microRNA expression in the essential hypertension group and the right four lanes represents the microRNA expression in the control group. Color bar shows the relative expression. Down-regulated microRNAs are shown in green and up-regulated microRNAs are shown in red
Target gene identification and filteration of candidate microRNA markers
Target genes of the microRNAs were predicted by microRNAorg, PITA and TargetScan. Target genes that were simutaneously predicted by these three tools were selected (Fig. 3 and Fig. 4). In total, 6580 target genes were obtained (Additional file 1: Figure S1). We further screened out 47 microRNAs that had target genes (Tables 1 and 2). The number of up-regulated and down-regulated microRNAs that had target genes was almost equal (Table 1). Hsa-miR-765, hsa-miR-940, hsa-miR-1183, hsa-miR-557 and hsa-miR-939-5p had over 300 target genes. Hsa-miR-765 had the largest number of target genes (475) (Table 3).
Fig. 3.

Chromosome loci of microRNAs and the number of target genes. The right column represents the number of differentially expressed microRNAs located in different chromosome. The left column represents the number of genes targeted by those miRNAs
Fig. 4.

Chromosome loci of target genes and microRNA numbers with target genes. The number of target genes located in each chromosome and the number of miRNAs regulating those genes were shown
Table 3.
Chromosome loci and OMIM disease annotation of microRNA
| MicroRNA | Chr_location | Number of target genes | MIM Number | MIM Title |
|---|---|---|---|---|
| hsa-miR-1182 | 1q42.2 | 145 | #145500/ + 106,150 | HYPERTENSION, ESSENTIAL/ ANGIOTENSINOGEN; AGT |
| hsa-miR-30e-5p | 1p34.2 | 73 | – | – |
| hsa-miR-557 | 1q24.2 | 306 | *131210/ *182330/ #145500 | SELECTIN E; SELE/ ATPase, Na+/K+ TRANSPORTING, BETA-1 POLYPEPTIDE; ATP1B1/ HYPERTENSION, ESSENTIAL |
| hsa-miR-765 | 1q23.1 | 475 | – | – |
| hsa-miR-92b-3p | 1q22 | 131 | #151660 | LIPODYSTROPHY, FAMILIAL PARTIAL, TYPE 2; FPLD2 |
| hsa-miR-149-5p | 2q37.3 | 153 | – | – |
| hsa-miR-933 | 2q31.1 | 11 | – | – |
| hsa-miR-1224-3p/5p | 3q27.1 | 260 | – | – |
| hsa-miR-198 | 3q13.33 | 169 | – | – |
| hsa-miR-564 | 3p21.31 | 53 | *160790 | MYOSIN, LIGHT CHAIN 3, ALKALI, VENTRICULAR, SKELETAL, SLOW; MYL3 |
| hsa-miR-574-5p | 4 | 179 | – | – |
| hsa-miR-575 | 4q21.22 | 105 | – | – |
| hsa-miR-378a-3p | 5q32 | 86 | – | – |
| hsa-miR-874-3p | 5q31.2 | 142 | #614495/ *605775 | PSEUDOHYPOALDOSTERONISM, TYPE IID; PHA2D/ KELCH-LIKE 3; KLHL3 |
| hsa-miR-877-5p | 6p21.33 | 170 | – | – |
| hsa-miR-1183 | 7 | 347 | – | – |
| hsa-miR-1234-3p | 8 | 16 | – | – |
| hsa-miR-30d-5p | 8q24.22 | 69 | – | – |
| hsa-miR-939-5p | 8q24.3 | 305 | #103900/ *608216 | GLUCOCORTICOID-REMEDIABLE ALDOSTERONISM; GRA/ COMM DOMAIN-CONTAINING PROTEIN 5; COMMD5 |
| hsa-miR-601 | 9q33.3 | 70 | – | – |
| hsa-miR-936 | 10q25.1 | 221 | *601568 | ADDUCIN 3; ADD3 |
| hsa-miR-1237-3p | 11 | 129 | – | – |
| hsa-miR-129-2-3p | 11p11.2 | 26 | #125853 | DIABETES MELLITUS, NONINSULIN-DEPENDENT; NIDDM |
| hsa-miR-483-3p | 11p15.5 | 34 | #125852/ *191290 | DIABETES MELLITUS, INSULIN-DEPENDENT, 2/ TYROSINE HYDROXYLASE; TH |
| hsa-miR-623 | 13q32.3 | 231 | – | – |
| hsa-miR-1260a | 14 | 134 | – | – |
| hsa-miR-494-3p | 14q32.31 | 89 | – | – |
| hsa-miR-484 | 16p13.11 | 133 | *603234/ #264800 | ATP-BINDING CASSETTE, SUBFAMILY C, MEMBER 6; ABCC6/ PSEUDOXANTHOMA ELASTICUM; PXE |
| hsa-miR-940 | 16p13.3 | 393 | #173900/ *610886/ *601313 | POLYCYSTIC KIDNEY DISEASE 1; PKD1/ ESSENTIAL MEIOTIC ENDONUCLEASE 1, S. POMBE, HOMOLOG OF, 2; EME2/ POLYCYSTIN 1; PKD1 |
| hsa-miR-144-3p | 17q11.2 | 43 | *163730/ #162200/ #145500 | NITRIC OXIDE SYNTHASE 2A; NOS2A/ NEUROFIBROMATOSIS, TYPE I; NF1/ HYPERTENSION, ESSENTIAL |
| hsa-miR-22-3p | 17p13.3 | 97 | – | – |
| hsa-miR-636 | 17q25.1 | 163 | – | – |
| hsa-miR-1238-3p | 19 | 51 | – | – |
| hsa-miR-1323 | 19q13.42 | 157 | – | – |
| hsa-miR-371a-5p | 19q13.42 | 183 | – | – |
| hsa-miR-498 | 19q13.42 | 188 | – | – |
| hsa-miR-516a-5p | 19q13.42 | 12 | – | – |
| hsa-miR-526b-5p | 19q13.42 | 115 | – | – |
| hsa-miR-769-3p | 19q13.32 | 122 | + 107,741 | APOLIPOPROTEIN E; APOE |
| hsa-miR-1825 | 20 | 40 | – | – |
| hsa-miR-1281 | 22 | 12 | – | – |
| hsa-miR-659-3p | 22q13.1 | 284 | – | – |
| hsa-miR-92a-3p | 13q31.3/Xq26.2 | 165 | – | – |
| hsa-miR-223-3p | Xq12 | 62 | – | – |
| hsa-miR-361-5p | Xq21.2 | 92 | – | – |
| hsa-miR-766-3p | Xq24 | 139 | – | – |
Chr_location, chromosome locus of microRNA. OMIM, Online Mendelian Inheritance in Man. * indicates that this record is a gene; # indicates that this is a descriptive record, often a phenotype, not a unique locus. + indicates that this record contains a description of the genes and phenotypes of known sequences
Functional classification and pathway analysis of the target genes
The biological functions of the target genes were analyzed by GO. Most target genes were involved in the regulation of transcription, signal transduction, organismal development and cell adhesion (Additional file 2: Figure S2A). The number of target genes in cytoplasm and nucleus was almost equal (Additional file 2: Figure S2B). Over half of the target genes (53.8%) had protein binding function, and about 40% of the genes may play roles in zinc-ion binding (17.5%) or metal-ion binding (23.9%) (Additional file 2: Figure S2C).
The target genes were classified into different functional groups based on GO-terms. It is well worth noting that most of genes were enriched in ion binding group (ES = 3.46) and transcription regulation group (ES = 3.44). Target genes involved in cell fraction and cell adhesion were enriched with an enrichment score of 5.55 and 4.33, respectively. In addition, pathway analysis was performed to analyze the signal pathways that target genes or microRNAs may participate in. We found that the target genes were mainly involved in cancer pathways, MAPK pathway, regulation of actin cytoskeleton and focal adhesion (Fig. 5).
Fig. 5.

Pathway analysis that target genes are involved in. The x-axis represents the number of genes involved in corresponding pathway. The y-axis represents names of the top 19 pathways
Cytogenetic location and OMIM annotation of the microRNAs
Cytogenetic location of the 47 microRNA candidates were analyzed. Most of them were located at chromosome 19 (40 microRNAs) and chromosome 1 (45 microRNAs) (Table 3). No microRNA was found on chromosome 12, 15, 18 or Y. Moreover, OMIM records of the patients with essential hypertension were evaluated. Totally, 13 OMIM records about essential hypertension were obtained. The records illustrated the relationship between microRNAs and disease status (Table 3). Hsa-miR-1182, hsa-miR-557 and hsa-miR-144-3p showed a direct correlation with essential hypertension (OMIM ID #145500). Moreover, miR-92b-3p, miR-939-5p, and miR-769-3p were annotated with lipodystrophy, glucocorticoid and apolipoprotein E, which are hypertension-related indicators.
Verification of the potential microRNA markers and microRNA-gene interaction
Four microRNA candidates with significant expression change were verified by qPCR. MiR-198 and miR-1183 showed a higher expression in patients with essential hypertension while miR-30e-5p and miR-144-3p showed lower expression (Fig. 6). Fold change of microRNAs (miR-198, miR-1183, miR-30e-5p and miR-144-3p) measured by qPCR was in accordance with the results of microRNA array (Table 4). In order to explore the relationship between microRNAs and target genes, a microRNA-gene interaction network was constructed (Fig. 7). Target genes of the four microRNAs were selected with a tougher criteria. Target genes were graded using miRBase database firstly and then the genes with scores of more than 80 were selected. Altogether, 33 target genes were obtained. MiR-144-3p shared 21 target genes with miR-30e-5p, while it didn’t share any target gene with miR-198 (Fig. 7). MiR-1183 and miR-198 both regulated ARFGAP2. MiR-1183 and miR-144-3p both targeted MMGT1, ST6GALNAC3 and ZBTB21.
Fig. 6.

Quantitative expression analysis of differentially expressed microRNA by qRT-PCR. Control: healthy samples; HP: essential hypertension samples. Relative expressions of (a) miRNA198, (b) miRNA1183, (c) miRNA30e-5p, and (d) miRNA144-3p were shown. ***: p-value< 0.01, **: p-value< 0.05
Table 4.
Fold change of selected microRNAs
| miRNA | Microarray fold change | qPCR fold change | Change |
|---|---|---|---|
| miRNA198 | 42.16 | 1.87 | Up |
| miRNA1183 | 44.41 | 1.53 | Up |
| miRNA30e-5p | 25.00 | 1.45 | Down |
| miRNA144-3p | 19.41 | 1.87 | Down |
Fig. 7.
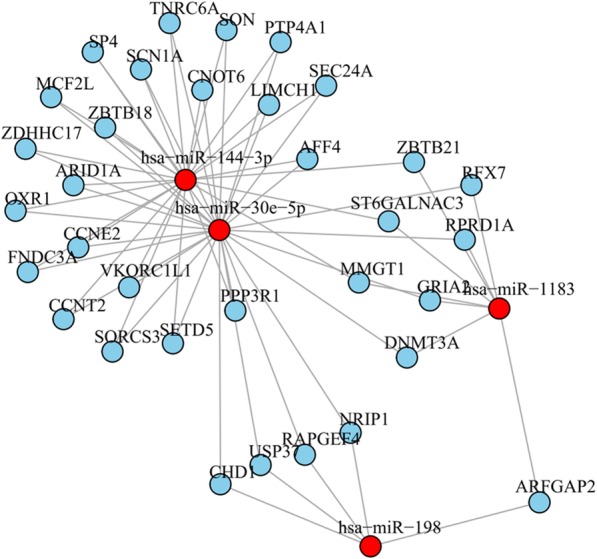
Interaction network of microRNAs and target genes. Red dot represents the four microRNAs of interest that show the most significant expression changes in essential hypertension group. Light blue dot represents target genes of microRNAs. Grey lines represent the interaction between the microRNAs and the target genes
Discussion
In this study, we identified 257 differentially expressed microRNAs from 4 Uyghur patients (from Xinjiang, China) with essential hypertension and constructed a candidate microRNA biomarker set of 47 microRNAs. To the best of our knowledge, this study is the first report to screen microRNA markers of essential hypertension in Uyghur population of Xinjiang, China. Our results add new information to the potential microRNA markers of essential hypertension.
Among the 47 microRNAs, the number of up-regulated and down-regulated microRNAs was almost equal. However, we found that the expression of up-regulated microRNAs changed more significantly. Compared with the microRNA profiles of hypertension reported by previous studies [2–4], many new microRNAs were identified in this study. The difference may be due to the complexity of hypertension or the differences in sampling population or methods [2, 4].
Previous studies have shown that essential hypertension may be caused by genetic factors [1, 2]. Here, we found that the microRNAs were mostly located on chromosome 1 and chromosome 19. Five miRNAs located at different loci of chromosome 1 and seven miRNAs located at chromosome 19, five of which located at the same locus (19q13.42). Further analysis through the OMIM database revealed that miR-1182 was annotated with angiotensinogen, a protein related to essential hypertension [4, 8]. Moreover, miR-557 was related to ATPase and Na+/K+ transport, which play important roles in the blood pressure regulation [12, 13]. miR-769-3p was annotated with apolipoprotein, a molecule that is closely related to cardiac diseases [14]. These results demonstrate that the idenfied microRNAs are related with the metabolic processes of essential hypertension, indicating that these microRNAs may be involved in the development of essential hypertension.
Target genes were clustered into 8 groups by functional annotation and most of them were enriched in metal ion binding and transcription regulation (Table 5). Abnormal Ca2+/Na+ is one of the common phenomena in hypertension and cardiovascular diseases [12]. Annotation analysis both in microRNAs and target genes showed a tendency in ATP and mineral ions metabolism. This suggests that these microRNAs may be used as potential diagnostic markers. Further studies on the role and mechanism of microRNAs in essential hypertension are needed.
Table 5.
GO classification of target genes
| Enrichment Score | Term | Count | % | P-value |
|---|---|---|---|---|
| 5.55 | GO:0000267~cell fraction | 117 | 8.93 | 2.35E-06 |
| GO:0005624~membrane fraction | 93 | 7.10 | 2.56E-06 | |
| GO:0005626~insoluble fraction | 95 | 7.25 | 3.76E-06 | |
| 4.90 | GO:0030424~axon | 31 | 2.37 | 6.00E-07 |
| GO:0043005~neuron projection | 49 | 3.74 | 3.38E-06 | |
| GO:0042995~cell projection | 72 | 5.50 | 9.96E-04 | |
| 4.33 | GO:0007156~homophilic cell adhesion | 32 | 2.44 | 3.32E-09 |
| GO:0016337~cell-cell adhesion | 40 | 3.05 | 5.08E-05 | |
| cell adhesion | 50 | 3.82 | 1.66E-04 | |
| GO:0007155~cell adhesion | 72 | 5.50 | 0.002747 | |
| GO:0022610~biological adhesion | 72 | 5.50 | 0.002857 | |
| 3.46 | GO:0046872~metal ion binding | 367 | 28.02 | 1.88E-05 |
| zinc-finger | 160 | 12.21 | 2.68E-05 | |
| GO:0043169~cation binding | 367 | 28.02 | 4.67E-05 | |
| GO:0043167~ion binding | 370 | 28.24 | 7.72E-05 | |
| zinc | 188 | 14.35 | 4.53E-04 | |
| metal-binding | 243 | 18.55 | 9.94E-04 | |
| 3.44 | transcription regulation | 195 | 14.89 | 3.24E-07 |
| Transcription | 198 | 15.11 | 3.92E-07 | |
| nucleus | 364 | 27.79 | 7.14E-07 | |
| GO:0030528~transcription regulator activity | 152 | 11.60 | 6.06E-05 | |
| GO:0045449~regulation of transcription | 234 | 17.86 | 2.32E-04 | |
| GO:0006350~transcription | 191 | 14.58 | 6.37E-04 | |
| GO:0043565~sequence-specific DNA binding | 65 | 4.96 | 0.002591 | |
| GO:0003700~transcription factor activity | 95 | 7.25 | 0.004676 | |
| 3.22 | GO:0014069~postsynaptic density | 18 | 1.37 | 6.30E-06 |
| GO:0045202~synapse | 48 | 3.66 | 2.05E-05 | |
| GO:0030054~cell junction | 61 | 4.66 | 9.09E-05 | |
| cell junction | 47 | 3.59 | 3.04E-04 | |
| synapse | 29 | 2.21 | 5.96E-04 | |
| GO:0044456~synapse part | 29 | 2.21 | 0.00823 | |
| 3.20 | ubl conjugation pathway | 62 | 4.73 | 1.05E-05 |
| GO:0051603~proteolysis involved in cellular protein catabolic process | 70 | 5.34 | 1.00E-04 | |
| GO:0044257~cellular protein catabolic process | 70 | 5.34 | 1.15E-04 | |
| GO:0043632~modification-dependent macromolecule catabolic process | 66 | 5.04 | 2.46E-04 | |
| GO:0019941~modification-dependent protein catabolic process | 66 | 5.04 | 2.46E-04 | |
| GO:0030163~protein catabolic process | 70 | 5.34 | 2.89E-04 | |
| GO:0006511~ubiquitin-dependent protein catabolic process | 34 | 2.60 | 3.62E-04 | |
| GO:0044265~cellular macromolecule catabolic process | 74 | 5.65 | 0.002887 | |
| 3.12 | kinase | 80 | 6.11 | 2.92E-06 |
| nucleotide-binding | 159 | 12.14 | 1.50E-05 | |
| transferase | 132 | 10.08 | 7.49E-05 | |
| atp-binding | 125 | 9.54 | 1.39E-04 | |
| GO:0006796~phosphate metabolic process | 102 | 7.79 | 1.62E-04 | |
| GO:0006793~phosphorus metabolic process | 102 | 7.79 | 1.62E-04 | |
| GO:0006468~protein amino acid phosphorylation | 73 | 5.57 | 4.73E-04 | |
| GO:0017076~purine nucleotide binding | 178 | 13.59 | 8.59E-04 | |
| GO:0016310~phosphorylation | 83 | 6.34 | 9.76E-04 | |
| GO:0032553~ribonucleotide binding | 170 | 12.98 | 0.001314 | |
| GO:0032555~purine ribonucleotide binding | 170 | 12.98 | 0.001314 | |
| serine/threonine-protein kinase | 43 | 3.28 | 0.001333 | |
| GO:0001883~purine nucleoside binding | 148 | 11.30 | 0.003017 | |
| GO:0030554~adenyl nucleotide binding | 146 | 11.15 | 0.003068 | |
| GO:0000166~nucleotide binding | 199 | 15.19 | 0.0037 | |
| GO:0001882~nucleoside binding | 148 | 11.30 | 0.003985 | |
| GO:0005524~ATP binding | 137 | 10.46 | 0.004062 | |
| GO:0032559~adenyl ribonucleotide binding | 138 | 10.53 | 0.004694 |
In our study, target genes related to cell adhesion and junction were enriched into two clusters. Researchers have found that miR-92a may play a role in mediating cell-to-cell communication [15–17]. The miR-1 may affect the genes of gap-junction channels [12, 18]. Our results reveal that microRNAs may participate in regulating cell communications in essential hypertension. Pathway analysis also supported their role in cell to cell communication. Genes in this pathway are involved in focal adhesion and regulation of actin cytoskeleton and adherence junction. However, sources of microRNAs in plasma are various. Apoptotic, necrotic cell death and active secretion all result in detectable microRNAs in plasma [19].
MiR-198 and miR-1183 were the two most significantly up-regulated microRNAs according to the microarray results, while miR-30e-5p and miR-144-3p were the two most significantly down-regulated microRNAs. QPCR further confirmed the microarray results. However, the fold change of microRNA expression measured by qPCR was not as significant as that by microarray. Li et al. found that miR-1183 was a potential diagnostic marker for rheumatic heart disease [20]. High expression level of miR-198 is reported in acute coronary syndromes [21]. miR-30e-5p is found to suppress the expression of hypertension related gene ADRA2A in human endothelial cells [22]. miR-144-3p regulates cholesterol homeostasis and is identified as a potential therapeutic target of atherosclerosis and acute myocardial infarction [23]. However, how are these four microRNAs involved in essential hypertension are unclear. The significant changes of their expression in this research may pave a way for further study.
Interaction analysis can greatly help us to understand the relationship of microRNAs with target genes. One microRNA may regulate multiple genes, and one gene might be regulated by different microRNAs [3–5]. In this study, the target genes of miR-198, miR-1183, miR-30e-5p and miR-144-3p were predicted and a microRNA-gene interaction network was constructed. Totally, 33 target genes were obtained. However, functional analysis and validation of the target genes are not performed and needs further study.
This study has some limitations. First, this study focused on Uyghur subjects from Xinjiang, China. Thus, the results of this study may lack representativeness for the general population. Second, the sample size was relatively small. Third, the number of differentially expressed microRNAs validated by qPCR was small. Fourth, the function of the 33 target genes of miR-1183, miR198, miR144-3p and miR-30e-5p was not further analyzed. Further studies are warranted.
In conclusion, we constructed a reference microRNA pool of essential hypertension and obtained a set of circulating microRNAs, which may be used as potential biomarkers for essential hypertension. These microRNAs showed a remarkable correlation with mineral ion metabolism and cellular communication. Four microRNAs (miR-1183, miR-198, miR-30e-5p and miR-144-3p) that showed most prominent change were further verified. A regulatory network between these microRNAs and their target genes was also constructed, which may provide experimental evidence for further study of the mechanism of essential hypertension.
Additional files
Figure S1. Target genes prediction by three microRNA databases. Targetscan (http://www.targetscan.org/), microRNAorg (http://www.microrna.org/), and, pita (https://genie.weizmann.ac.il/pubs/mir07/) was used (TIF 99 kb)
Figure S2. GO analysis. (A) Target gene coverage of GO biological process term. (B) Target gene coverage of GO cellular component terms. (C) Target gene coverage of GO molecular function terms (TIF 503 kb)
Acknowledgments
None.
Funding
This work was supported by the National natural Science Foundation of China [grant number NSFC81660071]. The funding source had no involvement in study design, in the collection, analysis and interpretation of data, in the writing of the report, and in the decision to submit the article for publication.
Availability of data and materials
The datasets during and analyzed during the current study are available from the corresponding author on reasonable request.
Abbreviations
- GO
Gene Ontology
- HGNC
Hugo Gene Nomenclature Committee
- KEGG
Kyoto Encyclopedia of Genes and Genomes
- OMIM
Online Mendelian Inheritance in Man
- qPCR
Quantitative Real-time PCR
Authors’ contributions
ZXH and TBP designed the study, evaluated the data, and edited the manuscript. YYZ and YJZ carried out the experiments and drafted the manuscript. LWK and LYM contributed to sample collection. ZL and ZY analyzed data. ZM, FP and YB searched the literatures. All authors read and approved the final manuscript.
Ethics approval and consent to participate
The study was approved by ethical committee of Xinjiang Medical University.
Consent for publication
All patients and their families signed the informed consent.
Competing interests
The authors declare that they have no competing interests.
Publisher’s Note
Springer Nature remains neutral with regard to jurisdictional claims in published maps and institutional affiliations.
Contributor Information
Xianhui Zhou, Phone: +86-13899889800, Email: zhouxhuiyf@163.com.
Baopeng Tang, Phone: +86-13579881111, Email: tangbaopeng1111@163.com, Email: 64197378@qq.com.
References
- 1.Marques FZ, Campain AE, Tomaszewski M, Zukowska-Szczechowska E, Yang YH, Charchar FJ, et al. Gene expression profiling reveals renin mRNA overexpression in human hypertensive kidneys and a role for microRNAs. Hypertension. 2011;58:1093–1098. doi: 10.1161/HYPERTENSIONAHA.111.180729. [DOI] [PubMed] [Google Scholar]
- 2.Romaine SP, Charchar FJ, Samani NJ, Tomaszewski M. Circulating microRNAs and hypertension--from new insights into blood pressure regulation to biomarkers of cardiovascular risk. Curr Opin Pharmacol. 2016;27:1–7. doi: 10.1016/j.coph.2015.12.002. [DOI] [PubMed] [Google Scholar]
- 3.Bronze-da-Rocha E. MicroRNAs expression profiles in cardiovascular diseases. Biomed Res Int. 2014;2014:985408. doi: 10.1155/2014/985408. [DOI] [PMC free article] [PubMed] [Google Scholar]
- 4.Marques FZ, Booth SA, Charchar FJ. The emerging role of non-coding RNA in essential hypertension and blood pressure regulation. J Hum Hypertens. 2015;29:459–467. doi: 10.1038/jhh.2014.99. [DOI] [PubMed] [Google Scholar]
- 5.Bartel DP. MicroRNAs: genomics, biogenesis, mechanism, and function. Cell. 2004;116:281–297. doi: 10.1016/S0092-8674(04)00045-5. [DOI] [PubMed] [Google Scholar]
- 6.Wahid F, Shehzad A, Khan T, Kim YY. MicroRNAs: synthesis, mechanism, function, and recent clinical trials. Biochim Biophys Acta. 2010;1803:1231–1243. doi: 10.1016/j.bbamcr.2010.06.013. [DOI] [PubMed] [Google Scholar]
- 7.Li S, Zhu J, Zhang W, Chen Y, Zhang K, Popescu LM, et al. Signature microRNA expression profile of essential hypertension and its novel link to human cytomegalovirus infection. Circulation. 2011;124:175–184. doi: 10.1161/CIRCULATIONAHA.110.012237. [DOI] [PubMed] [Google Scholar]
- 8.Yang Q, Jia C, Wang P, Xiong M, Cui J, Li L, et al. MicroRNA-505 identified from patients with essential hypertension impairs endothelial cell migration and tube formation. Int J Cardiol. 2014;177:925–934. doi: 10.1016/j.ijcard.2014.09.204. [DOI] [PubMed] [Google Scholar]
- 9.Marques FZ, Romaine SP, Denniff M, Eales J, Dormer J, Garrelds IM, et al. Signatures of miR-181a on renal transcriptome and blood pressure. Mol Med. 2015;21(1):739–748. doi: 10.2119/molmed.2015.00096. [DOI] [PMC free article] [PubMed] [Google Scholar]
- 10.Kontaraki JE, Marketou ME, Zacharis EA, Parthenakis FI, Vardas PE. MicroRNA-9 and microRNA-126 expression levels in patients with essential hypertension: potential markers of target-organ damage. J Am Soc Hypertens. 2014;8:368–375. doi: 10.1016/j.jash.2014.03.324. [DOI] [PubMed] [Google Scholar]
- 11.Kontaraki JE, Marketou ME, Zacharis EA, Parthenakis FI, Vardas PE. Differential expression of vascular smooth muscle-modulating microRNAs in human peripheral blood mononuclear cells: novel targets in essential hypertension. J Hum Hypertens. 2014;28:510–516. doi: 10.1038/jhh.2013.117. [DOI] [PubMed] [Google Scholar]
- 12.Luo X, Yang B, Nattel S. MicroRNAs and atrial fibrillation: mechanisms and translational potential. Nat Rev Cardiol. 2015;12:80–90. doi: 10.1038/nrcardio.2014.178. [DOI] [PubMed] [Google Scholar]
- 13.O'Connor DT, Zhu G, Rao F, Taupenot L, Fung MM, Das M, et al. Heritability and genome-wide linkage in US and australian twins identify novel genomic regions controlling chromogranin a: implications for secretion and blood pressure. Circulation. 2008;118:247–257. doi: 10.1161/CIRCULATIONAHA.107.709105. [DOI] [PMC free article] [PubMed] [Google Scholar]
- 14.Sinha R, Singh R. Role of apolipoprotein AI gene polymorphism (G-75A and C+83T) in essential hypertension in Indian population. Ann Clin Lab Sci. 2014;44:298–303. [PubMed] [Google Scholar]
- 15.Emanueli C, Shearn AI, Angelini GD, Sahoo S. Exosomes and exosomal miRNAs in cardiovascular protection and repair. Vasc Pharmacol. 2015;71:24–30. doi: 10.1016/j.vph.2015.02.008. [DOI] [PMC free article] [PubMed] [Google Scholar]
- 16.Mittelbrunn M, Sanchez-Madrid F. Intercellular communication: diverse structures for exchange of genetic information. Nat Rev Mol Cell Biol. 2012;13:328–335. doi: 10.1038/nrm3335. [DOI] [PMC free article] [PubMed] [Google Scholar]
- 17.Valadi H, Ekstrom K, Bossios A, Sjostrand M, Lee JJ, Lotvall JO. Exosome-mediated transfer of mRNAs and microRNAs is a novel mechanism of genetic exchange between cells. Nat Cell Biol. 2007;9:654–659. doi: 10.1038/ncb1596. [DOI] [PubMed] [Google Scholar]
- 18.Yang B, Lin H, Xiao J, Lu Y, Luo X, Li B, et al. The muscle-specific microRNA miR-1 regulates cardiac arrhythmogenic potential by targeting GJA1 and KCNJ2. Nat Med. 2007;13:486–491. doi: 10.1038/nm1569. [DOI] [PubMed] [Google Scholar]
- 19.van Empel VP, De Windt LJ, da Costa Martins PA. Circulating miRNAs: reflecting or affecting cardiovascular disease? Curr Hypertens Rep. 2012;14:498–509. doi: 10.1007/s11906-012-0310-7. [DOI] [PubMed] [Google Scholar]
- 20.Li N, Lian J, Zhao S, Zheng D, Yang X, Huang X, et al. Detection of differentially expressed MicroRNAs in rheumatic heart disease: miR-1183 and miR-1299 as potential diagnostic biomarkers. Biomed Res Int. 2015;2015:524519. doi: 10.1155/2015/524519. [DOI] [PMC free article] [PubMed] [Google Scholar]
- 21.Li M, Zhang J. Circulating MicroRNAs: potential and emerging biomarkers for diagnosis of cardiovascular and cerebrovascular diseases. Biomed Res Int. 2015;2015:730535. doi: 10.1155/2015/730535. [DOI] [PMC free article] [PubMed] [Google Scholar]
- 22.Kriegel AJ, Baker MA, Liu Y, Liu P, Cowley AW, Jr, Liang M. Endogenous microRNAs in human microvascular endothelial cells regulate mRNAs encoded by hypertension-related genes. Hypertension. 2015;66:793–799. doi: 10.1161/HYPERTENSIONAHA.115.05645. [DOI] [PMC free article] [PubMed] [Google Scholar]
- 23.Hu YW, Hu YR, Zhao JY, Li SF, Ma X, Wu SG, et al. An agomir of miR-144-3p accelerates plaque formation through impairing reverse cholesterol transport and promoting pro-inflammatory cytokine production. PLoS One. 2014;9:e94997. doi: 10.1371/journal.pone.0094997. [DOI] [PMC free article] [PubMed] [Google Scholar]
Associated Data
This section collects any data citations, data availability statements, or supplementary materials included in this article.
Supplementary Materials
Figure S1. Target genes prediction by three microRNA databases. Targetscan (http://www.targetscan.org/), microRNAorg (http://www.microrna.org/), and, pita (https://genie.weizmann.ac.il/pubs/mir07/) was used (TIF 99 kb)
Figure S2. GO analysis. (A) Target gene coverage of GO biological process term. (B) Target gene coverage of GO cellular component terms. (C) Target gene coverage of GO molecular function terms (TIF 503 kb)
Data Availability Statement
The datasets during and analyzed during the current study are available from the corresponding author on reasonable request.