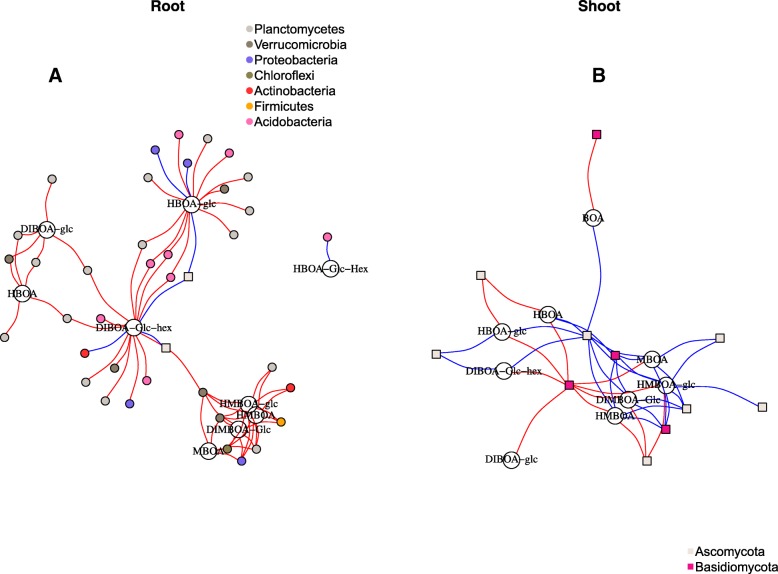
Fig. 6.
Network showing bacterial and fungal OTUs correlated to different BX metabolites. BX-OTU correlations in a roots and in b shoots at 10 DAS. OTUs and BX metabolites are shown as nodes with different size, and the correlation is shown as edges in the network. Positive and negative correlations are shown with blue and red edges, respectively. Bacterial and fungal nodes are represented as squares and circles, respectively

