Summary
Prostate cancer patients frequently experience resistance to androgen deprivation therapy (ADT). Acquiring a better understanding of the mechanisms controlling the development of castration resistant prostate cancer (CRPC) remains an unmet clinical need. The well-established dependency of cancer cells on the tumor microenvironment suggests that it might control the emergence of CRPC. Here, we identify IL23 produced by myeloid-derived suppressor cells (MDSCs) as a driver of CRPC. Mechanistically, IL23 secreted by MDSCs can activate the androgen receptor pathway in prostate tumor cells, promoting cell survival and proliferation in androgen deprived conditions. Intra-tumor MDSC infiltration, and IL23 concentration, increases in the blood and tumor samples of CRPC patients. Antibody-mediated inactivation of IL23 restored sensitivity to ADT in mice. Taken together, these results reveal that MDSCs promote CRPC by acting in a non-cell autonomous manner. Treatments that block IL23 can oppose MDSC-mediated castration resistance and synergize with standard of care therapies.
Prostate cancer is the most commonly diagnosed male cancer in the world and the second leading cause of male cancer mortality1. After the identification that androgens and AR signaling promote prostate cancer progression, ADT has become the mainstay of prostate cancer therapy for patients at different stages of disease2. However, a significant fraction of patients receiving such treatments ultimately progress, developing CRPC2. The prognosis of CRPC patients remains poor and the treatment of these patients remains a major unmet medical need2–8. A better understanding of the mechanisms that drive CRPC could identify more effective therapies. Deregulated AR signaling, induced by genomic amplification of the AR locus, AR splice variants and activation of co-regulators of the AR, is considered the major determinant of CRPC2. Activation of several AR-alternative signaling pathways also promotes CRPC9,10. However, these mechanisms imply cell-autonomous alterations occurring in prostate tumor cells and do not take in consideration that these cells are surrounded by a complex tumor microenvironment. The well-established dependency of cancer cells on the tumor microenvironment11 suggests that the non-cancer-cell component of the tumor may control prostate cancer progression, although the contribution of the tumor microenvironment, and in particular of the tumor immune response to the emergence of CRPC, remains elusive12,13. We and others have previously reported that MDSCs are a prominent immune cell subset infiltrating the CRPC microenvironment14–16. MDSCs are a heterogeneous population of activated immune cells expanded in pathological conditions, including cancer, with potent immunosuppressing activity17. Based on their expression markers, MDSCs can be classified into monocytic (Mo)-MDSCs or polymorphonuclear (PMN)-MDSCs18. Higher numbers of circulating and tumor-infiltrating MDSCs have been observed in a large fraction of patients suffering from different tumors including prostate cancer17,19,20. MDSCs can support tumorigenesis by either suppressing the antitumor immune response or by promoting angiogenesis and senescence evasion in a number of contexts including prostate cancer15,16,21. MDSCs have been also found elevated in patients that do not respond to ADT20. However, whether MDSCs support androgen-independent tumor growth and the emergence of CRPC remains unknown. Here, we show that IL23 secreted by increased numbers of MDSCs in both human and mouse prostate tumors can confer androgen independence in a non-cell autonomous manner through the activation of AR signaling. Inhibition of IL23 or IL23 receptor signaling in these tumors restores sensitivity to ADT.
MDSCs confer castration resistance
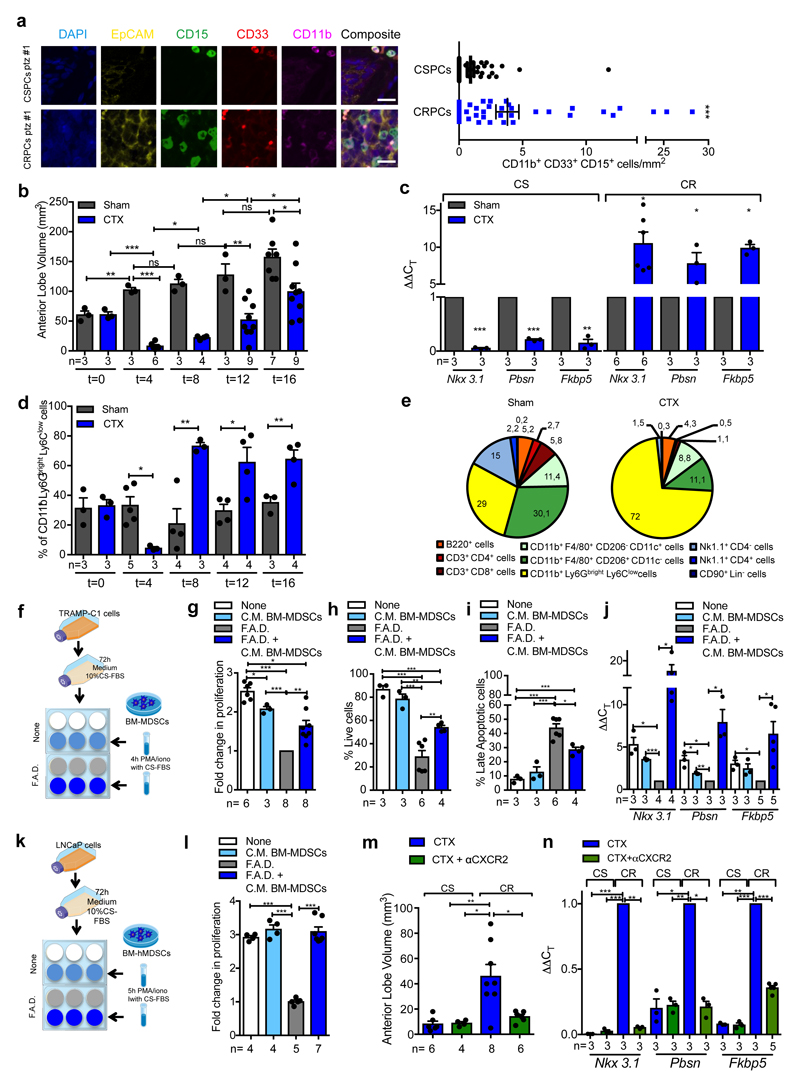
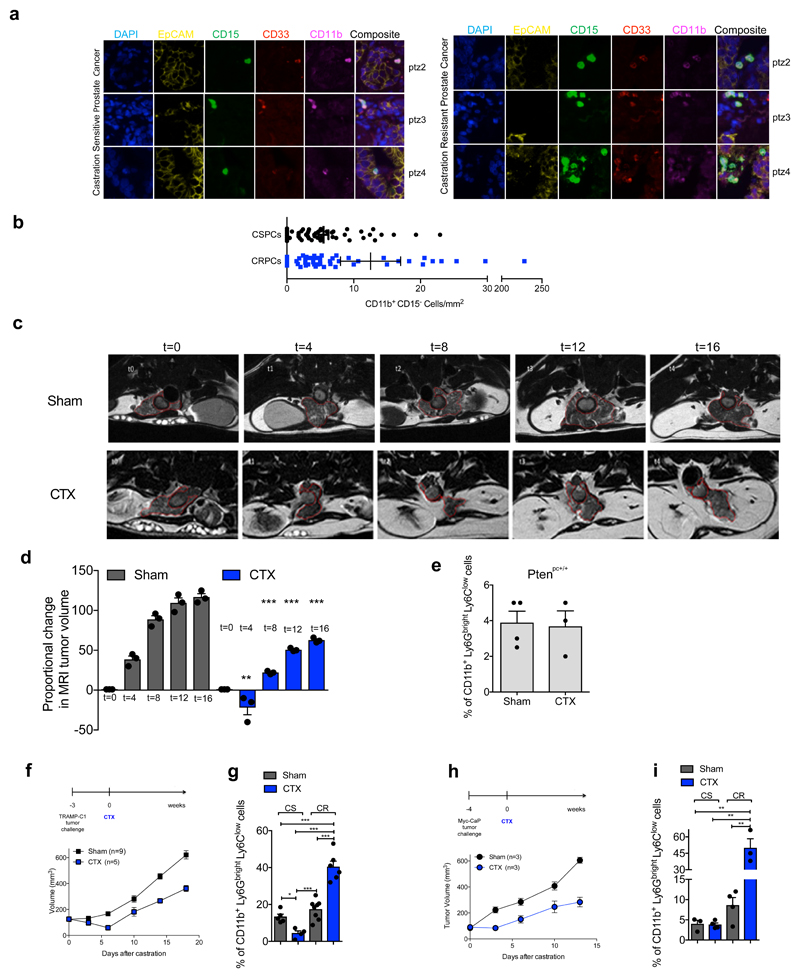
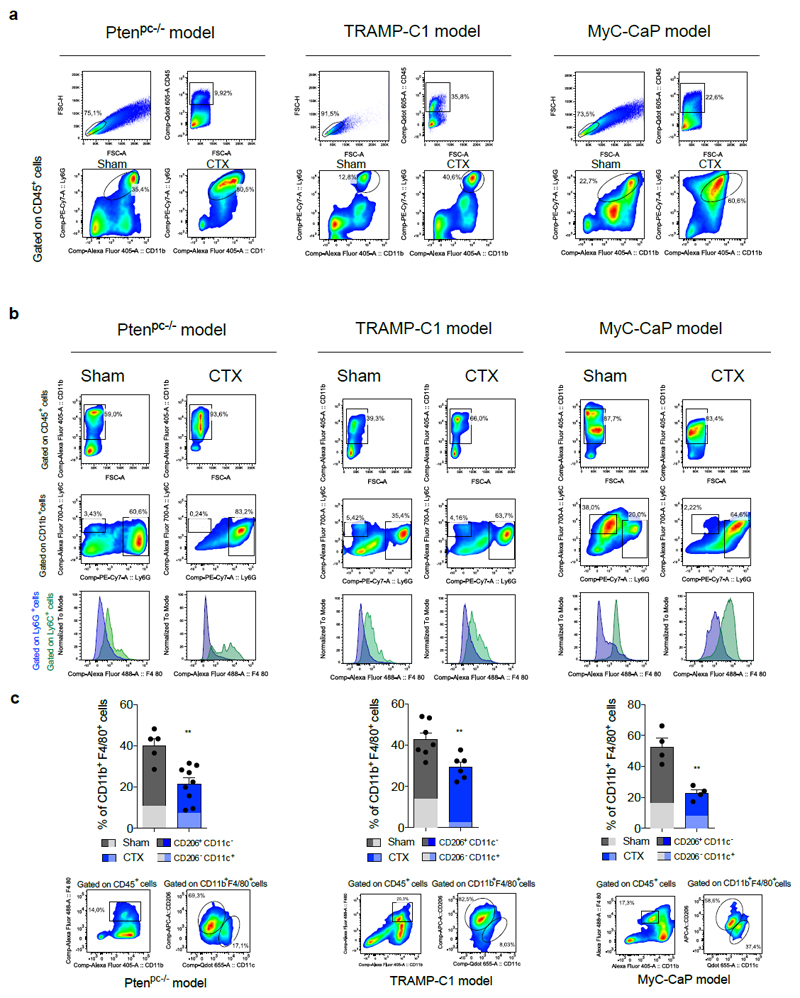
By analyzing castration-sensitive (CSPC) and CRPC biopsies we found that PMN-MDSCs (CD11b+ CD33+ CD15+ cells)18 were enriched in CRPC and localized in close proximity to EpCAM+ epithelial tumor cells (Figure 1a; Extended Data 1a). Interestingly, increased PMN-MDSCs in tumors were not associated with elevated levels of CD11b+ CD15- cells (Extended Data 1b). These findings prompted us to hypothesize that tumor infiltrating PMN-MDSCs could directly contribute to the emergence of CRPC. We investigated this hypothesis by using the Pten null prostate conditional (Ptenpc-/-) mouse model and two additional allograft models of prostate cancer (TRAMP-C1 and MyC-CaP) that develop tumors driven by Pten loss, p53/RB inactivation or c-MYC amplification respectively2. As previously reported22, surgical castration in Ptenpc-/- mice leads to initial tumor regression (castration sensitive (CS) phase, t=4) followed by tumor progression and emergence of castration resistant prostate tumors (castration resistant (CR) phase, t=12) (Figure 1b; Extended Data 1c-d), with AR target genes being down-regulated in tumors in the CS phase and up-regulated in the CR phase when compared with sham-operated mice (Figure 1c). To assess whether castration affects the recruitment of PMN-MDSCs in these tumors, we measured the frequency of PMN-MDSCs (CD11b+ Ly6Gbright Ly6Clow cells)18 in sham-operated and castrated Ptenpc-/- mice in a time course experiment. Interestingly, PMN-MDSCs number increased over time, paralleling the emergence of CRPC (Figure 1b, d; Extended Data 1e; Extended Data 2a). Of note, PMN-MDSCs represented the major immune subset that increased in Pten null tumors upon castration (Figure 1e; Extended Data 2b-c). This increase in PMN-MDSCs was validated in TRAMP-C1 and MyC-CaP castrated mice that develop CRPC within 10-days after castration (Extended Data 1f-i; Extended Data 2a). Intriguingly, while PMN-MDSCs increased in castrated tumors, the frequency of tumor-infiltrating macrophages (TAMs) decreased (Figure 1e; Extended Data 2c).
Figure 1. MDSCs infiltrate CRPC paralleling the activation of AR pathway and conferring castration resistance.
a, CD11b+ CD33+ CD15+ PMN-MDSCs within the tumors of CSPCs vs CRPCs. EpCAM yellow, CD15 green, CD33 red; CD11b pink; DAPI blue, n=51 biological independent patients per group reported as mean ± SEM. Statistical analyses (negative binomial regression model): P <0.001. b-d, Ptenpc-/- mice sham-operated (Sham) or surgically castrated (CTX) Ptenpc-/- mice at different time points. b, Tumor volume of the anterior prostate lobe. c, qRT-PCR analyses of the indicated genes in the prostate tumors at t=4 (castration sensitive phase; CS) and t=12 (castration resistance phase; CR). d, Flow cytometry for tumor PMN-MDSCs (gated on CD45+ cells). e, Percentages of tumor-infiltrating immune cell populations (gated on CD45+ cells). f, Experimental scheme. g, TRAMP-C1 cell proliferation. h, Percentage of AnnexinV and 7AAD-negative TRAMP-C1 cells. i, Percentage of AnnexinV and 7AAD-positive TRAMP-C1 cells. j, qRT-PCR analyses of the indicated genes in TRAMP-C1 cells. k, Experimental scheme. l, LNCaP cell proliferation. m, Volume of prostate tumors of CTX Ptenpc-/- mice treated or not with CXCR2 antagonist (αCXCR2) at completion of the study (12-weeks upon CTX). n, qRT-PCR analyses of the indicated genes in the prostate tumors of mice treated as in m. Specific n values of biological independent animals (b, c, d, m, n) and independent samples (g-j, l) are shown and reported as mean ± SEM. b, d, h, i, -, l, m, Statistical analyses (Unpaired two-sided t-test): ns, not significant; *P <0.05; **P <0.01; ***P <0.001. b, d, Statistical analyses (One-way ANOVA, two-sided): P <0.001. c, g, j, n, Statistical analyses (Paired two-sided t-test): *P <0.05; **P <0.01; ***P <0.001.
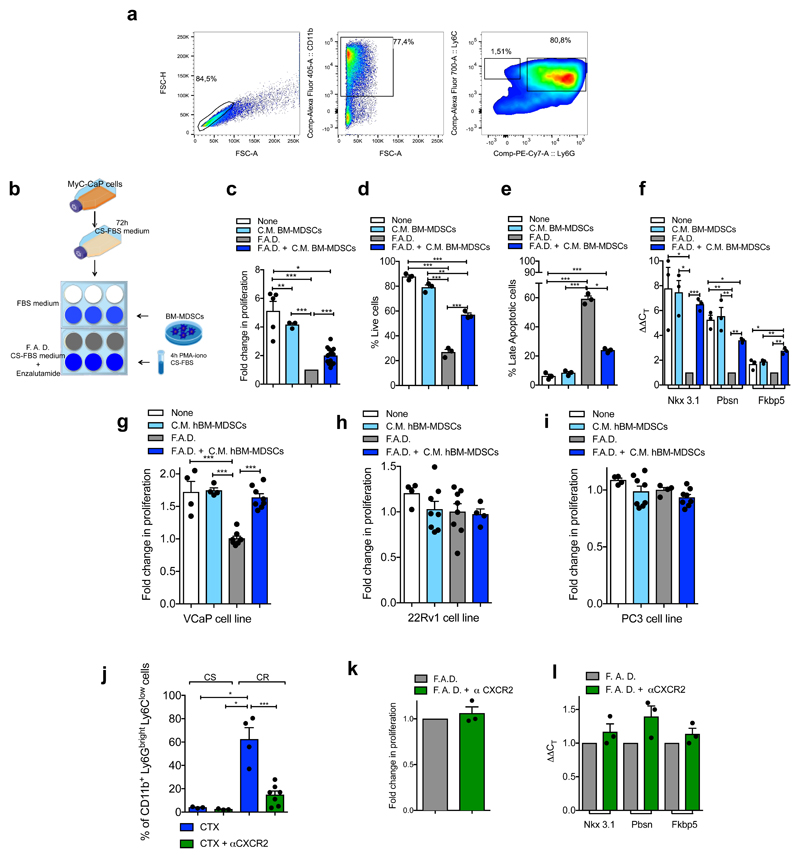
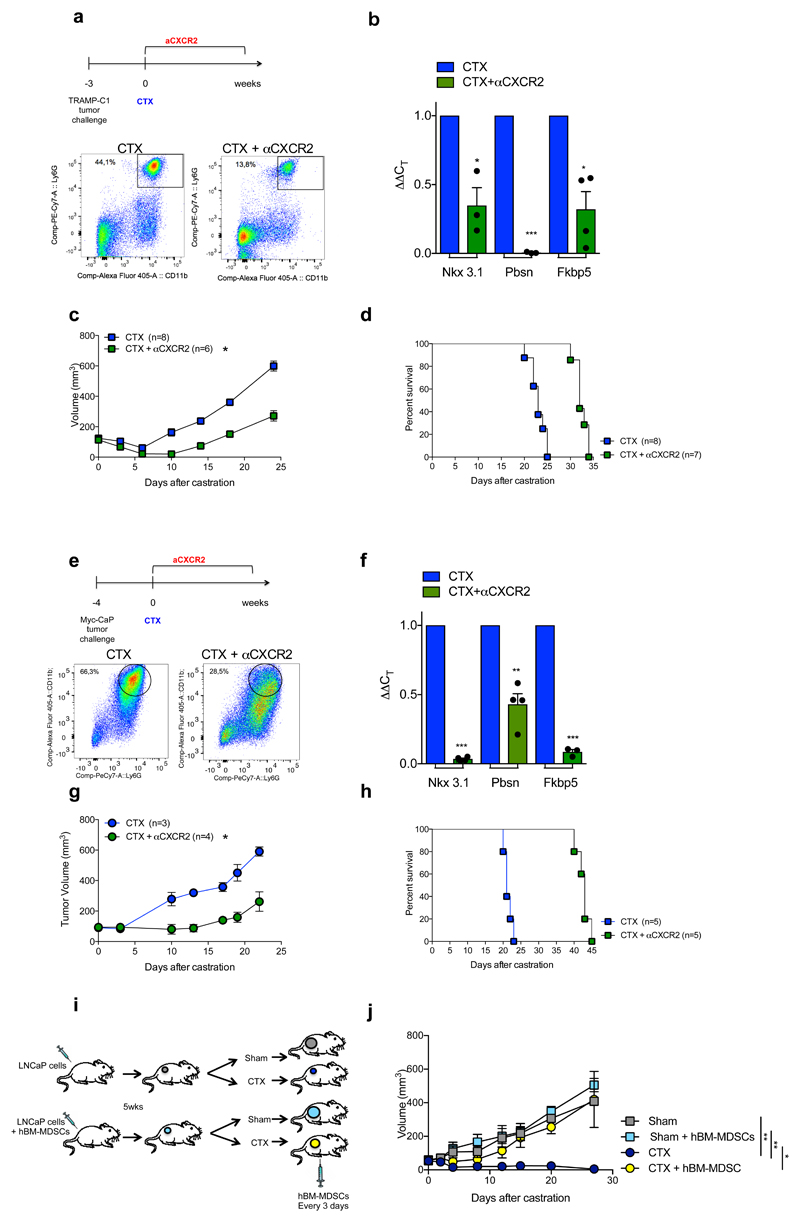
To assess whether factors secreted by MDSCs impact AR pathway signaling in prostate cancer cells, we co-cultured two murine androgen-dependent prostate cancer cell lines, TRAMP-C1 and MyC-CaP, in the presence of conditioned medium (C. M.) obtained from bone marrow (BM)-derived MDSCs (Figure 1f, Extended Data 3a-b). Surprisingly, the C. M. of MDSCs sustained the proliferation and survival of cells cultured under full androgen deprivation (F. A. D.), enhancing the transcription of AR target genes (Figure 1g-j, Extended Data 3c-f). These results were further validated in both androgen-dependent (LNCaP and VCaP) and androgen-independent (22Rv1 and PC3) human prostate cancer cell lines cultured in presence of C. M. from human BM-MDSCs (Figure 1k-l; Extended Data 3g-i). Taken together, these data demonstrated that MDSCs can regulate, in a paracrine manner, androgen deprivation sensitivity in prostate tumor cells. We next assessed whether depletion of MDSCs could delay the emergence of CRPC in castrated mice. We therefore treated castrated Ptenpc-/- mice, TRAMP-C1 and MyC-CaP allograft mice with AZD5069, a selective CXCR2 antagonist (αCXCR2) under clinical evaluation23. Treatment with αCXCR2 strongly reduced the tumor infiltration of PMN-MDSCs in all the mouse models analyzed (Extended Data 3j; Extended Data 4a,e). Notably, while Ptenpc-/- castrated mice treated with αCXCR2 did not progress to CRPCs, untreated mice developed CRPCs four months after castration as demonstrated by the levels of AR target genes (Figure 1m-n). This finding was also confirmed in TRAMP-C1 and MyC-CaP allograft mice, where inhibition of MDSCs tumor recruitment delayed the emergence of CRPC as shown by decreased tumor size and level of AR target genes in treated mice, resulting in longer survival in αCXCR2 treated mice (Extended Data 4a-h). Of note, αCXCR2 treatment did not directly impact cell proliferation and AR activity in mouse prostate tumor cells cultured in F. A. D., in vitro (Extended Data 3k-l). To corroborate the role of MDSCs as drivers of CRPC in the human setting, we co-injected hBM-MDSCs with LNCaP cells in NOD-SCID mice, and assessed tumor growth over time in intact versus castrated hosts. In line with our previous evidence, the co-injection of LNCaP with hBM-MDSCs conferred resistance to castration (Extended Data 4i-j). Taken together, these data indicated that MDSCs are increased in CRPC and can promote prostate tumor cell proliferation by sustaining AR signaling following androgen deprivation.
IL23 drives insensitivity to androgen deprivation
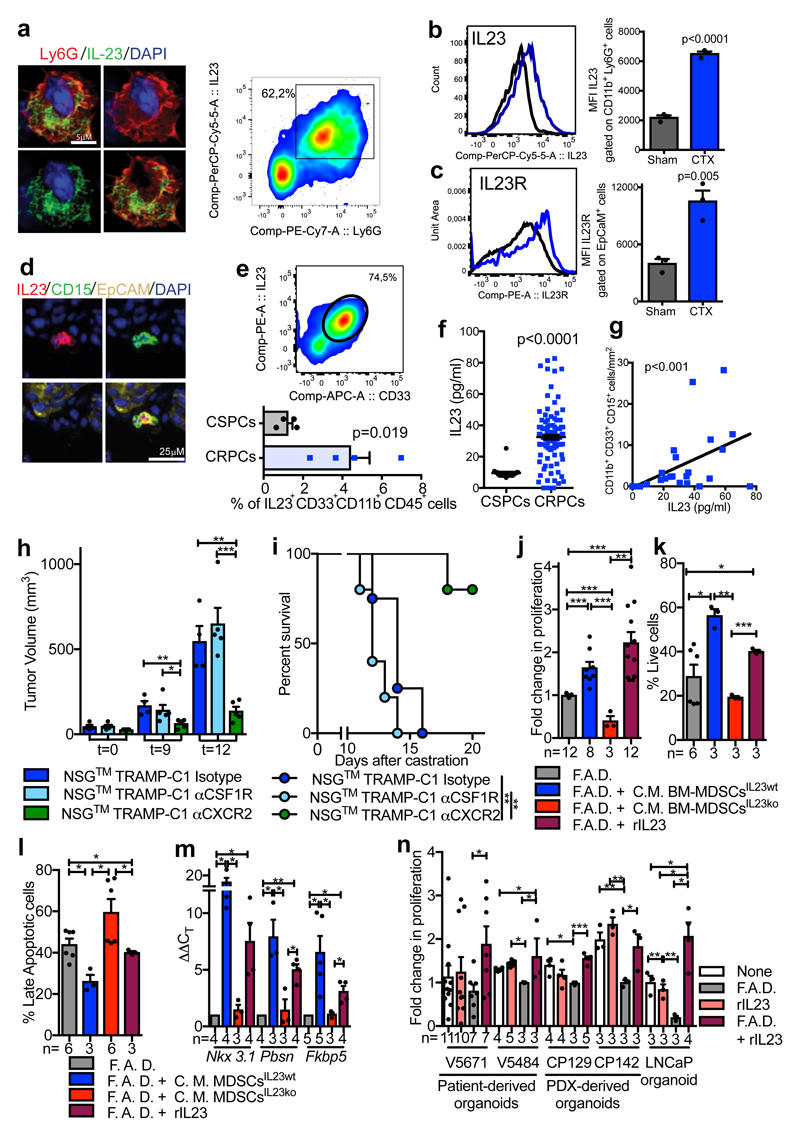
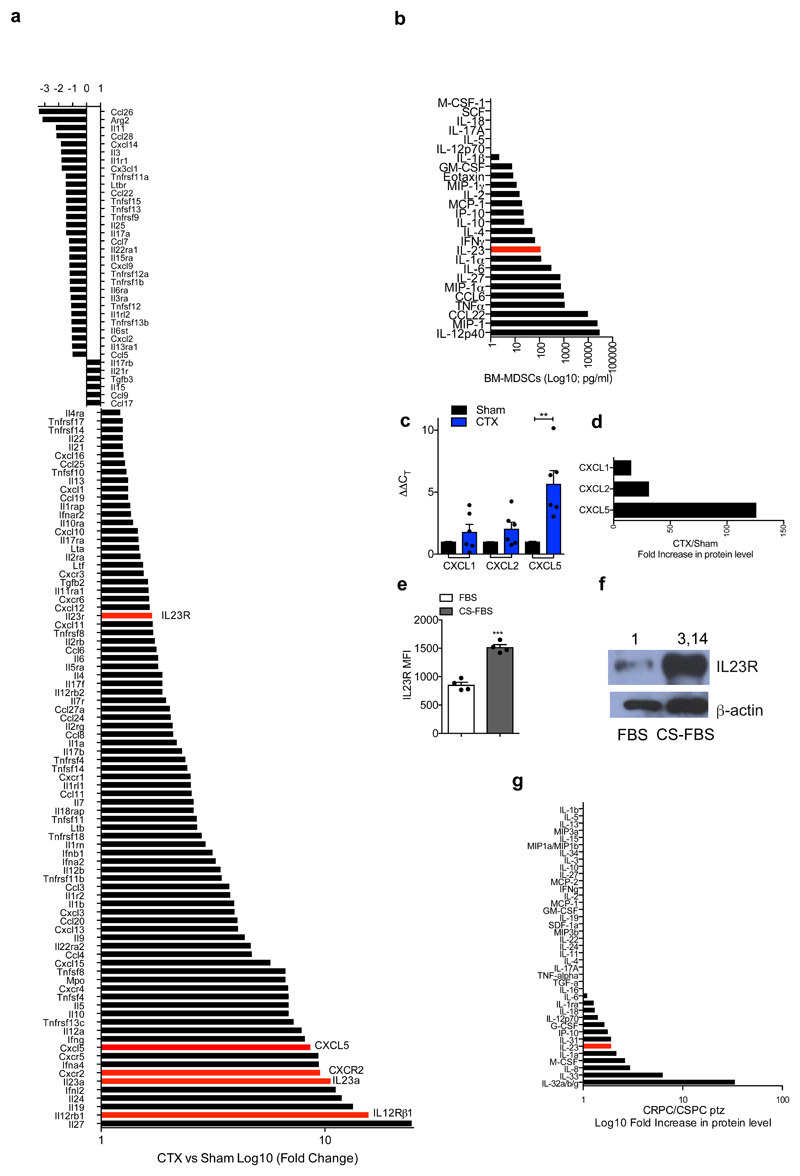
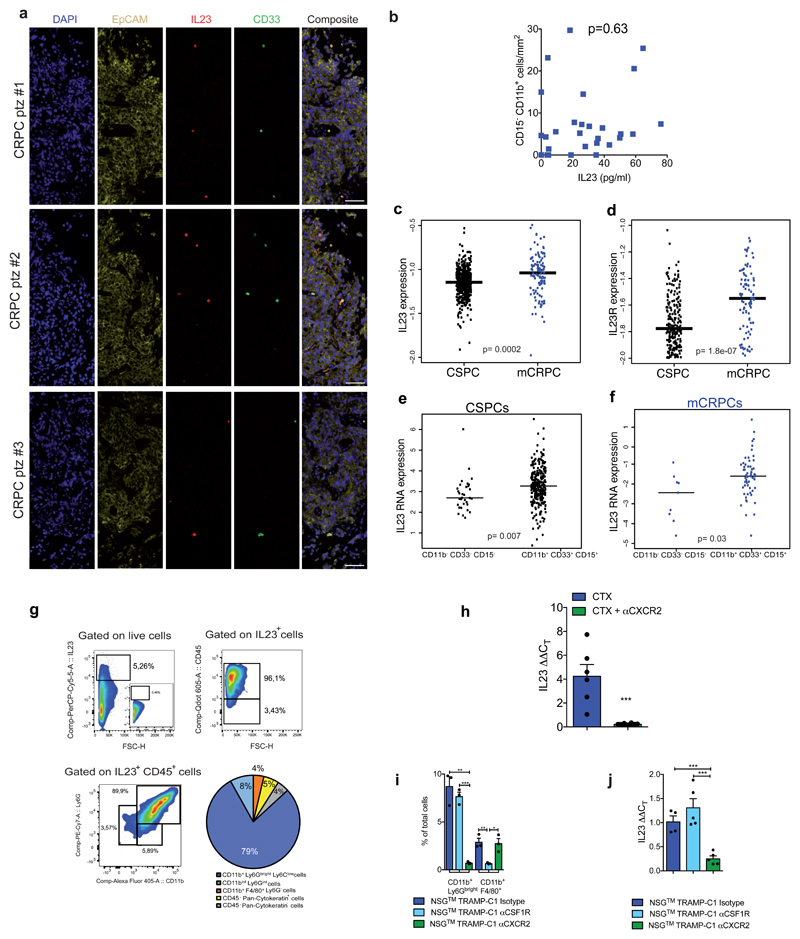
To determine which MDSC-secreted factors drive castration resistance, we performed a NanoString nCounter gene expression assay in Ptenpc-/- tumors from sham and castrated mice. IL23 and one of the subunits of IL23 receptor (IL12Rβ1) were the most up-regulated genes in tumors from castrate mice when compared to controls (Extended Data 5a). Of note, factors previously linked to the regulation of AR pathway such as IL6 were not up-regulated in Ptenpc-/- tumors after castration (Extended Data 5a) 13. In line with this evidence, cytokine profile analysis in C. M. from murine MDSCs showed that IL23 was the most over-expressed factor produced by these cells (Extended Data 5b). Immunofluorescence and flow cytometry analyses further confirmed that tumor-infiltrating MDSCs expressed IL23 in vivo, with PMN-MDSCs infiltrating castration-resistant tumors expressing even higher levels of IL23 when compared to treatment-naïve tumors (Figure 2a-b). Moreover, as found in mice, PMN-MDSCs infiltrating tumor biopsies from CRPC patients expressed IL23 (Figure 2d-e; Extended Data 6a) with the frequency of IL23-producing tumor-infiltrating PMN-MDSCs being higher in CRPC biopsies than in CSPC biopsies (Figure 2e). Notably, expression of CXCL5, a chemokine that stimulates chemotaxis of myeloid cells through CXCR224, was strongly up-regulated in castrated tumors compared to controls (Extended Data 5a, c-d). This, together with the previous finding that CXCR2 inhibition efficiently decreases the recruitment of MDSCs in castrated mice, implicates this factor as a major regulator of MDSC recruitment in CRPC.
Figure 2. Tumor-infiltrating MDSCs produce IL23 that drives insensitivity to androgen deprivation.
a-c Prostate tumors from Ptenpc-/- mice Sham or CTX analyzed at t=12 a, Representative images of Ly6G+ IL23+ cells (nuclei, blue) and representative dot plot of Ly6G+ IL23+ cells gated on CD45+ cells in CTX mice. b-c, Representative histograms (left) and quantification (right; mean ± SE) showing b, Mean fluorescence intensity (MFI) of IL-23 within CD45+ CD11b+ Ly6G+ cells and c, MFI of IL-23R gated on CD45- EpCAM+ cells. b, c, n=3 biological independent animals per group. d, Representative images of IL23, CD15, EpCAM positive cells within the tumor of CRPC patients. a, d, Data were validated in at least three experiments. e, CD33+ IL23+ CD11b+ CD45+ cells within the tumor of CSPCs vs CRPCs (n=4 biological independent patients/cohort). f, IL23 levels in the plasma of CSPCs (n=20) and CRPCs (n=120) patients. g, Correlation analyses of the numbers of tumor-infiltrating PMN-MDSCs and plasmatic IL23 levels in CRPC patients (n=28). Statistical analyses (negative binomial regression model) p <0.001. h-i, Tumor progression (t=days post-castration) of NSG™ TRAMP-C1 allografts treated with Isotype control (Untreated; n=4), anti-CSF1R antibody (αCSF1R; n=5) or αCXCR2 (n=5). h, Average tumor volume. i, Survival curves reported as Kaplan-Meier plot. Statistical analyses (Log rank (Mantel-Cox) test): **P <0.01. j, TRAMP-C1 cell proliferation. k, Percentage of AnnexinV and 7AAD-negative TRAMP-C1 cells. l, Percentage of AnnexinV and 7AAD-positive TRAMP-C1 cells. m, qRT-PCR analyses of the indicated genes in TRAMP-C1 cells. n, Cell proliferation of 3D cultures of reported organoids. rIL23 conditions were normalized to the None or F.A.D. condition respectively. e,f,h,j-n, Data are reported as mean ± SE. Specific n values of biological independent samples are shown in j-n. b, c, e, f, h, j-l, n, Statistical analyses (Unpaired two-sided t-test) and m, Statistical analyses (Paired two-sided t-test), *P <0.05; **P <0.01; ***P <0.001.
We next assessed the levels of IL23 receptor (IL23R) in sham and castrated Ptenpc-/- tumors, and found that IL23R levels increased in tumor cells following castration (Figure 2c). This was further validated in TRAMP-C1 cells cultured in androgen deprived conditions in vitro (Extended Data 5e-f). Furthermore, plasma IL23 levels in CRPC patients were substantially higher than in CSPC patients (Figure 2f; Extended Data 5g) and statistically correlated with tumor-infiltrating PMN-MDSC counts (EpCAM- CD11b+ CD33+ CD15+; Figure 2g) but not with other myeloid cell population counts (CD11b+ CD15-; Extended Data 6b). Overall, these data demonstrated that IL23 is elevated in both mouse and human CRPCs, with IL23 levels correlating with the number of tumor-infiltrating PMN-MDSCs. Overall, tumor biopsies from CRPC patients also had much higher IL23 and IL23R mRNA levels than treatment-naïve patients (Extended Data 6c-d) with IL23 mRNA levels being associated with MDSC associated mRNA in CRPC biopsies (Extended Data 6e-f).
In line with this evidence, the primary source of IL23 in castrated Ptenpc-/- tumors was ascribed to be PMN-MDSCs (Extended Data 6g). Note that TAMs and epithelial tumor cells were only a small fraction of the total IL23 positive cells in these tumors (Extended Data 6g). In keeping with this, IL23 levels significantly decreased in castrated Ptenpc-/- tumors depleted of MDSCs (Extended Data 6h), while depletion of TAMs by an αCSF1R antibody25 in mice harbouring TRAMP-C1 did not delay the emergence of CRPC. Conversely, the reduction of PMN-MDSCs by an αCXCR2 antagonist robustly delayed the emergence of CRPC (Figure 2h-i; Extended Data 6i). Overall, therefore, IL23 levels significantly decreased in tumors depleted of MDSCs but not of TAMs (Extended Data 6j).
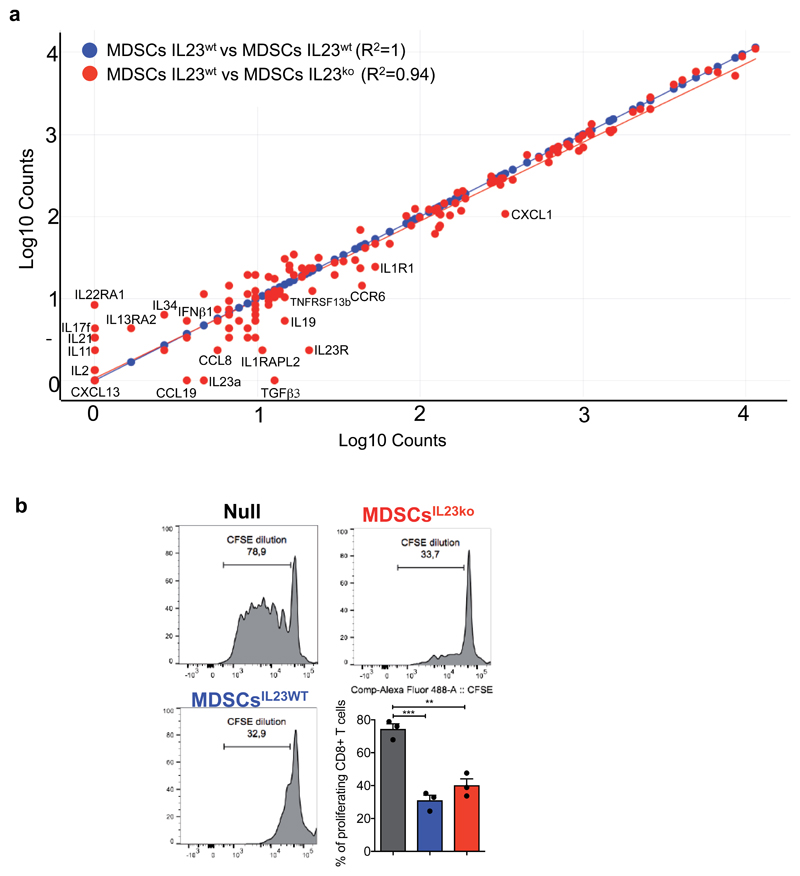
To functionally validate these findings, we cultured prostate tumor cells in the presence of C.M. of BM-MDSCs from IL23 wild type (C.M. BM-MDSCsIL23wt) or IL23 knockout mice (C.M. BM-MDSCsIL23ko). The C.M. of BM-MDSCsIL23wt, as well as treatment with recombinant IL23, promoted the proliferation, survival and increased transcription of androgen receptor target genes in prostate cancer cells kept in F. A. D.; conversely, the C.M. of BM-MDSCsIL23ko was ineffective in impacting these (Figure 2j-m). Of note, deleting IL23 in BM-MDSCs did not impact the levels of other secreted factors in these cells (Extended Data 7a). Indeed, BM-MDSCsIL23wt and BM-MDSCsIL23ko cells had equal immunosuppressive capability (Extended Data 7b). These results were further validated in a subset of androgen-dependent organoids derived from patient-derived xenografts (PDX) and LNCaP cells respectively kept in F.A.D and treated in the presence or absence of human recombinant IL23 (Figure 2n). Taken together, these findings identify IL23 as an MDSC-secreted factor that can sustain prostate cancer cell proliferation and survival as well as the transcription of AR driven target genes in prostate cancer cells cultured in F.A.D.
MDSCs activate the IL23/RORγ pathway
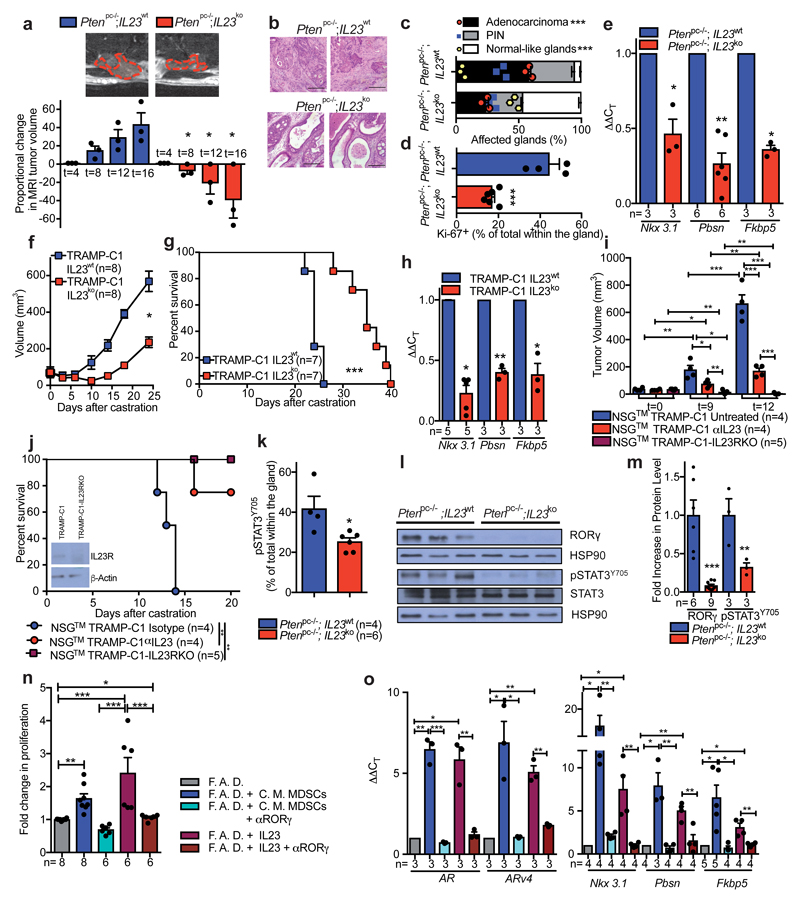
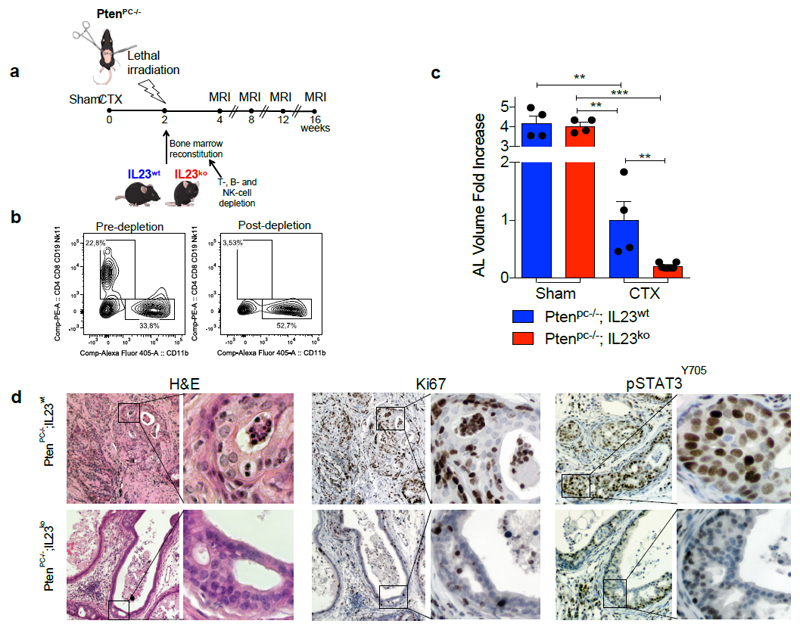
To determine whether MDSC-derived IL23 promotes the emergence of castration resistance in vivo, we next reconstituted lethally irradiated sham-operated or castrated-Ptenpc-/- mice with BM precursors from IL23wt or IL23ko mice (yielding Ptenpc-/-; IL23wt mice and Ptenpc-/-; IL23ko mice) (Extended Data 8a). Mice were reconstituted with BM deprived of T, B and NK cells (Extended Data 8b). The absence of IL23 in the myeloid compartment led to a dramatic reduction in prostate cancer tumor volume specifically in castrated Ptenpc-/- mice (Figure 3a; Extended Data 8c), with normalization of glands impacted by prostate cancer and a major reduction in Ki-67 positive cells (Figure 3b-d; Extended Data 8d). Critically, AR target genes were robustly down-regulated in Ptenpc-/-;IL23ko when compared to Ptenpc-/-;IL23wt prostate tumors (Figure 3e). These data were then also validated in TRAMP-C1 allograft mice reconstituted with IL23wt and IL23ko BM precursors (yielding TRAMP-C1 IL23wt and TRAMP-C1 IL23ko mice) (Extended Data 9a). In TRAMP-C1 IL23ko mice, the absence of IL23 in the myeloid compartment significantly delayed the emergence of CRPC as demonstrated by decreased tumor size and tumor cell proliferation as well as reduced AR driven target gene expression with a significant survival advantage demonstrated for the TRAMP-C1 IL23ko mice (Figure 3f-h; Extended Data 9b-c). Critically, the IL23ko BM reconstitution did not alter the recruitment of MDSCs into the tumors and spleens of reconstituted mice (Extended Data 9 d-e). Of note, treatment with αIL23 antibodies or genetic inactivation of IL23R in NSG™ TRAMP-C1 allografts confirmed these results (Figure 3i-j), demonstrating that IL23 directly promotes castration resistance by binding the IL23R present on tumor cells.
Figure 3. IL23/IL23R axis regulates castration resistance in vivo and in vitro.
a, MRIs of representative Ptenpc-/-;IL23wt and Ptenpc-/-;IL23ko mice at the endpoint (upper panels). Waterfall plot depicting proportional change in tumor response for Ptenpc-/-;IL23wt (n=3) and Ptenpc-/-;IL23ko (n=3) mice. Mean ± SE. Statistical analyses (Unpaired two-sided t-test): *P <0.05, One-way ANOVA: P=0.0008. b, Representative H&E at the endpoint. Scale Bar 100 μM. Data are representative of at least three biological independent animals. c, Quantification of adenocarcinoma, prostatic intraepithelial neoplasia (PIN) or normal-like glands in Ptenpc-/-;IL23wt (n=3) and Ptenpc-/-;IL23ko (n=3) mice. d, Quantification of Ki-67+ cells in Ptenpc-/-;IL23wt (n=4) and Ptenpc-/-;IL23ko (n=6). e, qRT-PCR analyses in the prostate tumors. f, g, Tumor volume and survival curves of TRAMP-C1 IL23wt and TRAMP-C1 IL23ko bearing mice. f, Statistical analyses (Unpaired two-sided t-test followed by Wilcoxon post-test): *P <0.05. h, qRT-PCR analyses in the tumors of TRAMP-C1 IL23wt or IL23ko bearing mice. i-j, NSG™ males challenged with TRAMP-C1 or TRAMP-C1-IL23RKO cells, after CTX were treated with Isotype control (Untreated) or anti-IL23 antibody (αIL23) and monitored for i, tumor progression and j, survival. WB for IL23R as insert (performed at least in double). g, j, Statistical analyses (Log rank (Mantel-Cox) test): **P <0.01; ***P <0.001. k, Quantification of pSTAT3Y705+ cells in Ptenpc-/-;IL23wt (n=4) and Ptenpc-/-;IL23ko mice (n=6). l-m WB and quantification for RORγ, pSTAT3Y705 and total STAT3 levels in prostate tumors. n, TRAMP-C1 cell proliferation o, qRT-PCR analyses in TRAMP-C1 cells. c, d, k, Data are reported as mean ± SE of one tumor per mouse (mean of three sections per mouse, ≥ 3 fields per section). e-i,j,k,m-o, Data are reported as mean ± SE. Specific n values of biological independent animals (i,j,k) and biological independent samples (m-o) are reported in figure. c, d, i, k, m, n, Statistical analyses (Unpaired two-sided t-test), e, h, o, Statistical analyses (Paired two-sided t-test), *P <0.05; **P <0.01; ***P <0.001.
IL-23 has been reported to regulate the activation of STAT3/RORγ expression in naive CD4 T cells26–28; both STAT3 and RORγ can impact AR signaling in prostate cancer29,30. We therefore evaluated whether IL23 secreted by MDSCs impacted the STAT3/RORγ axis in prostate cancer in a non-cell autonomous manner. Inactivation of IL23 in the myeloid compartment of castrated Ptenpc-/- mice significantly decreased overall tumor levels of pSTAT3 and RORγ in vivo (Figure 3k-m; Extended Data 8d); this was also the case in the TRAMP-C1 model (Extended Data 9f-h). RORγ inhibition in vitro also abrogated the proliferative advantage conferred by MDSC C.M. or IL23 treatment in TRAMP-C1 cells kept in F.A.D., and inhibited the transcription of the full-length form of the AR and its constitutive active splice variant (ARv4) as well as downstream AR target genes (Figure 3n-o). Altogether, these data demonstrate that IL23 released by MDSCs into the tumor microenvironment acts directly on the pSTAT3/RORγ axis to drive the transcription of AR and its splice variant and downstream target genes, thus favoring the proliferation and survival of the prostate cancer cells in androgen ablation conditions.
IL23 targeting improves the efficacy of ADT
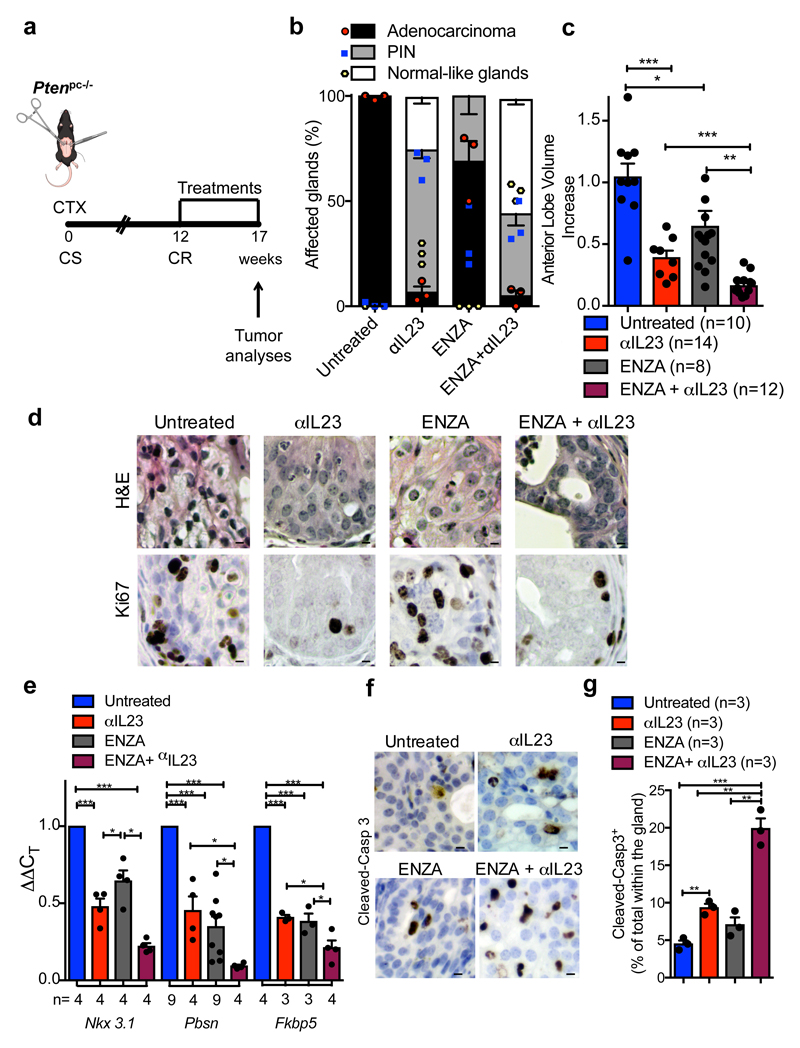
To evaluate the therapeutic relevance of our findings, we next assessed whether IL23 inhibition by antibody blockade could reverse castration resistance in Ptenpc-/- mice. Since anti-IL23 antibodies are currently being evaluated in clinical trials for the treatment of autoimmune diseases31 including psoriasis and are clinically well tolerated32, we treated mice carrying Ptenpc-/- tumors that had become resistant to surgical castration with an anti-IL23 antibody (αIL23) in combination with the AR antagonist enzalutamide (ENZA; Figure 4a). ENZA is a standard of care for the treatment of patients with CRPC after first line ADT2,33. Our preclinical study showed that αIL23 increased the efficacy of ENZA (Figure 4b-c); in mice treated with αIL23 and ENZA we observed a normalization of prostate glands impacted by cancer (Figure 4b; Extended Data 10a), with decreased tumor volume (Figure 4c) and proliferation (Extended Data 10a-b), whereas in mice treated with ENZA alone the treatment was ineffective. Combined αIL23 and ENZA were associated with a robust inhibition of the AR activity and induction of tumor apoptosis (Figure 4e-g). Taken together, these data demonstrate that anti-IL23 treatment can reverse castration resistance in prostate cancer and enhance the efficacy of ENZA.
Figure 4. IL23 inhibition improves enzalutamide efficacy in vivo.
a, CR Ptenpc-/- mice (12 weeks after castration) were randomly enrolled in the preclinical trial. Treatments: Isotype control (Untreated), anti-IL23 antibody (αIL23; 100ng/per mouse i.p. weekly), Enzalutamide (ENZA, 30 mg/kg/day administered daily by oral gavage on a Monday to Friday schedule) and Enzalutamide in combination with anti-IL23 antibody (ENZA+αIL23). b, Histological score. n=3 biological independent animals. Statistical analyses (Two-way ANOVA): p<0.001. c, Fold increase of the prostate anterior lobe volume (fold change compared with untreated group). d, Representative H&E and Ki-67 staining in the tumors at completion of the study. Scale Bar 50 μM. e, qRT-PCR analyses of the indicated genes in the prostate tumors of CTX-Ptenpc-/- mice at completion of the preclinical trial. Statistical analyses (two-sided Paired t test): *P <0.05; ***P <0.001. f, Representative cleaved-Caspase3 staining in the tumors after one week of treatments. Scale Bar 50 μM. g, Quantification of cleaved-Casp 3 (percentage of total within the glands). d, f, Data are representative of at least in three biological independent animals. b, g, Data are reported as mean ± SEM of one tumor per mouse (mean of three sections per mouse, ≥ 3 fields per section). b,c,e,g Data are reported as mean ± SEM. Specific n values of biological independent animals are shown in c, e, g. c, g, Statistical analyses (Unpaired two-sided t-test): ns, not significant; *P <0.05; **P <0.01; ***P <0.001.
Discussion
Our study has identified IL23 production by MDSCs as a driver of CRPC and adds novel mechanistic insights on how prostate cancers can become insensitive to androgen deprivation and AR blockade. We also report on a novel role for MDSCs in cancer, describing an unexpected function for this immune subset. Previous data demonstrated that MDSCs can support tumorigenesis in many cancers through different mechanisms15,17,18 with preclinical studies indicating that the inactivation of MDSCs increased immune-checkpoint blockade efficacy in CRPC models16. IL23 has also been previously implicated in cancer progression in a different tumor-context as a regulator of the pro-tumor immune response34–36. However, the discovery described herein that IL23 produced by MDSCs regulates castration resistance in prostate cancer by sustaining AR signaling was previously unknown, and adds novel mechanistic insights on how these immune cells support tumorigenesis. This work also proves that inhibition of IL23 can reverse ADT resistance in men suffering from advanced prostate cancer (Extended Data 10c).
In conclusion, we have described a novel immunotherapeutic strategy for treating advanced prostate cancer that unlike most others is not focused on re-activating the function of cytotoxic T lymphocytes against tumor cells. Immunotherapeutic strategies reactivating cytotoxic T-cells by immune checkpoint blockade have been, to date, only active against a small subset of prostate cancers characterized by DNA repair defects and higher neo-antigen loads with increased T lymphocyte infiltration37,38. Our results demonstrate, however, that MDSCs are a major player in prostate cancer endocrine resistance and that immunotherapies targeting the blockade of either MDSC recruitment into tumor, or the direct inhibition of IL23 can be effective therapeutic strategies for patients suffering from these lethal and common diseases. Since anti-IL23 antibodies have been well-tolerated in clinical trials involving patients with autoimmune diseases31, these deserve to be clinically evaluated in men suffering from lethal prostate cancer. We envision that this novel immunotherapeutic strategy targeting paracrine IL23 in combination with established endocrine anticancer treatments is highly likely to improve treatment outcome for this commonest of male cancers.
Methods
Animals
All mice were maintained under specific pathogen-free conditions in the IRB facility and experiments were performed according to national guidelines and regulations. All the animal experiments were approved by the local ethics committee (TI13/2015 and TI04/2017). Male C57BL/6, FVB, NSG™, NOD SCID mice 6–8 weeks of age were purchased from Jackson Laboratories (Envigo) and acclimated for at least a week before use. Male C57BL/6 IL-23p19KO (IL23ko) mice28 were kindly provided by Prof. Federica Sallusto (IRB, Bellinzona) and used 8 weeks old. Male Ptenpc-/- mice were generated and genotyped as previously described17. Female PtenloxP/loxP mice were crossed with male PB-Cre4 transgenic mice and genotyped for Cre using following primers: primer 1 (5'-AAAAGTTCCCCTGCTGATGATTTGT-3') and primer 2 (5'-TGTTTTTGACCAATTAAAGTAGGCTGTG-3') for PTENloxP/loxP; primer1 (5’ TGATGGACATGTTCAGGGATC 3’) and primer2 (5’CAGCCACCAGCTTGCATGA 3’) for Probasin-CRE. Surgical castration was performed under anesthesia with isoflurane. Male Ptenpc-/- mice were 9/10 weeks old at the time of castration. Mice were monitored postoperatively for recovery from anesthesia and checked daily for 4 days postoperatively. Surgical skin clips were removed on postoperative day 5. Mice undergoing treatment were administered control vehicle or therapeutic doses of the appropriate agents. Any mouse suffering distress or greater than 15% weight loss during treatment was euthanized by CO2 asphyxiation. At the completion of study, mice were euthanized by CO2 asphyxiation and tissue was collected for histology, mRNA analysis, protein analysis and single cell suspensions for flow cytometry. For allograft experiments 2,5x10⁶ TRAMP-C1 cells, 2,5x10⁶ TRAMP-C1 IL23RKO or 2x10⁶ MyC-CaP cells were injected subcutaneously into the flank of male C57BL/6 or FVB mice respectively. For xenograft experiments 3x10⁶ LNCaP cells were suspended with or without 3x10⁶ human BM-MDSCs in total of 100 μl PBS and Matrigel (1:1) and implanted subcutaneously into the flank of NOD SCID mice. When tumors were approximately 100 mm3 mice were randomized to the treatment groups. Tumor growth was monitored daily by measuring the tumor size with caliper. The tumor volume was estimated by calculating R1*R2*R3*4/3π, where R1 and R2 are the longitudinal and lateral radii and R3 is the thickness of tumor protruding from the surface of normal skin. Animals were sacrificed when the tumor reached approximately 600 mm3. The local ethic committee approved the conduct of the in vivo experiments with maximal tumor sizes of 1000 mm3.
Treatments
αCXCR2 (AZD5069; Astrazeneca) was administered with daily intraperitoneal injections at a final concentration of 100mg/kg on a Monday through Friday schedule. Control animals received vehicle. Enzalutamide (APExBio) was administered daily by oral gavage with a dose of 30mg/kg/day on a Monday through Friday schedule. Rat anti-IL23 antibody (100 ng per mouse; G23-8; IgG1, kappa; eBioscience) or rat IgG1 isotype control (eBioscience) was administered weekly via intraperitoneal injection. For in vivo macrophages depletion, mice were treated 400μg anti-CSF1R (clone BE0213, BioXCell; on Mondays, Wednesdays and Fridays).
Cell lines
TRAMP-C1 cells line, MYC-CaP cell line, and LNCaP cell line, VCaP cell line, 22Rv1 cell line, PC3 cell line were received by ATCC and no other authentication method was performed. TRAMP-C1 IL23Rko cell line was generated in the lab with CRISPR-Cas9 methodology and authenticated by WB and FACS for the deletion of IL23R. All the cell lines were regularly tested for mycoplasma (MycoAlert Mycoplasma Detection kit).
Bone marrow reconstitution
Bone marrow was flushed from the femurs of male C57BL/6 or IL23p19ko mice under sterile conditions with RPMI 1640 using a 21-gauge needle. Mononuclear cells were filtered, collected and checked for viability using trypan blue. Before transplantation, bone marrow derived cells were depleted of CD3+ T cells, NK1.1+ NK cells and CD19+ B cells by magnetic bead separation (STEMCELL Technologies). Recipient C57BL/6 or Ptenpc-/- mice were lethally irradiated (900 rad) and transplanted i.v. two hours after with 107 viable bone marrow cells from either C57/BL6 or IL23p19ko mice. For TRAMP-C1 allografts, the animals were challenged s.c. with TRAMP-C1 cells upon BM engraftment. When tumors reached ≈ 100 mm3, mice were surgically castrated and monitored for tumor progression.
Magnetic Resonance Imaging
Magnetic Resonance Imaging (MRI) was performed on castrated-Ptenpc-/- mice 0, 4, 8, 12 and 16 weeks after surgical castration or on CTX IL23wt and CTX IL23ko Ptenpc-/- mice 4, 8, 12 and 16 weeks after surgical castration using a 7T preclinical magnetic resonance scanner (Bruker, BioSpec 70/30 USR, Paravision 5.1) equipped with 450/675 mT/m gradients (slew-rate: 3400–4500T/m/s; rise-time 140 µs) and a mouse body volume coil. Mice were under general anesthesia by 1.5–2% isoflurane vaporized in 100% oxygen (flow: 1 L/min). Breathing and body temperature were monitored (SA Instruments, Inc., Stony Brook, NY, USA) and maintained around 30 breaths-per-minute and 37°C, respectively. MRI studies included a Rapid Acquisition with Relaxation Enhancement (RARE) High-Resolution T2-weighted (T2w) sequence with fat suppression acquired in the axial plane (TR =3800ms, TE =45ms, FOV = 27mm x 18mm, spatial resolution = 0,094 x 0,087 mm/pixel, scan time = 8 min, thickness 0.70 mm, 26 slices) and in the coronal plane (TR =3500 ms, TE =38 ms, FOV = 33mm x 33mm, spatial resolution = 0,129 x 0,129 mm/pixel, scan time = 5 min, thickness 0.60 mm, 20 slices). Images were analyzed using NIH software MIPAV (version 7.4.0). Circumference of the whole prostate was outlined on each RARE T2w axial slice containing identifiable prostate and the number of bounded pixels in each slice was computed and added to yield the prostate volume. Coronal T2w images were used for an accurate identification of the basal and apical limits of the prostate.
Differentiation of BM-MDSCs in vitro
Murine BM-MDSCs were differentiated in vitro as previously described39. Briefly, bone marrow precursors were flushed from the femurs of C57/BL6 or IL23p19ko mice with RPMI 1640 medium. The cell pellet was resuspended (one femur in 10 ml) in RPMI 1640 containing 10% heat-inactivated FBS and the cells were cultured in vitro in the presence of 40 ng/ml GM-CSF and 40 ng/ml IL-6. On day 4, the cells were washed and resuspended with RPMI 1640 containing 10% heat-inactivated Charcoal Stripped-FBS. The day after the cells were stimulated with PMA/ionomycin and after 4 hours the supernatant was collected and stored at −80°C. Analysis of soluble molecules was conducted with Mouse CytokineMAP B version 1.0 by Rules Based Medicine (Austin, TX).
Human BM-MDSCs were differentiated in vitro seeding 106/ml bone marrow precursors in T25 flasks with RPMI 1640 containing 10% heat-inactivated FBS in the presence of 10 ng/ml GM-CSF and 10 ng/ml IL-6 for 7 days40. Complete medium was changed when required. After 7 days, the cells were analyzed by flow cytometry for CD11b, CD33, CD15, HLA-DR expression and when the population CD11b+, CD33+, CD15+, HLA-DRneg was higher than 80% the cells were re-suspended in RPMI 1640 containing 10% heat-inactivated Charcoal Stripped-FBS and after one day stimulated with PMA/ionomycin for 5 hours. The supernatant was then collected and stored at −80°C.
In vitro culture experiments
Prostate cancer cell lines were starved in Charcoal Stripped FBS (CS-FBS) medium for 72h and then cultured with RPMI 1640 containing 10% heat-inactivated FBS (normal medium) or kept in full androgen deprivation medium (F.A.D.; RPMI 1640 containing 10% heat-inactivated Charcoal Stripped-FBS plus Enzalutamide 10μM; F. A. D.). Then, the cells were stimulated with or without condition media obtained from activated BM-derived MDSCs, or recombinant IL23 (100ng/ml; R&D System), with or without αRORγ (5 μM; SR2211; Calbiochem®). Then the cells were analyzed for Crystal Violet assay (after 72h of colture, fold change compared with F. A. D. condition), stained with Annexin V/7AAD (after 72h of colture) or collected for RNA extraction (after 24h of culture; fold change compared with F. A. D. condition).
Analyses of IL23 and IL23R mRNA expression in clinical tumors
HSPC RNA-Seq data for 550 patients was downloaded from the UCSC Cancer Browser (https://genome-cancer.ucsc.edu/proj/site/hgHeatmap/). mCRPC RNA-Seq data for 122 mCRPC patients was generated as part of SU2C effort41. The paired-end transcriptome sequencing reads were aligned to the human reference genome (GRCh37/hg19) using Tophat242 (Tophat 2.1.0). Gene expression, as fragments per kilobase of exon per million fragments mapped (FPKM; normalized measure of gene expression), was calculated using Cufflinks43. MDSC marker (CD11b, CD33, CD14 and CD15) positive and negative was defined by the high quantiles and low quantiles RNA expression of each transcript and IL23/IL23R expression level in each biomarker groups were compared by student t test. In order to compare gene expression level between TCGA and SU2C with minimum experimental bias, we only included genes expressed in both TCGA and SU2C with median expression level (FPKM) > 0. The gene expression levels in each sample were quantile normalized, and IL23 expression levels in HSPC and CRPC were compared using t test.
Human organoids
Organoids were grown in 3D Matrigel® (cat.356231, Corning) under prostate epithelial conditions44. Cell viability was measured using 3D CellTiter-Glo® 3D reagent (cat.G9681, Promega) by quantifying metabolically active cells releasing ATP. Cell line-derived organoids were plated at a density of 2000 cells per well in 96-well optical plates (cat.3610, Corning) embedded in Matrigel® as hanging drops (5μl per well). Cells were treated with recombinant IL23 (cat 300-01A, PeproTech) at 100ng/ml or culture with Enzalutamide (10uM) with or without recombinant IL23. The luminescence measurement was performed after 7 days in culture. Each IL23 condition was normalized for its experimental control.
Immune tumor microenvironment characterization
Tumors were disaggregated and digested in collagenase D and DNAse for 30 minutes at 37°C to obtain single-cell suspension. For intracellular cytokine detection cells where stimulated for 5 hours with PMA/ionomycin plus Golgi Plug. After neutralization of unspecific binding with αCD16/CD32 (clone 93), single-cell suspensions were stained with specific mAb (primary antibodies directly conjugated) to assess the phenotype and diluted 1:200. The antibodies used were: αCD45 (clone 30-F11, Lot. B235438); αLy-6G (clone 1A8, Lot B194432); αLy6C (clone HK1.4, Lot. B243043), αCD11b (clone M1/70, Lot. B233927); αF4/80 (clone BM8, Lot. 4305911), αCD206 (clone C068C2, Lot. B230155), αCD11c (clone N418, Lot. B226270), αB220 (clone RA3-6B2, Lot. B210434), αCD3 (clone 145-2C11, Lot. B241616), αCD8 (clone 53-6.7, Lot. B193838), αCD4 (clone GK1.5, Lot. B240053), αNK1.1 (clone PK136, Lot. 4291566), αCD90.2 (clone 30-H12, Lot. B190542), αPDL1 (clone 10F.9G2, Lot. B191993), αEpCAM (clone G8.8, Lot. B230070), αPan-Cytokeratin (clone C11, Lot. 4528S), αIL17 (clone TC11-18H10.1, Lot. B201753), αIL23p19 (clone FC23CPG, Lot. 4321359), Isotype (Rat/IgG1,kappa, eBRG1) αIL23R (clone 12B2B64, Lot. 4321359), For flow gating we used isotype controls of florescence minus one controls. All the antibodies were purchased from eBioscience or Biolegend. Samples were acquired on a BD Fortessa flow cytometer (BD Biosciences). Data were analyzed using FlowJo software (TreeStar, Ashland, OR).
Murine Immunohistochemistry and Immunofluorescence
For immunohistochemistry (IHC), tissues were fixed in 10% formalin (ThermoScientific, 5701) and embedded in paraffin in accordance with standard procedures. Preceding immunohistochemical staining, tumor sections (4µm) were exposed to two washes with OTTIX plus solution (Diapath, X0076) and subsequent hydration with OTTIX shaper solution (Diapath, X0096) followed by deionized water. Antigen unmasking was performed by heating sections in the respective pH solutions based on the antibodies used at 98°C for 20 minutes. Subsequently the sections were blocked for peroxidases and nonspecific binding of antibodies using 3% H2O2 (VWR chemicals, 23615.248) and Protein- Block solution (DAKO Agilent technologies, X0909) respectively for 10 minutes each split by 0.5% PBST washing. H&E staining was performed according to standard procedures. Sections were stained for anti-Ki67 (Clone SP6; Lab Vision Corporation), anti-pSTAT3 (TYR705; clone D3A7; Cell Signaling). Images were obtained using objectives of 5x, 10x, 40x magnification and Pixel image of 1.12µm and 0.28µm respectively. All the quantifications have been done using the public online software ImmunoRatio (153.1.200.58:8080/iimunoratio/). For the immunofluorescence (IF) staining, tissue paraffin embedded sections were stained for 4′,6-Diamidine-2′-phenylindole dihydrochloride(DAPI) (#70238421, Roche), anti-IL23 (ab45420; Abcam), anti-Ly6G (RB6-8C5; GeneTex). Confocal images were obtained with the Leica TCS SP5 confocal microscope using × 10/1.25 oil.
In vitro T cell suppression assay
In vitro suppression assays were carried out in RPMI/10% FCS in 96-well U-bottom plates (Corning, NY). Naive splenocytes were labeled with 5μM CFSE (Molecular Probes) and activated in vitro with anti-CD3 and anti-CD28 beads (Invitrogen) according to the manufacturer's instructions. Conditioned media of BM-MDSCs was added to the culture. After 3 days, the proliferation of CFSE-labelled CD8+ T cells was analyzed by BD Fortessa.
CRISPR-Cas9 transfection
TRAMP-C1 cells were grown in 75cm2 flask to a 50-60% confluence in DMEM medium supplemented with 10% heat-inactivated FBS, 100 U/ml penicillin, 0.1 mg/ml streptomycin and 2 mM L-glutamine. The transfection of the IL23R CRISPR/Cas9 KO plasmid (Santa Cruz Biotechnology) was performed using jetPRIME® transfection reagent according to the manufacturer protocol at the 1:2 DNA/jetPRIME® ratio. 24h after transfection, GFP transduced cells were sorted to 99% purity and single-cell plated in 96-well plates. At day 7 after sorting the grown cell clones were moved into 24well plates for further expansion. The knock-down of IL23R gene in each cell colony was confirmed by Western blot.
NanoString
The nCounter analysis system (NanoString Technologies, Seattle, WA) was used to screen for the expression of signature genes associated with cancer-inflammation pathway. Two specific probes (capture and reporter) for each gene of interest were employed. Briefly, 5ul of RNA (the concentration is higher than 25 ng/ul) was hybridized with customized Reporter CodeSet and Capture ProbeSet as Mouse PanCancer Immune Profiling Panel including 700 selected genes (NanoString Technologies) according to the manufacturer’s instructions for direct labeling of mRNAs of interest with molecular barcodes without the use of reverse transcription or amplification. Total RNA was quantified by NanoDrop ND-1000 Spectro-photometer (NanoDrop Technologies, Wilming-ton, DE) and RNA quality was assessed using Agilent 2100 Bioanalyzer (Agilent Technologies, Santa Clara, CA). The hybridized samples were then recovered in the NanoString Prep Station and the mRNA molecules were counted with the NanoString nCounter. For expression analysis, each sample profile was normalized to geometric mean of 20 housekeeping genes included in the panel.
Immune tumor microenvironment characterization in prostate cancer patients
Tumors were disaggregated and digested in collagenase I and DNAse for 20 minutes at 37°C to obtain single-cell suspension. For intracellular cytokine detection cells where stimulated for 5 hours with PMA/ionomycin plus Golgi Plug. Single-cell suspensions were stained with specific mAb diluted 1:200 (primary antibodies directly conjugated) to assess the phenotype. The antibodies used were: αCD45RA (clone MEM-56, 1:50); αCD33 (clone WM53); αCD11b (clone ICRF44); αCD15 (clone W6D3), αHLA-DR (clone L243), αIL23p19 (clone 23DCDP). For flow gating we used isotype controls of florescence minus one controls. All the antibodies were purchased from eBioscience or Biolegend. Samples were acquired on a BD Fortessa flow cytometer (BD Biosciences). Data were analyzed using FlowJo software (TreeStar, Ashland, OR).
Protein profile
Plasma pools of CSPCs or CRPCs patients were processed as indicated in Human XL Cytokine Array Kit (R&D Systems). Pools of tissue lysates of sham and castrated Ptenpc-/- tumors were processed as indicated in Mouse XL Cytokine Array Kit (R&D Systems). Developed films were scanned, obtained images were analyzed using ImageJ 1.43u and background signals were subtracted from the experimental values.
Multiplex IF in formalin fixed paraffin embedded tissue section
PMN-MDSC panel (CD15, CD11b, CD33 and EpCAM)
Multiplex immunofluorescence for CD15 (#M3631, Dako, clone Carb-3), CD33 (#ab11032, Abcam, clone 6C5/2), CD11b (#ab52477, Abcam, clone EP1345Y) and EpCAM Alexa Fluor® 647 conjugate (#5447S, CellSignaling, clone VU1D9) was performed using 4µm sections of FFPE prostate tumor samples by sequential staining after antigen retrieval in CC1 (pH 8.5) (#950-224, Ventana) in water bath at 98°C for 36 minutes. First, mouse monoclonal (IgG1) antibody anti-CD33 (1:100 dilution), mouse monoclonal (IgM) anti-CD15 (1:200 dilution) and rabbit monoclonal (IgG) antibody anti-CD11b (1:100 dilution) were incubated for one hour after blocking with 10% goat serum for 30 minutes. Primary antibodies were detected with goat anti-mouse IgG1 Alexa Fluor® 555-conjugated (#A21127, Life Technologies), goat anti-mouse IgM Alexa Fluor® 488-conjugated (#A21042, Life Technologies) and goat anti-rabbit IgG (H+L) Alexa Fluor® 700-conjugated (#A21038, Life Technologies) antibodies for 30 minutes. Next, tissue sections were treated with 5% mouse/rabbit normal serum for 30 minutes, followed by incubation with mouse monoclonal (IgG1) anti EpCAM antibody conjugated to Alexa Fluor® 647 (dilution, 1:200) for one hour. The samples were washed three times for 5 minutes with TBS-Tween 0.05% between incubations. Nuclei were counterstained with 4′,6-Diamidine-2′-phenylindole dihydrochloride (DAPI) (#70238421, Roche) and tissue sections were mounted with ProLong Gold antifade reagent (#P36930, Molecular Probes).
CD15, IL-23 and EpCAM
IF was performed on 4µm FFPE tissue sections using an automated staining platform (Bond-RX, Leica Microsystems). Briefly, antigen retrieval was achieved using ER1 (pH 6.0) (#AR9961, Leica Biosystems) for 30 minutes. Sections were blocked in 10% normal goat serum for 30 min at room temperature. Primary antibodies mouse monoclonal (IgM) anti-CD15 (#M3631, Dako, clone Carb-3, dilution 1:200), rabbit monoclonal (IgG) antibody anti-IL23 (#ab190356, Abcam, clone EPR5585(N), dilution 1:100) and mouse monoclonal (IgG1) anti EpCAM antibody (#2929S, CellSignaling, clone VU1D9, dilution 1:500) were incubated for one hour. Primary antibodies were detected with goat anti-rabbit (H+L) Alexa Fluor® 555-conjugated (#A21429, Life Technologies), goat anti-mouse IgM Alexa Fluor® 488-conjugated (#A21042, Life Technologies) and goat anti-mouse IgG1 Alexa Fluor® 647-conjugated (#A21240, Life Technologies) for 30 minutes. Nuclei were counterstained with 4′,6-Diamidine-2′-phenylindole dihydrochloride (DAPI) (#70238421, Roche) and tissue sections were mounted with ProLong Gold antifade reagent (#P36930, Molecular Probes).
Microscopy and image acquisition
After staining, slides were scanned using the multi-spectral camera provided by Vectra® (Perkin Elmer) system. The number of images collected per case was dependent on tumor size (Min.=1, Max.=18, Average=12). Quantification of PMN-MDSC like cells (CD15+CD33+CD11b+) was performed using inForm v2.1.1 software (PerkinElmer) and the density of cells of interest are presented as number of cells per mm2. Tissue segmentation algorithm based on EpCAM positivity was used to separate tumor from adjacent stroma. The algorithm was trained to perform cell segmentation using counterstain based segmentation achieved with nuclear DAPI staining. Phenotype determination was based on positivity for CD15, CD33 and CD11b. Cells in tumor areas selected by the algorithm were then separated into bins as follows: CD15+CD33+CD11b+ were called PMN-MDSC like cells and CD15- CD11b+ cells were called CD15- CD11b+ cells. All tissue segmentation, cell segmentation and phenotype determination maps were reviewed by a pathologist.
Antibody specificity validation for Multiplex IF
IHC was performed on 4µm formalin-fixed paraffin embedded (FFPE) tissue sections using an automated staining platform (Bond-RX, Leica Microsystems). Optimal antibody concentrations were determined with primary antibodies against CD15 (#M3631, Dako, clone Carb-3, dilution 1:200), CD33 (#ab11032, Abcam, clone 6C5/2, dilution 1:100), CD11b (#ab52477, Abcam, clone EP1345Y, dilution 1:100) IL23 (#ab190356, Abcam, clone EPR5585 (N), dilution 1:100) and EpCAM (#2929S, CellSignaling, clone VU1D9, dilution 1:500). Antibody labelling was detected with the Bond Polymer Refine Detection Kit (#DS9800, Leica Microsystems). 3,3-diaminobenzidine tetrahydroxychloride (DAB) was used as chromogen and the slides were counterstained with hematoxylin. Human control included colorectal specimens. In each staining batch, positive and negative controls were incubated with and without primary antibody.
RNA expression/quantitative real-time PCR
RNA isolation (TRIzol, Qiagen) and retro-transcription with SuperScriptIII (Invitrogen, 11752-250) were performed according to the manufacturer’s instructions. Quantitative PCR (qPCR) reactions (Bio-Rad) were performed using KAPA SYBR FAST qPCR green (KK4605; Applied Biosystems) and the specific primers reported below. Primer sequences were obtained from PrimerBank (http://pga.mgh.harvard.edu/primerbank/index.html) or BIORAD. Each expression value was normalized by HPRT or GADPH level as reference.
The primer sequences used were as follows:
CXCL1 forward, 5'-CTGGGATTCACCTCAAGAACATC-3; reverse, 5' – CAGGGTCAAGGCAAGCCTC-3’. CXCL2 forward, 5'-GCGTCACACTCAAGCTCTG-3’; reverse, 5'-CCAACCACCAGGCTACAGG-3’; CXCL3 forward, 5'-ATCCCCCATGGTTCAGAAA-3’; reversal, 5’-ACCCTGCAGGAAGTGTCAAT-3’; CXCL5 reversal, 5’-GCGGCTATGACTGAGGAAGG-3’; forward, 5'-GTTCCATCTCGCCATTCATGC-3’; GAPDH reversal, 5'-TGTAGACCATGTAGTTGAG-3’; forward, 5'-AGGTCGGTGTGAACGGATT-3’. IL23p19 forward, 5’-CCAGCAGCTCTCTCGGAATC-3’; reverse, 5’-TCATATGTCCCGCTGGTGC-3’. BIORAD primers used were: HPRTPrimePCR™ PreAmp for SYBR® Green Assay: Hprt, Mouse qMmuCID0005679; AR PrimePCR™ PreAmp for SYBR® Green Assay: Ar, Mouse BIORAD qMmuCID0005164; NKX3.1PrimePCR™ PreAmp for SYBR® Green Assay: Nkx3-1, Mouse qMmuCED0046482; PBSNPrimePCR™ PreAmp for SYBR® Green Assay: Pbsn, Mouse qMmuCID0017831; FKBP5PrimePCR™ PreAmp for SYBR® Green Assay: Fkbp5, Mouse qMmuCID0023283.
Western blot analyses and protein detection
Tissue and cell lysates were prepared with RIPA buffer (1x PBS, 1% Nonidet P40, 0.5% sodium deoxycholate, 0.1% SDS and protease inhibitor cocktail; Roche). Total protein concentration was measured using BCA Protein Assay Kit (Cat: 23225; Pierce, Rockford). Equal amounts of proteins were separated by SDS-PAGE and western blotted onto a 0.45 μm-nitrocellulose membrane. Membranes were blocked in 5% defatted milk or 5% BSA in Tris-buffered saline containing 0.1% Tween-20 (TBST), probed with diluted antibodies and incubated at 4°C overnight. The following primary antibodies were utilized: rabbit polyclonal anti-HSP90 (1:1000 dilution, Cell Signaling), rabbit polyclonal anti-phospho-Stat3 (Tyr705) (1:1000 dilution, Cell Signaling), rat monoclonal anti-RORγt (5:1000 dilution, clone AFKJS-9, eBioscence), rabbit polyclonal anti-IL23R (H-300) (1:1000 dilution, Santa Cruz). After washing in TBST, the membrane was incubated with secondary antibody conjugated with horseradish peroxidase (HRP) (dilution 1:5000, Cell Signaling). The protein bands were visualized using the ECL Western Blotting Substrate (Pierce).
Human prostate samples
These were acquired from mCRPC patients who had given their written informed consent to institutional protocols approved either by the Royal Marsden NHS Foundation Trust Hospital (London, UK) Ethics Committee (reference no. 04/Q0801/60), the IRCCS Ospedale San Raffaele (Milan, Italy) Ethics Committee (reference no. 99/INT/2004; 58/INT/2010), or the Azienda Ospedaliera di Padova (Padova, Italy) Ethics Committee (reference no.CESC/958P/2005). Human biological samples were sourced ethically and their research use was in accord with the terms of the informed consent provided. Fifty-one patients with CRPC treated at The Royal Marsden NHS Foundation Trust Hospital with sufficient formalin-fixed, paraffin-embedded, had matching CSPC and CRPC biopsies identified for multiplex IF (see Table 1). Four patients with CRPC, enrolled at Azienda Ospedaliera di Padova, and four patients with CSPC, enrolled at IRCCS Ospedale San Raffaele, were selected to perform the immune tumor microenvironment characterization by flow cytometry analyses. Case selection was blinded to baseline characteristics, treatments received, clinical outcome and molecular characterization to reduce any potential selection bias. Finally, plasma from 120 CRPC patients with sufficient samples stored (including 28 plasma samples within 40 days of CRPC biopsy) and 20 CSPC patients were analyzed for IL23 levels.
Table 1.
| Paired CSPC and CRPC biopsies (n=51) | |
|---|---|
| CSPC biopsy | |
| Age at diagnosis (years) | |
| Mean, SD | 61.2, 6.0 |
| Staging (n) | |
| T1 | 0 |
| T2 | 3 |
| T3 | 24 |
| T4 | 10 |
| NR | 14 |
| N0 | 9 |
| N1 | 19 |
| NR | 23 |
| M0 | 20 |
| M1 | 22 |
| NR | 9 |
| Biopsy site (n) | |
| Prostate core | 39 |
| Prostatectomy | 4 |
| TURP | 7 |
| Lymph node | 1 |
| Histology (n) | |
| Adenocarcinoma | 51 |
| Gleason (n) | |
| 8-10 | 34 |
| 7 | 13 |
| ≤6 | 2 |
| NS | 2 |
| Presenting PSA (μg/L)* | |
| Median, IQR | 56, 18.4-152.5 |
| Initial therapy (n) | |
| Radical | 21 |
| Palliative | 30 |
| CRPC biopsy | |
| Site of metastatic biopsy (n) | |
| Bone marrow trephine | 12 |
| Lymph node | 30 |
| Liver | 3 |
| TURP | 3 |
| Soft tissue | 3 |
| Treatments for CRPC at biopsy (n) | |
| Docetaxel& | 44 |
| Cabazitaxel | 21 |
| Abiraterone^ | 36 |
| Enzalutamide | 22 |
6 values not available; 1 PSA was >1000 μg/L and calculated as 1000 μg/L
3 patients received docetaxel for CSPC
2 patients received abiraterone for CSPC
Statistical analysis and reproducibility
Data analyses used GraphPad Prism version 7. The data are presented as mean ± standard error of the mean, individual values as scatter plot with column bar graphs and were analyzed using Student’s t-tests (paired or unpaired according to the experimental setting) by a two-sided and, when indicated, followed by Wilcoxon post-test. One-way ANOVA was used to compare three or more groups in time point analyses. Differences were considered significant when P < 0.05 and are indicated as NS, not significant, *P < 0.05, **P < 0.01, ***P < 0.001. Non-parametric tests were applied when variables were not normally distributed using the SPSS statistical software. N values represent biological replicates. Survival curves were compared using the Log-rank test (Mantel-Cox). Due to evidence of overdispersion, tumor-infiltrating PMN-MDSC (CD15+CD11b+CD33+ EpCAM-) and CD15-CD11b+ cells were analyzed using mixed effect negative binomial regression model (with per patient random intercept) when comparing paired biopsies, and a negative binomial regression model was used when analyzing the association at CRPC biopsies with IL23. PMN-MDSC (Coefficient: 1.49; 95% CI: 0.83 to 2.15; P<0.001); CD15-CD11b+ cells (Coefficient: 0.43; 95% CI: 0.04 to 0.83; P=ns). All the statistics and reproducibility are reported in the figure legend. For animal studies, sample size was defined on the basis of past experience with the models15, to detect differences of 20% or greater between the groups (10% significance level and 80% power). For ethical reasons the minimum number of animals necessary to achieve the scientific objectives was used. Animals were allocated randomly to each treatment group. Different treatment groups were processed identically and animals in different treatment groups were exposed to the same environment.
Data availability statement
Source Data for the main and Extended Data Figures are provided in the manuscript. CSPC and mCRPC tumour biopsy mRNA seq data that support the findings of this study are available in the SU2C-PCF IDT cBioportal and through dbGAP with the identifier phs000915.v1.p141.
Extended Data
Extended Data 1. Multispectral images of PMN-MDSCs in human biopsies and set up of the different CRPC mouse models.
a, Multispectral microscopy images (EpCAM yellow, CD15 green, CD33 red; CD11b pink) of castration sensitive vs castration resistant prostate cancers. n=3 biological independent patients. Scale Bar 20μM. b, Quantification of the number of CD11b+ CD15- cells within the tumor of castration sensitive vs castration resistant prostate cancers (CSPCs, n=51 vs CRPCs, n=51 biological independent patients). Cells were counterstained with the nuclear marker DAPI (blue). Statistical analyses (negative binomial regression model): P=0.062. c, MRIs of one representative Sham-operated (Sham) or surgical castrated (CTX) Ptenpc-/- mouse of the three analyzed at different time points. d, Waterfall plot depicting proportional change in tumor response for Sham (n=3) and CTX (n=3) Ptenpc-/- mice. e, Prostate PMN-MDSCs frequencies determined by flow cytometry in Sham (n=3) and CTX (n=3) Ptenpc+/+ mice (12 weeks after castration). Statistical analyses (two sided unpaired t test): P=0.85. f, Schematic representation of the experiment. Six-week-old C57BL/6 males were challenged s.c. with TRAMP-C1 cells. When tumors reached ≈ 100 mm3, mice were sham-operated (Sham, n=9) or surgically castrated (CTX, n=5). g, Tumor PMN-MDSCs frequencies determined by flow cytometry during CS and CR phase. Sham CS n=5, CTX CS n=4, Sham CR n=8, CTX CR n=6. h, Schematic representation of the experiment. Six-week-old FVB males were challenged s.c. with MyC-CaP cells. When tumors reached ≈ 100 mm3, mice were sham-operated (Sham, n=3) or surgically castrated (CTX, n=3). i, Tumor PMN-MDSCs frequencies determined by flow cytometry during CS and CR phase. Sham CS n=3, CTX CS n=4, Sham CR n=4, CTX CR n=3. b,d,e,g,i, Data are reported as mean ± SEM. d,g,i, Statistical analyses (Unpaired two-sided t-test): ns, not significant; *P <0.05; **P <0.01; ***P <0.001. f,h, Statistical analyses (two sided unpaired t test followed by Wilcoxon post-test): *P <0.05.
Extended Data 2. Multiparametric flow cytometry analysis of myeloid populations in the tumors of different CRPC mouse models.
a, Gating strategy relative to the quantification of PMN-MDSCs in the tumor of Sham and CTX-operated mice for Ptenpc-/-, TRAMP-C1 and MyC-CaP models. b, Representative dot plot reporting the Ly6G and Ly6C positive cells in the tumor of Sham and CTX-operated mice for Ptenpc-/-, TRAMP-C1 and MyC-CaP models. Data were validated in at least three biological independent animals. c, Representative dot plot and quantification of CD11b+ F4/80+ cells and CD11c+ CD206- (M1-like) or CD11c- CD206+ (M2-like) macrophages in the tumor of Sham and CTX-operated mice for Ptenpc-/- (Sham n=5, CTX n=9), TRAMP-C1 (Sham n=7, CTX n=6), and MyC-CaP (Sham n=4, CTX n=4), models. Data were reported as mean ± SEM. Statistical analyses (Unpaired two-sided t-test): **P <0.01.
Extended Data 3. Factors secreted by MDSCs promote insensitivity to androgen deprivation in androgen-dependent murine and human prostate cancer cell lines and CXCR2 antagonist impairs MDSCs tumor recruitment in Ptenpc-/- mice.
a, Representative dot plot reporting the BM-MDSCs upon in vitro differentiation. Data were validated in two biological independent experiments. b, Experimental scheme. c, Cell proliferation of MyC-CaP cells (None n=5, C.M. BM-MDSCs n=3, F.A.D. n= 13, F.A.D. + BM-MDSCs n= 13 biological independent samples). d, Percentage of AnnexinV and 7AAD-negative MyC-CaP cells. e, Percentage of AnnexinV and 7AAD-positive MyC-CaP cells. f, qRT-PCR analyses of the indicated genes in MyC-CaP cells. g, h, i, Cell proliferation of VCaP (None n=4, C.M. hBM-MDSCs n=4, F.A.D. n=7, F.A.D. + hBM-MDSCs n=8 biological independent samples), 22Rv1 (None n=4, C.M. hBM-MDSCs n=8, F.A.D. n=8, F.A.D. + hBM-MDSCs n=4 biological independent samples), and PC3 (None n=4, C.M. hBM-MDSCs n=8, F.A.D. n=4, F.A.D. + hBM-MDSCs n=8 biological independent samples) prostate cancer cells. j, Tumor MDSCs frequencies determined by flow cytometry of prostate tumors of CTX Ptenpc-/- mice treated or not with CXCR2 antagonist (αCXCR2) at completion of the study (12-weeks upon CTX). CTX CS n=3, CTX+ αCXCR2 CS n=3, CTX CR n=4, CTX+ αCXCR2 CR n=7 biological independent animals. k, Cell proliferation of TRAMP-C1 cells after 72h of treatment with CXCR2 antagonist (αCXCR2) l, qRT-PCR analyses of the indicated genes in TRAMP-C1 cells after 24h of treatment (fold change compared with F. A. D. condition). k, l, Aggregated data from three independent experiments are reported, fold change compared with F. A. D. condition. c-l, Data were reported as mean ± SEM. c-f, n=3 biological independent samples d,e,g-j, Statistical analyses (Unpaired two-sided t-test): ns, not significant; *P <0.05; **P <0.01; ***P <0.001. c,f, Statistical analyses (two sided unpaired t test followed by Wilcoxon post-test): *P <0.05.
Extended Data 4. Impaired tumor recruitment of MDSCs enhances response to surgical castration in different allograft models of prostate cancers.
a, Schematic representation of the experiment. Six-week-old C57BL/6 males were challenged s.c. with TRAMP-C1 cells. When tumors reached ≈ 100 mm3, mice were surgically castrated and left untreated (CTX, n=8) or treated with CXCR2 antagonist (CTX + αCXCR2, n=9). Representative flow cytometry plots of PMN-MDSCs (CD11b+ Ly6G+ cells, gated on CD45+ cells) in tumors for each experimental condition. b, qRT-PCR analyses of the indicated genes in the prostate tumors of CTX and CTX + αCXCR2 (n=3 per group). Data were reported as mean ± SEM. Statistical analyses (Unpaired two-sided t-test):*P <0.05; ***P <0.001. c, Average tumor volume (±SE) for each experimental group. Statistical analyses (Unpaired two sided t test followed by Wilcoxon post-test): ***P <0.001. d, Survival curves are reported in Kaplan-Meier plot. Statistical analyses (two sided Log rank test): ***P <0.001. e, Schematic representation of the experiment. Six-week-old FVB males were challenged s.c. with MyC-CaP cells. When tumors reached ≈ 100 mm3, mice were surgically castrated and left untreated (CTX, n=5) or treated with CXCR2 antagonist (CTX + αCXCR2, n=5). Representative flow cytometry plots of PMN-MDSCs (CD11b+ Ly6G+ cells, gated on CD45+ cells) in tumors for each experimental condition. f, qRT-PCR analyses of the indicated genes in the prostate tumors of CTX and CTX + αCXCR2 (n=3 per group). Data were reported as mean ± SEM. Statistical analyses (Unpaired two-sided t-test):**P <0.01; ***P <0.001. g, Average tumor volume (±SEM) for each experimental group. Statistical analyses (two sided unpaired t test followed by Wilcoxon post-test): *P <0.05. h, Survival curves reported as Kaplan-Meier plot. Statistical analyses (two sided Log-rank test): **P <0.01. i, Schematic representation of the experiment. Six-week-old NOD SCID males were challenged s.c. with LNCaP cells or with LNCaP cells and hBM-MDSCs. When tumors reached ≈ 70 mm3, mice were sham-operated (Sham, n=5) or sham-operated and injected every three days i.p. with 3x10⁶ hBM-MDSCs (Sham + hBM-MDSCs, n=5) or surgically castrated and left untreated (CTX, n=8) or treated with hBM-MDSCs (CTX + hBM-MDSCs, n=5). j, Average tumor volume (±SEM) for each experimental group. Statistical analyses (Unpaired two sided t test followed by Wilcoxon post-test): **P <0.01.
Extended Data 5. IL23 pathway is the most up-regulated in the tumor upon castration.
a, Gene expression of selected genes determined by NanoString nCounter gene expression assay in Sham Ptenpc-/- and CTX Ptenpc-/- tumors. Data are shown as pool of n=5. b, Analyses of the conditioned media of BM-derived MDSCs tested for the indicated soluble molecules by Mouse CytokineMAP B version 1.0. The graph reports the concentration of the indicated soluble molecules as Log10 of the concentration found in the conditioned medium of BM-MDSCs, the values were subtracted of the background (culture medium). Data are shown as pool of n=10. c, qRT-PCR analyses of the indicated genes in Sham (n=6) and CTX (n=6) Ptenpc-/- tumors. Data were reported as mean ± SEM of biological independent animals. Statistical analyses (Unpaired two sided t test): *P <0.05. d, Protein level of CXCL1, CXCL2 and CXCL5 in CTX Ptenpc-/- tumors. Data are analyzed as ratio between CTX (pool of 3 samples) and Sham (pool of 3 samples) Ptenpc-/- tumors and reported as fold increase in protein level. e-f, IL23R protein level analyzed by flow cytometry and western blot on TRAMP-C1 cells under normal culture condition (FBS) or androgen deprivation culture condition (CS-FBS). n=4 biological independent samples per group. f, Numbers indicate fold change in protein level. Loading control: anti–β–actin antibody. The WB was validated at twice. g, Protein profile of the plasma of CSPC and CRPC patients. Data are analyzed as ratio between CRPC (pool of 18 samples) and CSPC (pool of 17 samples) and reported as fold increase in protein level.
Extended Data 6. Characterization of IL23+ cells in the tumor of CTX Ptenpc-/- mice and CRPC patients.
a, Multispectral microscopy images (EpCAM yellow, CD15 green, IL23 red) of three human castration resistant prostate cancers. b, Correlation analyses of the numbers of CD15- CD11b+ cells in the tumor and the IL23 levels in the plasma of CRPC patients (n=28). Statistical analyses (negative binomial regression model) p=0.63. c, d, IL23 and IL23R mRNA expression in the tumor of HSPCs (n=549) and mCRPCs (n=116). e, f, Expression of IL23 in PMN-MDSC marker (CD11b, CD33, CD15) positive HSPC or mCRPC patients. c-f, Statistical analyses (Unpaired two sided t test) are reported. g, Representative plots of IL23+, CD45+ and CD45-, Ly6Gbright CD11b+ and Ly6Gint CD11bint, CD11b+ F4/80+ cells pre-gated on the reported population in the tumor of CTX Ptenpc-/- mice. IL23 gate was decided based on Isotype control panel (insert). Pie reports the percentage of the different subsets gated on IL23+ cells in the tumor of Ptenpc-/- mice (Mean, n=9). h, qRT-PCR analyses of IL23 in the prostate tumors of castrated (CTX; n=6) or castrated and treated with CXCR2 antagonist (CTX + αCXCR2; n=7) Ptenpc-/- mice. Mean ± SEM. i, PMN-MDSCs and TAMs frequencies determined by flow cytometry in the tumor of castrated NSG™ TRAMP-C1 allografts upon treatment with Isotype, αCSF1R, αCXCR2. Data are reported as mean ± SE (n=3 per group). j, qRT-PCR analyses of IL23 in the tumor of castrated NSG™ TRAMP-C1 allografts upon treatment with Isotype (n=4), αCSF1R (n=5), αCXCR2 (n=5). Data are reported as mean ± SEM. Each dot represents a biological independent animal. h, i, j, Statistical analyses (Unpaired two sided t test): *P <0.05; **P <0.01; ***P <0.01.
Extended Data 7. BM-MDSCsIL23wt and BM-MDSCsIL23ko have equal secretome and equal immunosuppressive capability.
a, Correlation analyses of the gene expression of selected genes determined by NanoString nCounter gene expression assay in BM-MDSCsIL23wt and BM-MDSCsIL23ko reported by scatter plot analyses. Data are shown as pool of n=10. R2 values were determined using a linear regression analyses. b, Representative flow cytometry plots of CFSE dilution (gated on CD8+ cells) and quantification of proliferating CD8+ T cells exposed to C. M. from BM-MDSCsIL23wt or BM-MDSCsIL23ko. Mean ± SE of three independent biological samples. Statistical analyses (Unpaired two sided t test): **P <0.01; ***P <0.01.
Extended Data 8. Genetic inhibition of IL23 limits castration resistance in Ptenpc-/- mice.
a, Experimental set-up. Sham-operated (Sham) or Castrated (CTX) Ptenpc-/- mice were lethally irradiated and transplanted with BM precursors depleted by T, B, and NK cells from IL23wt and IL23ko mice. Then, monitored by MRI for tumor progression. b, Representative dot plot of BM precursors pre- and post-depletion of T, B, and NK cells. Data were validated in two biological independent experiments. c, Quantification of the tumor size of Sham-operated Ptenpc-/-;IL23wt (n=4) and Ptenpc-/-;IL23ko (n=4), and castrated Ptenpc-/-;IL23wt (n=4) and Ptenpc-/-;IL23ko (n=7) mice at completion of the study is reported as fold increase of the prostate anterior lobe (AL) volume (fold change compared with CTX Ptenpc-/-;IL23wt group). Data are reported as mean ± SE. Statistical analyses (Unpaired two sided t test): **P <0.01, ***P <0.001. d, H&E, Ki-67, and pSTAT3Y705 immunohistochemical staining (Ki-67 and pSTAT3Y705 brown; nuclei, blue) of one representative Ptenpc-/-;IL23wt and Ptenpc-/-;IL23ko mouse of at least the three analyzed at completion of the study. Scale Bar 50 or 25 μM.
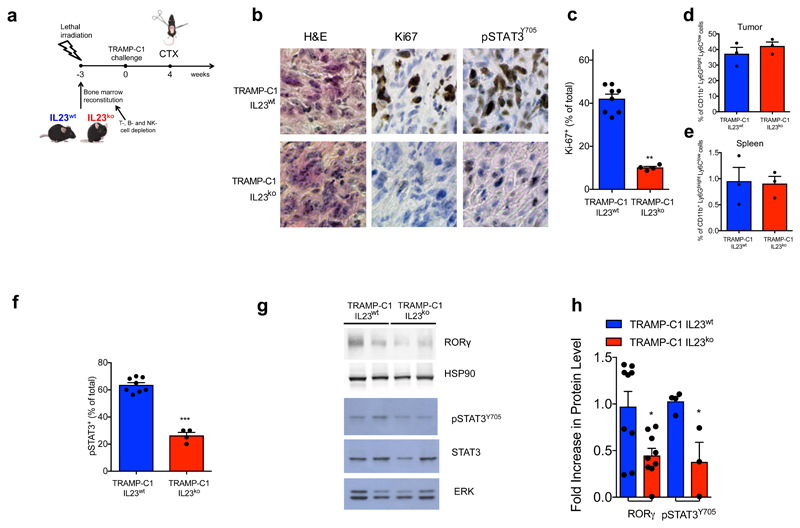
Extended Data 9. Genetic inhibition of IL23 limits castration resistance in TRAMP-C1 allograft model in vivo.
a, Schematic representation of the experiment. Six-week-old C57BL/6 males were lethally irradiated and transplanted with BM precursors from IL23wt and IL23ko mice. After the BM engraftment, the animals were challenged s.c. with TRAMP-C1 cells. When tumors reached ≈ 100 mm3, mice were surgically castrated and monitored for tumor progression. b, H&E, Ki-67 and pSTAT3Y705 immunohistochemical staining (Ki-67 and pSTAT3Y705 brown; nuclei, blue) of representative TRAMP-C1 IL23wt and TRAMP-C1 IL23ko bearing mice. Scale Bar 25 μM. c, Quantification of Ki-67 positive cells is reported as a percentage of total. TRAMP-C1 IL23wt (n=8) and TRAMP-C1 IL23ko (n=4), one tumor per mouse, mean of three sections per mouse, ≥ 3 fields per section. Biological mean ± SE. Statistical analyses (Unpaired two-sided t test): **P <0.01. d-e, PMN-MDSCs frequencies determined by flow cytometry in the tumor and in the spleen of TRAMP-C1 IL23wt (n=3) and TRAMP-C1 IL23ko (n=3) bearing mice 10 days after castration. Data are reported as mean ± SE. f, Quantification of pSTAT3Y705 reported as a percentage of total. TRAMP-C1 IL23wt (n=8) and TRAMP-C1 IL23ko (n=4), one tumor per mouse, mean of three sections per mouse, ≥ 3 fields per section. Statistical analyses (Unpaired two sided t test): ***P <0.001. g, Western blot for RORγ, pSTAT3Y705 and total STAT3 levels of prostate tumors of TRAMP-C1 IL23wt and TRAMP-C1 IL23ko bearing mice. Loading control: HSP90 antibody or total ERK antibody. The WB was validated al least two times. h, Quantification is reported as mean ± SEM of biological independent experiments: TRAMP-C1 IL23wt RORγ n=9; and TRAMP-C1 IL23ko RORγ n=9; TRAMP-C1 IL23wt pSTAT3Y705 n=4; and TRAMP-C1 IL23ko pSTAT3Y705 n=3. Statistical analyses (Unpaired two sided t test): *P <0.05.
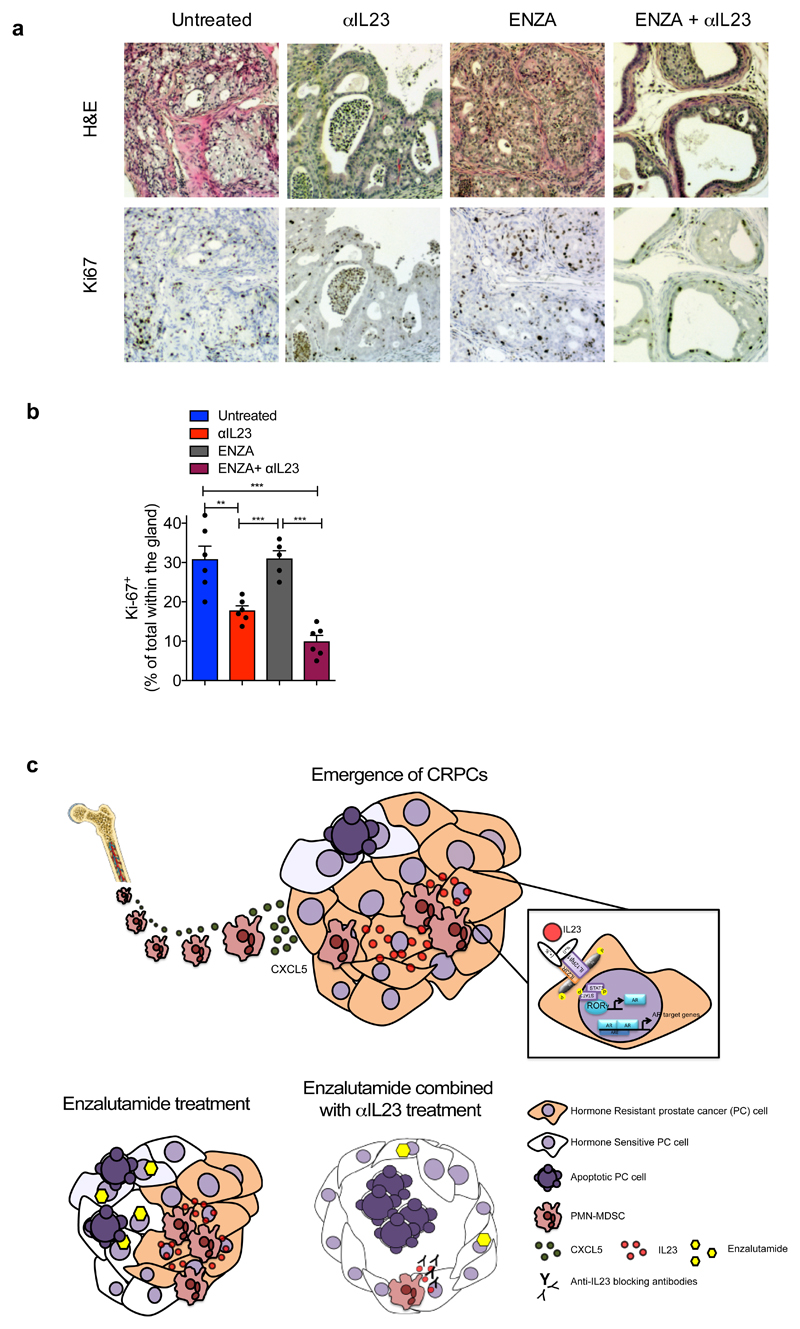
Extended Data 10. Pharmacological inhibition of IL23 in association with ADT delays disease progression in prostate cancer.
a, H&E and Ki-67 immunohistochemical staining (Ki-67 brown; nuclei, blue) of representative castrated-Ptenpc-/- mice treated with αIL23, ENZA or both. Scale Bar 50 μM b, Quantification of Ki-67 reported as a percentage of total within the glands. One tumor per mouse, three sections per mouse, ≥ 3 fields per section. Mean ± SEM of a biological independent animals. Untreated n=6, αIL23 n=6, ENZA n=5 or both n=6. Statistical analyses (Unpaired two sided t test): **P <0.01; ***P <0.001. c, Upon castration, PMN-MDSCs progressively infiltrate the tumor bed mainly recruited by CXCL5. Within the tumor, PMN-MDSCs start to produce higher amount of IL23, thus establishing a positive-feedback loop that induce the over-expression of IL23R on the tumor epithelial cells and confer castration resistance by activating the STAT3/RORγ pathway. Enzalutamide treatment can block androgen receptor inducing sensitiveness of prostate cancer cells to androgen deprivation, but the persistent presence of PMN-MDSCs-derived IL23 rescues the drug sensitiveness leading to androgen deprivation resistance. Anti-IL23 treatment reverts castration resistance in prostate cancer enhancing the efficacy of enzalutamide.
Supplementary Material
Acknowledgements
We acknowledge all members of Prof. A. Alimonti laboratory and Dr. M. Bellone for the scientific discussions. We also thank Prof. F. Sallusto and Dr. R. Marzi for kindly providing IL23ko mice and all the members of the IRB animal core facility and E. Mira Catò for technical assistance and the animal work. Dr. R. D’Antuono contributed with immunofluorescence acquisition. We acknowledge Dr. T. Canu and Dr. A. Napolitano of the Preclinical Imaging Facility of San Raffaele Scientific Institute for kindly contributing to MRI acquisition and analysis. We acknowledge Prof. M. Montopoli of the University of Padova for kindly helping with the logistic of samples. This work was supported by ERC consolidator (683136) and Swiss Cancer League (KFS4267-08-2017) grant, Dr. Josef Steiner Foundation, Swiss Card-Onco-Grant of Alfred and Annemarie von Sick Grant, and Helmut Horten Foundation, SNSF (310030_176045), PCUK (RIA15-ST2-018).
Footnotes
Reviewer information
Nature thanks xx, xx for their contribution to the peer review of this work.
Author Contributions
A.A. and A.C. conceived and designed the project. A.C., C.S., E.Z., M.M., performed experiments. V.G. performed experiments with human organoids. D.D.M., M.C., A.N., established and carried out fluorescence microscopy. A.R., checked the quality of the RNA and performed NanoString. D.D., performed statistical analyses of multiplex immunofluorescence in human tissue sections. W.Y. performed bioinformatic analyses. G.D.B. performed surgical castration in all the animals. M.L. performed immunohistochemical experiments and analysis. A.S., M.B.L., S.S., A.F., A.B., L.R., C.A.B., T.P., selected and provided human samples. D.N.R., reviewed tissue segmentation, cell segmentation, and phenotype determination maps of tissue sections. E.P. took care of animals’ genotype. S.B. provided the AZD5069 compound. A.E. performed MRI analyses and analyzed the results. J.D.B. supervised human experiments and interpreted the data. A.C. and A.A. interpreted the data and wrote the paper.
Authors Information
The authors declare that Dr. Simon Barry is affiliated to IMED Oncology AstraZeneca, Li Ka Shing Centre, Cambridge, United Kingdom and provided the AZD5069 compound.
No competing financial interests for all the other authors.
References
- 1.Torre LA, et al. Global cancer statistics, 2012. CA Cancer J Clin. 2015;65:87–108. doi: 10.3322/caac.21262. [DOI] [PubMed] [Google Scholar]
- 2.Watson PA, Arora VK, Sawyers CL. Emerging mechanisms of resistance to androgen receptor inhibitors in prostate cancer. Nat Rev Cancer. 2015;15:701–711. doi: 10.1038/nrc4016. [DOI] [PMC free article] [PubMed] [Google Scholar]
- 3.Bianchini D, et al. Antitumour activity of enzalutamide (MDV3100) in patients with metastatic castration-resistant prostate cancer (CRPC) pre-treated with docetaxel and abiraterone. Eur J Cancer. 2014;50:78–84. doi: 10.1016/j.ejca.2013.08.020. [DOI] [PubMed] [Google Scholar]
- 4.Zhang T, et al. Exploring the Clinical Benefit of Docetaxel or Enzalutamide After Disease Progression During Abiraterone Acetate and Prednisone Treatment in Men With Metastatic Castration-Resistant Prostate Cancer. Clin Genitourin Cancer. 2015;13:392–399. doi: 10.1016/j.clgc.2015.01.004. [DOI] [PubMed] [Google Scholar]
- 5.Badrising S, et al. Clinical activity and tolerability of enzalutamide (MDV3100) in patients with metastatic, castration-resistant prostate cancer who progress after docetaxel and abiraterone treatment. Cancer. 2014;120:968–975. doi: 10.1002/cncr.28518. [DOI] [PubMed] [Google Scholar]
- 6.Noonan KL, et al. Clinical activity of abiraterone acetate in patients with metastatic castration-resistant prostate cancer progressing after enzalutamide. Ann Oncol. 2013;24:1802–1807. doi: 10.1093/annonc/mdt138. [DOI] [PubMed] [Google Scholar]
- 7.Schrader AJ, et al. Enzalutamide in castration-resistant prostate cancer patients progressing after docetaxel and abiraterone. Eur Urol. 2014;65:30–36. doi: 10.1016/j.eururo.2013.06.042. [DOI] [PubMed] [Google Scholar]
- 8.Sartor O, de Bono JS. Metastatic Prostate Cancer. N Engl J Med. 2018;378:1653–1654. doi: 10.1056/NEJMc1803343. [DOI] [PubMed] [Google Scholar]
- 9.Karantanos T, Corn PG, Thompson TC. Prostate cancer progression after androgen deprivation therapy: mechanisms of castrate resistance and novel therapeutic approaches. Oncogene. 2013;32:5501–5511. doi: 10.1038/onc.2013.206. [DOI] [PMC free article] [PubMed] [Google Scholar]
- 10.Carver BS, et al. Reciprocal feedback regulation of PI3K and androgen receptor signaling in PTEN-deficient prostate cancer. Cancer Cell. 2011;19:575–586. doi: 10.1016/j.ccr.2011.04.008. [DOI] [PMC free article] [PubMed] [Google Scholar]
- 11.Quail DF, Joyce JA. Microenvironmental regulation of tumor progression and metastasis. Nat Med. 2013;19:1423–1437. doi: 10.1038/nm.3394. [DOI] [PMC free article] [PubMed] [Google Scholar]
- 12.Ammirante M, Luo JL, Grivennikov S, Nedospasov S, Karin M. B-cell-derived lymphotoxin promotes castration-resistant prostate cancer. Nature. 2010;464:302–305. doi: 10.1038/nature08782. [DOI] [PMC free article] [PubMed] [Google Scholar]
- 13.Lee GT, et al. Bone morphogenetic protein-6 induces castration resistance in prostate cancer cells through tumor infiltrating macrophages. Cancer Sci. 2013;104:1027–1032. doi: 10.1111/cas.12206. [DOI] [PMC free article] [PubMed] [Google Scholar]
- 14.Toso A, et al. Enhancing chemotherapy efficacy in Pten-deficient prostate tumors by activating the senescence-associated antitumor immunity. Cell Rep. 2014;9:75–89. doi: 10.1016/j.celrep.2014.08.044. [DOI] [PubMed] [Google Scholar]
- 15.Di Mitri D, et al. Tumour-infiltrating Gr-1+ myeloid cells antagonize senescence in cancer. Nature. 2014;515:134–137. doi: 10.1038/nature13638. [DOI] [PubMed] [Google Scholar]
- 16.Lu X, et al. Effective combinatorial immunotherapy for castration-resistant prostate cancer. Nature. 2017;543:728–732. doi: 10.1038/nature21676. [DOI] [PMC free article] [PubMed] [Google Scholar]
- 17.Gabrilovich DI, Nagaraj S. Myeloid-derived suppressor cells as regulators of the immune system. Nat Rev Immunol. 2009;9:162–174. doi: 10.1038/nri2506. [DOI] [PMC free article] [PubMed] [Google Scholar]
- 18.Bronte V, et al. Recommendations for myeloid-derived suppressor cell nomenclature and characterization standards. Nat Commun. 2016;7 doi: 10.1038/ncomms12150. 12150. [DOI] [PMC free article] [PubMed] [Google Scholar]
- 19.Hossain DM, et al. TLR9-Targeted STAT3 Silencing Abrogates Immunosuppressive Activity of Myeloid-Derived Suppressor Cells from Prostate Cancer Patients. Clin Cancer Res. 2015;21:3771–3782. doi: 10.1158/1078-0432.CCR-14-3145. [DOI] [PMC free article] [PubMed] [Google Scholar]
- 20.Mehra N, et al. Myeloid-derived suppressor cells (MDSCs) in metastatic castration-resistant prostate cancer (CRPC) patients (PTS) Ann Oncol. 2016;27 doi: 10.1093/annonc/mdw372.41. [DOI] [Google Scholar]
- 21.Murdoch C, Muthana M, Coffelt SB, Lewis CE. The role of myeloid cells in the promotion of tumour angiogenesis. Nat Rev Cancer. 2008;8:618–631. doi: 10.1038/nrc2444. [DOI] [PubMed] [Google Scholar]
- 22.Lunardi A, et al. A co-clinical approach identifies mechanisms and potential therapies for androgen deprivation resistance in prostate cancer. Nat Genet. 2013;45:747–755. doi: 10.1038/ng.2650. [DOI] [PMC free article] [PubMed] [Google Scholar]
- 23.Clinical Trial NCT03177187. https://clinicaltrials.gov/ct2/show/NCT03177187.
- 24.Bezzi M, et al. Diverse genetic-driven immune landscapes dictate tumor progression through distinct mechanisms. Nat Med. 2018;24:165–175. doi: 10.1038/nm.4463. [DOI] [PubMed] [Google Scholar]
- 25.Gordon SR, et al. PD-1 expression by tumour-associated macrophages inhibits phagocytosis and tumour immunity. Nature. 2017;545:495–499. doi: 10.1038/nature22396. [DOI] [PMC free article] [PubMed] [Google Scholar]
- 26.Durant L, et al. Diverse targets of the transcription factor STAT3 contribute to T cell pathogenicity and homeostasis. Immunity. 2010;32:605–615. doi: 10.1016/j.immuni.2010.05.003. [DOI] [PMC free article] [PubMed] [Google Scholar]
- 27.Kastelein RA, Hunter CA, Cua DJ. Discovery and biology of IL-23 and IL-27: related but functionally distinct regulators of inflammation. Annu Rev Immunol. 2007;25:221–242. doi: 10.1146/annurev.immunol.22.012703.104758. [DOI] [PubMed] [Google Scholar]
- 28.Zhou L, et al. IL-6 programs T(H)-17 cell differentiation by promoting sequential engagement of the IL-21 and IL-23 pathways. Nat Immunol. 2007;8:967–974. doi: 10.1038/ni1488. [DOI] [PubMed] [Google Scholar]
- 29.Chen T, Wang LH, Farrar WL. Interleukin 6 activates androgen receptor-mediated gene expression through a signal transducer and activator of transcription 3-dependent pathway in LNCaP prostate cancer cells. Cancer Res. 2000;60:2132–2135. [PubMed] [Google Scholar]
- 30.Wang JJ, et al. ROR-gamma drives androgen receptor expression and represents a therapeutic target in castration-resistant prostate cancer. Nature Medicine. 2016;22:692–692. doi: 10.1038/nm0616-692b. (vol 22, pg 488, 2016) [DOI] [PubMed] [Google Scholar]
- 31.Campa M, Mansouri B, Warren R, Menter A. A Review of Biologic Therapies Targeting IL-23 and IL-17 for Use in Moderate-to-Severe Plaque Psoriasis. Dermatol Ther (Heidelb) 2016;6:1–12. doi: 10.1007/s13555-015-0092-3. [DOI] [PMC free article] [PubMed] [Google Scholar]
- 32.Gordon KB, et al. A Phase 2 Trial of Guselkumab versus Adalimumab for Plaque Psoriasis. N Engl J Med. 2015;373:136–144. doi: 10.1056/NEJMoa1501646. [DOI] [PubMed] [Google Scholar]
- 33.Moreira RB, et al. Differential side effects profile in patients with mCRPC treated with abiraterone or enzalutamide: a meta-analysis of randomized controlled trials. Oncotarget. 2017;8:84572–84578. doi: 10.18632/oncotarget.20028. [DOI] [PMC free article] [PubMed] [Google Scholar]
- 34.Gangemi S, et al. Clinical significance of circulating interleukin-23 as a prognostic factor in breast cancer patients. J Cell Biochem. 2012;113:2122–2125. doi: 10.1002/jcb.24083. [DOI] [PubMed] [Google Scholar]
- 35.Grivennikov SI, et al. Adenoma-linked barrier defects and microbial products drive IL-23/IL-17-mediated tumour growth. Nature. 2012;491:254–258. doi: 10.1038/nature11465. [DOI] [PMC free article] [PubMed] [Google Scholar]
- 36.Teng MWL, et al. IL-23 suppresses innate immune response independently of IL-17A during carcinogenesis and metastasis. P Natl Acad Sci USA. 2010;107:8328–8333. doi: 10.1073/pnas.1003251107. [DOI] [PMC free article] [PubMed] [Google Scholar]
- 37.Chen DS, Mellman I. Elements of cancer immunity and the cancer-immune set point. Nature. 2017;541:321–330. doi: 10.1038/nature21349. [DOI] [PubMed] [Google Scholar]
- 38.Graff JN, et al. Early evidence of anti-PD-1 activity in enzalutamide-resistant prostate cancer. Oncotarget. 2016;7:52810–52817. doi: 10.18632/oncotarget.10547. [DOI] [PMC free article] [PubMed] [Google Scholar]
- 39.Marigo I, et al. Tumor-induced tolerance and immune suppression depend on the C/EBPbeta transcription factor. Immunity. 2010;32:790–802. doi: 10.1016/j.immuni.2010.05.010. [DOI] [PubMed] [Google Scholar]
- 40.Lechner MG, Liebertz DJ, Epstein AL. Characterization of cytokine-induced myeloid-derived suppressor cells from normal human peripheral blood mononuclear cells. J Immunol. 2010;185:2273–2284. doi: 10.4049/jimmunol.1000901. [DOI] [PMC free article] [PubMed] [Google Scholar]
- 41.Robinson D, et al. Integrative clinical genomics of advanced prostate cancer. Cell. 2015;161:1215–1228. doi: 10.1016/j.cell.2015.05.001. [DOI] [PMC free article] [PubMed] [Google Scholar]
- 42.Kim D, et al. TopHat2: accurate alignment of transcriptomes in the presence of insertions, deletions and gene fusions. Genome Biol. 2013;14:R36. doi: 10.1186/gb-2013-14-4-r36. [DOI] [PMC free article] [PubMed] [Google Scholar]
- 43.Trapnell C, et al. Differential gene and transcript expression analysis of RNA-seq experiments with TopHat and Cufflinks. Nat Protoc. 2012;7:562–578. doi: 10.1038/nprot.2012.016. [DOI] [PMC free article] [PubMed] [Google Scholar]
- 44.Drost J, et al. Organoid culture systems for prostate epithelial and cancer tissue. Nat Protoc. 2016;11:347–358. doi: 10.1038/nprot.2016.006. [DOI] [PMC free article] [PubMed] [Google Scholar]
Associated Data
This section collects any data citations, data availability statements, or supplementary materials included in this article.
Supplementary Materials
Data Availability Statement
Source Data for the main and Extended Data Figures are provided in the manuscript. CSPC and mCRPC tumour biopsy mRNA seq data that support the findings of this study are available in the SU2C-PCF IDT cBioportal and through dbGAP with the identifier phs000915.v1.p141.


