

eTOC blurb
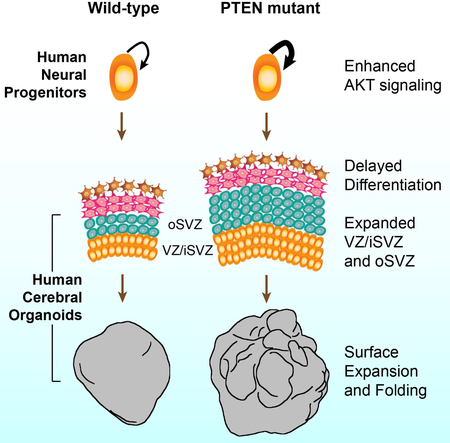
The growth and structural formation of the human cortex can be modeled in vitro using cerebral organoids. In this article, Li, Muffat, and colleagues show that enhancing the PTEN-AKT signaling pathway leads to the generation of human cerebral organoids that are expanded in size and display surface folding.
Summary
An expansion of the cerebral neocortex is thought to be the foundation for the unique intellectual abilities of humans. It has been suggested that an increase in the proliferative potential of neural progenitors (NPs) underlies the expansion of the cortex and its convoluted appearance. Here we show that increasing NP proliferation induces expansion and folding in an in vitro model of human corticogenesis. Deletion of PTEN stimulates proliferation and generates significantly larger and substantially folded cerebral organoids. This genetic modification allows sustained cell-cycle re-entry, expansion of the progenitor population, and delayed neuronal differentiation, all key features of the developing human cortex. In contrast, Pten deletion in mouse organoids does not lead to folding. Finally, we utilized the expanded cerebral organoids to show that infection with Zika virus impairs cortical growth and folding. Our study provides new insights into the mechanisms regulating the structure and organization of the human cortex.
Graphical Abstract
Introduction
A massive increase in the size of the human cerebral neocortex is accompanied by the expansion of the cortical area, and the associated emergence of extensive cortical folding (Bystron et al., 2008; Geschwind and Rakic, 2013; Sun and Hevner, 2014). In the developing human cerebral cortex, radial glial cells, residing in both the ventricular zone (VZ) and the later-formed sub-ventricular zone (SVZ), give rise to intermediate progenitors and ultimately post-mitotic neurons (Lui et al., 2011; Rakic, 1988), following an inside-out pattern of migration (Rakic, 1974). Compared to mice, the developing cortex of humans and other gyrencephalic mammals harbor a larger VZ and SVZ, which are composed of substantially more radial glial cells and intermediate progenitors (Hansen et al., 2010). Whether this increase in NP population is directly responsible for the expansion of the human cortex, and the evolutionary transformation of a smooth, unfolded cortex to a profoundly folded one remains mostly untested, in no small part due to the inaccessible nature of the developing human cortex. However, recent advances in human pluripotent stem cell technology (Takahashi et al., 2007; Yu et al., 2007) and three-dimensional culture systems (Lancaster et al., 2013; Sasai, 2013) have opened new avenues to investigate human cortical development. Starting with human embryonic stem cells (hESCs) and induced pluripotent stem cells, we have recently reported the generation of cerebral organoids that self-organize into neuralized structures resembling the early developing human cerebral cortex (Lancaster et al., 2013). These in vitro derived neural tissues recapitulate early stages of cortical formation, and display human-specific features such as the outer SVZ. Therefore human cerebral organoids represent a novel method to investigate the molecular, cellular, and anatomical paradigms of early human cortical development.
Cortical folding can be experimentally induced in the developing mouse brain by beta-catenin over-expression (Chenn and Walsh, 2002), inhibition of apoptosis (Kuida et al., 1998; Kuida et al., 1996), or modification of NP specific genes such as Trnp1 (Stahl et al., 2013) and Arhgap11b (Florio et al., 2015), all likely via direct regulations of the proliferation, survival and differentiation propensity of NPs. Differential regulation of NP proliferation may also contribute to human specific cortical pattern formation (Bae et al., 2014). Interestingly, multiple lines of evidence have converged to suggest a physiological involvement of growth factor signaling in regulating human-specific cortical expansion and folding. Introduction of FGF2 into developing mouse cortex leads to regional formation of gyri (Rash et al., 2013), and human fetal cortical transcriptome revealed progenitor specific enrichment of PDGF-D (Lui et al., 2014). Existing human genetic evidence strongly suggests that growth factor signaling, in particular through the PTEN-AKT cascade, regulates human cortical formation. Pathological development of larger brain (megalencephaly) and/or increased gyrification (polymicrogyria) have been linked to mutations that activate the pathway, in genes such as AKT3, PTEN, PIK3CA, and PIK3R2 (DiLiberti, 1998; Lee et al., 2012; Marchese et al., 2014; Mirzaa et al., 2013; Poduri et al., 2012; Riviere et al., 2012; Terrone et al., 2016). Conversely, mutations that impair growth factor signaling have been linked to symptoms of human microcephaly (Boland et al., 2007; Juanes et al., 2015). Genetically modified mice carrying corresponding mutations were shown to mimic, but frequently to a lesser extent, aspects of the phenotypes displayed by human patients. For example, while AKT3 activating mutations have been linked to human macrocephaly and polymicrogyria (Lee et al., 2012; Poduri et al., 2012), Akt3 mutant mice with increased signaling activity displayed increased brain size, but otherwise normal cortical patterning with no increase in gyrification (Tokuda et al., 2011). Similarly, Pten mutant mice also displayed macrocephaly without increased gyrification (Groszer et al., 2001; Kwon et al., 2006; Lehtinen et al., 2011). Such phenotypic difference may reflect inherent species difference in signaling regulation, cellular response and anatomical organization. Therefore the human genetic evidence strongly suggests an intrinsic and possibly preferential dependence of human NPs on the growth factor signaling cascade.
In the present study we investigated the direct effect of enhancing human NP proliferation on cortical formation in a 3D cerebral organoid system. We chose the PTEN gene because of the human genetics evidence demonstrating its function in cortical development, and a substantial body of literature on its role in regulating progenitor cells of various lineages (Hill and Wu, 2009). PTEN heterozygous loss-of-function mutations have been associated with human macrocephaly (Butler et al., 2005; Marchese et al., 2014). In the current 3D cerebral organoid system, PTEN homozygous mutation was adopted to drive the activation of the PI3K-AKT pathway. Indeed, deletion of the PTEN gene increased AKT activity in human NPs, promoted cell cycle re-entry and transiently delayed neuronal differentiation, resulting in a marked expansion of the radial glia and intermediate progenitor population. Both human and mouse organoids that lacked PTEN showed a significant increase in size but only human organoids displayed substantial surface folding. The degree of expansion and folding was regulated by further tuning the strength of AKT signaling with reduced signaling resulting in smaller and smooth organoids, and increased signaling in larger and more folded organoids. These findings lend support to the notion that an increase in the proliferative potential of NPs contributes to the expansion of the human cerebral neocortex, and the emergence of surface folding. Lastly, in light of the current global health emergency regarding Zika virus (ZIKV), we applied the expanded cerebral organoid culture system to investigate a possible link between ZIKV exposure and cortical malformation such as microcephaly and lissencephaly.
Results
PTEN deletion enhances growth factor-dependent proliferation in 2D cultured human neural progenitors
To disrupt the human PTEN gene, sgRNA was designed to target the first exon (Figure 1A), mimicking a recently reported macrocephalic patient mutation (Figure S1A) (Marchese et al., 2014). WIBR3, a previously well-characterized hESC line (Lengner et al., 2010) was targeted to generate homozygous frameshift mutations using CRISPR/Cas9 (Figure 1A). Absence of PTEN protein was confirmed by immuno-blotting (Figure 1B). Using the same approach, two additional hESC lines (WIBR1, WIBR2) were also targeted to generate mutant clones on these independent genetic backgrounds (Figure S1B–S1E, S1F–S1G).
Figure 1. Induction of expansion and folding in PTEN mutant human cerebral organoids.

A-B) CRISPR/Cas9-mediated targeting of the human PTEN locus, sequences of mutant WIBR3 hESC clones, and immuno-blotting for PTEN protein.
C) ATP assay on 2D adherent NP culture, showing enhanced proliferation in WIBR3 PTEN mutants in the presence of low bFGF concentration.
D-E) Representative image of EdU-Ki67 co-staining in WIBR3 wild-type NPs cultured with low bFGF (D), and quantification of cell cycle exit ratio (EdU+Ki67-/all EdU+). Low bFGF, 1ng/ml; high bFGF, 10ng/ml. Scale bars, 50um (top panel) and 10um (lower panels).
F-G) Representative bright field (F) and light sheet images (G) of control and PTEN mutant WIBR3 cerebral organoids. Lower panels in (G) show the different angle view of the main panels above. Scale bar, 1mm (F) and 500um (G).
H-I) Reconstructed models of control and mutant WIBR3 organoids, and quantification of volume, surface area and sphericity. Scale bar, 1mm.
J) Quantification of control and mutant WIBR3 organoids volume and surface area on histological sections using stereological method.
K-L) Images and quantification of surface folds density in Hoechst-stained control and mutant WIBR3 organoids at 6 weeks. Middle panels show higher magnification view of the top panels. Lower panels show algorithmic tracing of surface folds via Canny Edge Detection. Scale bar, 500um (upper panels), 100um (middle and lower panels).
Results are mean +/− SEM. *p<0.05, ***p<0.001. See also Figure S1, S2, S3, S4.
PTEN and its downstream signaling pathway is involved in the regulation of proliferation, differentiation and apoptosis of various stem/progenitor populations but little is known of its function in the developing human brain. Analysis of the BrainSpan Atlas of the Developing Human Brain revealed that PTEN expression is low in the VZ/SVZ, and high in the cortical plate where differentiated neurons reside, a pattern inversely correlated with progenitor markers PAX6 and TBR2 (Figure S1H–S1K). Similarly, in vitro derived human NPs express less PTEN compared to neurons, suggesting a possible physiological involvement during normal human neural development (Figure S1L). In a 2D adherent culture system, PTEN mutant human NPs displayed significantly higher growth rate in response to low bFGF (1–5 ng/ml, Figure 1C), and higher level of cell cycle re-entry as revealed by EdU pulse-chase assay and Ki67 co-staining (Figure 1D–1E). Control and mutant NPs had similar proliferation rates in the presence of high bFGF, or in the absence of bFGF (Figure 1E). Enhanced proliferation of mutant NPs was also observed in response to low concentration of PDGF-DD and IGF2, two growth factors implicated in regulating fetal cortical growth (Lehtinen et al., 2011; Lui et al., 2014) (Figure S1N–S1O).
Expansion and folding of PTEN mutant human cerebral organoids
To investigate the effect of PTEN deletion on human neural development in a more complex setting we adopted the cerebral organoids culture system (Lancaster et al., 2013). Consistent with previous reports, hESCs, when differentiated into 3D neural tissues, grew in volume over time and displayed discrete lineage identity (Figure S2A–S2C). At 4 weeks the organoids were composed mostly of Nestin+ NPs showing typical radial glial morphology, with processes contacting both the apical and basal surfaces of the neuroepithelium. At 8 weeks, these NPs underwent neuronal differentiation and generated a distinct layer of DCX+ neurons located exclusively away from the ventricle, consistent with the apical-basal axis of neural migration (Figure S2C). At 12 weeks and beyond, Nestin+ NPs had greatly diminished and the organoids were mainly composed of differentiated neurons and glia (Figure S2D–S2E). In wild-type human organoids, PTEN gene expression was lower at earlier stages and increased as the organoids differentiated and matured (Figure S1M).
To compare organoid formation of PTEN mutant and isogenic control hESCs, equal numbers of dissociated single cells were seeded to form embryoid bodies (EBs). Both control and mutant WIBR3 hESCs generated EBs with comparable overall morphology after 1 week (Figure S3A). At 4 weeks, while control organoids were relatively spherical and smooth, PTEN mutant organoids displayed markedly increased outgrowth of neuroepithelial tissue, surrounding ventricle-like structures (Figure 1F). Neuroepithelial over-growth was even more evident in mutant organoids at 6 and 8 weeks and led to a drastic increase in size and an overall folded surface (Figure 1F). To better visualize and quantify their 3D morphology, we imaged the organoids on a light sheet fluorescent microscope (Figure 1G). PTEN mutants displayed markedly increased surface area, overall volume, and reduced sphericity compared to controls (Figure 1G–1I). The increase in volume and surface area was separately validated on histological sections (Figure 1J, Figure S3B–S3C). Because the increased surface area was often organized in continuous folds, we further demonstrate a significant increase in folds density in mutant organoids (Figure 1K–1L). The expansion and folding phenotype is fully penetrant and present in all WIBR3 PTEN mutant organoids examined across multiple independent experiments (Figure S3D–S3E), as well as in PTEN mutant organoids generated from WIBR1 and WIBR2 hESCs (Figure S4A–S4C).
We explored the potential difference between mouse and human cortical development by generating cerebral organoids from control and Pten mutant mESCs. CRISPR/Cas9 gene targeting was used to disrupt the first exon of the Pten gene in V6.5 mESCs (Figure S4D–S4E). Three controls and three homozygous frameshift mutants were selected, based on genomic sequence and loss of full-length Pten protein (Figure 2A, Figure S4D). Equal numbers of dissociated single mESCs were used to generate mouse organoids, following an adapted protocol that utilizes similar media and culturing method as that for human organoids (Eiraku et al., 2008; Lancaster et al., 2013). Compared to controls, Pten mutant mouse organoids became progressively larger, but remained smooth throughout development with no surface folds (Figure 2B–2C, Figure S4F). Imaging using a light sheet fluorescent microscope and subsequent quantification demonstrated that Pten mutant mouse organoids had increased overall volume but no change in sphericity compared to controls (Figure 2D–2E). No detectable change in fold density was present in Pten mutant mouse organoids (Figure 2F).
Figure 2. Lack of folding in Pten mutant mouse cerebral organoids.

A) Immuno-blotting shows a complete ablation of wild-type Pten protein in V6.5 mutant mouse ESCs.
B-C) Bright field and light sheet images of control and Pten mutant mouse organoids at 4 days, 4 weeks and 8 weeks. Scale bar, 200um (upper panels in B), 500um (lower panels in B, C).
D-F) Quantification of volume, sphericity and fold density on control and Pten mutant mouse organoids at 4 weeks.
Results are mean +/− SEM. *p<0.05. See also Figure S4.
PTEN deletion expands the progenitor pool
We investigated the cellular organizations that underlie the expansion and folding of the PTEN mutant human cerebral organoids. At 4 weeks, both control and mutant human organoids were comprised of units of continuous neuroepithelium as revealed by Nestin staining. PTEN mutants contained an array of large and sometimes folded neuroepithelial structures (Figure 3A), which expressed NP markers such as Nestin, Pax6 and Sox2 (Figure 3B–2C). Because the original organoid culture condition provides minimal patterning cues and relies on the intrinsic capacity of hESCs to differentiate into the neural lineage, the majority of the organoids adopt a forebrain identity as shown by their expression of Pax6 (Figure 3B) and FoxG1 (Figure 7G), but markers of other brain regions can also be observed (Figure S4G). To examine if organoid expansion and folding can occur from a brain region specific cellular population, we pre-patterned the EBs specifically towards the dorsal forebrain fate (Li et al., 2013). Treatment with dorsomorphin during the first 7 or 14 days of culture promoted the generation of dorsal forebrain identity and suppressed markers of other lineages (Figure 3E–3F, Figure S4H–S4I). At 6 weeks, pre-patterned control forebrain organoids grew to similar shape and size as un-patterned organoids. Likewise, pre-patterned PTEN mutant human forebrain organoids grew larger than controls, and developed complex surface folds (Figure 3D, 3G, Figure S4J).
Figure 3. PTEN deletion induces expansion and folding of forebrain neuroepithelia in human cerebral organoids.

A-C) Immuno-staining for NPs using antibodies against Nestin (A), Pax6 (B), and Sox2 (C) in control and mutant WIBR3 organoids at 4 weeks. Scale bars, 50um (A-B) and 20um (C).
D-G) Light sheet images and quantification of control and mutant WIBR3 organoids treated with dorsomorphin for 14 days, demonstrating expansion and folding (D), increased folds density (G), patterning towards the forebrain fate (E) at the preclusion of none forebrain lineages (F).
Results are mean +/− SEM. **p<0.01, ***p<0.001. See also Figure S4.
Figure 7. ZIKV infection impairs expansion and folding in human cerebral organoids.

A-B) Schematic diagram and light sheet images of PTEN mutant WIBR3 cerebral organoids at day 23 (19+4 days) showing widespread caspase activity induced by ZIKV but not Dengue virus. Scale bar, 500um.
C) Light sheet images and immuno-staining of mutant WIBR3 organoids at day 29 (19+10 days) shows reduced organoid size and increased apoptosis caused by ZIKV but not Dengue virus. C-caspase 3, cleaved-caspase 3 as detected by immuno-staining. Scale bars, 500um (upper) and 50um (lower).
D-E) Quantitative analysis of organoid at day 29 (19+10 days) shows reduced size (D) and loss of surface folds density (E) upon ZIKV exposure.
F-G) Schematic diagram, and representative images of immuno-staining for ZIKV infected control and mutant WIBR3 organoids at day 34 (30+4 days). Scale bar, 200um.
H-I) Representative images of immuno-staining in mutant WIBR3 organoids show ZIKV infection coincides with elevated apoptosis (cleaved-caspase 3) and reduced proliferation (phosphorylated-H3). Scale bars, 50um.
J) Light sheet images show mutant WIBR3 organoids treated with ZIKV at day 30 displayed widespread apoptosis, as revealed by whole-mount caspase activity staining. Scale bar, 500um.
Results are mean +/− SEM. ***p<0.001.
Both control and mutant human organoids contained neuroepithelia organized in a stereotypic manner reminiscent of the early developing cortex, where Ki67+ NPs proliferated at the apical surface of the ventricular zone (Figure 4A). Compared to controls, PTEN mutant human organoids harbored significantly more Ki67+ cells at multiple developmental time points (Figure 4A–4B), further confirmed by qRT-PCR (Figure S5A). Increased proliferation was also observed in PTEN mutant organoids derived from WIBR1 and WIBR2 hESCs (Figure S5B–S5D). The enhanced proliferation was prolonged and most prominent at 4–8 weeks, and declined over time with both control and mutant displaying minimal mitotic activity at 24 weeks (Figure S5A). To investigate the correlation of proliferation and the physical bending of the developing neuroepithelium in PTEN mutant human organoids, we measured the distribution of Ki67+ dividing cells relative to their position. We found that areas of the neuroepithelium with outward curvature contained significantly higher proportion of proliferating cells, compared to un-curved areas (Figure S5E–S5F). This is consistent with the notion that differential proliferation can propel physical buckling and the formation of curved structure (Kriegstein et al., 2006). Lastly, we found comparable number and distribution of apoptotic cells within the VZ of control and PTEN mutant human organoids (Figure S5G–S5H).
Figure 4. PTEN deletion enhances proliferation and expands the NP pool.

A-B) Representative images and quantification of Ki67 immuno-staining in control and PTEN mutant WIBR3 cerebral organoids. Scale bar, 20um.
C-E) Quantitative RT-PCR analysis of radial glial marker Pax6 (C), intermediate progenitor marker Tbr2 (D), and outer radial glia marker Hopx (E) demonstrates their temporal-specific over-expression in PTEN mutant WIBR3 organoids compared to controls.
F) Immuno-staining for Pax6 and Tbr2 shows increased number of positive cells in PTEN mutant WIBR3 organoids.
G-I) Representative images of the expanded neuroepithelium in 12-week-old control and PTEN mutant WIBR3 organoids stained with Sox2 and outer radial glia marker Hopx. Quantification was conducted by measuring and dividing the entire span of the neuroepithelium into 5 equal portions (bins), showing significantly more Sox2+ (H) and Hopx+ cells (I) in PTEN mutant WIBR3 organoids in the expanded neuroepithelium. Scale bar, 100um.
J-K) Representative images of Sox2, Hopx, Ki67 co-staining in a PTEN mutant WIBR3 organoid (J), and quantification showing increased proliferation of VZ/iSVZ as well as oSVZ NPs in PTEN mutants compared to controls.
L) Total neuroepithelial thickness at 8 and 12 weeks in control and PTEN mutant WIBR3 organoids.
M-N) Representative images and quantification of Ki67 immuno-staining in control and Pten mutant mouse cerebral organoids. Scale bar, 20um.
O) Immuno-staining for NP marker Sox2, outer radial glia marker Hopx, and neuronal marker Ctip2 in 3-week-old control and Pten mutant mouse organoids, showing lack of Hopx immuno-positivity. Scale bar, 20um.
Results are mean +/− SEM. *p<0.05, **p<0.01, ***p<0.001. See also Figure S5.
In PTEN mutant human organoids, the increase in proliferation coincided with an expansion of the NP pool, shown by qRT-PCR for radial glia and intermediate progenitor markers PAX6, ARHGAP11B (Florio et al., 2015) and TBR2 (Figure 4C–4D, Figure S5I), and immuno-staining for PAX6, SOX2 and TBR2 (Figure 4F–4G). Consistent with previous observations, a population of Sox2+ NPs detach from the apical VZ in both control and mutants, coinciding with the presence of outer radial glia marker HOPX (Figure 4G and 4J). Mutant human organoids harbored significantly more HOPX+ outer radial glial cells, where they dispersed into the expanded neuroepithelium in the radial direction (Figure 4G–4I, Figure S5J). Increased abundance of HOPX expression in PTEN mutant human organoids was further confirmed by qRT-PCR (Figure 4E). Higher proportion of the VZ and outer SVZ progenitors co-labeled with Ki67 in mutant organoids (Figure 4J–4K). Lastly, PTEN mutant human organoids at 12 weeks had increased thickness of cortical neuroepithelium, further supporting the observation of a radial expansion (Figure 4L). These findings demonstrate that PTEN ablation led to expansion of the human NP pool in both VZ and SVZ.
In contrast to PTEN mutant human organoids, Pten mutant mouse organoids, which were morphologically smooth, displayed a transient elevation of proliferation over controls, but only within a narrow developmental window (Figure 4M–4N, Figure S5K). This restricted proliferative capacity of mouse NPs coincides with the smaller steady-state sizes of the mouse organoids compared to human organoids (Figure 1I and2D). HOPX immuno-positivity was absent in mouse organoids (Figure 4O). Together, these findings highlight intrinsic disparities between mouse and human NPs in proliferation potential and cellular composition.
PTEN deletion elicits a transient delay in neuronal differentiation
A hallmark difference between primate and rodent cortical development is the duration of proliferation, with primate NPs undergoing many more rounds of cell division prior to committing to terminal differentiation (Kornack and Rakic, 1998). We investigated whether the increased proliferation in PTEN mutant human organoids was coupled with changes in differentiation propensity. At 4 weeks neuronal differentiation was initiated in control organoids and DCX+ neurons began to emerge (Figure 5A). In contrast, mutant organoids contained predominantly Nestin+ NPs with few neurons (Figure 5A). qRT-PCR and immuno-blotting confirmed mutant organoids had significantly reduced DCX RNA and protein (Figure S6A–S6C). EdU pulse-chase experiment on 4-week-old organoids showed mutants had significantly less cell cycle exit after 24 hours (Figure 5B–5C). A majority of EdU+ cells in mutant organoids were Sox2+ NPs in contrast to controls where a substantial fraction had become DCX+ (Figure 5D–5F). Similar finding of delayed neuronal differentiation was seen in PTEN mutant human organoids on the WIBR1 and WIBR2 background (Figure S6D). In contrast, DCX+ or Ctip2+ neurons were already abundantly present in 3-week-old mouse control and Pten mutant organoids (Figure 4N and Figure S6E).
Figure 5. Transient delay in neuronal differentiation expands the NP pool.

A) Immuno-staining for DCX and Nestin at 4 weeks in control and PTEN mutant WIBR3 cerebral organoids. Scale bar, 200um.
B-C) Representative images of EdU-Ki67 co-staining in 4-week-old control and mutant WIBR3 organoids (B), and quantification of cell cycle exit ratio (EdU+Ki67-/all EdU+, C) in 4 and 6 weeks old organoids. Scale bars, 20um.
D) Immuno-staining for DCX and EdU in 4-week-old control and mutant WIBR3 organoids. Scale bars, 20um.
E-F) Quantitative cell fate analysis of EdU+ cells in 4-week-old organoids, showing PTEN mutants have increased retention as Sox2+ NP (E) and decreased propensity for differentiation into DCX+ immature neurons (F).
G-H) Immuno-staining for DCX and Nestin at 8 weeks. Scale bar, 200um.
I-K) Differential gene expression analyses by quantitative RT-PCR on control and mutant WIBR3 organoids at 4, 10 and 16 weeks. Genes analyzed are representative of NPs (PAX6, TBR2, HOPX), pan-neuronal markers (TUBB3, DCX, MAP2, RBFOX3), early-born neurons (CTIP2, TBR1) and late-born neurons (BRN2, SATB2, CUX1, CUX2). Majority of neuronal markers were transiently down-regulated in PTEN mutants at 4 weeks, but greatly normalized at 16 weeks. Gene expressions are normalized to control-1 at each time point. P value reflects controls vs. mutants.
L-N) Immuno-staining for markers of outer radial glia (Hopx), early-born neurons (Tbr1 and Ctip2) and late-born neurons (Satb2 and Brn2) in control and mutant WIBR3 organoids at 12 weeks. Scale bars, 50um.
O) PTEN mutant WIBR3 organoids had folded cortical plate at 16 weeks. Images show immuno-staining for markers of neurons (Ctip2) and astrocytes (GFAP). White dash lines outline the cortical surface. Scale bars, 50um.
Results are mean +/− SEM. *p<0.05, **p<0.01, ***p<0.001. See also Figure S6.
This delay in neuronal differentiation in PTEN mutant human organoids was transient and gradually normalized. At 8 weeks, abundant DCX+ neurons were present, and the majority of cells labeled with EdU at 4 weeks had assumed a neuronal phenotype in both controls and mutants (Figure 5G–5H, Figure S6F and S6H). A small population of EdU+ cells co-expressed HOPX and resided in the outer SVZ, suggesting their identity as outer radial glia (Figure S6G and S6I). Transcriptional analysis of a panel of genes enriched in NPs and neurons demonstrated reduced expression of neuronal markers in mutants at 4 weeks but normalized expression over time at 10 and 16 weeks (Figure 5I–5K). At 12 weeks, both control and mutant human organoids harbored outer radial glia cells, early and late-born neurons that were organized in rudimentary inside-out pattern (Figure 5L–5N). In mature control and mutant human organoids, differentiated neuronal cell types were predominant, and the level of proliferation was diminished (Figure 5K and Figure S5A). At these ages, PTEN mutant organoids sustained a folded morphology, underlined by the presence of folded cortical plates composed of differentiated neurons and glia (Figure 5O). We conclude that a transient delay in differentiation allowed amplification of the NP pool and contributed to the expansion and folding of the PTEN mutant human organoids.
AKT activation mediates the expansion and folding of PTEN mutant human cerebral organoids
To confirm that PTEN deficiency was responsible for the phenotypes we transduced mutant hESCs with a lentivirus vector encoding GFP or a PTEN-GFP fusion protein (Figure 6A–6B) and generated organoids. At 6 weeks, while GFP-transduced mutant human organoids were expanded and folded, PTEN-GFP transduced mutants formed smooth organoids (Figure 6C, Figure S7A), and showed normalized level of proliferation and neuronal differentiation (Figure S7B–S7D).
Figure 6. PTEN-AKT signaling controls expansion and folding in human cerebral organoids.

A) Schematic overview depicting the strategy to rescue PTEN mutant WIBR3 hESCs via lentivirus re-expression of PTEN.
B) Immuno-blotting for PTEN shows the presence of PTEN-GFP fusion protein in rescued PTEN mutant WIBR3 hESCs.
C) Light sheet images of Hoechst-stained WIBR3 organoids at 6 weeks generated from control, PTEN mutant, and PTEN-rescued hESCs. Scale bar, 500um.
D) Immuno-staining images of pAKT and Nestin, in control and mutant WIBR3 organoids. Increased pAKT immuno-staining is present in mutants at 1.5 weeks, prior to the onset of expansion and folding (upper panels). Increased pAKT signal concentrates in the Nestin+ NPs, and is highest at the apical surface. Scale bars, 100um (top panels), 20um (middle and lower panels).
E) Light sheet images of control and mutant WIBR3 organoids at 6 weeks, treated with AKT inhibitors GDC-0068 (1uM) or MK-2206 (100nM). Scale bar, 500um.
F) Differential gene expression analyses by quantitative RT-PCR on control and mutant WIBR3 organoids, treated with AKT inhibitors GDC-0068 (1uM) or MK-2206 (100nM). Gene expressions are normalized to control-1. P value reflects controls vs. AKT inhibitor treated mutants.
G) Light sheet images of 6-week-old human organoids generated from PTEN mutant WIBR3 alone, or transduced with lentivirus encoding DN-AKT or CA-AKT. Scale bars, 500um.
H) Quantitative analysis of the density of surface folds in 6-week-old organoids from PTEN mutant alone, or PTEN mutant transduced with DN-AKT or CA-AKT.
I-J) Representative images and quantification of Ki67 immuno-staining in 6-week-old organoids from PTEN mutant alone, or PTEN mutant transduced with DN-AKT or CAAKT. Scale bar, 20um.
Results are mean +/− SEM. *p<0.05, ***p<0.001. See also Figure S7.
AKT activation is a well-documented downstream effect of PTEN deletion (Worby and Dixon, 2014). Both PTEN and AKT (1–3) are expressed in the developing human cortex (Figure S1H and S7E). In control human organoids, phospho-AKT (pAKT) can be detected albeit at relatively low level (Figure S7F and S7H). PTEN deletion led to significant up-regulation of pAKT (Figure 6D and Figure S7F–S7I). In both control and mutants, pAKT-positive staining was enriched in the VZ and co-localized with progenitor markers such as Nestin, Sox2 and phospho-Vimentin (Figure 6D, Figure S7F–S7G). In mature human organoids comprised of mostly differentiated neurons, pAKT level was reduced but can still be detected with tyramide signal amplified immuno-staining as well as immuno-blotting (Figure S7J and S7L). In 12-week-old organoids, acute exposure to exogenous BDNF elicited rapid elevation in AKT signaling, suggesting scarcity of relevant neurotrophic factors in the culture medium may contribute to the reduced baseline pAKT activity (Figure S7K–S7L). This transient, and cell-type specific activation of AKT signaling in NPs echoed the pattern of enhanced proliferation in PTEN mutant human organoids, and strongly indicated that increased AKT signaling drove the expansion of NP pool, and consequently the expansion and folding of cortical tissue.
To directly investigate whether AKT activation was responsible for the expansion and folding phenotypes, we treated developing PTEN mutant human organoids with GDC-0068 or MK-2206, known inhibitors of AKT activation. While both inhibitors at higher concentration were deleterious for cellular growth and prevented the formation of viable EBs, lower concentrations allowed generation of mutant human organoids with comparable size and morphology as non-treated controls (Figure 6E), but blocked the formation of expanded and folded organoids, accompanied by normalized proliferation and neural marker gene expression (Figure 6E–6F, Figure S7M). Furthermore, a lentivirus-transduced dominant negative form of AKT normalized proliferation and blocked the formation of folded neuroepithelium in mutant organoids (Figure 6G–6J). In contrast, a constitutive active form of AKT further enhanced proliferation as well as the expansion of neuroepithelium to form organoids with even greater size and surface complexity than PTEN mutant alone (Figure 6G–6J). These findings demonstrate that AKT signaling exerts an essential, tunable control on the expansion and folding of cortical neuroepithelium.
ZIKV infection impairs expansion and folding in PTEN mutant cerebral organoids
The generation of cerebral organoids with more complex, human-like structures enhances our ability to model brain malformation due to genetic or environmental causes. To that end, we applied our 3D culture system to study the consequence of ZIKV infection. Although the underlying mechanism remains to be elucidated, the recent outbreak of ZIKV in Central and South America is associated with severe teratogenic consequences. Accumulating evidence indicates that affected fetus and newborns display a plethora of neurological abnormalities, including microcephaly, lissencephaly, pachygyria and cortical atrophy (Hazin et al., 2016). While recent studies in 2D and 3D human neural cultures have demonstrated the tropism of ZIKV towards NPs and its impact on organoid formation (Cugola et al., 2016; Garcez et al., 2016; Onorati et al., 2016; Qian et al., 2016; Tang et al., 2016), none utilized a 3D culture system that mimics key developmental features of the human cortex such as expansion and surface folding.
ZIKV exposure during early pregnancy is correlated with risks of major brain malformation such as microcephaly and lissencephaly. In organoids, ZIKV infection at the onset of surface folding (day 19) leads to widespread initiation of apoptosis (Figure 7A–7B). At 10 days post infection, ZIKV severely hampered organoid growth both in size and surface folding (Figure 7C–7E). Cellular analysis revealed broad detection of viral envelope protein in infected organoids, coinciding with marker of apoptosis (Figure 7C). In contrast, infection with equal amount of Dengue virus did not trigger increased apoptosis or broad viral amplification (Figure 7B–7C). Therefore ZIKV exposure at this early stage severely disrupted organoid expansion and folding formation. We next examined the impact of ZIKV on 4-week-old organoids, when neuronal differentiation is initiated in control organoids and delayed in mutants (Figure 5A). While a low amount of ZIKV led to partial infection of control organoids at this stage, PTEN mutant organoids displayed markedly increased susceptibility to infection (Figure 7F–7G). Regions of organoid expansion and folding were amply infected with ZIKV (Figure 7G) and correlated with increased apoptosis (Figure 7H) and decreased proliferation (Figure 7I). Staining for activated caspase on whole mutant organoids further demonstrate global increase of apoptosis 4 days after ZIKV exposure (Figure 7J). Together, these findings demonstrate the profound consequences of ZIKV exposure during early neural development on the expansion and folding of the developing cortex in vitro, and illustrate the strength of the genetically modified cerebral organoids system in modeling complex structural malformations of the developing human brain.
Discussion
Efforts in the investigation of human brain development have been hindered by a lack of access to the fetal human brain. Given the substantial species difference between human and the currently available model organisms pertinent to cortical morphology and function, it is essential to develop an alternative, in vitro system that recapitulates key features of human cortical formation. Here, using a genetically modified cerebral organoid system, we address the direct consequences of increased proliferation in human cortical development. Compared to control organoids, PTEN mutant human organoids develop markedly expanded VZ/SVZ, increased overall size, and a larger surface area organized into continuous cortical folds. This in vitro expansion is triggered by increased proliferation, transiently delayed neuronal differentiation and thereby an amplified overall NP population. Such amplification abides by the cellular and anatomical identity of the human developing cortex, results in greater number of NPs first in the VZ and subsequently in the outer SVZ. In PTEN mutant human organoids, the genetically modified neural tissue expands tangentially to generate longer sheets of neuroepithelium, and radially to form thicker neuroepithelium. Such modes of in vitro structural expansion are consistent with the radial unit hypothesis of neocortical expansion (Rakic, 1988) suggesting that increased proliferation contributes to folding. We envision future work to incorporate spatial and temporal-specific control of the PTEN-AKT signaling pathway to drive NP proliferation in an inducible and reversible manner, allowing the precise dissection of the contribution of tangential and radial expansion to cortical expansion and folding.
The comparison of mouse and human organoids revealed a marked species difference in their capacity of developing expanded and folded neural tissues. In contrast to the drastic effects of PTEN deletion in human organoids, Pten mutant mouse organoids grew larger but did not form surface folds, coinciding with a short window of enhanced proliferation and a lack of outer SVZ. The smooth appearance of mouse Pten mutant organoids echoes the lack of cortical folding in Pten mutant mouse brains, further indicating that features inherent to human NPs, such as the capacity of prolonged period of proliferation and the generation of an outer radial glia population, may underlie human-specific cortical tissue expansion and folding. Recent studies in mouse demonstrated that over-expression of ARHGAP11B, a human-specific gene enriched in the NPs of the developing cortex, can endow mouse NPs with enhanced proliferation, leading to the emergence of cortical folding (Florio et al., 2015). These findings raise the possibility that further genetic engineering may shed light on the mechanism and plasticity of mouse and human cortical development.
Our study highlights the essential role for the PTEN-AKT signaling pathway in regulating human neural development. Gain and loss-of-function mutations of genes in this pathway have been reported in patients with major brain malformation (Boland et al., 2007; DiLiberti, 1998; Juanes et al., 2015; Lee et al., 2012; Marchese et al., 2014; Mirzaa et al., 2013; Poduri et al., 2012; Riviere et al., 2012; Terrone et al., 2016), suggesting a precise level of AKT activity is pivotal to brain formation. Our study in human organoids demonstrates that AKT activity is enriched in the NP population in both control and mutants. Inhibition of AKT activity via pharmacological or genetic means results in smaller sized organoids, reminiscent of microcephaly in patients with AKT heterozygous loss-of-function mutation (Boland et al., 2007). We note that, unlike NPs, PTEN mutant mature neurons within the organoids display less AKT activity. Acute stimulation with BDNF was sufficient to increase AKT activity, suggesting the reduced basal AKT activity may stem from the lack of neurotrophic growth factors in the current culture system. Future investigation on the effects of AKT activation in response to various trophic factors in mature human neurons could provide novel insight into normal and pathological neural functions. Another limitation of the current culture system is that it inadequately reflects human fetal brain development, as it does not support the formation of folded non-mutant human cerebral organoids. This is not surprising considering its historical origin from the minimal culture media aimed at supporting the survival and differentiation of mouse NPs and EBs (Eiraku et al., 2008). We found that activating the PTEN-AKT pathway, a central signaling cascade downstream of various growth factors, is sufficient to induce folding. Interestingly, embedding in extracellular matrix (matrigel) rich in growth factors spurs a rapid yet transient phase of growth in both wild-type and mutant human organoids. Thus, it is likely that a combination of physiologically relevant growth factors could induce folding also in wild-type human organoids. Further microfluidic and microfabrication designs can be implemented to improve oxygen and nutrient exchange, maintain tissue health and homeostasis, and provide more faithful recapitulation of the in vivo developmental process.
In the current study, we utilized an isogenic genetic system to demonstrate that the cerebral organoid system allows experimental manipulation of distinct, isolated driving forces of cortical development such as proliferation. This experimental framework can be broadly utilized to model other genetic and environmental factors that determine the size and shape of a developing human cortex, and explore pathological cortical formation such as microcephaly, macrocephaly, polymicrogyria, lissencephaly and double cortex syndrome. We used this system to model microcephaly and lissencephaly resulting from ZIKV exposure. Our findings revealed major organoid growth and folding defects due to ZIKV but not Dengue virus exposure, indicating strong pathological difference between these two closely related Flaviviruses.
STAR METHODS
CONTACT FOR REAGENT AND RESOURCE SHARING
Further information and requests for reagents may be directed to, and will be fulfilled by the corresponding author, Dr. Rudolf Jaenisch (jaenisch@wi.mit.edu).
EXPERIMENTAL MODEL AND SUBJECT DETAILS
ESC culture
HESC line WIBR1, WIBR2 and WIBR3 were previously described (Lengner et al., 2010; Li et al., 2013) and cultured in 5% O2 on mitomycin C-inactivated mouse embryonic fibroblasts (MEFs) in hESC medium, containing DMEM/F12 (Invitrogen), 15% fetal bovine serum (Hyclone), 5% knockout serum replacement (Invitrogen), 1% non-essential amino acids (Invitrogen), 1mM glutamine (Invitrogen), 0.1mM bmercaptoethanol (Sigma) and 4ng/ml bFGF (R&D Systems). Cultures were passaged manually or with 1mg/ml collagenase type IV (Invitrogen) every 5–7 days. Mouse ESC line V6.5 was expanded on MEFs using mESC medium containing fetal bovine serum and leukemia inhibitory factor as previously reported (Stelzer et al., 2015).
METHOD DETAILS
Neural differentiation
Differentiation of hESCs to NPs in 2D adherent culture was performed as previously described (Li et al., 2013). Confluent hESCs were passaged onto matrigel-coated dishes using collagenase type IV, and cultured in mTeSR medium (Stem Cell Technologies) containing dorsomorphin (2.5uM, Stemgent) for 1–3 days until near confluent. To induce neural differentiation, increasing amounts of N2 media (25, 50, 75, 100%) were added to the mTeSR medium every other day whilst maintaining 2.5uM dorsomorphin. N2 medium contains 1X N2 supplement (Invitrogen), 50% DMEM/F12, 50% Neurobasal, 0.075% Bovine serum albumin, and 2mM GlutaMAX (Life Technologies). Cells were subsequently passaged with trypsin and cultured on matrigel-coated dishes in N2 media with the addition of 20ng/ml bFGF. Rho-associated protein kinase (ROCK) inhibitor Y27632 (10uM, Stemgent) was added to the medium for the first 24 hours. NPs were expanded and maintained in N2 medium with 20ng/ml bFGF. All 2D culture experiments were performed on WIBR3-derived NPs unless otherwise specified.
CRISPR/Cas9 gRNA design
To generate gRNA expression vector, annealed oligonucleotides for the human or mouse PTEN exon 1 locus were ligated into the BbsI restriction site of a modified pX330 vector containing a CMV-EGFP cassette. The gRNA sequence for human PTEN was 5’-aaacaaaaggagatatcaag-3’, which contains an EcoRV restriction site. The gRNA sequence for mouse Pten was 5’-agatcgttagcagaaacaaaagg-3’. To evaluate the targeting efficiency of human PTEN gene, the CRISPR/Cas9 construct was transiently transfected into HEK293 cells, and PCR fragment was generated from genomic DNA with followed by EcoRV restriction digest to evaluate targeting efficiency, using primers described in Table S2. Cel-1 assay was used to evaluate the efficiency of gRNA towards the mouse Pten gene as previously described (Li et al., 2013).
CRISPR/Cas9-mediated genome editing of ESCs
CRISPR/Cas9-mediated genome editing in hESCs was performed as previously described with modifications (Li et al., 2013). Briefly, WIBR3 hESCs were cultured in ROCK inhibitor Y27632 (10uM) for 24 hours prior to electroporation. Cells were harvested using trypsin/EDTA solution and re-suspension in phosphate buffered saline (PBS) as single cells. Electroporation was performed using 25ug of gRNA expression vector and 25ug of PGK-puro plasmid. Cells were plated on DR4 MEFs, and cultured in hESC medium containing ROCK inhibitor Y27632 for the first 24 hours. Puromycin (2ug/ml) was added to hESC medium 48 hours after electroporation for 2 days, and culture was maintained in hESC medium until colonies emerged. Individual hESC clones were picked and expanded 14 days after electroporation. PCR on genomic DNA and EcoRV restriction digest were performed to identify candidate clones, followed by DNA sequencing. CRISPR/Cas9-mediated genome editing in mESCs was performed as previously described (Stelzer et al., 2015).
Cerebral organoid culture
Cerebral organoids were generated from WIBR3 hESCs using a previously reported protocol (Lancaster et al., 2013), with some modifications. Briefly, hESCs were dissociated from MEFs using collagenase type IV, and further separated from residual MEFs by gravity separation, before trypsinization of hESC colonies to generate single cells. A total of 9000 cells were then plated into each well of an ultra-low-attachment 96-well plate (Corning) to form single EBs, in medium containing DMEM/F12, 20% KSR, 3% fetal bovine serum, 2mM GlutaMAX, 1% non-essential amino acids, 50nM bmercaptoethanol and 4ng/ml bFGF. ROCK inhibitor Y27632 (50uM) was included in the first 24 hours. EBs were maintained in 96-well plates for 6 days, then transferred to ultra-low-attachment 24-well plates (Corning), in neural induction medium containing DMEM/F12, 1X N2 supplement, 1% non-essential amino acids, 2mM GlutaMAX and 1ug/ml heparin (Stem Cell Technologies). On days 10–12, EBs were embedded in droplets of matrigel, and were allowed to gel at 37C. Embedded EBs were subsequently cultured in neural maturation medium containing 50% DMEM/F12, 50% Neurobasal, 0.5X N2 supplement, 0.5X B27 supplement, 2mM GlutaMAX, 2.5ng/ml human insulin, 0.5% non-essential amino acids, and 25nM b-mercaptoethanol. Droplets were cultured in stationary condition in 6cm suspension dishes for 4 days, followed by transfer to an orbital shaker (Unimax-1010, Heidolph Brinkmann) rotating continuously at 80rpm. Mouse cerebral organoids were generated as previously described(Lancaster et al., 2013). Multiple independent experiments were performed to generate cerebral organoids from WIBR1 (n=3), WIBR2 (n=3), WIBR3 (n>15) and V6.5 (n=3). Each experiment generates 24–96 individual organoids of each condition (genotype and treatment). Various concentrations of AKT inhibitors GDC-0068 (Selleckchem) or MK-2206 (Selleckchem) were added to growth medium for EBs on day 1. To pre-pattern organois towards the dorsal forebrain fate, 2.5uM dorsomorphin was added to the culture on day 0 for 7 or 14 days. To stimulate phospho-AKT in 12-week organoids, BDNF (100ng/ml, Peprotech) was added for 30 minutes. All human cerebral organoid experiments were performed on WIBR3-derived control and mutant lines unless otherwise specified.
Lentivirus production and transduction
FUW-GFP, FUW-GFP-PTEN lentivirus constructs were previously reported (Fricano et al., 2014). DN-AKT and CA-AKT cDNA were subcloned into FUW-GFP vector to generate the FUW-DN-AKT and FUW-CA-AKT lentivirus constructs. VSVG-coated lentiviruses were generated in HEK293 cells. Briefly, HEK293 cells were transfected using X-tremeGENE 9 (Sigma), with a mixture of lentiviral construct and second-generation packaging plasmids. Culture medium was changed 12 hours after and collected 96 hours after transfection. Virus-containing medium was filtered through 0.45um filter and concentrated via ultracentrifugation. To transduce hESCs with lentivirus, hESCs cultured on MEFs were first dissociated from MEFs using collagenase type IV, and further dissociated using Trypsin/EDTA to generate single cells. hESCs were plated onto matrigel-coated dishes and fed mTeSR medium containing 10uM ROCK inhibitor Y27632, and lentivirus particles. hESCs were subsequently passaged as single cells at clonal density to MEFs, and single clones were manually picked and expanded. Expression of lentiviral-transgenes was evaluated using GFP fluorescent, quantitative RT-PCR and immuno-blotting.
ZIKV and Dengue virus production and infection
ZIKV strain MR766 was obtained from ATCC and expanded in Vero cells. Dengue virus serotype 2 strain 16681 was expanded in C3/36 mosquito cells. To establish titered viral stocks, virus-containing cell supernatants were harvested, and viral titer was determined by infecting Vero cells, followed by quantitative flow cytometry analysis of Flavivirus envelope immuno-staining (Lambeth et al., 2005) to calculate Vero cell infectious units. To infect cerebral organoids, the number of cells on the surface was estimated from the diameter of the 3D organoid and was used to calculate the amount of virus applied. An MOI of 1 based on Vero cell infectious units was used for all experiments for ZIKV and Dengue virus (actual MOI for the entire organoid was greatly less than 0.01). ZIKV or Dengue virus was added to culture medium and replaced with fresh medium 24 hours later. Organoids were analyzed 4 or 10 days post-infection.
ATP assay
Cell growth rate was measured using an ATP assay with the CellTiter-Glo Luminescent kit according to the manufacturer’s instructions (Promega). NPs were plated in matrigel-coated 96-well plates (black wall, clear bottom, Falcon) at 20,000 cells per well, in the presence or absence of bFGF (0–20ng/ml), PDGF-DD (0–10ng/ml) or IGF2 (0–10ng/ml). ATP assay was performed on day 1 and day 3. Luminescence was recorded on a Tecan microplate reader.
EdU click-it assay
EdU (10uM, Life Technologies) was added to N2 medium for NPs, or neural maturation medium for cerebral organoids for 2 hours, after which cells or tissues were collected immediately, or washed with PBS and fed fresh medium until collection. N2 medium contained 1 or 20ng/ml of bFGF. EdU click-it assay was performed on fixed cells or tissue sections per manufacture’s instruction (Invitrogen), followed by immuno-staining.
Histology and imaging
Cells and tissues were fixed with 4% (w/v) paraformaldehyde in PBS. Frozen or paraffin sections were prepared from tissues (EBs and organoids). Following membrane permeabilization with PBS containing 0.3% triton, cells and tissue sections were blocked with 3% normal donkey serum. Primary antibodies were against Brn2, Cleaved-caspase 3, Ctip2, Doublecortin, Flavivirus, FoxA2, FoxG1, GFAP, phospho-H3, HOPX, Ki67, Nkx2.2, NeuN, Nestin, PAX6, phospho-AKT, Satb2, Sox2, Tau, Tbr1, Tbr2, TH, phospho-Vimentin, and visualized by secondary antibodies conjugated with Alexa 488, 568, 594, 647 (Life Technologies), followed by counter-staining with DAPI. Detailed antibody information is described in Table S1. Tyramide Signal Amplification was performed using TSA Plus Cyanine 3 System per manufacturer’s instruction (Perkin Elmer). Detection of activated caspase 3/7 in live organoids was performed using a CellEvent Caspase-3/7 Green Detection Reagent (ThermoFisher). Fluorescent images of immuno-staining were captured on a Zeiss LSM-700 confocal microscope. Light-sheet fluorescent microscopy was performed on Hoechst-stained organoids using a Zeiss Z.1 Lightsheet microscope. Reconstruction of multi-view light sheet images was performed using ZEN (Zeiss) and Imaris (Bitplane) softwares. Quantification of volume, surface area and sphericity were performed using Imaris. Alternatively, stereological quantification was performed on every 5 section of organoids, stained with DAPI. The area of the organoid and the length of the outline were measured to calculate volume and surface area. A Canny Edge Detection plugin of ImageJ was used to measure folds density in images of Hoechst-stained organoids, some were manually stitched from multiple images.
RNA extraction, reverse transcription and quantitative PCR
Cells and tissues were homogenized and total RNA extracted using the RNeasy kit (Qiagen) following manufacturer’s instructions. Total RNA concentrations were measured using NanoDrop ND-1000 spectrophotometer. RNA was reverse transcribed into cDNA using Superscript III reverse transcriptase (Invitrogen) with random hexamer primers according. Transcript abundance was determined by quantitative PCR using SYBR Green PCR mix (Applied Biosystems), with primer pairs against ARHGAP11B, BRN2, CTIP2, CUX1, CUX2, DCX, FOXA2, HOPX, MAP2, MKI67, NKX2.2, PAX6, RBFOX3, SATB2, TBR1, TBR2, TUBB3 and GAPDH. Primer sequences are described in Table S2. Raw Ct values were normalized to GAPDH. Heatmap visualization of quantitative PCR results was generated using gene-E software.
Protein purification and immuno-blotting
Total protein was extracted from cells and tissues using RIPA lysis buffer (Millipore) containing 50mM Tris-HCL pH 7.4, 150mM NaCL, 0.25% deoxycholic acid 1% NP-40, 1mM EDTA, protease inhibitor cocktail (Roche), phosphotase inhibitor cocktail 2 and 3 (Sigma). Total protein from the supernatant was measured using BCA protein assay (Pierce). Primary antibodies were against Actin, PTEN, phospho-AKT, AKT, and visualized with HRP-conjugated secondary antibodies, followed by LumiGlo Chemiluminescent Kit (KPL) in accordance with the manufacturer’s instructions. Detailed antibody information is described in Table S1. Membranes blotted for phospho-proteins were stripped and re-probed with antibodies against total proteins. Quantification of band intensity was performed using ImageJ. Values for phospho-proteins were normalized to total proteins, and all others were normalized to Actin.
Analysis of BrainSpan data
Gene expression data was obtained from the BrainSpan Prenatal LMD Microarray database, which contains transcriptional profiling of ~300 distinct brain regions from human prenatal brain. Expression levels of genes of interest at week 15–16 were aggregated according to top-level structure designation, and plotted based on z-scores.
QUANTIFICATION AND STATISTICAL ANALYSIS
All data values were presented as mean +/− SEM. Student’s t tests were applied to data with two groups. ANOVA analyses were used for comparisons of data with greater than two groups. Post hoc group comparisons were performed with Bonferroni test. A value of p<0.05 was considered significant.
Supplementary Material
KEY RESOURCES TABLE
| REAGENT or RESOURCE | SOURCE | IDENTIFIER |
|---|---|---|
| Antibodies | ||
| See Table S1 | This study | N/A |
| Chemicals, Peptides, and Recombinant Proteins | ||
| Dorsomorphin | Stemgent | 04–0024 |
| GDC-0068 | Selleckchem | S2808 |
| MK-2206 | Selleckchem | S1078 |
| Critical Commercial Assays | ||
| CellTiter-Glo Luminescent Cell Viability Assay | Promega | G7571 |
| CellEvent Caspase-3/7 Green Detection Reagent | Invitrogen | C10423 |
| Click-iT EdU Imaging Kit | Invitrogen | C10337 |
| TSA Plus Cyanine 3 System | Perkin Elmer | NEL744001KT |
| Experimental Models: Cell Lines | ||
| Human: WIBR1/2/3 hESCs | (Lengner et al., 2010) | N/A |
| Human: WIBR1/2/3 PTEN mutant hESCs | This study | N/A |
| Mouse: V6.5 mESCs | (Stelzer et al., 2015) | N/A |
| Mouse: V6.5 Pten mutant mESCs | This study | N/A |
| Sequence-Based Reagents | ||
| Primers: see Table S2 | This study | N/A |
Highlights.
PTEN deletion enhances human NPs proliferation and sensitivity to growth factors
PTEN mutant human, but not mouse, cerebral organoids display surface folding
Folded human organoids contain expanded ventricular and outer progenitors
Zika virus impairs the formation of expanded and folded human cerebral organoids
Acknowledgements
The authors thank Dongdong Fu, Raaji Alagappan, Tenzin Lungjangwa, Sean Corcoran, Laure Freland, and Grisilda Bakiasi for technical support, Danielle Feldman and members of the Jaenisch lab for helpful discussions. We thank Magdalena Renner for advice on cerebral organoid cultures, Wendy Salmon, Drs. Christian Cortes Campos and Ryann Fame for help with light-sheet imaging, Dr. Bryan Luikart for PTEN-GFP plasmid and Dr. Michael Robinson for AKT plasmids. Y.L. received funding from a Simons Postdoctoral Fellowship, an International Rett Syndrome Foundation Postdoctoral Fellowship, and a NARSAD Young Investigator Grant from the Brain & Behavior Research Foundation. J.M. received support from the European Leukodystrophy Association, and a NARSAD Young Investigator Grant from the Brain & Behavior Research Foundation. A.O. was supported by a Jerome and Florence Brill Graduate Student Fellowship. Work in the R.J. laboratory was supported by grants from the Simons Foundation (SFARI 204106 and SFLIFE 286977), NIH grants HD 045022, R01-MH104610, R01-NS088538, the ELA foundation, the Emerald foundation, Biogen and the Simons Center for the Social Brain at MIT. Work in the L.G. laboratory was supported by NIH AI100190. R.J. is an advisor to Stemgent, a cofounder of Fate Therapeutics and Fulcrum Therapeutics.
Footnotes
Publisher's Disclaimer: This is a PDF file of an unedited manuscript that has been accepted for publication. As a service to our customers we are providing this early version of the manuscript. The manuscript will undergo copyediting, typesetting, and review of the resulting proof before it is published in its final citable form. Please note that during the production process errors may be discovered which could affect the content, and all legal disclaimers that apply to the journal pertain.
Reference
- Bae BI, Tietjen I, Atabay KD, Evrony GD, Johnson MB, Asare E, Wang PP, Murayama AY, Im K, Lisgo SN, et al. (2014). Evolutionarily dynamic alternative splicing of GPR56 regulates regional cerebral cortical patterning. Science 343, 764–768. [DOI] [PMC free article] [PubMed] [Google Scholar]
- Boland E, Clayton-Smith J, Woo VG, McKee S, Manson FD, Medne L, Zackai E, Swanson EA, Fitzpatrick D, Millen KJ, et al. (2007). Mapping of deletion and translocation breakpoints in 1q44 implicates the serine/threonine kinase AKT3 in postnatal microcephaly and agenesis of the corpus callosum. American journal of human genetics 81, 292–303. [DOI] [PMC free article] [PubMed] [Google Scholar]
- Butler MG, Dasouki MJ, Zhou XP, Talebizadeh Z, Brown M, Takahashi TN, Miles JH, Wang CH, Stratton R, Pilarski R, et al. (2005). Subset of individuals with autism spectrum disorders and extreme macrocephaly associated with germline PTEN tumour suppressor gene mutations. Journal of medical genetics 42, 318–321. [DOI] [PMC free article] [PubMed] [Google Scholar]
- Bystron I, Blakemore C, and Rakic P (2008). Development of the human cerebral cortex: Boulder Committee revisited. Nature reviews Neuroscience 9, 110–122. [DOI] [PubMed] [Google Scholar]
- Chenn A, and Walsh CA (2002). Regulation of cerebral cortical size by control of cell cycle exit in neural precursors. Science 297, 365–369. [DOI] [PubMed] [Google Scholar]
- Cugola FR, Fernandes IR, Russo FB, Freitas BC, Dias JL, Guimaraes KP, Benazzato C, Almeida N, Pignatari GC, Romero S, et al. (2016). The Brazilian Zika virus strain causes birth defects in experimental models. Nature 534, 267–271. [DOI] [PMC free article] [PubMed] [Google Scholar]
- DiLiberti JH (1998). Inherited macrocephaly-hamartoma syndromes. American journal of medical genetics 79, 284–290. [DOI] [PubMed] [Google Scholar]
- Eiraku M, Watanabe K, Matsuo-Takasaki M, Kawada M, Yonemura S, Matsumura M, Wataya T, Nishiyama A, Muguruma K, and Sasai Y (2008). Self-organized formation of polarized cortical tissues from ESCs and its active manipulation by extrinsic signals. Cell stem cell 3, 519–532. [DOI] [PubMed] [Google Scholar]
- Florio M, Albert M, Taverna E, Namba T, Brandl H, Lewitus E, Haffner C, Sykes A, Wong FK, Peters J, et al. (2015). Human-specific gene ARHGAP11B promotes basal progenitor amplification and neocortex expansion. Science 347, 1465–1470. [DOI] [PubMed] [Google Scholar]
- Garcez PP, Loiola EC, Madeiro da Costa R, Higa LM, Trindade P, Delvecchio R, Nascimento JM, Brindeiro R, Tanuri A, and Rehen SK (2016). Zika virus impairs growth in human neurospheres and brain organoids. Science 352, 816–818. [DOI] [PubMed] [Google Scholar]
- Geschwind DH, and Rakic P (2013). Cortical evolution: judge the brain by its cover. Neuron 80, 633–647. [DOI] [PMC free article] [PubMed] [Google Scholar]
- Groszer M, Erickson R, Scripture-Adams DD, Lesche R, Trumpp A, Zack JA, Kornblum HI, Liu X, and Wu H (2001). Negative regulation of neural stem/progenitor cell proliferation by the Pten tumor suppressor gene in vivo. Science 294, 2186–2189. [DOI] [PubMed] [Google Scholar]
- Hansen DV, Lui JH, Parker PR, and Kriegstein AR (2010). Neurogenic radial glia in the outer subventricular zone of human neocortex. Nature 464, 554–561. [DOI] [PubMed] [Google Scholar]
- Hazin AN, Poretti A, Turchi Martelli CM, Huisman TA, Microcephaly Epidemic Research G., Di Cavalcanti Souza Cruz D, Tenorio M, van der Linden A, Pena LJ, Brito C, et al. (2016). Computed Tomographic Findings in Microcephaly Associated with Zika Virus. The New England journal of medicine 374, 2193–2195. [DOI] [PubMed] [Google Scholar]
- Hill R, and Wu H (2009). PTEN, stem cells, and cancer stem cells. The Journal of biological chemistry 284, 11755–11759. [DOI] [PMC free article] [PubMed] [Google Scholar]
- Juanes M, Guercio G, Marino R, Berensztein E, Warman DM, Ciaccio M, Gil S, Bailez M, Rivarola MA, and Belgorosky A (2015). Three novel IGF1R mutations in microcephalic patients with prenatal and postnatal growth impairment. Clinical endocrinology 82, 704–711. [DOI] [PubMed] [Google Scholar]
- Kornack DR, and Rakic P (1998). Changes in cell-cycle kinetics during the development and evolution of primate neocortex. Proceedings of the National Academy of Sciences of the United States of America 95, 1242–1246. [DOI] [PMC free article] [PubMed] [Google Scholar]
- Kriegstein A, Noctor S, and Martinez-Cerdeno V (2006). Patterns of neural stem and progenitor cell division may underlie evolutionary cortical expansion. Nature reviews Neuroscience 7, 883–890. [DOI] [PubMed] [Google Scholar]
- Kuida K, Haydar TF, Kuan CY, Gu Y, Taya C, Karasuyama H, Su MS, Rakic P, and Flavell RA (1998). Reduced apoptosis and cytochrome c-mediated caspase activation in mice lacking caspase 9. Cell 94, 325–337. [DOI] [PubMed] [Google Scholar]
- Kuida K, Zheng TS, Na S, Kuan C, Yang D, Karasuyama H, Rakic P, and Flavell RA (1996). Decreased apoptosis in the brain and premature lethality in CPP32-deficient mice. Nature 384, 368–372. [DOI] [PubMed] [Google Scholar]
- Kwon CH, Luikart BW, Powell CM, Zhou J, Matheny SA, Zhang W, Li Y, Baker SJ, and Parada LF (2006). Pten regulates neuronal arborization and social interaction in mice. Neuron 50, 377–388. [DOI] [PMC free article] [PubMed] [Google Scholar]
- Lancaster MA, Renner M, Martin CA, Wenzel D, Bicknell LS, Hurles ME, Homfray T, Penninger JM, Jackson AP, and Knoblich JA (2013). Cerebral organoids model human brain development and microcephaly. Nature 501, 373–379. [DOI] [PMC free article] [PubMed] [Google Scholar]
- Lee JH, Huynh M, Silhavy JL, Kim S, Dixon-Salazar T, Heiberg A, Scott E, Bafna V, Hill KJ, Collazo A, et al. (2012). De novo somatic mutations in components of the PI3K-AKT3-mTOR pathway cause hemimegalencephaly. Nature genetics 44, 941–945. [DOI] [PMC free article] [PubMed] [Google Scholar]
- Lehtinen MK, Zappaterra MW, Chen X, Yang YJ, Hill AD, Lun M, Maynard T, Gonzalez D, Kim S, Ye P, et al. (2011). The cerebrospinal fluid provides a proliferative niche for neural progenitor cells. Neuron 69, 893–905. [DOI] [PMC free article] [PubMed] [Google Scholar]
- Lengner CJ, Gimelbrant AA, Erwin JA, Cheng AW, Guenther MG, Welstead GG, Alagappan R, Frampton GM, Xu P, Muffat J, et al. (2010). Derivation of pre-X inactivation human embryonic stem cells under physiological oxygen concentrations. Cell 141, 872–883. [DOI] [PubMed] [Google Scholar]
- Li Y, Wang H, Muffat J, Cheng AW, Orlando DA, Loven J, Kwok SM, Feldman DA, Bateup HS, Gao Q, et al. (2013). Global transcriptional and translational repression in human-embryonic-stem-cell-derived Rett syndrome neurons. Cell stem cell 13, 446–458. [DOI] [PMC free article] [PubMed] [Google Scholar]
- Lui JH, Hansen DV, and Kriegstein AR (2011). Development and evolution of the human neocortex. Cell 146, 18–36. [DOI] [PMC free article] [PubMed] [Google Scholar]
- Lui JH, Nowakowski TJ, Pollen AA, Javaherian A, Kriegstein AR, and Oldham MC (2014). Radial glia require PDGFD-PDGFRbeta signalling in human but not mouse neocortex. Nature 515, 264–268. [DOI] [PMC free article] [PubMed] [Google Scholar]
- Marchese M, Conti V, Valvo G, Moro F, Muratori F, Tancredi R, Santorelli FM, Guerrini R, and Sicca F (2014). Autism-epilepsy phenotype with macrocephaly suggests PTEN, but not GLIALCAM, genetic screening. BMC medical genetics 15, 26. [DOI] [PMC free article] [PubMed] [Google Scholar]
- Mirzaa GM, Riviere JB, and Dobyns WB (2013). Megalencephaly syndromes and activating mutations in the PI3K-AKT pathway: MPPH and MCAP. American journal of medical genetics Part C, Seminars in medical genetics 163C, 122–130. [DOI] [PubMed] [Google Scholar]
- Onorati M, Li Z, Liu F, Sousa AM, Nakagawa N, Li M, Dell’Anno MT, Gulden FO, Pochareddy S, Tebbenkamp AT, et al. (2016). Zika Virus Disrupts Phospho-TBK1 Localization and Mitosis in Human Neuroepithelial Stem Cells and Radial Glia. Cell reports 16, 2576–2592. [DOI] [PMC free article] [PubMed] [Google Scholar]
- Poduri A, Evrony GD, Cai X, Elhosary PC, Beroukhim R, Lehtinen MK, Hills LB, Heinzen EL, Hill A, Hill RS, et al. (2012). Somatic activation of AKT3 causes hemispheric developmental brain malformations. Neuron 74, 41–48. [DOI] [PMC free article] [PubMed] [Google Scholar]
- Qian X, Nguyen HN, Song MM, Hadiono C, Ogden SC, Hammack C, Yao B, Hamersky GR, Jacob F, Zhong C, et al. (2016). Brain-Region-Specific Organoids Using Mini-bioreactors for Modeling ZIKV Exposure. Cell 165, 1238–1254. [DOI] [PMC free article] [PubMed] [Google Scholar]
- Rakic P (1974). Neurons in rhesus monkey visual cortex: systematic relation between time of origin and eventual disposition. Science 183, 425–427. [DOI] [PubMed] [Google Scholar]
- Rakic P (1988). Specification of cerebral cortical areas. Science 241, 170–176. [DOI] [PubMed] [Google Scholar]
- Rash BG, Tomasi S, Lim HD, Suh CY, and Vaccarino FM (2013). Cortical gyrification induced by fibroblast growth factor 2 in the mouse brain. The Journal of neuroscience: the official journal of the Society for Neuroscience 33, 10802–10814. [DOI] [PMC free article] [PubMed] [Google Scholar]
- Riviere JB, Mirzaa GM, O’Roak BJ, Beddaoui M, Alcantara D, Conway RL, St-Onge J, Schwartzentruber JA, Gripp KW, Nikkel SM, et al. (2012). De novo germline and postzygotic mutations in AKT3, PIK3R2 and PIK3CA cause a spectrum of related megalencephaly syndromes. Nature genetics 44, 934–940. [DOI] [PMC free article] [PubMed] [Google Scholar]
- Sasai Y (2013) Next-generation regenerative medicine: organogenesis from stem cells in 3D culture. Cell stem cell 12, 520–530. [DOI] [PubMed] [Google Scholar]
- Stahl R, Walcher T, De Juan Romero C, Pilz GA, Cappello S, Irmler M, Sanz-Aquela JM, Beckers J, Blum R, Borrell V, et al. (2013). Trnp1 regulates expansion and folding of the mammalian cerebral cortex by control of radial glial fate. Cell 153, 535–549. [DOI] [PubMed] [Google Scholar]
- Sun T, and Hevner RF (2014). Growth and folding of the mammalian cerebral cortex: from molecules to malformations. Nature reviews Neuroscience 15, 217–232. [DOI] [PMC free article] [PubMed] [Google Scholar]
- Takahashi K, Okita K, Nakagawa M, and Yamanaka S (2007). Induction of pluripotent stem cells from fibroblast cultures. Nature protocols 2, 3081–3089. [DOI] [PubMed] [Google Scholar]
- Tang H, Hammack C, Ogden SC, Wen Z, Qian X, Li Y, Yao B, Shin J, Zhang F, Lee EM, et al. (2016). Zika Virus Infects Human Cortical Neural Progenitors and Attenuates Their Growth. Cell stem cell 18, 587–590. [DOI] [PMC free article] [PubMed] [Google Scholar]
- Terrone G, Voisin N, Abdullah Alfaiz A, Cappuccio G, Vitiello G, Guex N, D’Amico A, James Barkovich A, Brunetti-Pierri N, Del Giudice E, et al. (2016). De novo PIK3R2 variant causes polymicrogyria, corpus callosum hyperplasia and focal cortical dysplasia. European journal of human genetics: EJHG 24, 1359–1362. [DOI] [PMC free article] [PubMed] [Google Scholar]
- Tokuda S, Mahaffey CL, Monks B, Faulkner CR, Birnbaum MJ, Danzer SC, and Frankel WN (2011). A novel Akt3 mutation associated with enhanced kinase activity and seizure susceptibility in mice. Human molecular genetics 20, 988–999. [DOI] [PMC free article] [PubMed] [Google Scholar]
- Worby CA, and Dixon JE (2014). Pten. Annual review of biochemistry 83, 641–669. [DOI] [PubMed] [Google Scholar]
- Yu J, Vodyanik MA, Smuga-Otto K, Antosiewicz-Bourget J, Frane JL, Tian S, Nie J, Jonsdottir GA, Ruotti V, Stewart R, et al. (2007). Induced pluripotent stem cell lines derived from human somatic cells. Science 318, 1917–1920. [DOI] [PubMed] [Google Scholar]
Associated Data
This section collects any data citations, data availability statements, or supplementary materials included in this article.