. 2019 Apr 2;8:e44556. doi: 10.7554/eLife.44556

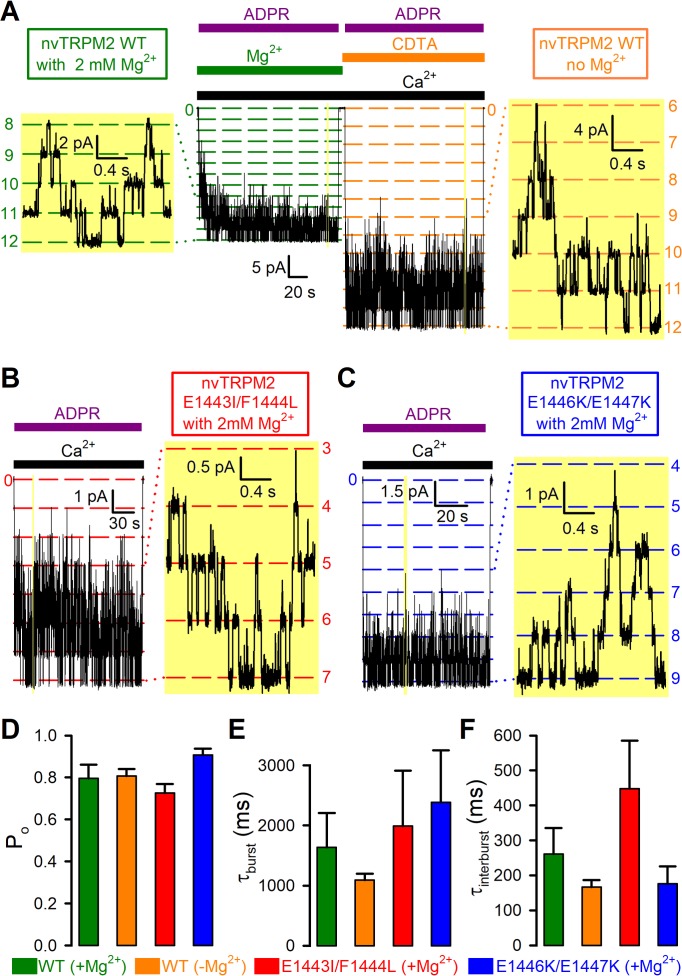
Figure 7. Mg2+removal and Nudix box mutations little affect steady-state single-channel gating kinetics of nvTRPM2 channels.

(A–C) Steady-state channel currents from patches containing (A) twelve WT (B) seven E1443I/F1444L and (C) nine E1446K/E1447K nvTRPM2 channels, activated by exposure to 125 μM Ca2+ and 100 μM ADPR (bars) in the presence of 2 mM cytosolic Mg2+; channel number was estimated in each patch as the maximum number of simultaneously open channels (see Materials and methods). In (A), WT channels were reopened by a second application of ADPR in the absence of bath Mg2+ (orange bar: Mg2+ removal + addition of 100 μM CDTA). Narrow yellow boxes highlight segments of record shown to the left/right at expanded time/current scales; note well resolved gating transitions. Bandwidth, 200 Hz. (D–F) Open probabilities (D), mean burst (E) and interburst (F) durations obtained from multi-channel fits (see Figure 7—figure supplement 1), for WT nvTRPM2 with (green) or without (orange) Mg2+, and for E1443I/F1444L (red) and E1446K/E1447K (blue) nvTRPM2 with Mg2+. Data are shown as mean ± SEM from 6 to 12 patches. See also Figure 7—figure supplement 1.

Figure 7—source data 1. Mg2+removal and Nudix box mutations little affect steady-state single-channel gating kinetics of nvTRPM2 channels.
elife-44556-fig7-data1.xlsx (107.4KB, xlsx)
DOI: 10.7554/eLife.44556.023

Figure 7.

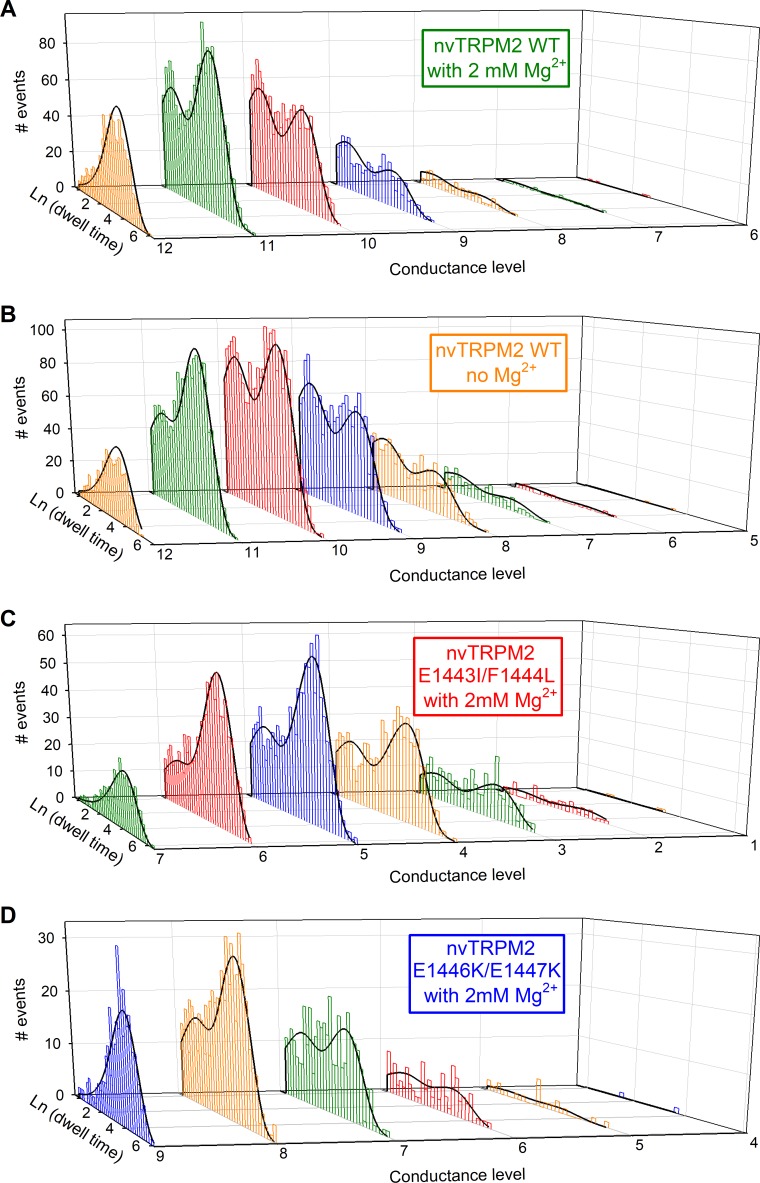
Figure 7—figure supplement 1. Kinetic analysis of multichannel patches by a simultaneous maximum likelihood fit to the dwell-time histograms of all conductance levels.

Figure 7—figure supplement 1.

(A–D) Logarithmically binned dwell-time histograms (colored bar charts) of steady-state current segments in 125 μM Ca2+plus 100 μM ADPR for the recordings shown in Figure 7A–C, plotted individually for each conductance level (cf., dashed lines in Figure 7A–C), obtained by half-amplitude threshold crossing analysis using an imposed fixed dead time of 0.9 ms. The histogram sets in (A) (WT, +Mg2+), (B) (WT, −Mg2+), (C) (E1443I/F1444L), and (D) (E1446K/E1447K) contain 4560, 7061, 3505, and 1418 events, respectively, in total. Families of solid black curves illustrate the simultaneous maximum likelihood fits of the sets of dwell-time histograms by the Cslow(1)-O(3)-Cfast(2) scheme, accounting for the fixed dead time (Csanády, 2000), with the four rate constants r13, r31, r32, r23 as free parameters. Fitted rate constants were (A) r13 = 9.75 s−1, r31=0.880 s−1, r32=1.56 s−1, r23=633 s−1, (B) r13 = 6.94 s−1, r31=1.14 s−1, r32=2.28 s−1, r23=633 s−1, (C) r13 = 3.96 s−1, r31=1.29 s−1, r32=1.14 s−1, r23=504 s−1, and (D) r13 = 9.99 s−1, r31=1.02 s−1, r32=0.969 s−1, r23=463 s−1. Calculated bursting parameters (cf., Figure 7E–F) were (A) τb=1140 ms, τib=103 ms, (B) τb=881 ms, τib=144 ms, (C) τb=779 ms, τib=253 ms, and (D) τb=983 ms, τib=100 ms.