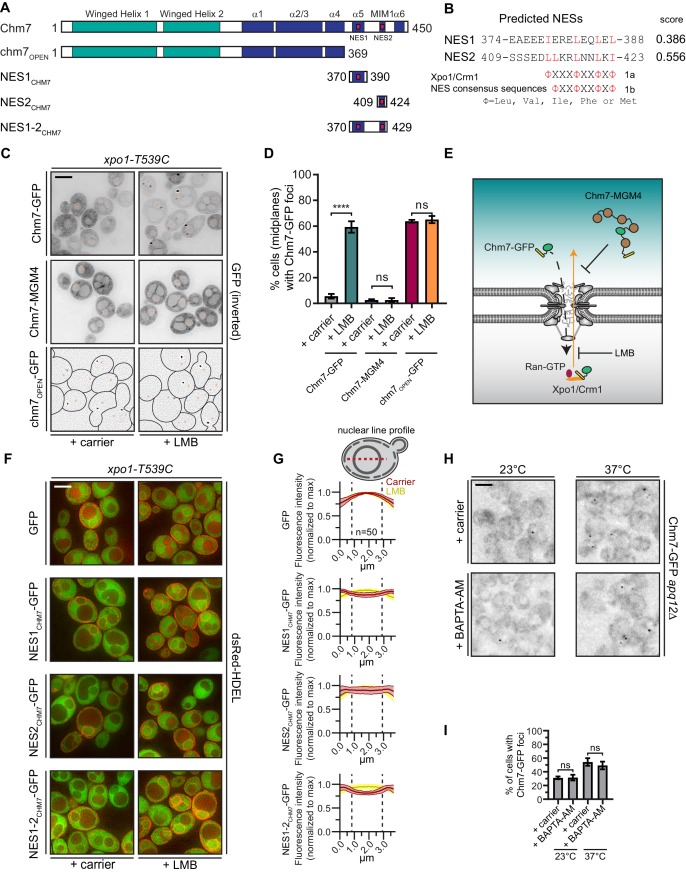
Figure 1. Chm7 can diffuse across the NPC but is actively exported by Xpo1.
(A) Schematic of Chm7 and deletion constructs with predicted winged helix domains (teal), alpha helices (blue) and NESs (red boxes); numbers are amino acids. (B) Predicted Chm7 NESs with probability score from LocNES; numbers are amino acids from Chm7 sequence. Hydrophobic residues in putative NESs are highlighted red as per the consensus class 1a and 1b NESs shown. (C) Deconvolved inverted fluorescence micrographs of the indicated Chm7-GFP constructs in a LMB-sensitive strain (xpo1-T539C) treated with carrier (MeOH) or LMB. Nuclei are marked with orange asterisks. Because of the lack of detectable cytosolic fluorescence in chm7OPEN-GFP-expressing cells, cell boundaries in the bottom panel are drawn from phase-images (not shown). Scale bar is 5 µm. (D) Plots showing the percentage of cells with Chm7-GFP nuclear envelope foci from C. Data are from three independent replicates where > 100 cells were counted for each strain. Only images of midplanes were quantified. P-values from unpaired Student’s t-test where ns is p>0.05, ****p≤0.0001. (E) Schematic of the experiment and interpretation of C. (F) Deconvolved fluorescence micrographs (merge of green and red channels) of the indicated GFP, and GFP-NES constructs co-expressed with dsRed-HDEL to help visualize the nucleus. Cells were treated with carrier (MeOH) or LMB before imaging. Scale bar is 5 µm. (G) To quantify relative nuclear exclusion of the GFP and GFP-NES constructs in F, line profiles bisecting the nucleus as shown in diagram were measured from 50 cells/condition pooled from three independent replicates. The normalized average (thick lines) ±SD (thin lines) of the carrier (red) and LMB-treated (yellow) cells are shown. Vertical dotted lines designate nuclear boundaries. (H) Ca2+ chelation does not affect Chm7-GFP recruitment to the nuclear envelope in apq12Δ cells. Deconvolved inverted fluorescence micrographs of Chm7-GFP in apq12Δ cells pretreated for 30 min with carrier (DMSO) or BAPTA-AM and shifted to the indicated temperature for 45 min. (I) Plot quantifying the percentage of apq12Δ cells with Chm7-GFP foci at the indicated temperature and treatment. three independent replicates of >100 cells were quantified per replicate. P-values are calculated from un-paired Student’s t-test where ns is p>0.05.


