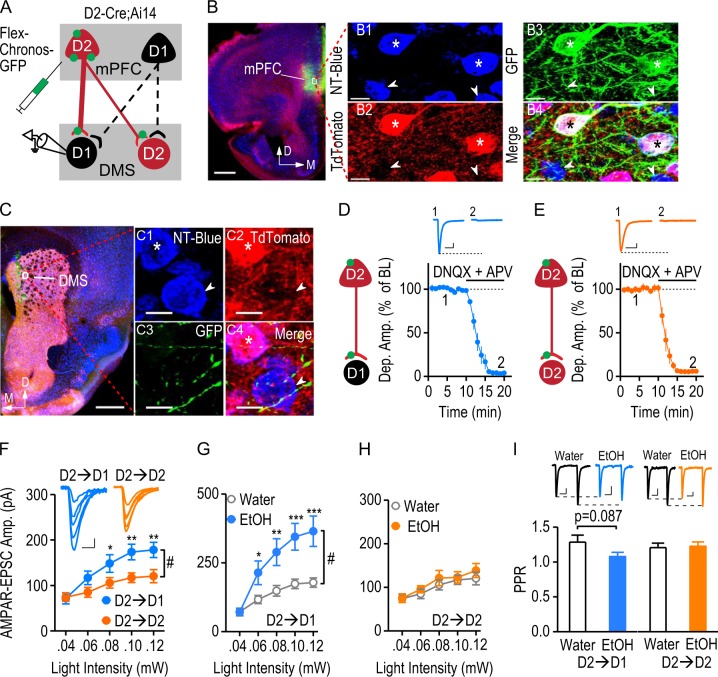
Fig. 5.
The strong mPFC D2R-expressing input onto DMS D1-MSNs is potentiated by excessive alcohol consumption. a Illustration depicting the infusion of AAV-Flex-Chronos-GFP into the mPFC of D2-Cre;Ai14 mice, resulting in selective expression of Chronos in mPFC D2R-expressing neurons, but not D1R-expressing neurons. The expressed Chronos (green) was trafficked down to the mPFC terminals within the DMS. Optical stimulation exclusively activated glutamatergic transmission from mPFC D2R-expressing inputs onto DMS D1-MSNs (D2→D1) or D2-MSNs (D2→D2). D2-MSNs were identified by their expression of tdTomato. The tdTomato-negative striatal neurons were considered as putative D1-MSNs. b Representative images of the mPFC infusion site. Coronal sections were prepared 8 weeks after the viral infusion. The section was counterstained with NeuroTrace blue (NT-Blue). Infusion of AAV-Flex-Chronos-GFP caused intense green fluorescent labeling at the injection site (left). Scale bar: 500 µm. The boxed area is presented at higher magnification in the right-hand panels. All mPFC neurons were stained with NT-Blue (B1). D2-neurons expressed tdTomato (red), and the arrows indicate D2R-negative cells (B2). AAV-Flex-Chronos-GFP was selectively expressed in D2R-expressing neurons (B3, stars). Stars indicate the Chronos-expressing tdTomato-positive neurons. Arrows indicate that tdTomato-negative cells did not express Chronos. Scale bar: 10 µm. c Sample images of Chronos-expressing mPFC fibers in the DMS (left). The striatal neurons from the indicated box are shown on the right. All neurons were blue-stained (C1). D2-MSNs (stars) expressed red tdTomato and putative D1-MSNs are indicated by arrows (C2). Green mPFC afferents innervated striatal neurons (C3). The merged image (C4) shows green fibers surrounded by both D2-MSNs (red and blue) and putative D1-MSNs (blue). Scale bar: 500 µm (left), and 7 µm (right). d Verification of glutamatergic transmission at D2→D1 synapses. Illustration indicating the whole-cell recordings performed on D1-MSNs. Synaptic transmission was triggered by optical stimulation of Chronos-expressing D2R-expressing inputs from the mPFC. The light-evoked responses were completely abolished by bath application of the AMPAR antagonist, DNQX (10 μM), and the NMDAR antagonist, APV (50 μM); DNQX + APV: 4.00 ± 0.73% of baseline, t(9) = 131.27, p < 0.05, paired t test; n = 10 slices, 8 mice. The inset sample traces indicate the light-evoked responses in D1-MSNs at baseline (1) and after infusion of DNQX and APV (2). Scale bars: 20 ms, 40 pA. e Verification of glutamatergic transmission at D2→D2 synapses. Illustration showing that light-evoked responses were recorded from D2-MSNs. Bath application of DNQX and APV completely blocked these light-evoked responses; DNQX + APV: 5.43 ± 0.89% of baseline, t(9) = 106.82, p < 0.05, paired t test; n = 10 slices, 8 mice. The inset sample traces indicate the light-evoked responses in D2-MSNs before (1) and after (2) infusion of DNQX and APV. Scale bars: 20 ms, 25 pA. Note that there was no ChR2 expression in the D2-MSNs of D2-Cre;Ai14 mice. Therefore, blockade of glutamatergic transmission completely abolished the light-evoked response, in contrast to the partial D2→D2 inhibition in D2-Cre;Ai32 mice. f AMPAR-mediated EPSCs were significantly larger at the D2→D1 connection than at the D2→D2 synapse. Left, Representative traces of the responses evoked in DMS D1- and D2-MSNs by a range of stimulation intensities. Scale bars: 10 ms, 30 pA. Right, The corresponding input-output curves; #p < 0.05; *p < 0.05; **p < 0.01 versus water group at the same stimulation intensities, two-way RM ANOVA followed by SNK test; n = 15 neurons, 5 mice per group. g Excessive alcohol intake significantly increased the amplitude of AMPAR-mediated EPSCs from the mPFC D2-inputs onto D1-MSNs. The input-output curves of D2→D1 AMPAR-EPSCs were measured at a range of stimulation intensities in the water and alcohol (EtOH)-drinking groups; #p < 0.05, two-way RM ANOVA; *p < 0.05; **p < 0.01; ***p < 0.001 versus water group at the same stimulation intensities, post hoc SNK test; n = 15 neurons, 5 mice per group. h Excessive alcohol intake did not alter the AMPAR-mediated D2-MSN response to mPFC D2-inputs. The input-output curves of D2→D2 AMPAR-EPSC were measured at the indicated stimulation intensities; p > 0.05, two-way RM ANOVA; n = 15 neurons, 5 mice per group. i Excessive alcohol consumption caused a marginal reduction in PPR at the D2→D1 connection, but not at the D2→D2 connection. Bar graphs comparing PPRs in the indicated groups; p = 0.087, unpaired t test; n = 15 neurons, 5 mice per group (D2→D1); p > 0.05, unpaired t test; n = 15 neurons, 5 mice per group (D2→D2). Inset, representative AMPAR-EPSC traces induced by two optical stimuli delivered at a 100-ms interval in the water and EtOH groups. Scale bars: 30 ms, 30 pA (D2→D1); 30 ms, 15 pA (D2→D2)

