

Abstract
Study design
Retrospective study.
Objectives
To establish the inter-rater reliability in the quantitative evaluation of spinal cord damage following cervical incomplete spinal cord injury (SCI) utilizing magnetic resonance imaging (MRI). MRI was used to perform manual measurements of the cranial and caudal boundaries of edema, edema length, midsagittal tissue bridge ratio, axial damage ratio, and edema volume in 10 participants with cervical incomplete SCI.
Setting
Academic university setting.
Methods
Structural MRIs of 10 participants with SCI were collected from Northwestern University’s Neuromuscular Imaging and Research Lab. All manual measures were performed using OsiriX (Pixmeo Sarl, Geneva, Switzerland). Intraclass correlation coefficients (ICC) were used to determine inter-rater reliability across seven raters of varying experience.
Results
High-to-excellent inter-rater reliability was found for all measures. ICC values for cranial/caudal levels of involvement, edema length, midsagittal tissue bridge ratio, axial damage ratio, and edema volume were 0.99, 0.98, 0.90, 0.84, and 0.93, respectively.
Conclusions
Manual MRI measures of spinal cord damage are reliable between raters. Researchers and clinicians may confidently utilize manual MRI measures to quantify cord damage. Future research to predict functional recovery following SCI and better inform clinical management is warranted.
Subject terms: Preclinical research, Translational research
Introduction
Following a spinal cord injury (SCI), individuals are faced with uncertainty regarding recovery of motor and sensory function; incomplete SCIs are particularly unpredictable due to the wide variability in mechanism, severity, and type of injury [1]. The International Standards for Neurological Classification of Spinal Cord Injury (ISNCSCI) defines an incomplete SCI as a lesion of the cord with intact sensory function with a possible sparing of motor function below the level of injury [2]. Following SCI, the prioritization for the recovery of functional abilities, such as walking, upper extremity use, sphincter control for bowel and bladder care, and sexuality are highly patient dependent [3]. Thus, prognostic methods for functional recovery, on a patient-by-patient basis, following spinal cord injuries are invaluable for determining targeted rehabilitative approaches toward achieving individual patient priorities.
ISNCSCI is a widely accepted standard for classifying individuals with SCI [2]. However, it requires the use of subjective clinical measures, such as manual muscle and sensory testing, a cognitively intact patient, and often the ISNCSCI examination does not fully or accurately evaluate the extent of a SCI. Rather, the ISNCSCI examination captures gross residual function secondary to the injury [4]. This classification system is subject to variability due to the complex nature of neurological injury [4, 5]. As a result, the supplementation of other objective measures are warranted to accompany, if not enhance, the present classification system.
Presently, T2-weighted magnetic resonance imaging (MRI) is the recommended imaging modality for viewing the specific pathological features of the injured spinal cord [6]. Edema is commonly observed on T2-weighted MRI as an irregularly shaped characterization of hyperintensity to indicate areas of the damaged cord [5]. While a variety of measures for quantifying the extent of edema have been reported [5, 7–16] and associated with functional recovery [5, 7, 8], more evidence is needed to establish the psychometric properties of these measurements.
The segmental levels of both cranial and caudal involvement (CCI) are reference measures used to locate the upper and lower anatomical bounds of edema [11, 17]. Edema length (EL) has been commonly measured and reported as the extent of edema along the cranial–caudal axis [7, 9–11, 13–15, 18]. Midsagittal tissue bridge (MTB) measures have emerged as a promising approach for functional prognosis [12, 19]. The axial damage ratio (ADR) is a novel measure used to capture the two-dimensional extent of edema within the cord [5]. Edema volume is calculated using consecutive axial slices through the damage. This study sought to establish the inter-rater reliability of five T2-weighted MRI-based manual measures across seven raters with varying levels of experience (novice to experienced): (1) CCI, (2) EL, (3) MTB, (4) ADR, and (5) edema volume.
Methods
Participant characteristics
This project was a retrospective analysis of MRI data from published studies [5, 8, 19]. It was approved by Northwestern University and Regis University Institutional Review Boards. Data were collected from Northwestern University’s Neuromuscular Imaging and Research Lab. MR images of 10 participants with SCI were selected based on availability from previous work [19] (nine males and one female, mean age: 44, median age: 44, standard deviation: 12, range: 27–64). In terms of severity of injury, two participants were classified using the American Spinal Cord Injury Association Impairment Scale (AIS) as AIS C C5-C8, while eight participants were classified as AIS D. Participants were included if they had sensorimotor incomplete cervical SCI with images collected after cervical fusion. See Table 1 for additional participant demographic information.
Table 1.
Demographic information of study participants
| Participant number | Sex | Age (years) | Height (cm) | Weight (kg) | Time since injury (years) | Mechanism of injury |
|---|---|---|---|---|---|---|
| 1 | M | 44 | 177.7 | 68.04 | 5 | Motorcycle injury |
| 2 | M | 57 | 178 | 79.38 | 8 | Cycling injury |
| 3 | F | 52 | 157 | 83.91 | 0.33 | MVC |
| 4 | M | 31 | 178 | 72.57 | 4 | Diving injury |
| 5 | M | 27 | 191 | 86.18 | 4 | Skiing injury |
| 6 | M | 32 | 173 | 81.65 | 5 | MVC |
| 7 | M | 45 | 175 | 58.97 | 3.5 | ATV injury |
| 8 | M | 36 | 185 | 73.48 | 1.5 | Motorcycle injury |
| 9 | M | 50 | 178 | 72.57 | 5 | Fall from height |
| 10 | M | 64 | 175 | 108.86 | 4 | Fall |
MVC motor vehicle collision
All institutional and governmental regulations concerning the ethical use of human volunteers were certifiably followed during the course of this research according to the Declaration of Helsinki, including obtaining informed consent.
Image acquisition
Images were provided from previous research in which trained personnel transferred participants to a supine position on the scanner bed [5]. MRI was performed with a 3.0 T Siemens (Munich, Germany). Prisma scanner equipped with a 64-channel head/neck coil. Localizer scans were completed, and patient safety and comfort were monitored throughout. A T2-weighted single slab 3D turbo spin echo sequence with a slab selective, variable excitation pulse (SPACE, TR = 1500 ms, TEeff = 115 ms, echo train length = 78, flip angle = 90°/140°, effective resolution = 0.8 × 0.8 × 0.8 mm3 interpolated resolution = 0.8 × 0.4 × 0.4 mm3) was used to create a high-resolution 3D image of the cervical and upper thoracic spine [5].
Image processing
MRI data were analyzed using a medical image viewer software program, OsiriX (Pixmeo Sarl, Geneva, Switzerland). The segmental levels of both cranial and caudal involvement (CCI) were determined by identifying the cranial-most and caudal-most vertebral body where edema was present (see Fig. 1).
Fig. 1.
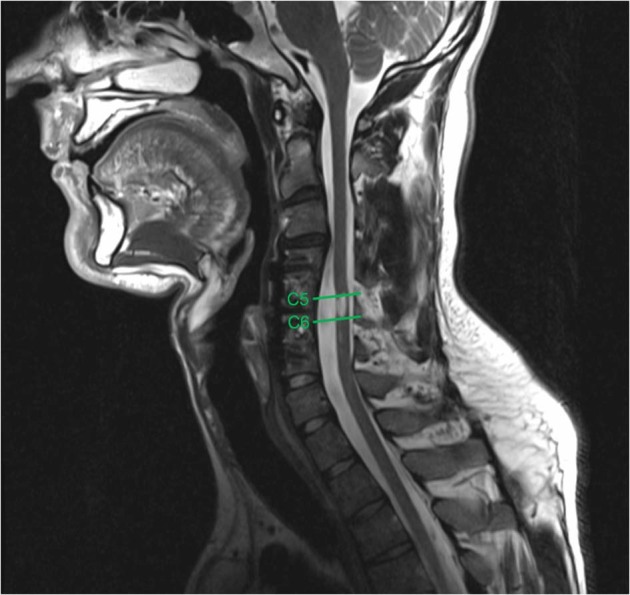
A T2-weighted sagittal image demonstrating the cranial-most vertebral level (C5) and caudal-most vertebral level (C6) of edema involvement
Edema length (EL) was measured using the sagittal slice with the maximal extent of edema, as the distance between the most cranial and caudal portions while keeping the measuring line parallel to the spinal cord (see Fig. 2a).
Fig. 2.

a An example of the edema length manual measurement. b The midsagittal tissue bridge ratio was calculated as the sum of the anterior and posterior tissue bridges (green) divided by the diameter of the cord (red). c The axial damage ratio was quantified as the maximal edema cross-sectional area (green) divided by the surrounding spinal cord cross-sectional area (red)
To quantify MTB, the midsagittal slice was used. Tissue bridges were calculated as the minimum distance from cerebrospinal fluid to the edema, on both the anterior and posterior sides of edema. The MTB ratio was quantified as the sum of anterior and posterior tissue bridges divided by the spinal cord diameter (see Fig. 2b).
For each patient, edema and surrounding spinal cord cross-sectional area (CSA) were measured for each axial slice where the edema was visibly present (see Fig. 2c). Edema volumes were calculated as the measured CSA multiplied by slice thickness: volume = ∑CSAeachslice × slice thickness (see Fig. 3). For axial damage ratio (ADR) measure, the axial slice with the largest CSA of edema was identified. ADR was calculated as the maximum CSA of edema divided by its corresponding spinal cord CSA: ADR = CSAmaxedema/CSAspinalcord (see Fig. 2c).
Fig. 3.
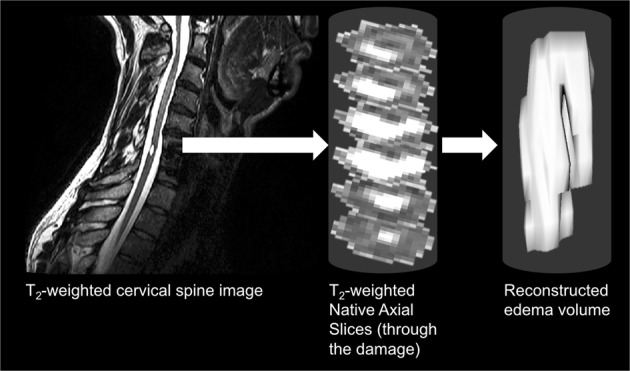
Edema volume was calculated using consecutive axial edema cross-sectional areas multiplied by the axial slice thickness
All five manual measurements were completed by seven independent raters with a wide range of experience, ranging from 5 h to more than 4 years of experience.
Statistical analysis
IBM SPSS version 21 (Armonk, NY, USA) was used to perform statistical analyses of the data. Intraclass correlation coefficients (ICC) were computed for CCI, EL, MTB, ADR, and edema volume measurements, to establish inter-rater reliability. A two-way mixed effects model, absolute agreement type, average measures approach was used for each ICC calculated. A p-value of < 0.05 was used to define statistical significance for all measures.
Results
ICC values for one-dimensional measurements (CCI, EL), two-dimensional measurements (MTB, ADR), and the three-dimensional measurement (edema volume) demonstrated high-to-excellent inter-rater reliability (0.99, 0.98, 0.90, 0.84, and 0.93, respectively) at a significance value of p < 0.05 (see Fig. 4).
Fig. 4.
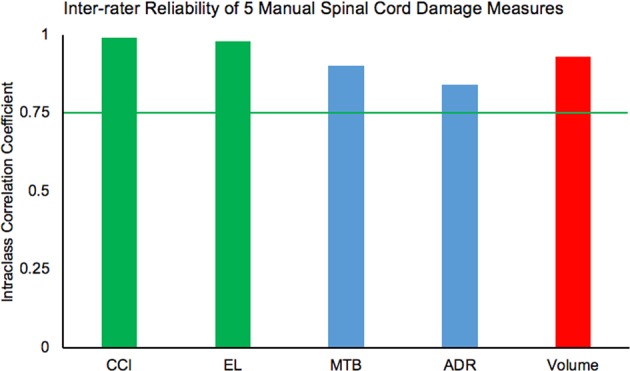
A chart demonstrating the reliability values for all five measures: cranial/caudal levels of involvement (CCI), edema length (EL), midsagittal tissue bridge (MTB) ratios, axial damage ratios (ADR), and edema volume. The green bars represent one-dimensional measures, the blue bars represent two-dimensional measures, and the red bar represents the three-dimensional measure. The green line represents the cut-off of high inter-rater reliability at 0.75
Discussion
All five manual measurements demonstrated a high-to-excellent level of inter-rater reliability (ICC > 0.75). Our results demonstrate that edema characteristics can be reliably measured, even among novice raters. In regards to the MTB measure, high levels of inter-rater reliability were found in previous literature [12, 19]. Among two experienced raters, the inter-rater reliability of the axial damage ratio was previously reported as ICC = 0.82 [5], consistent with our results. These manual measurements of spinal cord edema have been reported as important for relating to physical function [5, 11, 12]. In particular, MTB have shown to correlate with current and future walking ability following SCI [12, 19]. Based on our results, it may be possible for clinicians, regardless of imaging experience level, to reliably measure cord edema and use this as an adjunct tool to inform prognosis and thus, clinical management.
A previously reported clinical prediction rule used ISNCSCI testing and other clinical prognostic indicators for individuals with SCI [20]. While ISNCSCI is widely used and accepted, it is an indirect assessment of an individual’s SCI using general tests of sensory and motor function. The testing used is also subject to spatial and temporal variability, due to the complex nature of SCI, concomitant traumatic brain injury, cognition altering medications, and spinal shock [4, 21]. The measurements used and reported in this study may inform and enhance prognosis and direct clinical management of patients with SCI. In particular, more precise measurements, using available imaging tests typical of standard practice, may help clinicians to better focus on valuable rehabilitation while considering available time and resources on a patient-by-patient basis. Several studies have demonstrated relationships between edema measurements and clinical outcomes [5, 12]. Our study demonstrated that several other measures of edema could be used in tandem with commonly used tests (e.g. ISNCSCI) and can be quantified reliably by novice raters. In particular, edema volume may be an even more useful measurement as it gives a more complete three-dimensional measure for the extent of spinal cord damage.
Limitations of our study exist and include a small and restrictive sample size of patients with incomplete SCI, which is not generalizable to all those who have sustained a SCI. Our sample only consisted of 10 participants, nine of whom were men. Future studies should include a larger pool of participants with demographics reflective of and more generalizable to the population of those injured. For optimal clinical translation of these findings, future work should include a broad pool of imaging data from varying scanner strengths (i.e., 1.5 Tesla, 3.0 Tesla), different MR scanners, and data from multi-site trials. Another limitation with our manual measurement approaches is the variability in spinal cord anatomy across research participants. While the axial damage ratio attempts to account for spinal cord diameter variability, standardized spinal cord template-based approaches may be beneficial to compare anatomy and damage across participants [8, 22] (i.e., extent of edema encroaching into dorsal or ventral spinal columns).
Further research will be necessary to establish the clinical utility of these various edema measurements, especially those less recognized, such as the axial damage ratio and edema volume. Current literature, however, shows that edema measurements using T2-weighted MRI may be a useful prognostic tool to inform management of individuals with spinal cord injuries.
Conclusion
With minimal training, clinicians demonstrate higher levels of reliability toward measuring edema using T2-weighted MRI following sensorimotor incomplete SCI. Establishing the validity of these measurements will be important to inform clinical practice and improve the prediction of functional (motor and sensory) recovery following SCI.
Acknowledgements
The content is solely the responsibility of the authors and does not necessarily represent the official views of the National Institutes of Health. ACS, KAW, JME, DRO, and JCB were supported by the Eunice Kennedy Shriver National Institute of Child Health and Human Development under award number R03HD094577. KAW was supported by the National Institute on Drug Abuse under award number T32DA035165 and the National Institute of Neurological Disorders and Stroke under award number K23NS104211. JME and ACS were supported by the Eunice Kennedy Shriver National Institute of Child Health and Human Development under award number R01HD079076. ACS was supported by the Regis University Research and Scholarship Council.
Compliance with ethical standards
Conflict of interest
The authors declare that they have no conflict of interest.
Footnotes
Honorary Senior Fellow: James M. Elliott
Publisher’s note: Springer Nature remains neutral with regard to jurisdictional claims in published maps and institutional affiliations.
References
- 1.Spinal cord injury (SCI) 2016 facts and figures at a glance. J Spinal Cord Med. 2016;39:493–4. doi: 10.1080/10790268.2016.1210925. [DOI] [PMC free article] [PubMed] [Google Scholar]
- 2.Kirshblum SC, Waring W, Biering-Sorensen F, Burns SP, Johansen M, Schmidt-Read M, et al. Reference for the 2011 revision of the international standards for neurological classification of spinal cord injury. J Spinal Cord Med. 2011;34:547–54. doi: 10.1179/107902611X13186000420242. [DOI] [PMC free article] [PubMed] [Google Scholar]
- 3.Simpson LA, Eng JJ, Hsieh JTC, Wolfe and the Spinal Cord Injury Rehabilitation Evidence Research Team. The health and life priorities of individuals with spinal cord injury: a systematic review. J Neurotrauma. 2012;29:1548–55. doi: 10.1089/neu.2011.2226. [DOI] [PMC free article] [PubMed] [Google Scholar]
- 4.Roberts TT, Leonard GR, Cepela DJ. Classifications in brief: American Spinal Injury Association (ASIA) Impairment Scale. Clin Orthop Relat Res. 2017;475:1499–504. doi: 10.1007/s11999-016-5133-4. [DOI] [PMC free article] [PubMed] [Google Scholar]
- 5.Smith AC, Weber KA, Parrish TB, Hornby TG, Tysseling VM, McPherson JG, et al. Ambulatory function in motor incomplete spinal cord injury: a magnetic resonance imaging study of spinal cord edema and lower extremity muscle morphometry. Spinal Cord. 2017;55:672–8. doi: 10.1038/sc.2017.18. [DOI] [PMC free article] [PubMed] [Google Scholar]
- 6.Lammertse D, Dungan D, Dreisbach J, Falci S, Flanders A, Marino R, et al. Neuroimaging in traumatic spinal cord injury: an evidence-based review for clinical practice and research. J Spinal Cord Med. 2007;30:205–14. doi: 10.1080/10790268.2007.11753928. [DOI] [PMC free article] [PubMed] [Google Scholar]
- 7.Matsushita A, Maeda T, Mori E, Yuge I, Kawano O, Ueta T, et al. Can the acute magnetic resonance imaging features reflect neurologic prognosis in patients with cervical spinal cord injury? Spine J. 2017;17:1319–24. doi: 10.1016/j.spinee.2017.05.009. [DOI] [PubMed] [Google Scholar]
- 8.Smith AC, Weber KA, O’Dell DR, Parrish TB, Wasielewski M, Elliott JM. Lateral corticospinal tract damage correlates with motor output in incomplete spinal cord injury. Arch Phys Med Rehabil. 2018;99:660–6. doi: 10.1016/j.apmr.2017.10.002. [DOI] [PMC free article] [PubMed] [Google Scholar]
- 9.Aarabi B, Sansur CA, Ibrahimi DM, Simard JM, Hersh DS, Le E, et al. Intramedullary lesion length on postoperative magnetic resonance imaging is a strong predictor of ASIA Impairment Scale grade conversion following decompressive surgery in cervical spinal cord injury. Neurosurgery. 2017;80:610–20. doi: 10.1093/neuros/nyw053. [DOI] [PMC free article] [PubMed] [Google Scholar]
- 10.Boldin C, Raith J, Fankhauser F, Haunschmid C, Schwantzer G, Schweighofer F. Predicting neurologic recovery in cervical spinal cord injury with postoperative MR imaging. Spine (Phila Pa 1976) 2006;31:554–9. doi: 10.1097/01.brs.0000201274.59427.a4. [DOI] [PubMed] [Google Scholar]
- 11.Flanders A, Spettell C, Friedman D, Marino RJ, Herbison G. The relationship between the functional abilities of patients with cervical spinal cord injury and the severity of damage revealed by MR imaging. AJNR Am J Neuroradiol. 1999;20:926–34. [PMC free article] [PubMed] [Google Scholar]
- 12.Huber E, Lachappelle P, Sutter R, Curt A, Freund P. Are midsagittal tissue bridges predictive of outcome after cervical spinal cord injury? Ann Neurol. 2017;81:740–8. doi: 10.1002/ana.24932. [DOI] [PubMed] [Google Scholar]
- 13.Magu S, Singh D, Yadav RK, Bala M. Evaluation of traumatic spine by magnetic resonance imaging and correlation with neurological recovery. Asian Spine J. 2015;9:748–56. doi: 10.4184/asj.2015.9.5.748. [DOI] [PMC free article] [PubMed] [Google Scholar]
- 14.Miyanji F, Furlan J, Aarabi B, Arnold P, Fehlings M. Acute cervical traumatic spinal cord injury: MR imaging findings correlated with neurologic outcome—prospective student with 100 consecutive patients. Radiology. 2007;243:820–7. doi: 10.1148/radiol.2433060583. [DOI] [PubMed] [Google Scholar]
- 15.Gupta R, Mittal P, Sandhu P, Saggar K, Gupta K. Correlation of qualitative and quantitative MRI parameters with neurological status: a prospective study on patients with spinal trauma. J Clin Diagn Res. 2014;8:13–7. doi: 10.7860/JCDR/2014/9471.5181. [DOI] [PMC free article] [PubMed] [Google Scholar]
- 16.Singh R, Kumar RR, Setia N, Magu S. A prospective study of neurological outcome in relation to findings of imaging modalities in acute spinal cord injury. Asian J Neurosurg. 2015;10:181–9. doi: 10.4103/1793-5482.161166. [DOI] [PMC free article] [PubMed] [Google Scholar]
- 17.Talekar K, Poplawski M, Hegde R, Cox M, Flanders A. Imaging of spinal cord injury: acute cervical spinal cord injury, cervical spondylotic myelopathy, and cord herniation. Semin Ultrasound, CT Mri. 2016;37:431–47. doi: 10.1053/j.sult.2016.05.007. [DOI] [PubMed] [Google Scholar]
- 18.Aarabi B, Simard JM, Kufera JA, Alexander M, Zacherl KM, Mirvis SE, et al. Intramedullary lesion expansion on magnetic resonance imaging in patients with motor complete cervical spinal cord injury. J Neurosurg Spine. 2012;17:243–50. doi: 10.3171/2012.6.SPINE12122. [DOI] [PMC free article] [PubMed] [Google Scholar]
- 19.O’Dell DR, Weber KA, Berliner JC, Elliott JM, Connor JR, Cummins DP, et al. Midsagittal tissue bridges are associated with walking ability in incomplete spinal cord injury: a magnetic resonance imaging case series. J Spinal Cord Med. 2018;1–4, 10.1080/10790268.2018.1527079. [Epub ahead of print]. [DOI] [PMC free article] [PubMed]
- 20.van Middendorp JJ, Hosman AJ, Donders ART, Pouw MH, Ditunno JF, Curt A, et al. A clinical prediction rule for ambulation outcomes after traumatic spinal cord injury: a longitudinal cohort study. Lancet. 2011;377:1004–10. doi: 10.1016/S0140-6736(10)62276-3. [DOI] [PubMed] [Google Scholar]
- 21.Boland RA, Lin CSY, Engel S, Kiernan MC. Adaptation of motor function after spinal cord injury: novel insights into spinal shock. Brain. 2011;134:495–505.22. doi: 10.1093/brain/awq289. [DOI] [PubMed] [Google Scholar]
- 22.De Leener B, Fonov VS, Collins DL, Callot V, Stikov N, Cohen-Adad J. PAM50: unbiased multimodal template of the brainstem and spinal cord aligned with the ICBM152 space. Neuroimage. 2017;165:170–9. doi: 10.1016/j.neuroimage.2017.10.041. [DOI] [PubMed] [Google Scholar]