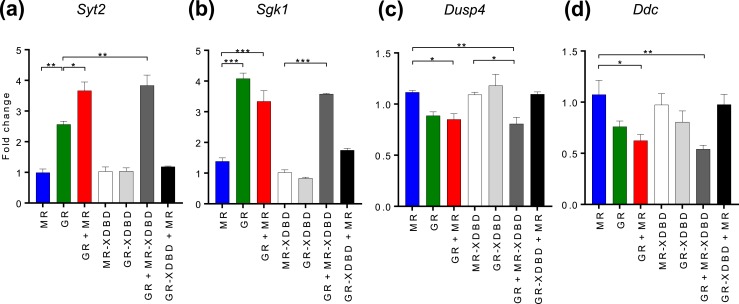
Figure 4.
Differential effects of GR and MR on gene expression. (a–d) Graphs show (a) Syt2 mRNA, (b) Sgk1 mRNA, (c) Dusp4 mRNA, and (d) Ddc nascent RNA changes in N2A cells with expressed wild-type MR and GR individually or combined, and MR-XDBD/GR-XDBD mutants individually or in combination with GR/MR. RT-qPCR data from N2A cells treated with 100 nM CORT for 2 h after transient transfection for 24 h with MR/GR/MR+GR expression plasmids and cotransfection of NR3C1-3′UTR shRNA to minimize endogenous GR effects. Data are represented as mean fold changes relative to EGFP-transfected controls ± SEM (n ≥ 3). *P < 0.05; **P < 0.01; ***P < 0.001.

