Abstract
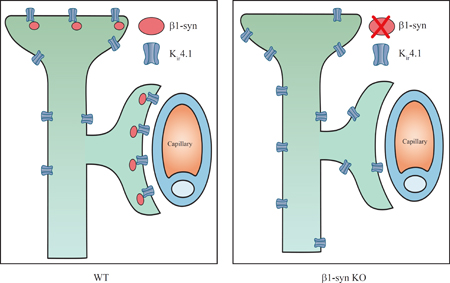
Proper function of the retina depends heavily on a specialized form of retinal glia called Müller cells. These cells carry out important homeostatic functions that are contingent on their polarized nature. Specifically, the Müller cell endfeet that contact retinal microvessels and the corpus vitreum show a tenfold higher concentration of the inwardly rectifying potassium channel Kir4.1 than other Müller cell plasma membrane domains. This highly selective enrichment of Kir4.1 allows K+ to be siphoned through endfoot membranes in a special form of spatial buffering. Here we show that Kir4.1 is enriched in endfoot membranes through an interaction with β1-syntrophin. Targeted disruption of this syntrophin caused a loss of Kir4.1 from Müller cell endfeet without affecting the total level of Kir4.1 expression in the retina. Targeted disruption of α1-syntrophin had no effect on Kir4.1 localization. Our findings show that the Kir4.1 aggregation that forms the basis for K+ siphoning depends on a specific syntrophin isoform that colocalizes with Kir4.1 in Müller endfoot membranes.
Keywords: Kir4.1, β1-syntrophin, PDZ domain, retina, polarization, anchoring, Müller cell
Graphical abstract
Introduction
The inwardly rectifying K+ channel Kir4.1 plays a critical role in retinal function (Bringmann et al., 2006; Kofuji et al., 2000; A. Reichenbach & Bringmann, 2013). This channel is essential for potassium homeostasis in retina (Connors & Kofuji, 2006; Ishii et al., 1997; Kofuji & Newman, 2004; Nagelhus et al., 1999; Nagelhus et al., 1998; Newman, Frambach, & Odette, 1984) and is strictly colocalized with the water channel AQP4 which is involved in water transport and volume control (Nagelhus et al., 1999; Nagelhus et al., 1998).
Evidence is accumulating to suggest that Kir4.1 is implicated in retinal pathophysiology, most notably in diabetic retinopathy (Hassan et al., 2017; Pannicke et al., 2006; Zhang, Xu, Ling, & Da, 2011). While Kir4.1 normally is concentrated in Müller cell membranes abutting retinal capillaries and corpus vitreum, this polarized expression of Kir4.1 is strongly reduced in experimental diabetes (Pannicke et al., 2006; Zhang et al., 2011). A loss of the functional specialization of Müller cells and an impaired ion and volume homeostasis may be an essential prelude to the overt pathology that occurs in retinas of late stage diabetes.
What are the mechanisms that target Kir4.1 to specific domains of Müller cell membranes and hence uphold the functional specialization of these cells? Obviously, the spatially restricted aggregation of specific membrane molecules must rely on distinct anchoring processes. Kir4.1 has a C-terminal sequence that ends with -Ser-Asn-Val (-SNV), a motif recognized by PDZ domain containing proteins which are typically involved in formation of macromolecular complexes (Harris & Lim, 2001; Horio et al., 1997; Lee & Zheng, 2010; Sheng & Sala, 2001; Takumi et al., 1995). The syntrophins represent an important class of PDZ containing proteins. The syntrophin family consists of five homologous isoforms (α1, β1, β2, γ1 and γ2) (M. E. Adams et al., 1993; Alessi et al., 2006; Peters, Adams, & Froehner, 1997). All of these isoforms are expressed in retina (Puwarawuttipanit et al., 2006).
In vitro studies have provided evidence for association of Kir4.1 with α1-syntrophin (Hibino, Fujita, Iwai, Yamada, & Kurachi, 2004; Horio et al., 1997). However, targeted deletion of α1-syntrophin did not affect the localization of Kir4.1 in retina (Puwarawuttipanit et al., 2006). This begs the question whether the perivascular anchoring of Kir4.1 in retina depends on one of the other members of the syntrophin family. Based on distribution of other syntrophins, β1-syntrophin was suggested to be the most likely candidate for anchoring Kir4.1 in Müller cell endfeet (Puwarawuttipanit et al., 2006). Here we explore this hypothesis by use of a novel transgenic mouse line with a targeted deletion of the gene encoding β1-syntrophin. We show that the membrane domain specific expression of Kir4.1 depends on the presence of this syntrophin isoform. The unraveling of the mechanisms underlying Müller cell polarization opens new avenues for the understanding of glial function in retinal physiology and pathophysiology.
Materials and Methods
Animals
Adult (3–6 months old) mice with targeted deletion of the genes encoding α1-syntrophin or β1-syntrophin or both were used in this study. Mice of C57/BL6 background were used as wild type controls (WT). The β1-syntrophin knockout (β1-syn KO) mice were generated by using a targeting vector that upon homologous recombination placed lox-P sites on each side of exon 1 (Kim, Whitehead, Bible, Adams, & Froehner, 2019). The resulting mice were bred with transgenic mice expressing Cre recombinase under control of the CMV promoter (Jackson Labs, Bar Harbor, ME) to generate mice lacking all β1-syntrophin. The α1-syntrophin knockout (α1-syn KO) mice were generated by removing exon 1 as described (Marvin E. Adams et al., 2000). The αβ1-syntrophin double knockout (αβ1-syn KO) mice were generated by crossing individual knockouts of α1-syntrophin and β1-syntrophin. Animals had access to food and water ad libitum. Animals of both sexes were used for this study. All the experimental procedures performed on mice were approved by the Institutional Animal Care and Use Committee of the University of Washington. In addition, mice lacking the gene for the inwardly rectifying K+ channel Kir4.1 (Kir4.1 KO) were used as controls for antibody specificity.
Perfusion and tissue preparation
The tissues were fixed as previously described (Mathiisen et al., 2006). Briefly, animals were anesthetized using isoflurane before transcardial perfusion with 2% dextran in 0.1 M phosphate buffer (PB) for 20–30 sec, followed by the fixative for 15 min at a rate of 6ml/min. The animals were fixed by pH-shift protocol where fixation was carried out using 4% formaldehyde and 0.2% picric acid in 0.1 M PB at pH 6.0, followed by the same fixative at pH 10.0. Following perfusion, the eyes were removed and post fixed by immersion in the fixative overnight and later stored in 1:10 dilution of the fixative in PB until further use.
Post embedding immunohistochemistry
Post embedding procedure was performed as described (Hoddevik et al., 2016). Briefly, small pieces of retina from perfusion fixed eyes were dissected out and cryoprotected in graded concentrations of glycerol. The tissues were frozen in propane that was cooled to -170°C using liquid nitrogen, and then subjected to freeze substitution. Samples were embedded in methacrylate resin (Lowicryl HM20) and subjected to UV irradiation for polymerization below 0°. Sections of 90–100 nm thick were cut and were placed on formvar carbon coated support film in Ni-grids.
Immunogold electron microscopy
Immunogold labeling was performed as previously described (Hoddevik et al., 2016; Lunde et al., 2015). Briefly, the ultrathin sections were incubated with primary antibody against Kir4.1 (host: rabbit; 1:200 dilution; Alomone labs; Cat#: APC-035; RRID:AB_2040120) overnight, followed by incubation with goat anti-rabbit IgG antibody conjugated to 15 nm colloidal gold particle (1:20 dilution; Abcam; Cat#: ab27236; RRID:AB_954457) for 2 hr. The sections were counterstained using 2% uranyl acetate for 90 sec, followed by incubation in 0.3% lead citrate for 90 sec and were later examined in a Tecnai 12 electron microscope (FEI) at 80kV.
Immunogold quantitation and data analysis
Images (a total of ~1100) from different layers of retina were acquired at random with a magnification of 26,500x. Care was taken to distinguish the different retinal layers i.e. outer plexiform layer (OPL), inner plexiform layer (IPL), ganglion cell layer (GCL) and subvitreal membrane (SV). Linear densities were determined by counting the gold particles within 23.5 nm of the inner leaflet of the membranes of interest (Amiry-Moghaddam & Ottersen, 2013) using analySIS program (Soft Imaging Systems (SIS), Münster, Germany). The data obtained was transferred to SPSS Version 23 (SPSS, Chicago, IL) for statistical analysis. Retina sections from Kir4.1 KO animals were used as controls for antibody specificity in a separate experiment and the image of the vessels were acquired randomly, disregarding the layers of retina. The researcher was blinded to the genotype of the animals during quantification. Comparisons between groups were made by one-way ANOVA and post hoc Scheffé tests. Data are presented as mean ± SEM.
Immunofluorescence
For light microscopic experiments, the perfusion fixed eyes were cryoprotected in graded sucrose solution (10%, 20% and 30% sucrose in PB) and then frozen in OCT medium (Richard-Allan Scientific™ Neg-50™, Thermo Fisher Scientific; Cat#: 6502) on dry ice. Sections were cut at a thickness of 14 μm, placed on glass slides and stored at −80°C until further use. Immunolabeling was performed as described in (Hoddevik et al., 2016). Briefly, the sections were rinsed with phosphate buffer saline (PBS; 0.01M) and immersed in blocking solution (10% normal donkey serum, 1% bovine serum albumin (w/v), 0.5% triton in PBS) for 60 min at room temperature. The sections were incubated with primary antibody diluted in blocking solution with addition of sodium azide (0.01%) for overnight followed by incubation with secondary antibody diluted in the same solution as blocking solution (Cy3 donkey-anti-rabbit; dilution 1:500; Jackson ImmunoResearch Labs; Cat#: 711–165-152; RRID:AB_2307443) for 1–2 hr. Nuclear staining was performed by incubating the sections with Hoechst 33258, (1:5000 dilution, Thermo Fisher Scientific; Cat#: H3569; RRID:AB_2651133) for 5 min. The sections were rinsed and mounted using Prolong® gold anti-fade reagent (Thermo Fisher Scientific; Cat#: P36934). Z-stack images were acquired using Zeiss LSM 710 confocal microscope, at 40x magnification and at an optical thickness of 0.5 μm. The stack images were 3D rendered using imageJ software, FIJI (Schindelin et al., 2012).
Primary antibodies were: i) affinity-purified rabbit polyclonal antibody against Kir4.1 (1:200 dilution; Alomone Labs; Cat# APC-035, RRID:AB_2040120); ii) affinity-purified rabbit polyclonal antibody against β1-syn (Syn248; 1:100 dilution; (Peters et al., 1997)). Vessels were stained using DyLight® 649 conjugated tomato lectin (LEL, TL; Vector labs; Cat#: DL-1178).
Real time PCR
The mice (n=6 for WT and n=7 for β1-syn KO) were anesthetized and decapitated. Eyes were quickly removed and immediately frozen in liquid nitrogen and later stored in -80°C. The tissues were treated with RNAlater™-ICE (Ambion; Cat#: AM7030) and stored at −80°C until further processing. Total RNA was extracted using RNeasy Mini Kit (Qiagen) following the manufacturer’s protocol. 1 μg of total RNA was reverse transcribed to cDNA using oligo d(T)18 in a 25 μl reaction mixture using GoScript reverse transcription system (Promega; Cat#: A5001). The cDNA obtained was further diluted using Tris-EDTA, pH 8.0.
Real time PCR was performed using 5 ng of cDNA, in a 20 μl reaction mixture of SYBR® Green PCR Master Mix (Applied Biosystems) with specific primers at 200 nM concentration. Real time assays were carried out in 96 well plates using the StepOnePlus™ Real-Time PCR System (v2.3, Applied Biosystems). The amplification was performed in two steps (95°C for 15 sec and 60°C for 60 sec, for 40 cycles). The Ct values >32 correspond to low copy number per ng of total RNA. The primers were designed online using Primer-BLAST and setting the amplicon size to a maximum of 200 bp, which spans exon-exon junctions. List of primers used are presented in Table 1. For each target gene, standards were prepared and absolute quantification was performed. Mean copy number per ng of total RNA was compared between genotypes using Mann-Whitney U-test.
Table1:
List of primers used for the quantitative RT-PCR
| Gene | Protein names | Accession | Forward (5’) | Reverse (3’) |
|---|---|---|---|---|
| Dag1 | Dystroglycan | NM_010017.3 | CCGAGAAGAGCAGTGAGGAC | AGCTCATCCGCAAAGATGAT |
| Dmd | Dystrophin (full length) | NM_007868 | GAGTTGCAAAGGGCCATAAA | ACGGGAGTTTCCATGTTGTC |
| Dp71 | Dystrophin-71 | NM_007868.5 | CAAGCTTACTCCTCCGCTCT | GAGCCTTCTGAGCTTCATGG |
| Dtna | Dystrobrevin alpha | NM_001285807 | ACCAGCACCAAATGAAGGAG | GCCAAGTTGAGTGGCTTTTC |
| Dtnb | Dystrobrevin beta | NM_001162465 | TGCCTGTGCGTTCTACATCT | AGCGTGTTAAGGCCATTGTC |
| Kcnj10 | ATP-sensitive inward rectifier potassium channel 10 (Kir4.1) | NM_001039484.1 | AGAGCAGCCACTTCACCTTC | CGTATTCCTGGGGCCACTAG |
| Snta1 | Alpha-1-syntrophin | NM_009228.2 | GCAGTGTACTGGGACTTCGAG | AGTTCCAGCAACCCGGTG |
| Sntb1 | Beta-1-syntrophin | NM_016667.3 | AGGTCCAGGGAAAGGATCAC | TTCTGTAGGTGCAGGCTGTG |
| Sntb2 | Beta-2-syntrophin | NM_016667.3 | AGGTCCAGGGAAAGGATCAC | TTCTGTAGGTGCAGGCTGTG |
| Sntg1 | Gamma-1-syntrophin | AF367759.1 | AGCAAAGAGCAGAGCTGTCG | CCCAGCATTCCGAAGAACCT |
| Sntg2 | Gamma-2-syntrophin | NM_172951.3 | TGGGATTCACCTGCTTTGAC | GCTCCTTCGTTTCAATCTGC |
| Tbp | TATA-box-binding protein | NM_013684.3 | ACGGACAACTGCGTTGATTT | CAAGGCCTTCCAGCCTTATAG |
| Utrn | Utrophin | NM_011682 | AGAATGCCCGATTGTTGGGT | CTTCCCCAGATGTTGTCGGT |
SDS-PAGE and Western blot
Total protein lysates were prepared from retinae of male WT and β1-syn KO mice (n = 5 for both). Total protein extraction, SDS-PAGE and Western blot were performed as previously described (Katoozi et al., 2017), with some modifications.
Briefly, samples containing 20 μg protein were separated on 10% Criterion™ 18-well TGX gels (BioRad; Cat# 5671034) using the Criterion™ (BioRad) Tris-glycine system at 160 V for 75 min. Proteins were transferred onto 0.2 μm Immun-Blot PVDF membranes by wet blotting at 100 V for 45 min at 4°C (BioRad). Uniform transfer of proteins was verified by reversible Ponceau S staining (0.1%w/v, 5% acetic acid; Sigma-Aldrich; Cat# P7170). The membrane was blocked 60 min, and then incubated with rabbit anti-Kir4.1 antibody overnight (1:1000 dilution; Alomone Labs; Cat# APC-035, RRID:AB_2040120), then washed and incubated with anti-rabbit HRP-conjugated secondary antibody (1:20000 dilution; GE Healthcare; Cat# NA934, RRID:AB_772206) for 60 min, washed and developed. Subsequently, the membrane was incubated in rabbit anti-α-tubulin (1:5000 dilution; Abcam; Cat# ab4074, RRID:AB_2288001) for 60 min followed by anti-rabbit HRP-conjugated secondary antibody for development of loading control bands.
Immunoreactive bands were detected by SuperSignal™ West Pico Chemiluminescent Substrate (Thermo Fisher Scientific; Cat#: 34580) on the ChemiDoc™ Touch Imaging System (BioRad) and bands quantified as arbitrary background-subtracted density units in Image Studio Lite (Ver 5.2, Licor Biosciences, Nebraska, USA). For Kir4.1, all immunoreactive bands were included in the analysis. Normalization was performed by dividing intensities of protein bands of interest with the normalizing control band intensity for their respective lane. Values are presented as percentage of the average WT values. The obtained values were transferred to SPSS Version 25 (SPSS, Chicago, IL) and compared using independent samples t-test. Data are presented as mean ± SEM and p < 0.05 was considered as significant.
Results
PCR analysis confirms successful deletion of Sntb1 and Sntb1/Snta1
By targeted gene deletion, we have generated a new line of mice that lacks β1-syntrophin. We analyzed the expression of Sntb1 gene, which encodes for β1-syntrophin, using total RNA isolated from eye and with primers specific for mouse Sntb1. The total RNA was subjected to reverse transcription and the cDNA obtained was used for PCR amplification. RNA extracted from β1-syn KO mice did not show any signal for Sntb1 (Fig. 1a, b). Similarly, RNA from α1-syn KO mice showed no signal for Snta1 (Fig. 1a). Neither gene was expressed in tissue from crossbred animals (α1-syn KO x β1-syn KO, Fig. 1a).
Figure 1: Gene expression analysis in β1-syn KO mice.
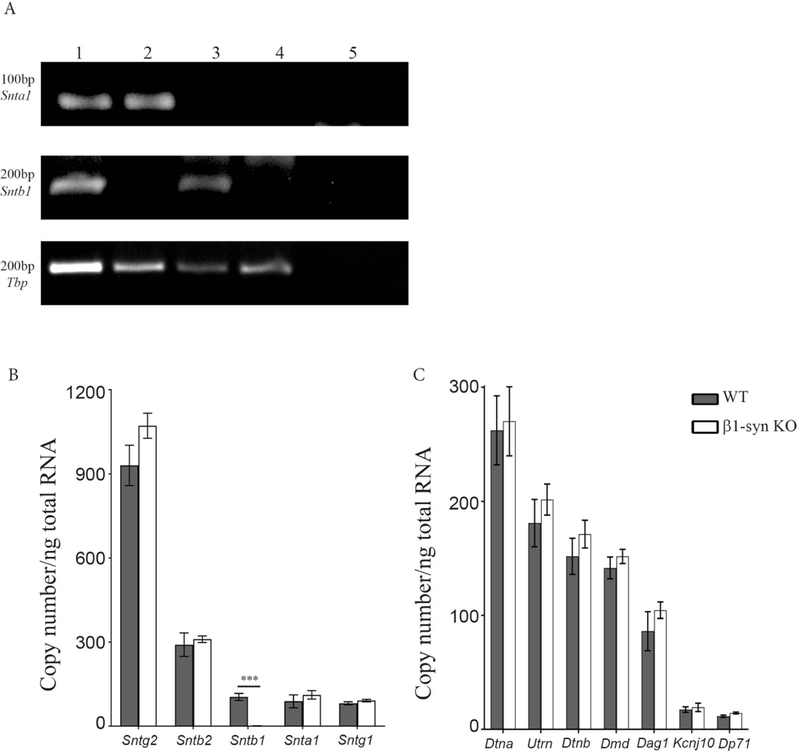
a) Representative DNA agarose gel electrophoresis showing the expression profile of Snta and Sntb in mouse eye samples. PCR products were generated using representative cDNA samples of WT (lane 1), β1-syn KO (lane 2), α1-syn KO (lane 3) and αβ1-syn KO (lane 4) as indicated above each lane on the gel. Lane 5 is the control for detecting genomic DNA contamination where the reverse transcription enzyme was excluded. Primers were tested for α1-syntrophin (top), β1-syntrophin (middle) and Tbp (bottom). TATA-box Binding Protein (Tbp) was used as a loading control across samples in the 40-cycle endpoint PCRs using Paq5000 DNA Polymerase (Agilent Genomics) and specific primers (Table 1). PCR product sizes in base pairs are shown to the left. b) Quantitative real time PCR analysis showed differential expression of syntrophin family of genes. Tbp was used as the normalization gene. We did not detect any signal for β1-syn KO when compared to WT (104±12 vs. 1.4±0.1 mean copy number/ng of total RNA). No statistical difference was observed in any of the other syntrophins between WT and β1-syn KO. The mean copy number was found to be highest for Sntg2, followed by Sntb2 where as Sntb1, Snta1 and Sntg1 had lower expression. Data presented as mean±SEM. ***p<0.001. c) Quantitative real time PCR analysis was performed on members of dystrophin associated protein complex. The following genes were tested to compare the expression levels between WT and β1-syn KO: full length Dystrophin (Dmd) and its shorter isoform (Dp71), Dystroglycan (Dag1), Dystrobrevin-alpha and beta (Dtna and Dtnb), Kir4.1 (Kcnj10) and Utrophin (Utrn). We did not find any statistical difference between the two genotypes. Data presented as mean±SEM.
Targeted deletion of Sntb1 does not affect total transcript levels of Kir4.1 or members of the DAP complex
To determine whether deletion of Sntb1 results in compensatory up- or downregulation of other syntrophins (Snta1, Sntb2, Sntg1, Sntg2), we performed quantitative PCR using gene specific primers on eye samples (Fig. 1b) from WT and β1-syn KO mice. We did not detect any changes in the transcript levels of the other members of the syntrophin family. In both genotypes, we found high expression of Sntg2, followed by Sntb2, while Snta1 and Sntg1 had lower expression.
Since syntrophins are part of the dystrophin associated protein (DAP) complex, we also looked at the gene expression levels of other members of this complex. We designed primers specific for full length Dystrophin (Dmd) and its short isoform (Dp71), as well as Dystroglycan (Dag1), Dystrobrevin-alpha and beta (Dtna and Dtnb) and Utrophin (Utrn). We did not detect any changes in the transcript levels of these genes when comparing WT and β1-syn KO mice (Fig. 1c). However, the Müller cells in the murine retina make up a small percentage of all retinal cell types (Andreas Reichenbach & Bringmann, 2010), and since some members of the DAP complex are also expressed in neurons, compensatory changes in gene expression in more abundant cell types may mask the effects in the glial population. No changes were observed in the total mRNA level of Kir4.1 (Fig. 1c).
β1-syntrophin is concentrated around retinal vessels and in the inner limiting membrane
Immunohistochemistry was performed using affinity purified antibodies directed against β1-syntrophin. This antibody has previously been tested and characterized (Bragg, Amiry-Moghaddam, Ottersen, Adams, & Froehner, 2006; Peters et al., 1997; Puwarawuttipanit et al., 2006). Immunofluorescence revealed distinct β1-syntrophin labeling around retinal vessels (Fig. 2a). Furthermore, immunolabeling was found in the innermost (subvitreal) layer of the retina corresponding to the inner limiting membrane. The β1-syntrophin antibody produced no specific signal in β1-syn KO mice (Fig. 2b). Moreover, qualitatively there were no obvious structural changes in the β1-syn KO retina as compared to WT.
Figure 2: Immunofluorescence localization of β1-syn in retina.

Sections of retina were stained using antibody against β1-syntrophin (Red). The β1-syntrophin labeling was concentrated at the perivascular (arrows) and in subvitreal endfoot domains (arrowheads on top). Lack of β1-syntrophin immunofluorescence can be seen in the retina of β1-syn KO. Nuclear staining is shown in blue. GCL, ganglion cell layer; IPL, inner plexiform layer; INL, inner nuclear layer; OPL, outer plexiform layer; ONL, outer nuclear layer. Scale bar=20μm.
Perivascular and subvitreal Kir4.1 is lost after β1 and αβ1-syntrophin knockout
Immunofluorescence
Previous studies (Nagelhus et al., 1999; Puwarawuttipanit et al., 2006) have shown that Kir4.1 is expressed in Müller cells throughout retina with particularly high concentrations in Müller cell processes encircling retinal vessels and abutting on corpus vitreum. Here we confirm this pattern of labeling (Fig. 3b, c; also see Supplement Fig. S1 and S2). Further, immunofluorescence analysis of retinae from β1- knockout showed a pronounced loss of perivascular Kir4.1 staining (Fig. 3e, f; also see Supplement Fig. S2). Radial processes and processes in the external plexiform layer retained Kir4.1 labeling after β1-syntrophin knockout. Similar observations were made in αβ1-syn KO retina (See Supplementary Figs. S1 and S2).
Figure 3: Immunofluorescence localization of Kir4.1 in retina.
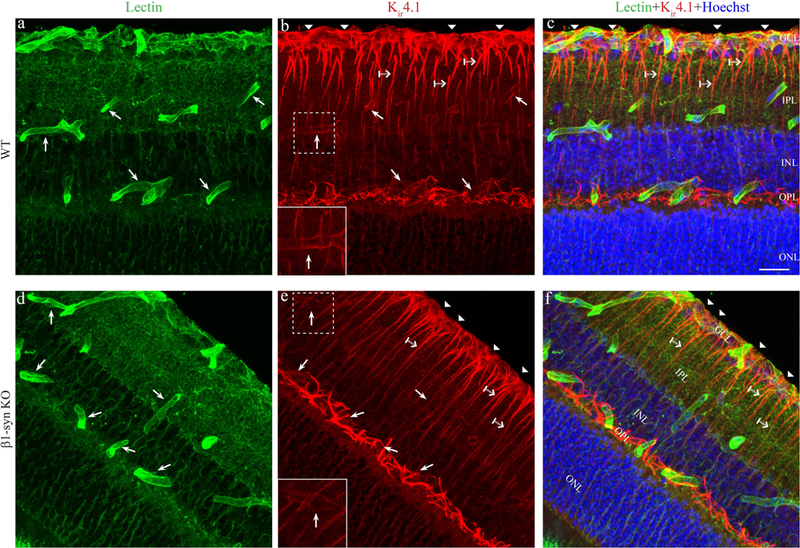
3D rendered confocal images showing the endothelial marker lectin (green) and Kir4.1 (red) immunofluorescence labeling in WT (panels a-c) and in β1-syn KO (panels d-f) mice. Kir4.1 is concentrated at the perivascular region (arrows) in WT animals (Fig.3b) and can be seen overlapping the vessel marker lectin when merged (Fig. 3c). Kir4.1 labeling is also found in the subvitreal endfoot domain (arrowhead in Fig. 3b and 3c). In mice lacking β1-syntrophin (Fig. 3e), Kir4.1 labeling is lacking around perivascular and subvitreal region compared to WT (compare Fig. 3e with 3b). Kir4.1 is retained in the non-perivascular regions of β1-syn KO (crossed arrow). Insets in 3b and 3e show higher magnification of the perivascular Kir4.1 labeling around the vessels shown in the stippled boxes. Nuclear staining is shown in blue. GCL, ganglion cell layer; IPL, inner plexiform layer; INL, inner nuclear layer; OPL, outer plexiform layer; ONL, outer nuclear layer. Scale bar=20μm.
Quantitative immunogold cytochemistry
Extending our observation from light microscopy, we performed a quantitative analysis of Kir4.1 localization by use of immunogold electron microscopy. Specificity of the Kir4.1 antibody was confirmed as incubation of retina samples from the Kir4.1 KO mice revealed only faint background labeling and quantitative analysis showed more than 90% loss of perivascular Kir4.1 labeling in the Kir4.1 KO mice compared to the WT (See Supplementary Fig. S3). Targeted deletion of β1-syntrophin caused a dramatic loss of perivascular Kir4.1 labeling (Fig. 4c). Perivascular Kir4.1 labeling was lost also in the double knockout animals (Fig. 4d), but was retained in mice with targeted deletion of α1-syntrophin (Fig. 4b). This was true for perivascular processes in each of the three layers that were analyzed (ganglion cell layer, and outer and inner plexiform layers). In WT animals, the latter two layers showed a higher linear density of Kir4.1 immunogold particles than the former layer (Fig. 5b).
Figure 4: Electron micrographs showing immunogold labeling for Kir4.1 in perivascular endfoot domain of Müller cell.
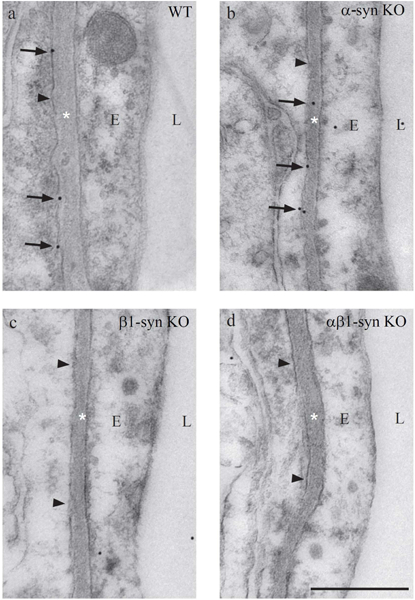
Immunogold labeling of Kir4.1 can be seen along the length of the perivascular endfoot process of Müller cells in WT mice (a). In mice lacking α1-syntrophin, the labeling is retained (b). Absence of perivascular Kir4.1 labeling is seen in β1-syn KO (c) and in αβ1-syn KO retinae (d). The arrowheads indicate the Müller cell endfoot domain facing the blood vessel. Scale bar=500nm; L, Lumen; E, Endothelium; *=Basement membrane.
Figure 5: Immunogold quantitation in different subregions of retina in WT, β1-syn KO and αβ1-syn KO mice.
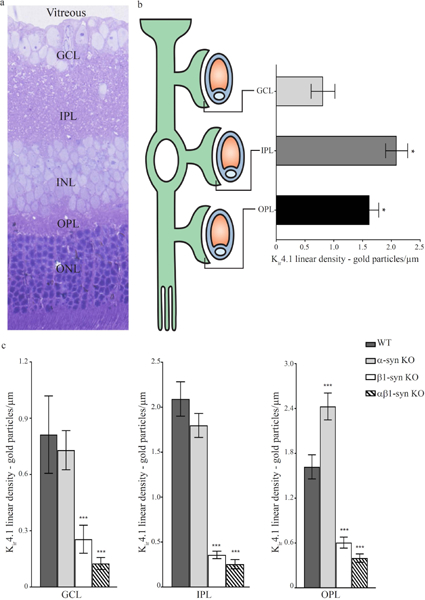
a) Toluidine blue staining of retina showing different layers. GCL, ganglion cell layer; IPL, inner plexiform layer; INL, inner nuclear layer; OPL, outer plexiform layer; ONL, outer nuclear layer.b) Schematic representation of a Müller cell enwrapping vessels in different layers of retina. Immunogold quantification revealed differential distribution of Kir4.1 labeling in perivascular regions of different retinal layers. Kir4.1 immunogold labeling in GCL was significantly lower than in IPL and OPL. Data presented as mean±SEM. *p<0.05.c) Quantitative analysis of immunogold labeling for Kir4.1 in different subregions of retina. In all three layers, there was a pronounced reduction of perivascular labeling of Kir4.1 in β1-syn KO, when compared with WT. Similarly, in mice lacking both α- and β1 syntrophin, there was a complete loss of Kir4.1 in perivascular domains while no loss of Kir4.1 was observed in mice lacking α1-syntrophin. Data presented as mean±SEM. ***p<0.001.
Targeted deletion of α1-syntrophin did not cause any loss of perivascular Kir4.1 (Fig. 5c). Indeed, in the outer plexiform layer, Müller cell endfeet showed an increased density of Kir4.1 immunogold particles following deletion of α1-syntrophin (Fig. 5c).
Mice lacking β1-syntrophin or both α- and β1-syntrophin showed a loss of Kir4.1 not only from perivascular membranes, but also from those Müller cell membranes that are apposed to the corpus vitreum (Fig. 6c, d). The loss was restricted to those membrane domains that are in direct contact with the subvitreal basal lamina. The discrete nature of this change explains why this was not obvious in the immunofluorescence preparations (Fig. 3b, e). Again, no significant change in Kir4.1 immunolabeling density was observed after α1-syn KO (Fig. 7).
Figure 6: Electron micrographs showing immunogold labeling for Kir4.1 in subvitreal endfoot domain.
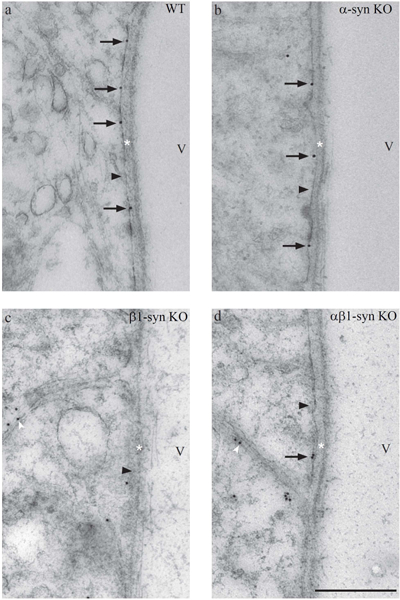
Immunogold labeling of Kir4.1 can be seen along the length of the subvitreal endfoot process in WT mice (a). In mice lacking α1-syntrophin, the labeling is retained (b). However, significant reduction in subvitreal Kir4.1 labeling is seen in β1-syn KO (c) and in αβ1-syn KO (d). Note that in β1-syn KO (c) and in αβ1-syn KO (d), the Kir4.1 immunogold labeling can be seen in the lateral domains (white arrowhead). The black arrowheads point to inner limiting membrane. Scale bar=500nm; V, Vitreous; *=Basement membrane.
Figure 7: Quantitative analysis of linear density of gold particles in subvitreal endfoot domain of Müller cells in retina of WT controls, β1-syn KO and αβ1-syn KO.
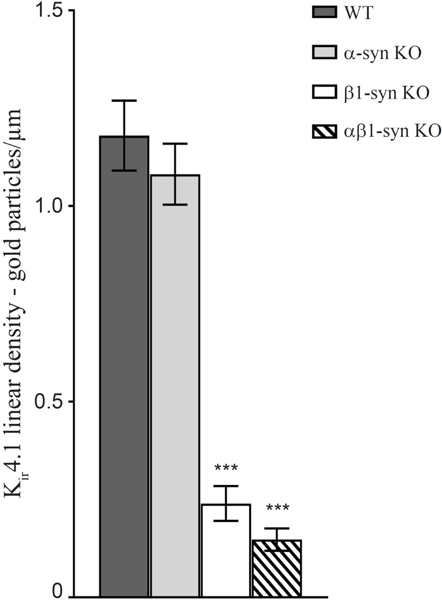
The immunogold density of Kir4.1 in α1-syn KO was not different from that of WT mice. We did not find any statistical difference between the two genotypes. However, in mice lacking β1-syntrophin and both α- and β1 syntrophin, there was a near complete loss of Kir4.1 in subvitreal endfood domain. Data presented as mean±SEM. ***p<0.001.
Total protein levels of Kir4.1 is unaltered after β1-syntrophin knockout
To determine whether the perivascular and subvitreal loss of Kir4.1 is due to a mislocalization, we performed Western blot analysis. Immunoblots from retinal protein lysates of WT and β1-syn KO mice showed three distinct Kir4.1 immunoreactive bands at ~40 kD (expected molecular weight for the monomer), ~130 kD and ~250 kD (Fig. 8a). The latter bands have been demonstrated in previous studies and may represent multimers of Kir4.1 protein (Olsen, Higashimori, Campbell, Hablitz, & Sontheimer, 2006). Semiquantitative densitometric analysis of each band separately, monomer and ~250 kD multimer bands combined or all the bands combined did not show any difference between the two genotypes (Fig. 8b). These results confirmed the quantitative PCR data showing that targeted deletion of β1-syntrophin does not lead to a reduction in the total protein level of Kir4.1.
Figure 8: Western blot analysis for Kir4.1 in WT controls and β1-syn KO retina.
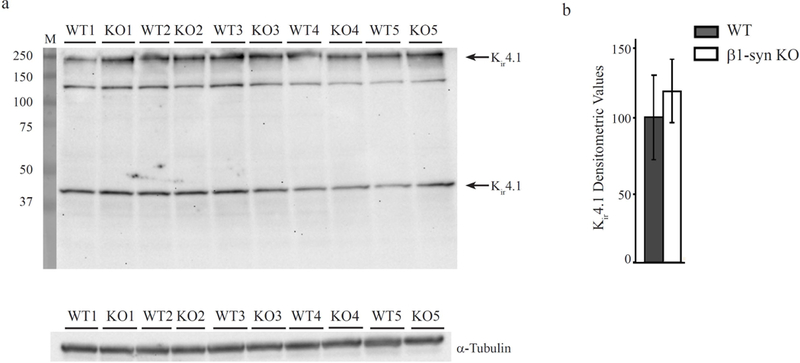
Immunoblots and quantitation of Kir4.1 tetramer and monomer protein bands in total protein lysates from WT and β1-syn KO retina (arrows in a). α-tubulin was used as the loading control. Densitometric values are expressed as the percentage of average WT controls (b). No statistically significant differences were observed between the two genotypes.
Discussion
Müller cells are a specialized class of glia that is essential for proper function of the retina and ion and volume homeostasis in particular. In a classical series of experiments, Newman et al discovered that the K+ conductance is unevenly distributed along the Müller cell plasma membrane, with a tenfold higher conductance in perivascular Müller cell processes than in Müller plasma membrane domains facing synaptic regions (Newman, 1984, 1985, 1987, 1993; Newman et al., 1984). This uneven distribution of K+ conductance is the basis for retinal K+ homeostasis. Specifically, excess K+ generated by synaptic activity is taken up along adjacent Müller cell membranes and then redistributed to perivascular spaces via the high K+ conductance in the Müller cell processes. This mode of redistribution of K+ is called K+ siphoning and is a special case of K+ spatial buffering (Kofuji & Newman, 2004).
K+ siphoning is mediated by inwardly rectifying K+ channels (Kir). Among several different Kir channels expressed in Müller cells, Kir4.1 is the principal channel involved in K+ buffering (Ishii et al., 1997; Kofuji et al., 2002; Kofuji et al., 2000). In perfect agreement with the physiological data referred to above, quantitative immunogold analyses revealed a higher density of Kir4.1 channels in Müller cell membranes apposed to blood vessels than in Müller cell membranes facing synaptic regions (Nagelhus et al., 1999). Double labeling experiments revealed a strict colocalization between Kir4.1 and the water channel AQP4, with both channels being enriched in perivascular and subvitreal membranes (Nagelhus et al., 1999). Thus, the Müller cells are highly polarized with respect to their function. Loss of functional polarization occurs following experimentally induced diabetes (Pannicke et al., 2006). Notably, retinas of diabetic animals show reduced Kir4.1 expression in perivascular Müller processes along with an impaired volume homeostasis (Pannicke et al., 2006).
Given the important physiological and pathophysiological roles of the perivascular pool of Kir4.1 it is essential to resolve the mechanism that keeps Kir4.1 enriched at this site, thus upholding the functional polarization of Müller cells. The key finding in the present study is that the perivascular and subvitreal enrichment of Kir4.1 depends on β1-syntrophin. Targeted deletion of β1-syntrophin led to a loss of endfoot Kir4.1 without changing the total level of Kir4.1 expression in the retina. This is consistent with a redistribution of Kir4.1 along the Müller cell plasma membrane. α1-syntrophin, in contrast, does not appear to be engaged in the anchoring of Kir4.1 in the retina. The slight increase in Kir4.1 immunolabeling in OPL membranes of α1-syn-KO mice is difficult to explain. The possibility should be considered that targeted deletion of α1-syntrophin significantly reduces the density of (unknown) α1-syntrophin dependent membrane proteins that normally compete with Kir4.1 for space in endfoot membranes. Alternatively, the enhanced Kir4.1 expression in the OPL of α1-syn KO mice could be of an indirect nature as there might be as-yet-unknown changes in neuronal proteins at OPL and consequently, changes neuronal function inducing Müller cell adaptation in OPL.
Literature is scant when it comes to the role of β1-syntrophin in brain and in physiology and pathophysiology in general (Ishitobi et al., 2014). The novel β1-syntrophin knockout line generated for the purpose of the present study will help us explore the functions of β1-syntrophin in brain as well as in other organs where it is expressed.
β1-syntrophin is a PDZ domain-containing member of DAP complex that is instrumental in orchestrating the protein assemblies in glial endfeet in brain and retina. The DAP complex includes a dystroglycan bridge that exhibits strong affinity to laminin (Blake, Weir, Newey, & Davies, 2002). Dystroglycan helps couple the DAP complex, including dystrophin and its interacting proteins, to the basal laminae associated with brain and retinal microvessels. This explains why the DAP complex is accumulated next to the basal laminae of retinal capillaries and subjacent to the subvitreal basal lamina. So far, five different syntrophins (α1, β1, β2, γ1 and γ2) have been identified and are encoded by different genes (Bhat, Adams, & Khanday, 2013). Each DAP complex contains up to four different syntrophins. Several different syntrophins are associated with the DAP complex in the CNS (Bragg et al., 2006). Among these, α1-syntrophin has been studied in much detail and has been found to serve as an important anchor of AQP4 in astrocyte endfeet in different brain regions (Amiry-Moghaddam, Otsuka, et al., 2003; Amiry-Moghaddam, Williamson, et al., 2003; Amiry-Moghaddam et al., 2004; Camassa et al., 2015; Hoddevik et al., 2016; Neely et al., 2001). We are the first to compare the overall expression pattern of different types of syntrophins in mouse retina at the mRNA level. As noted earlier, α1- and β1-syntrophins are mainly expressed in the glial cells, while β2-syntrophin is predominantly present in the OPL, possibly in the neuronal synapses. Furthermore, immunostaining has revealed γ2-syntrophin to be expressed in neurons. Although we detected the presence of γ1-syntrophin mRNA, immunostaining has failed to detect its presence in the retina (Puwarawuttipanit et al., 2006). The present study brings β1-syntrophin to the fore as another syntrophin that is important for orchestrating the protein complexes in glial endfeet.
Previous studies have shown that genetic deletion of dystrophin Dp71 also results in perivascular loss of Kir4.1 in retina (Fort et al., 2008; Sene et al., 2009). Our study complements and advances these earlier observations by identifying the mechanism by which Kir4.1 is attached to the DAP complex. Our findings indicate that the β1-syntrophin knockout line presently used will serve as an important tool for exploring the functional role of the perivascular Kir4.1 pool, in the same way as the α1-syntrophin knockout line has provided fundamental new insight in the role of perivascular AQP4 in the brain (Amiry-Moghaddam, Otsuka, et al., 2003; Amiry-Moghaddam, Williamson, et al., 2003). Our findings also call for future studies of β1-syntrophin in retinal disease. Thus, reduction of K+ conductance along with loss of polarized Kir4.1 expression have been observed in experimental models of several types of retinal pathology (Iandiev et al., 2006; Pannicke et al., 2004; Pannicke et al., 2005). Changes in β1-syntrophin expression might be at the root of these observations. This hypothesis should be explored in future studies.
Supplementary Material
Main points.
Inwardly rectifying K+ channel Kir4.1 is concentrated at the perivascular and subvitreal Müller cell endfeet
Targeted deletion of β1-syntrophin leads to significant loss of Kir4.1 at the Müller cell endfeet without changing its expression levels
Acknowledgements
The authors wish to thank the funding provided by EU through project FP7-PEOPLE-2012-ITN 316832-OLIMPIA, and NIH NS14871. We are grateful to Bjørg Riber, Karen-Marie Gujord, Grazyna Babinska and Bashir Hakim for technical assistance, Prof. Emeritus Finn-Mogens Haug and Dr. Paul Johannes Helm for assistance with analySIS program and to Gunnar F. Lothe for the artwork.
Footnotes
Conflict of interest
Authors declare no competing interest.
References
- Adams ME, Butler MH, Dwyer TM, Peters MF, Murnane AA, & Froehner SC (1993). Two forms of mouse syntrophin, a 58 kd dystrophin-associated protein, differ in primary structure and tissue distribution. Neuron, 11(3), 531–540. [DOI] [PubMed] [Google Scholar]
- Adams ME, Kramarcy N, Krall SP, Rossi SG, Rotundo RL, Sealock R, & Froehner SC (2000). Absence of α-Syntrophin Leads to Structurally Aberrant Neuromuscular Synapses Deficient in Utrophin. The Journal of Cell Biology, 150(6), 1385–1398. doi: 10.1083/jcb.150.6.1385 [DOI] [PMC free article] [PubMed] [Google Scholar]
- Alessi A, Bragg AD, Percival JM, Yoo J, Albrecht DE, Froehner SC, & Adams ME (2006). gamma-Syntrophin scaffolding is spatially and functionally distinct from that of the alpha/beta syntrophins. Exp Cell Res, 312(16), 3084–3095. doi: 10.1016/j.yexcr.2006.06.019 [DOI] [PubMed] [Google Scholar]
- Amiry-Moghaddam M, Otsuka T, Hurn PD, Traystman RJ, Haug FM, Froehner SC, . . . Bhardwaj A (2003). An alpha-syntrophin-dependent pool of AQP4 in astroglial end-feet confers bidirectional water flow between blood and brain. Proc Natl Acad Sci U S A, 100(4), 2106–2111. doi: 10.1073/pnas.0437946100 [DOI] [PMC free article] [PubMed] [Google Scholar]
- Amiry-Moghaddam M, & Ottersen OP (2013). Immunogold cytochemistry in neuroscience. Nat Neurosci, 16(7), 798–804. doi: 10.1038/nn.3418 [DOI] [PubMed] [Google Scholar]
- Amiry-Moghaddam M, Williamson A, Palomba M, Eid T, de Lanerolle NC, Nagelhus EA, . . . Ottersen OP (2003). Delayed K+ clearance associated with aquaporin-4 mislocalization: phenotypic defects in brains of alpha-syntrophin-null mice. Proc Natl Acad Sci U S A, 100(23), 13615–13620. doi: 10.1073/pnas.2336064100 [DOI] [PMC free article] [PubMed] [Google Scholar]
- Amiry-Moghaddam M, Xue R, Haug FM, Neely JD, Bhardwaj A, Agre P, . . . Ottersen OP (2004). Alpha-syntrophin deletion removes the perivascular but not endothelial pool of aquaporin-4 at the blood-brain barrier and delays the development of brain edema in an experimental model of acute hyponatremia. FASEB J, 18(3), 542–544. doi: 10.1096/fj.03-0869fje [DOI] [PubMed] [Google Scholar]
- Bhat HF, Adams ME, & Khanday FA (2013). Syntrophin proteins as Santa Claus: role(s) in cell signal transduction. Cell Mol Life Sci, 70(14), 2533–2554. doi: 10.1007/s00018-012-1233-9 [DOI] [PMC free article] [PubMed] [Google Scholar]
- Blake DJ, Weir A, Newey SE, & Davies KE (2002). Function and genetics of dystrophin and dystrophin-related proteins in muscle. Physiol Rev, 82(2), 291–329. doi: 10.1152/physrev.00028.2001 [DOI] [PubMed] [Google Scholar]
- Bragg AD, Amiry-Moghaddam M, Ottersen OP, Adams ME, & Froehner SC (2006). Assembly of a perivascular astrocyte protein scaffold at the mammalian blood-brain barrier is dependent on alpha-syntrophin. Glia, 53(8), 879–890. doi: 10.1002/glia.20347 [DOI] [PubMed] [Google Scholar]
- Bringmann A, Pannicke T, Grosche J, Francke M, Wiedemann P, Skatchkov SN, . . . Reichenbach A (2006). Muller cells in the healthy and diseased retina. Prog Retin Eye Res, 25(4), 397–424. doi: 10.1016/j.preteyeres.2006.05.003 [DOI] [PubMed] [Google Scholar]
- Camassa LM, Lunde LK, Hoddevik EH, Stensland M, Boldt HB, De Souza GA, . . . Amiry-Moghaddam M. (2015). Mechanisms underlying AQP4 accumulation in astrocyte endfeet. Glia. doi: 10.1002/glia.22878 [DOI] [PubMed] [Google Scholar]
- Connors NC, & Kofuji P (2006). Potassium channel Kir4.1 macromolecular complex in retinal glial cells. Glia, 53(2), 124–131. doi: 10.1002/glia.20271 [DOI] [PubMed] [Google Scholar]
- Fort PE, Sene A, Pannicke T, Roux MJ, Forster V, Mornet D, . . . Rendon A. (2008). Kir4.1 and AQP4 associate with Dp71- and utrophin-DAPs complexes in specific and defined microdomains of Muller retinal glial cell membrane. Glia, 56(6), 597–610. doi: 10.1002/glia.20633 [DOI] [PubMed] [Google Scholar]
- Harris BZ, & Lim WA (2001). Mechanism and role of PDZ domains in signaling complex assembly. J Cell Sci, 114(Pt 18), 3219–3231. [DOI] [PubMed] [Google Scholar]
- Hassan I, Luo Q, Majumdar S, Dominguez IIJM, Busik JV, & Bhatwadekar AD (2017). Tumor Necrosis Factor Alpha (TNF-α) Disrupts Kir4.1 Channel Expression Resulting in Müller Cell Dysfunction in the Retina. Investigative Ophthalmology & Visual Science, 58(5), 2473–2482. doi: 10.1167/iovs.16-20712 [DOI] [PubMed] [Google Scholar]
- Hibino H, Fujita A, Iwai K, Yamada M, & Kurachi Y (2004). Differential assembly of inwardly rectifying K+ channel subunits, Kir4.1 and Kir5.1, in brain astrocytes. J Biol Chem, 279(42), 44065–44073. doi: 10.1074/jbc.M405985200 [DOI] [PubMed] [Google Scholar]
- Hoddevik EH, Khan FH, Rahmani S, Ottersen OP, Boldt HB, & Amiry-Moghaddam M (2016). Factors determining the density of AQP4 water channel molecules at the brain-blood interface. Brain Struct Funct. doi: 10.1007/s00429-016-1305-y [DOI] [PMC free article] [PubMed] [Google Scholar]
- Horio Y, Hibino H, Inanobe A, Yamada M, Ishii M, Tada Y, . . . Kurachi Y (1997). Clustering and Enhanced Activity of an Inwardly Rectifying Potassium Channel, Kir4.1, by an Anchoring Protein, PSD-95/SAP90. Journal of Biological Chemistry, 272(20), 12885–12888. doi: 10.1074/jbc.272.20.12885 [DOI] [PubMed] [Google Scholar]
- Iandiev I, Pannicke T, Biedermann B, Wiedemann P, Reichenbach A, & Bringmann A (2006). Ischemia-reperfusion alters the immunolocalization of glial aquaporins in rat retina. Neurosci Lett, 408(2), 108–112. doi: 10.1016/j.neulet.2006.08.084 [DOI] [PubMed] [Google Scholar]
- Ishii M, Horio Y, Tada Y, Hibino H, Inanobe A, Ito M, . . . Kurachi Y. (1997). Expression and clustered distribution of an inwardly rectifying potassium channel, KAB-2/Kir4.1, on mammalian retinal Muller cell membrane: their regulation by insulin and laminin signals. J Neurosci, 17(20), 7725–7735. [DOI] [PMC free article] [PubMed] [Google Scholar]
- Ishitobi Y, Inoue A, Aizawa S, Masuda K, Ando T, Kawano A, . . . Akiyoshi J. (2014). Association of microcephalin 1, syntrophin-beta 1, and other genes with automatic thoughts in the Japanese population. Am J Med Genet B Neuropsychiatr Genet, 165B(6), 492–501. doi: 10.1002/ajmg.b.32252 [DOI] [PubMed] [Google Scholar]
- Katoozi S, Skauli N, Rahmani S, Camassa LMA, Boldt HB, Ottersen OP, & Amiry-Moghaddam M (2017). Targeted deletion of Aqp4 promotes the formation of astrocytic gap junctions. Brain Struct Funct, 222(9), 3959–3972. doi: 10.1007/s00429-017-1448-5 [DOI] [PubMed] [Google Scholar]
- Kim MJ, Whitehead NP, Bible KL, Adams ME, & Froehner SC (2019). Mice lacking alpha-, beta1- and beta2-syntrophins exhibit diminished function and reduced dystrophin expression in both cardiac and skeletal muscle. Hum Mol Genet, 28(3), 386–395. doi: 10.1093/hmg/ddy341 [DOI] [PMC free article] [PubMed] [Google Scholar]
- Kofuji P, Biedermann B, Siddharthan V, Raap M, Iandiev I, Milenkovic I, . . . Reichenbach A. (2002). Kir potassium channel subunit expression in retinal glial cells: implications for spatial potassium buffering. Glia, 39(3), 292–303. doi: 10.1002/glia.10112 [DOI] [PubMed] [Google Scholar]
- Kofuji P, Ceelen P, Zahs KR, Surbeck LW, Lester HA, & Newman EA (2000). Genetic inactivation of an inwardly rectifying potassium channel (Kir4.1 subunit) in mice: phenotypic impact in retina. J Neurosci, 20(15), 5733–5740. [DOI] [PMC free article] [PubMed] [Google Scholar]
- Kofuji P, & Newman EA (2004). Potassium buffering in the central nervous system. Neuroscience, 129(4), 1045–1056. doi: 10.1016/j.neuroscience.2004.06.008 [DOI] [PMC free article] [PubMed] [Google Scholar]
- Lee HJ, & Zheng JJ (2010). PDZ domains and their binding partners: structure, specificity, and modification. Cell Commun Signal, 8, 8. doi: 10.1186/1478-811X-8-8 [DOI] [PMC free article] [PubMed] [Google Scholar]
- Lunde LK, Camassa LM, Hoddevik EH, Khan FH, Ottersen OP, Boldt HB, & Amiry-Moghaddam M (2015). Postnatal development of the molecular complex underlying astrocyte polarization. Brain Struct Funct, 220(4), 2087–2101. doi: 10.1007/s00429-014-0775-z [DOI] [PMC free article] [PubMed] [Google Scholar]
- Mathiisen TM, Nagelhus EA, Jouleh B, Torp R, Frydenlund DS, Mylonakou M-N, . . . Ottersen OP (2006). Postembedding Immunogold Cytochemistry of Membrane Molecules and Amino Acid Transmitters in the Central Nervous System In Zaborszky L, Wouterlood FG, & Lanciego JL (Eds.), Neuroanatomical Tract-Tracing 3: Molecules, Neurons, and Systems (pp. 72–108). Boston, MA: %@ 978–0-387–28942-7: Springer US. [Google Scholar]
- Nagelhus EA, Horio Y, Inanobe A, Fujita A, Haug FM, Nielsen S, . . . Ottersen OP. (1999). Immunogold evidence suggests that coupling of K+ siphoning and water transport in rat retinal Muller cells is mediated by a coenrichment of Kir4.1 and AQP4 in specific membrane domains. Glia, 26(1), 47–54. doi:Doi [DOI] [PubMed] [Google Scholar]
- Nagelhus EA, Veruki ML, Torp R, Haug FM, Laake JH, Nielsen S, . . . Ottersen OP. (1998). Aquaporin-4 water channel protein in the rat retina and optic nerve: polarized expression in Muller cells and fibrous astrocytes. J Neurosci, 18(7), 2506–2519. [DOI] [PMC free article] [PubMed] [Google Scholar]
- Neely JD, Amiry-Moghaddam M, Ottersen OP, Froehner SC, Agre P, & Adams ME (2001). Syntrophin-dependent expression and localization of Aquaporin-4 water channel protein. Proc Natl Acad Sci U S A, 98(24), 14108–14113. doi: 10.1073/pnas.241508198 [DOI] [PMC free article] [PubMed] [Google Scholar]
- Newman EA (1984). Regional specialization of retinal glial cell membrane. Nature, 309(5964), 155–157. [DOI] [PMC free article] [PubMed] [Google Scholar]
- Newman EA (1985). Membrane physiology of retinal glial (Muller) cells. J Neurosci, 5(8), 2225–2239. [DOI] [PMC free article] [PubMed] [Google Scholar]
- Newman EA (1987). Distribution of potassium conductance in mammalian Muller (glial) cells: a comparative study. J Neurosci, 7(8), 2423–2432. [PMC free article] [PubMed] [Google Scholar]
- Newman EA (1993). Inward-rectifying potassium channels in retinal glial (Muller) cells. J Neurosci, 13(8), 3333–3345. [DOI] [PMC free article] [PubMed] [Google Scholar]
- Newman EA, Frambach DA, & Odette LL (1984). Control of extracellular potassium levels by retinal glial cell K+ siphoning. Science, 225(4667), 1174–1175. [DOI] [PMC free article] [PubMed] [Google Scholar]
- Olsen ML, Higashimori H, Campbell SL, Hablitz JJ, & Sontheimer H (2006). Functional expression of Kir4.1 channels in spinal cord astrocytes. Glia, 53(5), 516–528. doi: 10.1002/glia.20312 [DOI] [PMC free article] [PubMed] [Google Scholar]
- Pannicke T, Iandiev I, Uckermann O, Biedermann B, Kutzera F, Wiedemann P, . . . Bringmann A. (2004). A potassium channel-linked mechanism of glial cell swelling in the postischemic retina. Mol Cell Neurosci, 26(4), 493–502. doi: 10.1016/j.mcn.2004.04.005 [DOI] [PubMed] [Google Scholar]
- Pannicke T, Iandiev I, Wurm A, Uckermann O, vom Hagen F, Reichenbach A, . . . Bringmann A. (2006). Diabetes alters osmotic swelling characteristics and membrane conductance of glial cells in rat retina. Diabetes, 55(3), 633–639. [DOI] [PubMed] [Google Scholar]
- Pannicke T, Uckermann O, Iandiev I, Wiedemann P, Reichenbach A, & Bringmann A (2005). Ocular inflammation alters swelling and membrane characteristics of rat Muller glial cells. J Neuroimmunol, 161(1–2), 145–154. doi: 10.1016/j.jneuroim.2005.01.003 [DOI] [PubMed] [Google Scholar]
- Peters MF, Adams ME, & Froehner SC (1997). Differential association of syntrophin pairs with the dystrophin complex. J Cell Biol, 138(1), 81–93. [DOI] [PMC free article] [PubMed] [Google Scholar]
- Puwarawuttipanit W, Bragg AD, Frydenlund DS, Mylonakou MN, Nagelhus EA, Peters MF, . . . Amiry-Moghaddam M. (2006). Differential effect of alpha-syntrophin knockout on aquaporin-4 and Kir4.1 expression in retinal macroglial cells in mice. Neuroscience, 137(1), 165–175. doi: 10.1016/j.neuroscience.2005.08.051 [DOI] [PubMed] [Google Scholar]
- Reichenbach A, & Bringmann A (2010). Introduction. In Reichenbach A & Bringmann A (Eds.), Müller Cells in the Healthy and Diseased Retina (pp. 1–33). New York, NY: Springer New York. [Google Scholar]
- Reichenbach A, & Bringmann A (2013). New functions of Muller cells. Glia, 61(5), 651–678. doi: 10.1002/glia.22477 [DOI] [PubMed] [Google Scholar]
- Schindelin J, Arganda-Carreras I, Frise E, Kaynig V, Longair M, Pietzsch T, . . . Cardona A. (2012). Fiji: an open-source platform for biological-image analysis. Nat Methods, 9(7), 676–682. doi: 10.1038/nmeth.2019 [DOI] [PMC free article] [PubMed] [Google Scholar]
- Sene A, Tadayoni R, Pannicke T, Wurm A, El Mathari B, Benard R, . . . Rendon A. (2009). Functional implication of Dp71 in osmoregulation and vascular permeability of the retina. PLoS One, 4(10), e7329. doi: 10.1371/journal.pone.0007329 [DOI] [PMC free article] [PubMed] [Google Scholar]
- Sheng M, & Sala C (2001). PDZ domains and the organization of supramolecular complexes. Annu Rev Neurosci, 24, 1–29. doi: 10.1146/annurev.neuro.24.1.1 [DOI] [PubMed] [Google Scholar]
- Takumi T, Ishii T, Horio Y, Morishige KI, Takahashi N, Yamada M, . . . Kurachi Y. (1995). A Novel ATP-dependent Inward Rectifier Potassium Channel Expressed Predominantly in Glial Cells. Journal of Biological Chemistry, 270(27), 16339–16346. doi: 10.1074/jbc.270.27.16339 [DOI] [PubMed] [Google Scholar]
- Zhang Y, Xu G, Ling Q, & Da C (2011). Expression of aquaporin 4 and Kir4.1 in diabetic rat retina: treatment with minocycline. J Int Med Res, 39(2), 464–479. doi: 10.1177/147323001103900214 [DOI] [PubMed] [Google Scholar]
Associated Data
This section collects any data citations, data availability statements, or supplementary materials included in this article.


