

Abstract
Using high-resolution resting state fMRI, the present study tested the hypothesis that ABCA7 genetic risk differentially affects intra-medial temporal lobe (MTL) functional connectivity between MTL subfields, versus internetwork connectivity of the MTL with the medial prefrontal cortex (mPFC), in non-demented older African Americans. Although the association of ABCA7 risk variants with Alzheimer’s disease (AD) has been confirmed worldwide, its effect size on the relative odds of being diagnosed with AD is significantly higher in African Americans. However, little is known about the neural correlates of cognitive function in older African Americans and how they relate to AD risk conferred by ABCA7. In a case-control fMRI study of 36 healthy African Americans, we observed ABCA7 related impairments in behavioral generalization that was mediated by dissociation in entorhinal cortex (EC) resting state functional connectivity. Specifically, ABCA7 risk variant was associated with EC-hippocampus hyper-synchronization and EC-mPFC hypo-synchronization. Carriers of the risk genotype also had a significantly smaller anterolateral EC (alEC), despite our finding no group differences on standardized neuropsychological tests. Our findings suggest a model where impaired cortical connectivity leads to a more functionally isolated EC at rest, which translates into aberrant EC-hippocampus hyper-synchronization resulting in generalization deficits. While we cannot identify the exact mechanism underlying the observed alterations in EC structure and network function, considering the relevance of Aβ in ABCA7 related AD pathogenesis, the results of our study may reflect the synergistic reinforcement between amyloid and tau pathology in the EC, which significantly increases tau-induced neuronal loss and accelerates synaptic alterations. Finally, our results add to a growing literature suggesting that generalization of learning may be a useful tool for assessing the mild cognitive deficits seen in the earliest phases of prodromal AD, even before the more commonly reported deficits in episodic memory arise.
Keywords: ABCA7, Entorhinal Cortex, High-resolution fMRI functional connectivity, Alzheimer’s disease, African American
1.0. INTRODUCTION
Multiple studies have shown qualitative and quantitative differences in Alzheimer’s disease (AD) between African Americans and Caucasians. At the population level, the prevalence of AD dementia is nearly doubled in African Americans compared with Caucasians (Tang et al., 2001; Alzheimer’s Association, 2018). Cognitively, African Americans with AD are more likely than Caucasians to have a slower decline (Barnes et al., 2005). The causes of this health disparity in AD are not sufficiently understood. A recent study examining racial differences in cerebrospinal fluid (CSF) and structural magnetic resonance imaging (MRI) biomarkers of AD in an elderly cohort, found that despite comparable CSF Aβ42 levels, white matter hyperintensity (WMH) volume, and hippocampal volume, the same degree of WMH had a greater impact on cognition in African Americans as compared to Caucasians (Howell et al., 2017). Since WMH is a marker of cerebrovascular disease, it may be a mediating mechanism in the association between cognitive deficits and the risk factors that cause vascular dysfunction.
One such factor known to contribute to vascular dysfunction and potentially to cognition as well, is ABCA7 gene expression, which has been associated with AD via the dysregulation of lipid metabolism (Zhao et al., 2015; Aikawa et al., 2018). ABCA7 is a member of the highly conserved superfamily of ATP-binding cassette (ABC) transporters which function to regulate the homeostasis of phospholipids and cholesterol in the central nervous system and peripheral tissues. It is expressed in a variety of tissues/organs, including the brain, as well as, blood cells, and, data from several GWAS studies indicate that ABCA7 is a genetic risk factor for late-onset AD (Hollingworth et al., 2011; Kamboh et al., 2012; Reitz et al., 2013; Beecham et al., 2014; Liu et al., 2014). Studies to date have mainly implicated two possible mechanisms whereby ABCA7 loss-of-function contributes to AD pathology. First, ABCA7 facilitates amyloid precursor protein (APP) processing and increases amyloid-β (Aβ) deposition in mouse models (Satoh et al., 2015; Sakae et al., 2016). Second, ABCA7 critically regulates phagocytic function in macrophages, contributing to immune responses along with the host defense system (Tanaka et al., 2011), and since microglia are the resident macrophages of the central nervous system (Brown and Neher, 2014), ABCA7 has also been found to mediate microglial phagocytosis of Aβ (Fu et al., 2016). Hence, Aikawa et al. (2018) posit that ABCA7 dysregulation may influence the properties of brain cell types, in particular neurons and microglia, by disturbing brain lipid homeostasis, and these alterations likely facilitate APP processing and suppression of cellular Aβ clearance, contributing to AD development.
Three common ABCA7 loci have been confirmed to increase the risk of AD, but the associations vary among different races. ABCA7 SNP (single nucleotide polymorphism) rs115550680 is linked to the development of late-onset AD in African Americans with an effect size (OR = 1.79; 70%-80% increase in risk) that is comparable to the effect size of APOE ε4 (Reitz et al., 2013). In contrast, the two ABCA7 variants (rs3752246; OR = 1.15 and rs3764650; OR = 1.23, ~10%-20% increase in risk) identified as susceptibility loci for AD in Caucasians have significantly lower effect sizes (Hollingworth et al., 2011; Naj et al., 2011). Hence, increasing evidence indicates that the ABCA7 gene confers greater AD risk in African Americans. While the ABCA7 variants implicated in Caucasians (rs3752246 and rs3764650) are associated with changes in amyloid deposition (Shulman et al., 2013; Bamji-Mirza et al., 2016) and lipid metabolism (Giri et al., 2016; Li et al., 2017), emerging research on the functional consequences of rs115550680 (significant in African Americans) is relatively sparse. However, rs115550680 in an African American cohort was found to be in linkage disequilibrium (LD) with rs3752246 and rs3764650 in a Caucasian sample (Reitz et al., 2013), implying a common underlying mechanism. Furthermore, there are differences in minor allele frequency (MAF) and LD patterns between ethnic groups; rs115550680 has MAF of 7% in African Americans, whereas it is monomorphic on the non-risk minor “A” allele in Caucasians (Reitz et al., 2013; Machiela and Chanock, 2015). Additionally, within the African American population the three ABCA7 variants are not in LD with one another (Machiela and Chanock, 2015), indicating that they are not linked and occur independently of each other. This further supports the notion that while there may be a common underlying mechanism, distinct alleles confer AD risk in different ethnicities with variable impact on protein structure or function. Consistent with this, rs115550680 was found to be in LD with a 44-base pair deletion (rs142076058) in ABCA7 that is associated with AD in individuals of African ancestry (Cukier et al., 2016). This deletion is rare in Caucasians but relatively common in African Americans and confers AD risk by interfering with the transportation of lipids and increased Aβ brain levels (Cukier et al., 2016). Therefore, ABCA7 rs115550680 may be an ethnic-specific risk variant that contributes to AD in African Americans through APP processing and suppression of Aβ clearance. As such, in African Americans, this ABCA7 risk variant (rs115550680) may have consequences for neural network function along pathways affected by amyloid deposition.
ABCA7 risk variants have been associated with well-established AD biomarkers, namely cortical and hippocampal atrophy in cognitively normal and mild cognitive impairment (MCI) individuals (Ramirez et al., 2016), as well as, with memory decline in MCI and late-onset AD patients (Carrasquillo et al., 2015). Hence, while ABCA7 is possibly responsible for both the development and progression of AD, the precise neural systems or networks through which it may exert its AD related effects remain unknown. However, considering the relevance of Aβ in the pathogenesis of AD through ABCA7 expression, it seems likely that ABCA7 related neuronal dysfunction manifests in early Aβ accumulating brain regions and propagates through synaptically connected neural networks. A recent study on ADNI and BioFINDER cohorts showed that Aβ accumulation preferentially starts in several of the core regions of the default mode network (DMN), including the orbitofrontal cortex (OFC), an area within the medial prefrontal cortex (mPFC) (Palmqvist et al., 2017). Furthermore, the earliest Aβ accumulation was associated with hypo-connectivity within the DMN (Palmqvist et al., 2017). Consistent with this, several studies have reported reduced functional connectivity among major default mode network (DMN) nodes in aging (Andrews-Hanna et al., 2007; Damoiseaux et al., 2007), AD (Greicius et al., 2004; Wang et al., 2006; Sperling et al., 2010) and in asymptomatic APOE e4 carriers at increased risk of developing AD (Fleisher et al., 2009).
Another core DMN node, the MTL is one of the earliest brain regions where tau tangles aggregate, and its sub-regions show a selective topography of pathological involvement during early AD (Braak and Braak, 1991). The formation of tau neurofibrillary tangles is first seen in the transentorhinal and entorhinal cortex (Braak and Braak, 1991, 1997) followed by the dentate gyrus (DG) and CA3 subfield in the hippocampus (Leal and Yassa, 2018). Although their pathological relationship remains unclear (Mann and Hardy, 2013), MTL tau is considerably increased in normal subjects with cortical Aβ (Braak et al., 2011; Sperling et al., 2014). Furthermore, Song et al. (2015) showed that in cognitively normal elderly subjects cortical Aβ load was related to disrupted resting state functional connectivity within the MTL. Hence, Aβ plaques may play a key role in facilitating tauopathy in the MTL, and therefore lead to disrupted functional connectivity in the MTL circuitry. As such, the function of ABCA7 in AD may be explained more comprehensively as Aβ facilitated tauopathy (Hardy and Selkoe, 2002), such that, as Aβ deposition increases in cortical DMN nodes, it facilitates concurrent accumulation of tau tangles in MTL, via reciprocal connections through the entorhinal cortex (Pooler et al., 2015).
As such, the cortico-MTL circuit within the DMN may be the neural network underlying ABCA7 related AD pathology. Measures of functional connectivity obtained within specific sub-regions of MTL, and between MTL subfields and cortical DMN regions may potentially be more sensitive to early disease stages. In MCI patients, studies found increased connectivity within the MTL, between entorhinal cortex and subregions of the MTL (Das et al., 2013), and intra-hippocampal connectivity (Pasquini et al., 2015), which was associated with impaired memory. These studies also reported decreased connectivity of the MTL from other cortical nodes of the DMN (Das et al., 2013; Pasquini et al., 2015). In nondemented elderly, Salami et al. (2014) found age-related elevation of connectivity between left and right hippocampus along with attenuated hippocampal–prefrontal cortex connectivity, which was associated with lower cross-sectional episodic memory performance and declining longitudinal memory performance over 20 years.
In the present study, we tested the hypothesis that in non-demented African Americans, ABCA7 rs115550680 risk variant differentially affects intra-MTL functional connectivity between MTL subfields, versus inter-node connectivity between MTL and the mPFC, a major cortical DMN region. Consistent with previously noted results, we expected to observe increased connectivity within the MTL. We further predicted that this increase would be accompanied by decreases in internetwork connectivity of the MTL with mPFC. To constrain interpretations of this dissociation in functional connectivity, we related it to cognitive performance on a concurrent discrimination and generalization task (Myers et al., 2002), previously known to depend on MTL function (Myers et al., 2002, 2008; Johnson et al., 2008). It is a two-phase task in which participants initially learn a series of visual discriminations and are then tested on their ability to generalize when stimulus information changes. Performance on the generalization phase of the task distinguished between hippocampal-atrophied and non-atrophied individuals, even though standard tests, such as delayed paragraph recall, did not show this distinction (Myers et al., 2002, 2008). Conversely, in healthy aging, there were no deficits in those aged 40-75, but performance was impaired for those older than 75 (Krishna et al., 2012), likely reflecting preserved MTL function until advanced old age (Shing et al., 2011). Hence, as this task selectively engages the MTL, its correlation with cortico-MTL connectivity would elucidate the functional consequences of genetic risk related neuronal network alterations.
2.0. METHODS
2.1. Participants
Participants in this study were recruited through the African-American Brain Health Initiative: A University-Community Partnership (AABHI) at Rutgers University-Newark. Created in 2006, the AABHI partners with community-based organizations to promote brain health literacy, Alzheimer’s awareness, brain-healthy lifestyle choices, and participation in brain research among older African Americans in and around Newark, New Jersey. The research participants recruited to our study came primarily from long-standing partnerships with local churches; senior centers; city, county, and state offices for health and aging; as well as from outreach to public house and other federally-subsidized low-income housing sites. Our outreach and research efforts are informed by community input from the AABHI Community Advisory Board comprised of over a dozen community leaders from local community organizations (see Acknowledgments at end for a list of members and their affiliations). For additional details on our community engagement, outreach, and recruitment strategies, see www.brainhealth.rutgers.edu as well as Gluck, Shaw, & Hill (In Press).
From a larger parent study of 60 individuals, participants in the present study were selected for analysis in a case-control matched design. Of the parent sample, 18 individuals were carriers of ABCA7 rs115550680 “G” allele, which is the strongest AD genetic risk factor for African Americans (outside of the APOE4 allele) with an odds ratio of 1.8 (Reitz et al., 2013). We then matched these 18 ABCA7 “G” risk allele individuals with 18 individuals who were homozygous for the non-risk “A” allele, based on age and years of education. Hence, individuals with the ABCA7 rs115550680 AG genotype constituted the risk group (no participant homozygous for the “G” allele was present in the sample), while individuals with the AA genotype were the non-risk group. Overall, the current study included 36 healthy adults, 3 male (1 in the AA group and 2 in the AG group) and 33 female, aged 63 to 90 years, with an average age of 72 years (Table 1).
TABLE 1.
Demographics and Neuropsychological Assessments
| Measurement | AA Genotype | AG (risk) Genotype | Difference (t-test) |
|---|---|---|---|
| Sample Size | 18 (1M) | 18 (2M) | |
| Age | 72 (5.74) | 72.56 (8.23) | p = 0.52 |
| Education (years) | 14.33 (2.03) | 13.86 (1.98) | p = 0.48 |
| MMSE | 28.0 (1.5) | 26.89 (2.68) | p = 0.13 |
| DigitSpan | 22.94 (4.86) | 23.06 (4.54) | p = 0.94 |
| NAART | 35.5 (11.83) | 37.11 (9.02) | p = 0.65 |
| RAVLT- Immediate | 11.28 (2.22) | 12.28 (2.52) | p = 0.21 |
| RAVLT - Delayed | 10.61 (2.52) | 10.44 (2.71) | p = 0.85 |
Data are presented as mean (standard deviation). Group differences were assessed via simple pairwise t-tests. No statistically significant differences (p<0.05) were found.
Participants exhibiting any signs of dementia as revealed in the standardized neuropsychological assessments (detailed below), and those who took medications that could affect cognition were excluded from the study. Other exclusion criterion included history of excessive alcohol intake and/or drug use, psychiatric disorders (including Bipolar Disorder and Schizophrenia), Epilepsy or related seizure disorders, and significant cardiovascular and cerebrovascular diseases. Participants were also required to be fluent English speakers. All participants completed written informed consent prior to participation in the study.
2.2. Standardized Neuropsychological Assessments and Self-Reported Measures
To exclude anyone showing evidence of cognitive impairment consistent with early dementia or another age-related disorder, we gave participants a short battery of neuropsychological tests. Prior to MRI scanning, the neuropsychological battery consisting of the Mini Mental State Exam (MMSE) (broad assay of cognitive impairment), Rey Auditory Verbal Learning Test (RAVLT) Immediate and Delayed Recall (sensitive to verbal memory), North American Adult Reading Test (NAART35) (sensitive to verbal intellectual ability), Wechsler Adult Intelligence Scale (WAIS-IV) Digit Span (sensitive to working memory), and Beck Depression Inventory (BDI) (severity of depressive symptoms) was administered to characterize cognition (Table 1).
2.3. Behavioral Paradigm: Concurrent Discrimination and Generalization Task
The testing took place in a quiet room, with the participant seated in front of a laptop computer with a color screen. The keyboard was masked except for 2 keys, labeled “Left” and “Right” which the participant used to enter responses.
This task has been previously described in Myers et al. (2002). In brief, it is a two-phase task in which participants learn a series of visual discriminations and are then challenged to generalize when stimulus information changes. Phase 1 (acquisition) was an 8-pair concurrent discrimination. On each trial, 2 colored shapes appeared, approximately 1-inch high on the screen and set about 3 inches apart (approximately 1.5 degrees of visual angle, at normal viewing distance). The participants were instructed to press the left or right key to choose 1 object. The chosen object rose onscreen and, if the choice was correct, a smiley face was revealed underneath (Figure 1). There was no limit on response time, and there was an interval of approximately 1 second between participant response and start of the next trial, allowing the participant to view the discrimination pair and feedback (presence or absence of the desired smiley face icon).
FIGURE 1.
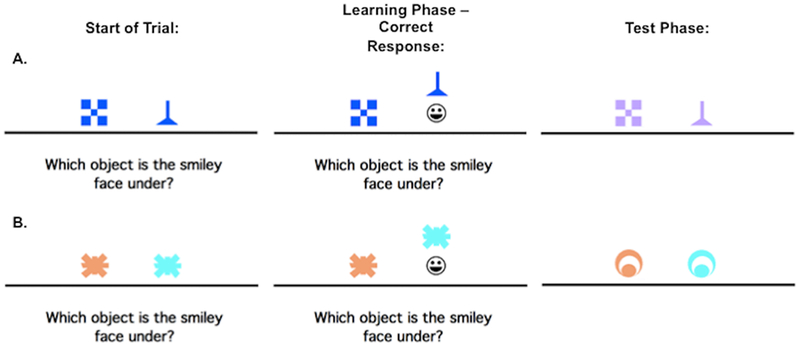
An example of the concurrent discrimination and generalization task. On each trial of phase1 (acquisition), the discrimination pair is presented and if the participant responds correctly, the chosen object is raised to reveal a smiley face icon underneath. During phase 2 (generalization) events are similar to phase 1, but the objects are changed so that the relevant dimension is the same, whereas the irrelevant dimension is novel.
This was an incrementally acquired, feedback-based learning task in which participants were to learn which object was correct. They were given no information about the correct object ahead of time. Within each object pair, the same object was always rewarded. For 4 of the discrimination pairs, objects differed in shape but not color (example, blue checkerboard vs. blue funnel); for the other 4 pairs, objects differed in color but not shape (example, orange spider vs. blue spider). Thus, within each pair, 1 dimension (shape or color) was relevant to predicting the location of the smiley face, and 1 dimension was irrelevant. Trials were organized into blocks, each containing 16 trials: 1 presentation of each discrimination pair in each possible left-right ordering. Trials in a block occurred in a pseudo-random but fixed order. Phase 1 continued until the participant reached a criterion of 16 consecutive correct responses, or for a maximum of 96 trials (6 blocks).
As soon as the acquisition phase ended, phase 2 (generalization) began without any warning to the participant. The screen events were identical to concurrent discrimination phase except that the discrimination pairs were altered so that the relevant features remained constant but the irrelevant features were altered. For example, the blue checkerboard vs. blue funnel might change to lavender checkerboard vs. lavender funnel as shown in the first row, second column (Figure 1A); the shapes remain the same but the irrelevant color changes from blue to lavender. In the second discrimination learned, the orange vs. blue spider discrimination might change to an orange vs. blue circle; shape remains irrelevant but color continues to be predictive.
Individuals who had solved the concurrent discrimination by basing associations on the relevant features (arch beats tower and yellow beats red) could perform perfectly in the generalization phase, since the relevant features were still predictive. By contrast, individuals who had approached concurrent discrimination phase by learning to respond to whole objects (green arch beats green tower), treating all features equally are effectively confronted with novel objects (blue arch and blue tower) in the generalization phase, and might perform near chance.
The generalization phase was organized into blocks of 16 trials, 1 trial with each discrimination pair in each possible left-right ordering, in a pseudo-random but fixed order. It continued until the participant reached a criterion of 16 consecutive correct responses, or a maximum of 96 trials (6 blocks). The entire procedure took about 15–20 minutes to complete.
2.4. MRI Data Acquisition
Magnetic resonance imaging (MRI) data was acquired on a 3T Siemens Allegra, using a 32-channel Multiband parallel encoding coil, at the Rutgers University Brain Imaging Center (RUBIC) at Rutgers University-Newark. If required, MRI-compatible glasses were used on the day of scanning. A high-resolution 3D magnetization-prepared rapid gradient echo (MP-RAGE) structural scan was acquired in the sagittal plane for each participant: repetition time (TR)=1900ms, echo time (TE)=2.52ms, 9° flip angle, 176 slices (no gap), voxel size 1.0 × 1.0 × 1.2 mm, field of view (FOV)=270 × 254 × 212, with a total acquisition time of 9 minutes. High-resolution Multiband echo-planar images were collected using a field of view (FOV) of 208 × 208 × 125, a repetition time (TR) of 664 milliseconds, an echo time (TE) of 30 milliseconds, a flip angle of 30°, an isotropic resolution of 1.8 mm with no gap, and, a Multiband acceleration factor of 5. Forty-five axial slices were acquired covering the entire brain. Multiband parallel imaging enabled the acquisition of high-resolution functional images, with large sampling rates for full-brain coverage, through the acquisition of multiple slices simultaneously. This resulted in significantly reduced acquisition time, which also limited distortion resulting from magnetic susceptibility. Furthermore, the high temporal efficiency has been shown to provide greater statistical power (Feinberg et al., 2010).
2.5. fMRI Data Analysis
2.5.1. Preprocessing
All neuroimaging data were preprocessed and analyzed using Analysis of Functional NeuroImages (AFNI) on Linux and Mac OSX platforms. Analyses largely took place in accordance with the standardized afni_proc.py pipeline. Data were despiked (3dDespike), slice timing corrected (3dtshift), coregistered with T1-weighed anatomical images (align_epi_anat.py), motion corrected (3dvolreg), smoothed to 2 mm isotropic (3dmerge) with a Gaussian FWHM kernel, and automasked to exclude voxels outside the brain (3dautomask). Trials with motion in excess of 0.3 mm were excluded from the time series using a custom script. Critically, based on processing steps suggested by Power et al. (2012), we also regressed signal in white matter and ventricles to account for noise related to motion and scanner artifact. This was accomplished using ANATICOR (Jo et al., 2010), which uses local white matter and ventricular signal estimates applied to nearby gray matter voxels. Functional scans were aligned to each subject’s skull-stripped MP-RAGE (align_epi_anat.py). Final voxel time courses were estimated using univariate regression (3dDeconvolve), which included nuisance variables for six motion parameters (pitch, roll, and yaw; x, y, and z frame displacement) and linear scanner drift.
We used Advanced Normalization Tools (ANTs) (Avants et al., 2011) to warp each individual participant’s structural scan into an in-house high-resolution 0.65 mm isotropic template using a diffeomorphic nonlinear registration algorithm (SyN) (Klein et al., 2009). The transformation parameters were then applied to the coplanar functional data output from the regression described above in order to align them to the custom template, for individual and group level analyses.
2.5.2. Region of Interest (ROI) Analyses
Based on our a priori hypothesis, the differences in functional connectivity were examined in MTL cortical regions (perirhinal cortex, parahippocampal cortex and entorhinal cortex), hippocampal subfields (subiculum, CA1, and DG/CA3), and the mPFC; ROIs are shown in Figure 2. We note that our mPFC ROI largely corresponds to the ventromedial aspect of the prefrontal cortex, though our delineation of the region was fairly liberal given ambiguous anatomical delineations used in the literature. We did, however, intentionally exclude orbitofrontal cortex and dorsal anterior cingulate cortex given the specialized affective and evaluative roles ascribed to those regions. For subsequent analyses, a structural ROI approach was used, selecting all the voxels within an anatomical ROI, which was based on manual delineations of the subfields and regions of interest on the custom template. ROIs in the MTL were segmented based on published protocols (Reagh et al., 2018). Anterolateral and posteromedial entorhinal cortex were segmented based on results from Maass et al. (2015), as also applied by Reagh et al. (2018). Resulting voxel z statistics were averaged and all subsequent statistical analyses were conducted on these averages. For each subject, regions of interest (ROIs) in the MTL, including hippocampal subfields, were used as seed regions for functional connectivity analysis. Each seed ROI was used to define the reference time course (3dmaskave), after which, a correlation was computed between each reference time course and the signal time series in each voxel within the acquired whole-brain image set (3dfim++), and then standardized to generate z-score functional connectivity maps, thresholded at a false discovery rate (FDR) of q = 0.05. Hence, a whole-brain z-score connectivity map was generated for each seed region (3dcalc), displaying all those voxels whose signal time series were correlated with it. From these seed to whole-brain connectivity maps, correlation values were extracted from each ROI (3dmaskave) and were evaluated for significance across groups.
FIGURE 2.
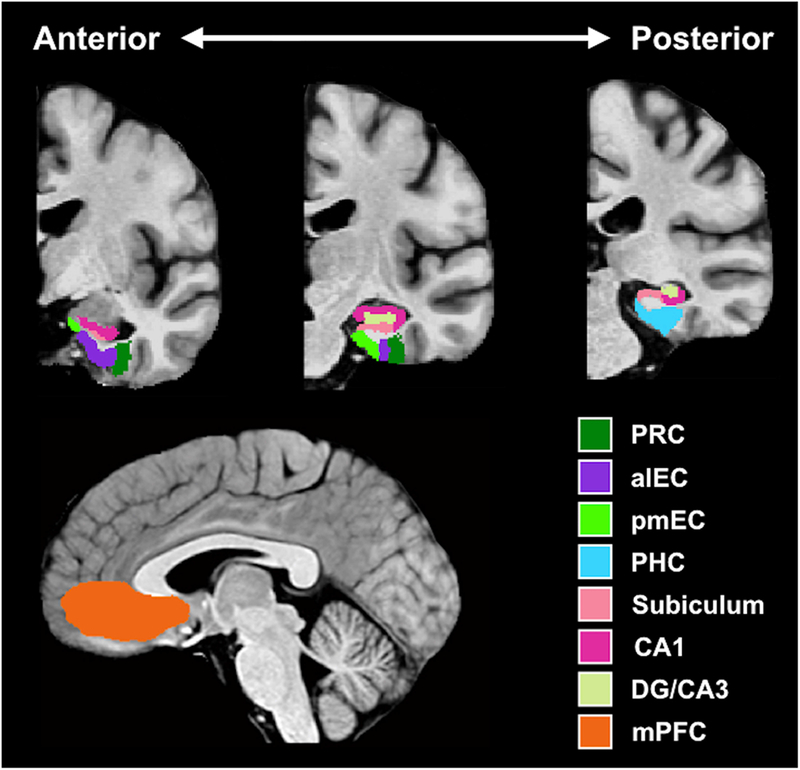
Regions of interest (ROIs). PRC = perirhinal cortex; aLEC = anterolateral entorhinal cortex; pMEC = posteromedial entorhinal cortex; PHC = parahippocampal cortex; DG = dentate gyrus; mPFC = medial prefrontal cortex.
2.6. Genetic Data Collection and Processing
Saliva samples were collected using Oragene kits during the neuropsychological testing visit before MRI scanning. DNA extraction and genotyping were conducted at the Rutgers University Human Genetics Institute. ABCA7 SNP rs115550680 genotyping was carried out by quantitative PCR on an Eppendorf Mastercycler thermal cycler, using a TaqMan Custom Genotyping assay.
3.0. RESULTS
3.1. Behavioral Results
All participants underwent a battery of standardized neuropsychological assessments, and were included in our analyses only if they were within the age and education adjusted norms (Table 1). No differences were observed on these standardized measures of cognitive functioning (MMSE, Digit Span, NAART, RAVLT).
On the concurrent discrimination task, all participants reached the criterion of 16 consecutive correct responses on the acquisition phase, indicating that they successfully learned the task. Figure 3 shows the mean errors for the acquisition and generalization phases of the task. There was no effect of group, based on ABCA7 genotype, on acquisition; t(34) = 0.916, p = 0.366. ANOVA revealed a significant effect of group (F(1,33) =6.24, p = 0.018), as well as, a significant effect of acquisition errors on generalization performance (F(1,33) =13.017, p = 0.001). Post-hoc comparison of generalization performance, adjusted for acquisition errors, revealed that the AA group made significantly fewer errors (M = 10.91, SD = 2.4), compared to the AG risk group (M = 19.57, SE = 2.4).
FIGURE 3.
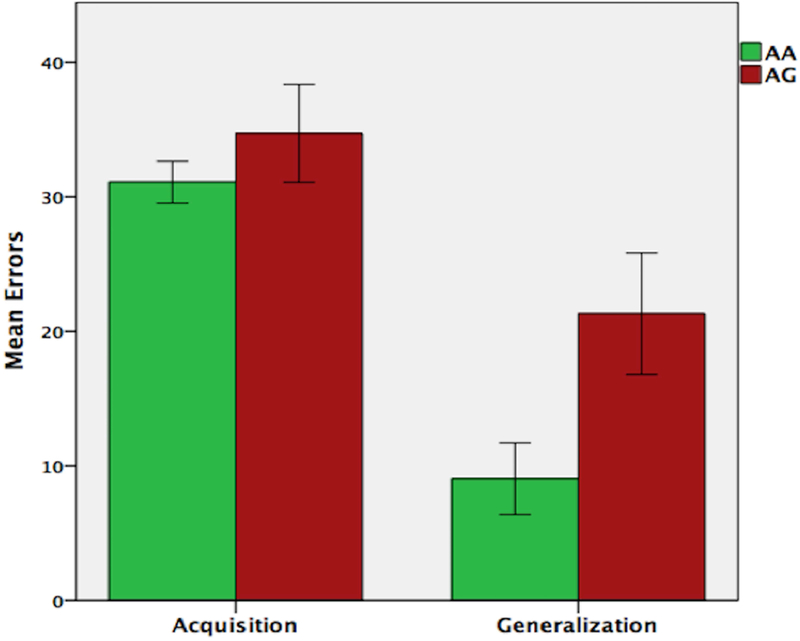
Performance (total errors) on the concurrent discrimination and generalization task based on ABCA7 genotype. While there were no group differences on the initial learning (acquisition phase), carriers of the AG risk genotype made significantly more errors during generalization.
3.2. Functional Neuroimaging Results
As described in methods, whole brain, z-score functional connectivity maps were generated with MTL subfields as seed regions. Based on a priori hypotheses, we conducted ROI analysis on these seed to whole-brain connectivity maps to examine group differences in functional connectivity within the MTL and between the MTL regions and mPFC. Corrections were made for multiple comparisons using the Holm-Bonferroni method (Holm, 1979). The AG risk group showed increased functional connectivity between entorhinal cortex (EC) and other MTL regions, including the hippocampal subfields (subiculum: t(34) = 3.22, p = 0.003, p-corrected = 0.015; CA1: t(34) = 4.24, p = 0.001, p-corrected = 0.006; DG/CA3: t(34) = 3.42, p = 0.003, p-corrected = 0.015; perirhinal cortex: t(34) = 2.46, p = 0.019, p-corrected = 0.038; parahippocampal cortex: t(34) = 1.24, p = 0.224; p-corrected = 0.224); significant between-group differences are shown in Figure 4A. Conversely, the AG risk group showed decreased functional connectivity between EC and mPFC: t(34) = 2.86, p = 0.007, p-corrected = 0.021 (Figure 4B).
FIGURE 4.
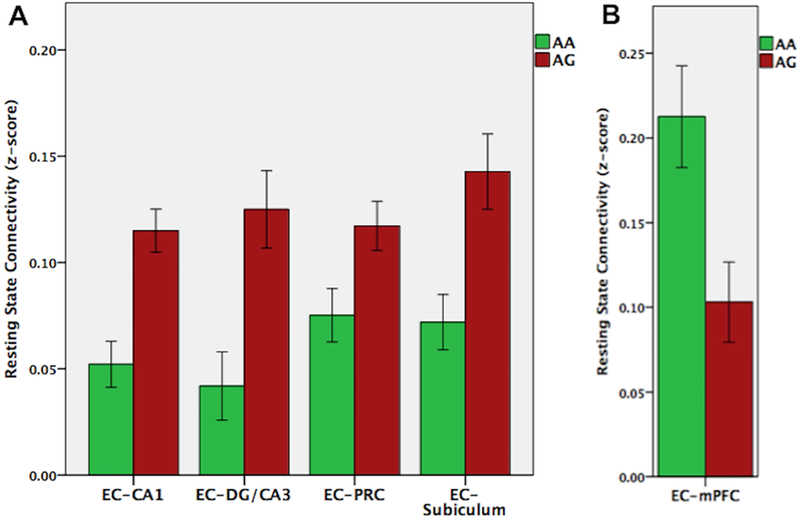
Resting state functional connectivity based on ABCA7 genotype. The AG risk group showed increased functional connectivity between entorhinal cortex and other MTL regions, including hippocampal subfields and perirhinal cortex (A), but decreased functional connectivity between entorhinal cortex and mPFC (B).
To investigate the potential link between the observed functional connectivity and the behavioral ability to generalize, we performed partial correlations between connectivity z-scores and generalization total errors, controlling for the effect of acquisition errors. The analysis was conducted on functional connectivity scores that showed significant group differences; as such z-scores for EC-subiculum, EC-CA1, EC-DG/CA3, EC-perirhinal cortex and EC-mPFC z-scores were considered. Correlations were assessed at the level of AG carriers, AA carriers, and collapsed across the entire sample (Figure 5). For the correlations assessed across groups, corrections were made for multiple comparisons using the Holm-Bonferroni method (Holm, 1979). Generalization errors across groups were positively correlated with increased connectivity between EC and hippocampal subfields (subiculum: r(33) = 0.418, p = 0.013, p-corrected = 0.039; CA1: r(33) = 0.502, p = 0.002, p-corrected = 0.01; DG/CA3: r(33) = 0.359, p = 0.034, p-corrected = 0.063). A positive correlation was also observed between increased EC-perirhinal cortex connectivity and generalization errors (r(33) = 0.244, p = 0.157, p-corrected = 0.157), but this relationship did not reach significance. Within-group correlations were trending or significant for the EC-CA1 (r(15) = 0.474, p = 0.054) and EC-subiculum (r(15) = 0.495, p = 0.043) connectivity in the AA group but not in the AG group (EC-CA1: r(15) = 0.27, p = 0.29; EC-subiculum: r(15) = 0.17, p = 0.514). The other non-significant correlations within each group also trended in the same direction (positive correlations between generalization errors and increased connectivity). Thus, in general, greater synchronization of EC and hippocampal sub-regions was associated with poorer ability to generalize based on previously learned information. On the other hand, increased connectivity between EC and mPFC was negatively associated with generalization across groups (r(33) = −0.494, p = 0.003, p-corrected = 0.012). Within group correlations were significant for the AA group (r(15) = −0.628, p = 0.007), but not for the AG group (r(15) = −0.173, p = 0.51) Thus, opposite to the relationship observed in EC-hippocampal connectivity, greater synchronization between EC and mPFC was associated with better generalization performance.
FIGURE 5.
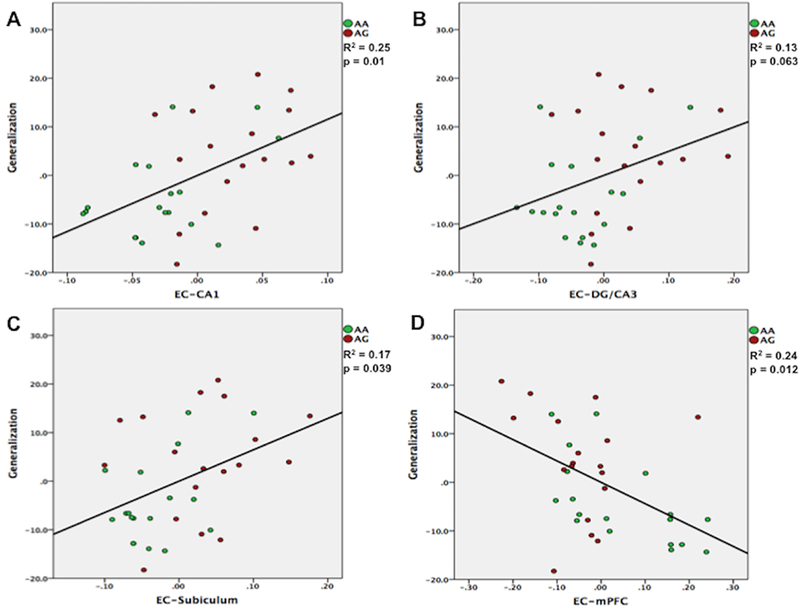
Partial correlations between functional connectivity z-scores and generalization total errors, controlling for the effect of initial learning (acquisition) errors. Across groups, generalization deficits were associated with increased connectivity between entorhinal cortex and hippocampal subfields (A, B, C). Conversely, greater connectivity between entorhinal cortex and mPFC was associated with better generalization performance (D).
3.3. Mediation Analysis
We examined whether the effect of AG risk genotype on generalization is mediated by EC functional connectivity. To minimize multicollinearity, PCA was used to examine the variance shared by the z-scores on the functional connectivity between EC and hippocampal subfields (CA1, DG/CA3 and Subiculum). The Eigenvalues greater than 1 criterion suggested a single factor representing EC-hippocampus connectivity, accounting for 90.15% of the variance. Hence, a multiple mediator model (Preacher and Hayes, 2008) was tested with two mediator variables: EC-hippocampus and EC-mPFC functional connectivity; acquisition error was entered in the model as a covariate. The mediation model is shown in Figure 6 and the indirect effect estimates and 95% CIs are in Table 2. Overall EC functional connectivity significantly mediated the relationship between AG risk genotype and generalization scores (total indirect effect = 8.13, CI = 3.69 - 15.07). An examination of the specific indirect effects indicated that both EC-hippocampus (indirect effect = 4.32, CI = 0.5 - 10.94) and EC-mPFC (indirect effect = 3.81, CI = 0.64 - 9.51) connectivity were significant mediators. Furthermore, the direction of the paths was consistent with the interpretation that the AG risk genotype was associated with increased EC-hippocampus connectivity (β = 0.99, p = 0.007) and decreased EC-mPFC connectivity (β = −0.10, p = 0.012), which was subsequently associated with higher generalization errors (β = 4.38, p = 0.037; β = −37.75, p = 0.011). Consistent with the correlational findings, the mediation analysis suggests that the ABCA7 risk variant is associated with EC-hippocampus hyper-synchronization and EC-mPFC hypo-synchronization, which, in turn, result in generalization deficits.
FIGURE 6.
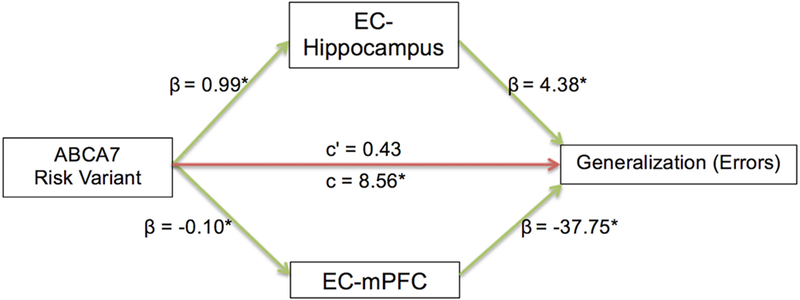
An illustration of the mediation model. β values indicate the coefficient of the arrow’s partial effect. Green arrows indicate significant effects and asterisk (*) is appended to significant coefficients. c’ (c-prime) represents the direct effect and c represents the total effect of ABCA7 risk variant on generalization errors. Indirect effect coefficients indicate that ABCA7 risk variant was associated with EC-hippocampus hyper-synchronization and EC-mPFC hypo-synchronization, in turn resulting in cognitive deficits.
TABLE 2.
Mediation of the effect of ABCA7 risk variant on generalization (errors) through entorhinal-hippocampal and entorhinal-mPFC functional connectivity
| Product of Coefficients | Bootstrapping 95% CI | Coefficients | |||||
|---|---|---|---|---|---|---|---|
| Point Estimate | SE | Z | Lower | Upper | ABCA7-> Mediator | Mediator -> Generalization Errors | |
| EC-Hippocampus | 4.32* | 2.55 | 1.84 | 0.50 | 10.94 | 0.99 | 4.38 |
| EC-mPFC | 3.81* | 2.30 | 1.83 | 0.64 | 9.51 | −0.10 | −37.75 |
| TOTAL | 8.13* | 2.83 | 3.69 | 15.07 | |||
Any statistically significant indirect effects (mediators) are bolded
3.4. Structural MRI Results
Volumetric analyses across MTL regions and hippocampal subfields showed significant group differences in the EC volume (t(34) = 2.02, p = 0.005, p-corrected = 0.03) and surface area (t(34) = 2.84, p = 0.008, p-corrected = 0.048). Further examination following an anterolateral versus posteromedial functional division (alEC; pmEC) revealed that the difference in EC structure between the two groups was driven by the anterolateral entorhinal cortex (alEC). As shown in Figure 7, in AG risk genotype carriers, the alEC was significantly smaller in surface area (t(34) = 3.41, p = 0.002) and volume (t(34) = 2.45, p = 0.02). There was however no difference between the two groups in pmEC surface area (t(34) = 1.31, p = 0.2) or volume (t(34) = 0.69, p = 0.49). No other region of the MTL showed a significant group difference.
FIGURE 7.
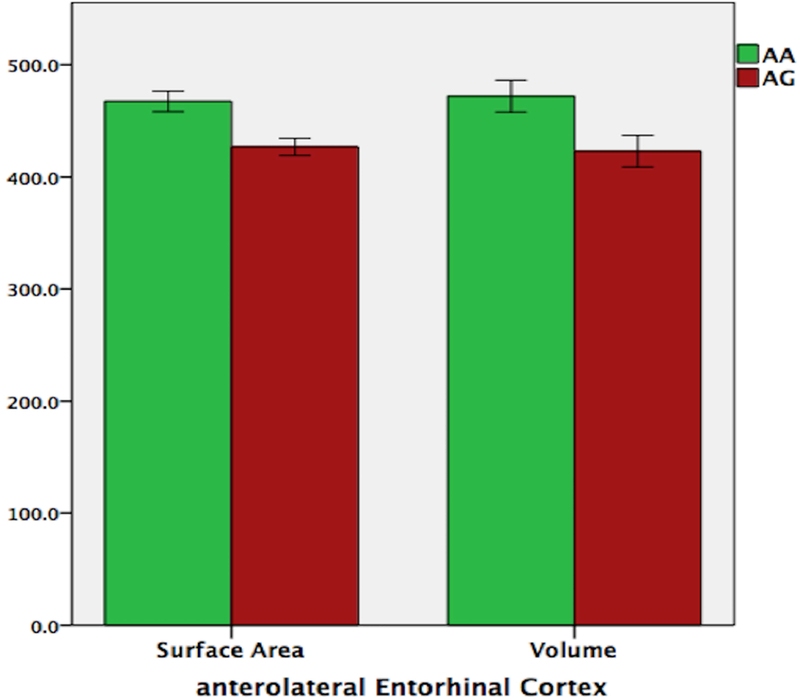
Volumetric analyses of volume (A) and surface area (B) showed that in the AG risk genotype carriers, the anterolateral entorhinal cortex (alEC) was smaller in both volume and surface area.
4.0. DISCUSSION
In this study, we observed ABCA7 risk genotype related impairments in generalization, mediated by hyper-synchronization between EC and hippocampus, and, hypo-synchronization between EC and mPFC. Moreover, impaired generalization on the behavioral paradigm was positively correlated with increased connectivity between EC and hippocampal subfields, but negatively correlated with increased connectivity between EC and mPFC. Carriers of the AG risk genotype also had a significantly smaller alEC, in both volume and surface area. Importantly, there were also no group differences on standardized neuropsychological tests, and, across groups participants were asymptomatic in terms of dementia or major indices of cognitive decline.
On the behavioral paradigm, both groups learned to solve the concurrent discrimination equally well. However, generalization of this initial learning to a novel context or task demand was found to be significantly decreased in AG group compared to the AA group, indicating that there is a specific generalization deficit associated with the ABCA7 risk genotype. Notably, no group differences were observed on common standardized measures of declarative memory (delayed recall of semantic or episodic memories), suggesting that the AG risk genotype is specific to impairing generalization of learning in older adults who are otherwise cognitively healthy on measures of declarative memory. In other studies with non-demented elderly (Engelman et al., 2013; Andrews et al., 2016, 2017), as well as, AD patients (Chung et al., 2014; Nettiksimmons et al., 2016), ABCA7 risk variants were related to variations in episodic memory using standardized assessments. Our results therefore suggest that the concurrent discrimination and generalization behavioral paradigm may be a useful tool for assessing the mild cognitive deficits seen in the earliest phases of prodromal AD before the more severe and more commonly reported deficits in episodic memory arise later in the course of the disease.
Commensurate with behavioral impairments, on resting state fMRI, the AG risk group showed significantly increased functional connectivity between EC and hippocampal sub-regions, which was positively correlated with impairments in generalization, suggesting that the increased synchronization is maladaptive and is a marker for neuronal dysfunction. In particular, this EC-hippocampus hyper-synchronization may reflect low network flexibility (Bassett et al., 2011, 2013) implying that the neural pathways are so heavily connected that they cannot accommodate any new information (Bassett et al., 2015; Rosenberg-Lee et al., 2015). Conversely, the AG risk group showed significantly decreased functional connectivity between EC and mPFC, which was negatively correlated with generalization errors. Hence, a deficit in generalization of learning was associated with elevated EC-hippocampus synchronization, but reduced functional integration of EC with the prefrontal cortex. Taken together, our results imply that cognitive decline may be associated with a relative disconnect of EC from the prefrontal cortex, particularly mPFC, but hyper-connectivity between EC and hippocampus. This is consistent with recent studies of functional connectivity in MCI and AD patients reporting a similar disconnection of the MTL from other nodes of the default mode network, particularly mPFC, but increased connectivity locally within the MTL, specifically between EC and sub-regions of the MTL (Das et al., 2013), which was also associated with impaired memory (Pasquini et al., 2015). However, we build significantly on these lines of research by providing, for the first time to our knowledge, evidence that in cognitively healthy older adults, the pathological dissociation in EC functional connectivity (as observed in MCI and AD patients) is associated with ABCA7 risk genotype.
Additionally, our mediation analysis suggests that the dissociation in EC functional connectivity plays a role in mediating the effect of ABCA7 risk on the generalization of learning. In particular, the ABCA7 risk variant was associated with EC-hippocampus hyper-synchronization and EC-mPFC hypo-synchronization, which, in turn, provide a putative mechanism for generalization deficits. These results indicate that, ABCA7 risk variant related neuronal dysfunction is propagated through the cortico-hippocampal network, with the EC as an important hub region of early vulnerability. Furthermore, we also found that compared to the non-risk group, carriers of the AG risk genotype showed significantly reduced volume and surface area in the alEC, suggesting that structural neurodegeneration may underlie the observed dysfunctional dissociation in the mPFC-EC-hippocampus circuit. Hence, overall our findings imply that ABCA7 loss of function induces neurodegeneration in EC neurons, which in turn causes trans-synaptic deficits initiating the cortical-hippocampal network dysfunction. While we cannot identify the exact mechanism underlying the observed alterations in EC structure and network function, considering the relevance of Aβ in ABCA7 related AD pathogenesis, the results of our study may reflect the synergistic reinforcement between amyloid and tau pathology in the EC, which significantly increases tau-induced neuronal loss and accelerates synaptic alterations (Pooler et al., 2015). Consistent with this, in an AD mouse model, selective overexpression of APP/Aβ in EC neurons caused an excitatory EC-hippocampal network dysfunction leading to behavioral abnormalities (Harris et al., 2010), as we have seen in our ABCA7 risk variant group.
Although the association of ABCA7 risk variants with AD has been confirmed worldwide (Hollingworth et al., 2011; Kamboh et al., 2012; Reitz et al., 2013; Beecham et al., 2014; Liu et al., 2014), the effect size of the ABCA7 locus on the relative odds of being diagnosed with AD is significantly higher in African Americans (Reitz et al., 2013). In particular, the ABCA7 SNP (rs115550680) being examined in our study has an odds ratio of 1.79 for African Americans, an effect size comparable with that of APOE ε4 (Reitz et al., 2013). Furthermore, this SNP is monomorphic in Caucasians. It therefore remains a significant question whether the results observed in the present study can be replicated across ethnicities with other causative variants that may have a similar underlying mechanism as rs115550680.
There are several remaining study limitations and specific future directions that should be acknowledged. First, we did not have any participants who were homozygous in the ABCA7 “G” risk allele, and therefore could not examine differences between carriers of one (AG) versus two (GG) risk alleles. Furthermore, due to the relatively small sample size, we were unable to adjust for the effects of APOE or investigate the additive effect in participants who have the risk variant for both APOE and ABCA7. Hence, additional studies with a larger sample size are required to explore racial differences in the effects of ABCA7 risk variants on cognitive decline, as well as, the effects of APOE ε4 and potential gene-gene interactions.
Lastly, there was a gender imbalance in our study, with just three male participants, which limits the generalizability of our findings. The biological influences of sex differences are an important factor to consider in cognitive aging and AD research. While men are at greater risk of developing MCI (Petersen et al., 2010), women are more likely to develop AD (Alzheimer’s Association, 2018), possibly due to sex-related differenced in the rate of progression from MCI to probable AD. In patients with MCI and AD, brain volumes, particularly hippocampal, have been found to decline faster in women than men (Skup et al., 2011; Ardekani et al., 2016), supporting the evidence of faster progression of women from MCI to AD. Furthermore, genes implicated in dementias have been found to increase risk and progression of AD in women; the effect of the APOE4 genotype is more pronounced in women (Altmann et al., 2014), while the MET66 allele of BDNF is selectively associated with increased risk of AD in women but not in men (Fukumoto et al., 2010). Particularly notable in the context of this study is 219K allele of the ABCA1 gene, which has a 1.75-fold increased risk of developing AD in women, but was found to be protective in men (Sundar et al., 2007). Since ABCA7 also belongs to the A subfamily of ABC transporters and shares 54% sequence identity with ABCA1, it may similarly confer a greater AD risk in women, and therefore driving the current results. Stratification by sex in future work is needed to elucidate whether ABCA7-related mechanisms differentially affect AD pathology and neural network dysfunction in men and women.
In conclusion, the results of the study show that in cognitively healthy elderly, ABCA7 risk variant contributes to a maladaptive dissociation in EC resting state functional connectivity, resulting in elevated EC-hippocampus synchronization, but reduced functional integration of EC with mPFC. Our findings suggest a model where impaired cortical connectivity leads to a more functionally isolated EC at rest, which translates into aberrant EC-hippocampus hyper-synchronization resulting in generalization deficits.
Acknowledgements
This work was supported by grants to MAG from the NIH/National Institute on Aging (R56AG053961, R01AG053961) and by support from the Chancellor’s and Provost’s offices at Rutgers University-Newark. Additional support came from grants to MAY from NIH/National Institute on Aging grants P50AG05146, R21AG049220 and R01AG053555. The authors thank Stephen Hanson, and the staff of the Rutgers University Brain Imaging Center (RUBIC), for their guidance and support in the brain imaging data collection.
Our ongoing research studies with older African Americans in Greater Newark would not be possible without the guidance, input, and support of the Community Advisory Board of the Rutgers-Newark African American Brain Health Initiative, including Tania Cajuste (East Orange Office of Senior Services), Margaret Cammarieri (American Heart Association | American Stroke Association), Honorable Mildred Crump (City of Newark City Council), Mary Dawkins (Hillside Senior Recreation Group), Mildred English (St. James AME Church), Jaklyn De Vore (Essex County Senior Services), Deacon Francis Dixon (The New Hope Baptist Church), Robin Lateef-Pharms (Bethany Senior Center), Louise Layton (Rutgers Aging Advisory Council), Yolanda Mack (Greater Newark Healthcare Coalition), Rev. Dr. Jacqueline Reeves (St. James AME Church), Joan Reeves (East Orange Office of Senior Services), Donna Sparks (Bethany Baptist Church), Sheltry Ward (New Jersey Black Nurses Association), Pastor Glenn Wilson (Pilgrim Baptist Church), Geri Woods-Coles (Bethany Baptist Church), and Glenda Wright (New Jersey Association of Public and Subsidized Housing).
Funding Information
Grant Sponsor: National Institutes of Health/National Institute on Aging
Grant Number(s): R56AG053961, R01AG053961, P50AG05146, R21AG049220 and R01AG053555
Footnotes
Disclosure Statement
The authors confirm that there are no known conflicts of interest associated with the publication of this manuscript.
REFERENCES
- Aikawa T, Holm M-L, & Kanekiyo T (2018). ABCA7 and Pathogenic Pathways of Alzheimer’s Disease. Brain Sciences, 8(2), 27. [DOI] [PMC free article] [PubMed] [Google Scholar]
- Altmann A, Tian L, Henderson VW, Greicius MD, & Investigators, A. D. N. I. (2014). Sex modifies the APOE-related risk of developing Alzheimer disease. Annals of Neurology, 75(4), 563–573. [DOI] [PMC free article] [PubMed] [Google Scholar]
- Alzheimer’s Association. (2018). 2018 Alzheimer’s disease facts and figures. Alzheimer’s & Dementia: The Journal of the Alzheimer’s Association, 14(3), 367–429. 10.1016/j.jalz.2018.02.001 [DOI] [Google Scholar]
- Andrews SJ, Das D, Anstey KJ, & Easteal S (2017). Late Onset Alzheimer’s Disease Risk Variants in Cognitive Decline: The PATH Through Life Study. Journal of Alzheimer’s Disease: JAD, 57(2), 423–436. 10.3233/JAD-160774 [DOI] [PubMed] [Google Scholar]
- Andrews SJ, Das D, Cherbuin N, Anstey KJ, & Easteal S (2016). Association of genetic risk factors with cognitive decline: the PATH through life project. Neurobiology of Aging, 41, 150–158. [DOI] [PubMed] [Google Scholar]
- Andrews-Hanna JR, Snyder AZ, Vincent JL, Lustig C, Head D, Raichle ME, & Buckner RL (2007). Disruption of large-scale brain systems in advanced aging. Neuron, 56(5), 924–935. [DOI] [PMC free article] [PubMed] [Google Scholar]
- Ardekani BA, Convit A, & Bachman AH (2016). Analysis of the MIRIAD data shows sex differences in hippocampal atrophy progression. Journal of Alzheimer’s Disease, 50(3), 847–857. [DOI] [PubMed] [Google Scholar]
- Avants BB, Tustison NJ, Song G, Cook PA, Klein A, & Gee JC (2011). A reproducible evaluation of ANTs similarity metric performance in brain image registration. Neuroimage, 54, 2033–2044. [DOI] [PMC free article] [PubMed] [Google Scholar]
- Bamji-Mirza M, Li Y, Najem D, Liu QY, Walker D, Lue L-F, … Zhang W (2016). Genetic Variations in ABCA7 Can Increase Secreted Levels of Amyloid-β40 and Amyloid-β42 Peptides and ABCA7 Transcription in Cell Culture Models. Journal of Alzheimer’s Disease: JAD, 53(3), 875–892. 10.3233/JAD-150965 [DOI] [PubMed] [Google Scholar]
- Barnes LL, Wilson RS, Li Y, Aggarwal NT, Gilley DW, McCann JJ, & Evans DA (2005). Racial differences in the progression of cognitive decline in Alzheimer disease. The American Journal of Geriatric Psychiatry, 13(11), 959–967. [DOI] [PubMed] [Google Scholar]
- Bassett DS, Wymbs NF, Porter MA, Mucha PJ, Carlson JM, & Grafton ST (2011). Dynamic reconfiguration of human brain networks during learning. Proceedings of the National Academy of Sciences, 108(18), 7641–7646. [DOI] [PMC free article] [PubMed] [Google Scholar]
- Bassett DS, Wymbs NF, Rombach MP, Porter MA, Mucha PJ, & Grafton ST (2013). Task-based core-periphery organization of human brain dynamics. PLoS Computational Biology, 9(9), e1003171. [DOI] [PMC free article] [PubMed] [Google Scholar]
- Bassett DS, Yang M, Wymbs NF, & Grafton ST (2015). Learning-induced autonomy of sensorimotor systems. Nature Neuroscience, 18(5), 744–751. 10.1038/nn.3993 [DOI] [PMC free article] [PubMed] [Google Scholar]
- Beecham GW, Hamilton K, Naj AC, Martin ER, Huentelman M, Myers AJ, … Montine TJ (2014). Genome-Wide Association Meta-analysis of Neuropathologic Features of Alzheimer’s Disease and Related Dementias. PLOS Genetics, 10(9), e1004606 10.1371/journal.pgen.1004606 [DOI] [PMC free article] [PubMed] [Google Scholar]
- Braak H, & Braak E (1991). Neuropathological stageing of Alzheimer-related changes. Acta Neuropathologica, 82(4), 239–259. [DOI] [PubMed] [Google Scholar]
- Braak H, & Braak E (1997). Frequency of stages of Alzheimer-related lesions in different age categories. Neurobiology of Aging, 18(4), 351–357. [DOI] [PubMed] [Google Scholar]
- Braak H, Thal DR, Ghebremedhin E, & Del Tredici K (2011). Stages of the pathologic process in Alzheimer disease: age categories from 1 to 100 years. Journal of Neuropathology & Experimental Neurology, 70(11), 960–969. [DOI] [PubMed] [Google Scholar]
- Brown GC, & Neher JJ (2014). Microglial phagocytosis of live neurons. Nature Reviews Neuroscience, 15(4), 209. [DOI] [PubMed] [Google Scholar]
- Carrasquillo MM, Crook JE, Pedraza O, Thomas CS, Pankratz VS, Allen M, … Bisceglio GD (2015). Late-onset Alzheimer’s risk variants in memory decline, incident mild cognitive impairment, and Alzheimer’s disease. Neurobiology of Aging, 36(1), 60–67. [DOI] [PMC free article] [PubMed] [Google Scholar]
- Chung SJ, Kim M-J, Kim YJ, Kim J, You S, Jang EH, … Lee J-H (2014). CR1, ABCA7, and APOE genes affect the features of cognitive impairment in Alzheimer’s disease. Journal of the Neurological Sciences, 339(1), 91–96. [DOI] [PubMed] [Google Scholar]
- Cukier HN, Kunkle BW, Vardarajan BN, Rolati S, Hamilton-Nelson KL, Kohli MA, … Pericak-Vance MA (2016). ABCA7 frameshift deletion associated with Alzheimer disease in African Americans. Neurology: Genetics, 2(3). 10.1212/NXG.0000000000000079 [DOI] [PMC free article] [PubMed] [Google Scholar]
- Damoiseaux JS, Beckmann CF, Arigita ES, Barkhof F, Scheltens P, Stam CJ, … Rombouts S (2007). Reduced resting-state brain activity in the “default network” in normal aging. Cerebral Cortex, 18(8), 1856–1864. [DOI] [PubMed] [Google Scholar]
- Das SR, Pluta J, Mancuso L, Kliot D, Orozco S, Dickerson BC, … Wolk DA (2013). Increased functional connectivity within medial temporal lobe in mild cognitive impairment. Hippocampus, 23(1), 1–6. [DOI] [PMC free article] [PubMed] [Google Scholar]
- Engelman CD, Koscik RL, Jonaitis EM, Okonkwo OC, Hermann BP, La Rue A, & Sager MA (2013). Interaction between two cholesterol metabolism genes influences memory: findings from the Wisconsin Registry for Alzheimer’s Prevention. Journal of Alzheimer’s Disease, 36(4), 749–757. [DOI] [PMC free article] [PubMed] [Google Scholar]
- Feinberg DA, Moeller S, Smith SM, Auerbach E, Ramanna S, Glasser MF, … Yacoub E (2010). Multiplexed echo planar imaging for sub-second whole brain FMRI and fast diffusion imaging. PloS One, 5(12), e15710. [DOI] [PMC free article] [PubMed] [Google Scholar]
- Fleisher AS, Sherzai A, Taylor C, Langbaum JB, Chen K, & Buxton RB (2009). Resting-state BOLD networks versus task-associated functional MRI for distinguishing Alzheimer’s disease risk groups. Neuroimage, 47(4), 1678–1690. [DOI] [PMC free article] [PubMed] [Google Scholar]
- Fu Y, Hsiao J-HT, Paxinos G, Halliday GM, & Kim WS (2016). ABCA7 mediates phagocytic clearance of amyloid-β in the brain. Journal of Alzheimer’s Disease, 54(2), 569–584. [DOI] [PubMed] [Google Scholar]
- Fukumoto N, Fujii T, Combarros O, Kamboh MI, Tsai S-J, Matsushita S, … Ingelsson M (2010). Sexually dimorphic effect of the Val66Met polymorphism of BDNF on susceptibility to Alzheimer’s disease: New data and meta-analysis. American Journal of Medical Genetics Part B: Neuropsychiatric Genetics, 153(1), 235–242. [DOI] [PubMed] [Google Scholar]
- Giri M, Zhang M, & Lü Y (2016). Genes associated with Alzheimer’s disease: an overview and current status. Clinical Interventions in Aging, 11, 665–681. 10.2147/CIA.S105769 [DOI] [PMC free article] [PubMed] [Google Scholar]
- Gluck MA, Shaw A, & Hill D (In Press). Recruiting older African Americans to brain health and aging research through community engagement: Lessons from the African-American Brain Health Initiative at Rutgers University-Newark. [PMC free article] [PubMed]
- Greicius MD, Srivastava G, Reiss AL, & Menon V (2004). Default-mode network activity distinguishes Alzheimer’s disease from healthy aging: evidence from functional MRI. Proceedings of the National Academy of Sciences of the United States of America, 101(13), 4637–4642. [DOI] [PMC free article] [PubMed] [Google Scholar]
- Hardy J, & Selkoe DJ (2002). The amyloid hypothesis of Alzheimer’s disease: progress and problems on the road to therapeutics. Science, 297(5580), 353–356. [DOI] [PubMed] [Google Scholar]
- Harris JA, Devidze N, Verret L, Ho K, Halabisky B, Thwin MT, … Mucke L (2010). Transsynaptic Progression of Amyloid-β-Induced Neuronal Dysfunction within the Entorhinal-Hippocampal Network. Neuron, 68(3), 428–441. 10.1016/j.neuron.2010.10.020 [DOI] [PMC free article] [PubMed] [Google Scholar]
- Hollingworth P, Harold D, Sims R, Gerrish A, Lambert J-C, Carrasquillo MM, … Williams J (2011). Common variants in ABCA7, MS4A6A/MS4A4E, EPHA1, CD33 and CD2AP are associated with Alzheimer’s disease. Nature Genetics, 43(5), 429–435. 10.1038/ng.803 [DOI] [PMC free article] [PubMed] [Google Scholar]
- Holm S (1979). A simple sequentially rejective multiple test procedure. Scandinavian Journal of Statistics, 65–70. [Google Scholar]
- Howell JC, Watts KD, Parker MW, Wu J, Kollhoff A, Wingo TS, … Hu WT (2017). Race modifies the relationship between cognition and Alzheimer’s disease cerebrospinal fluid biomarkers. Alzheimer’s Research & Therapy, 9(1). 10.1186/s13195-017-0315-1 [DOI] [PMC free article] [PubMed] [Google Scholar]
- Johnson SC, Schmitz TW, Asthana S, Gluck MA, & Myers C (2008). Associative learning over trials activates the hippocampus in healthy elderly but not mild cognitive impairment. Aging, Neuropsychology, and Cognition, 15(2), 129–145. [DOI] [PMC free article] [PubMed] [Google Scholar]
- Kamboh MI, Demirci FY, Wang X, Minster RL, Carrasquillo MM, Pankratz VS, … Barmada MM (2012). Genome-wide association study of Alzheimer’s disease. Translational Psychiatry, 2(5), e117 10.1038/tp.2012.45 [DOI] [PMC free article] [PubMed] [Google Scholar]
- Klein A, Andersson J, Ardekani BA, Ashburner J, Avants B, Chiang M-C, … Hellier P (2009). Evaluation of 14 nonlinear deformation algorithms applied to human brain MRI registration. Neuroimage, 46(3), 786–802. [DOI] [PMC free article] [PubMed] [Google Scholar]
- Krishna R, Moustafa AA, Eby A, Skeen LC, & Myers CE (2012). Learning and generalization in healthy aging: implication for frontostriatal and hippocampal function. Cognitive and Behavioral Neurology, 25(1), 7. [DOI] [PMC free article] [PubMed] [Google Scholar]
- Leal SL, & Yassa MA (2018). Integrating new findings and examining clinical applications of pattern separation. Nature Neuroscience, 1. [DOI] [PMC free article] [PubMed] [Google Scholar]
- Li H, Zhou J, Yue Z, Feng L, Luo Z, Chen S, … Xiao B (2017). A complex association between ABCA7 genotypes and blood lipid levels in Southern Chinese Han patients of sporadic Alzheimer’s disease. Journal of the Neurological Sciences, 382, 13–17. 10.1016/j.jns.2017.09.016 [DOI] [PubMed] [Google Scholar]
- Liu G, Li F, Zhang S, Jiang Y, Ma G, Shang H, … Li K (2014). Analyzing large-scale samples confirms the association between the ABCA7 rs3764650 polymorphism and Alzheimer’s disease susceptibility. Molecular Neurobiology, 50(3), 757–764. 10.1007/s12035-014-8670-4 [DOI] [PubMed] [Google Scholar]
- Maass A, Berron D, Libby LA, Ranganath C, & Düzel E (2015). Functional subregions of the human entorhinal cortex. Elife, 4, e06426. [DOI] [PMC free article] [PubMed] [Google Scholar]
- Machiela MJ, & Chanock SJ (2015). LDlink: a web-based application for exploring population-specific haplotype structure and linking correlated alleles of possible functional variants. Bioinformatics (Oxford, England), 31(21), 3555–3557. 10.1093/bioinformatics/btv402 [DOI] [PMC free article] [PubMed] [Google Scholar]
- Mann DM, & Hardy J (2013). Amyloid or tau: the chicken or the egg? Acta Neuropathologica, 126(4), 609–613. [DOI] [PubMed] [Google Scholar]
- Myers CE, Kluger A, Golomb J, Ferris S, de Leon MJ, Schnirman G, & Gluck MA (2002). Hippocampal atrophy disrupts transfer generalization in nondemented elderly. Journal of Geriatric Psychiatry and Neurology, 15(2), 82–90. [DOI] [PubMed] [Google Scholar]
- Myers CE, Kluger A, Golomb J, Gluck MA, & Ferris S (2008). Learning and generalization tasks predict short-term cognitive outcome in nondemented elderly. Journal of Geriatric Psychiatry and Neurology, 21(2), 93–103. [DOI] [PubMed] [Google Scholar]
- Naj AC, Jun G, Beecham GW, Wang L-S, Vardarajan BN, Buros J, … Crane PK (2011). Common variants at MS4A4/MS4A6E, CD2AP, CD33 and EPHA1 are associated with late-onset Alzheimer’s disease. Nature Genetics, 43(5), 436. [DOI] [PMC free article] [PubMed] [Google Scholar]
- Nettiksimmons J, Tranah G, Evans DS, Yokoyama JS, & Yaffe K (2016). Gene-based aggregate SNP associations between candidate AD genes and cognitive decline. Age, 38(2). 10.1007/s11357-016-9885-2 [DOI] [PMC free article] [PubMed] [Google Scholar]
- Palmqvist S, Schöll M, Strandberg O, Mattsson N, Stomrud E, Zetterberg H, … Hansson O (2017). Earliest accumulation of β-amyloid occurs within the default-mode network and concurrently affects brain connectivity. Nature Communications, 8(1), 1214 10.1038/s41467-017-01150-x [DOI] [PMC free article] [PubMed] [Google Scholar]
- Pasquini L, Scherr M, Tahmasian M, Meng C, Myers NE, Ortner M, … Zimmer C (2015). Link between hippocampus’ raised local and eased global intrinsic connectivity in AD. Alzheimer’s & Dementia: The Journal of the Alzheimer’s Association, 11(5), 475–484. [DOI] [PubMed] [Google Scholar]
- Petersen RC, Roberts RO, Knopman DS, Geda YE, Cha RH, Pankratz VS, … Rocca WA (2010). Prevalence of mild cognitive impairment is higher in men. Neurology, 75(10), 889–897. 10.1212/WNL.0b013e3181f11d85 [DOI] [PMC free article] [PubMed] [Google Scholar]
- Pooler AM, Polydoro M, Maury EA, Nicholls SB, Reddy SM, Wegmann S, … Hyman BT (2015). Amyloid accelerates tau propagation and toxicity in a model of early Alzheimer’s disease. Acta Neuropathologica Communications, 3 10.1186/s40478-015-0199-x [DOI] [PMC free article] [PubMed] [Google Scholar]
- Preacher KJ, & Hayes AF (2008). Asymptotic and resampling strategies for assessing and comparing indirect effects in multiple mediator models. Behavior Research Methods, 40(3), 879–891. 10.3758/BRM.40.3.879 [DOI] [PubMed] [Google Scholar]
- Ramirez LM, Goukasian N, Porat S, Hwang KS, Eastman JA, Hurtz S, … Klein E (2016). Common variants in ABCA7 and MS4A6A are associated with cortical and hippocampal atrophy. Neurobiology of Aging, 39, 82–89. [DOI] [PubMed] [Google Scholar]
- Reagh ZM, Noche JA, Tustison NJ, Delisle D, Murray EA, & Yassa MA (2018). Functional Imbalance of Anterolateral Entorhinal Cortex and Hippocampal Dentate/CA3 Underlies Age-Related Object Pattern Separation Deficits. Neuron, 97(5), 1187–1198. e4 10.1016/j.neuron.2018.01.039 [DOI] [PMC free article] [PubMed] [Google Scholar]
- Reitz C, Jun G, Naj A, Rajbhandary R, Vardarajan BN, Wang L-S, … Alzheimer Disease Genetics Consortium. (2013). Variants in the ATP-binding cassette transporter (ABCA7), apolipoprotein E ϵ4,and the risk of late-onset Alzheimer disease in African Americans. JAMA, 309(14), 1483–1492. 10.1001/jama.2013.2973 [DOI] [PMC free article] [PubMed] [Google Scholar]
- Rosenberg-Lee M, Ashkenazi S, Chen T, Young CB, Geary DC, & Menon V (2015). Brain hyper-connectivity and operation-specific deficits during arithmetic problem solving in children with developmental dyscalculia. Developmental Science, 18(3), 351–372. [DOI] [PMC free article] [PubMed] [Google Scholar]
- Sakae N, Liu C-C, Shinohara M, Frisch-Daiello J, Ma L, Yamazaki Y, … Carrasquillo MM (2016). ABCA7 deficiency accelerates amyloid-β generation and Alzheimer’s neuronal pathology. Journal of Neuroscience, 36(13), 3848–3859. [DOI] [PMC free article] [PubMed] [Google Scholar]
- Salami A, Pudas S, & Nyberg L (2014). Elevated hippocampal resting-state connectivity underlies deficient neurocognitive function in aging. Proceedings of the National Academy of Sciences, 111(49), 17654–17659. 10.1073/pnas.1410233111 [DOI] [PMC free article] [PubMed] [Google Scholar]
- Satoh K, Abe-Dohmae S, Yokoyama S, St George-Hyslop P, & Fraser PE (2015). ABCA7 loss of function alters Alzheimer amyloid processing. Journal of Biological Chemistry, jbc–M115. [DOI] [PMC free article] [PubMed] [Google Scholar]
- Shing YL, Rodrigue KM, Kennedy KM, Fandakova Y, Bodammer N, Werkle-Bergner M, … Raz N (2011). Hippocampal subfield volumes: age, vascular risk, and correlation with associative memory. Frontiers in Aging Neuroscience, 3, 2. [DOI] [PMC free article] [PubMed] [Google Scholar]
- Shulman JM, Chen K, Keenan BT, Chibnik LB, Fleisher A, Thiyyagura P, … Bennett DA (2013). Genetic susceptibility for Alzheimer disease neuritic plaque pathology. JAMA Neurology, 70(9), 1150–1157. 10.1001/jamaneurol.2013.2815 [DOI] [PMC free article] [PubMed] [Google Scholar]
- Skup M, Zhu H, Wang Y, Giovanello KS, Lin J, Shen D, … Fan Y (2011). Sex differences in grey matter atrophy patterns among AD and aMCI patients: Results from ADNI. Neuroimage, 56(3), 890–906. [DOI] [PMC free article] [PubMed] [Google Scholar]
- Song Z, Insel PS, Buckley S, Yohannes S, Mezher A, Simonson A, … Weiner MW (2015). Brain Amyloid-β Burden Is Associated with Disruption of Intrinsic Functional Connectivity within the Medial Temporal Lobe in Cognitively Normal Elderly. The Journal of Neuroscience, 35(7), 3240–3247. 10.1523/JNEUROSCI.2092-14.2015 [DOI] [PMC free article] [PubMed] [Google Scholar]
- Sperling RA, Dickerson BC, Pihlajamaki M, Vannini P, LaViolette PS, Vitolo OV, … Johnson KA (2010). Functional Alterations in Memory Networks in Early Alzheimer’s Disease. NeuroMolecular Medicine, 12(1), 27–43. 10.1007/s12017-009-8109-7 [DOI] [PMC free article] [PubMed] [Google Scholar]
- Sperling R, Mormino E, & Johnson K (2014). The evolution of preclinical Alzheimer’s disease: implications for prevention trials. Neuron, 84(3), 608–622. [DOI] [PMC free article] [PubMed] [Google Scholar]
- Sundar PD, Feingold E, Minster RL, DeKosky ST, & Kamboh MI (2007). Gender-specific association of ATP-binding cassette transporter 1 (ABCA1) polymorphisms with the risk of late-onset Alzheimer’s disease. Neurobiology of Aging, 28(6), 856–862. 10.1016/j.neurobiolaging.2006.04.005 [DOI] [PubMed] [Google Scholar]
- Tanaka N, Abe-Dohmae S, Iwamoto N, & Yokoyama S (2011). Roles of ATP-binding cassette transporter A7 in cholesterol homeostasis and host defense system. Journal of Atherosclerosis and Thrombosis, 18(4), 274–281. [DOI] [PubMed] [Google Scholar]
- Tang M-X, Cross P, Andrews H, Jacobs DM, Small S, Bell K, … Stern Y (2001). Incidence of AD in African-Americans, Caribbean hispanics, and caucasians in northern Manhattan. Neurology, 56(1), 49–56. [DOI] [PubMed] [Google Scholar]
- Thal DR, Rüb U, Schultz C, Sassin I, Ghebremedhin E, Del Tredici K, … Braak H (2000). Sequence of Aβ-protein deposition in the human medial temporal lobe. Journal of Neuropathology & Experimental Neurology, 59(8), 733–748. [DOI] [PubMed] [Google Scholar]
- Wang L, Zang Y, He Y, Liang M, Zhang X, Tian L, … Li K (2006). Changes in hippocampal connectivity in the early stages of Alzheimer’s disease: Evidence from resting state fMRI. NeuroImage, 31(2), 496–504. 10.1016/j.neuroimage.2005.12.033 [DOI] [PubMed] [Google Scholar]
- Zhao Q-F, Yu J-T, Tan M-S, & Tan L (2015). ABCA7 in Alzheimer’s Disease. Molecular Neurobiology, 51(3), 1008–1016. 10.1007/s12035-014-8759-9 [DOI] [PubMed] [Google Scholar]