Abstract
THz spectroscopy was used to probe changes that occur in the dynamics of the hydrogen bond network upon solvation of alcohol chains. The THz spectra can be decomposed into the spectrum of bulk water, tetrahedral hydration water, and more disordered (or interstitial) hydration water. The tetrahedrally ordered hydration water exhibits a band at 195 cm−1 and is localized around the hydrophobic moiety of the alcohol. The interstitial component yields a band at 164 cm−1 which is associated with hydration water in the first hydration shell. These temperature‐dependent changes in the low‐frequency spectrum of solvated alcohol chains can be correlated with changes of heat capacity, entropy, and free energy upon solvation. Surprisingly, not the tetrahedrally ordered component but the interstitial hydration water is found to be mainly responsible for the temperature‐dependent change in ΔCp and ΔG. The solute‐specific offset in free energy is attributed to void formation and scales linearly with the chain length.
Keywords: hydrophobic hydration, local water mapping, THz calorimetry
Hydrophobic hydration, the hydration of hydrophobic molecules and surfaces, is considered to play a key role in biological processes ranging from membrane formation to protein folding and ligand binding. Initially, hydrophobic hydration was visualized in terms of iceberg formation1 and local clathrates or clathrate‐like structures.6 Chandler et al. predicted an entropic, length‐scale‐dependent cost to the free energy in the case of the hydrophobic solvation of small species, because their presence limits the configuration space available for hydrogen bonding of the solvent (thermodynamic changes due to cavity formation).7 For small solutes (less than 1 nm), the water molecules are predicted to form a water cage with a tetrahedral structure around the hydrophobic moiety, whereas the solvation of extended hydrophobic surfaces should have a more disruptive effect on water structure: Large hydrophobic solutes cause an interface between bulk water and a dewetted zone close to the hydrophobic solute.7, 8, 9 Neutron diffraction experiments have disproved the strict notion of an ice structure of water around hydrophobes.10, 11, 12, 13 Nuclear magnetic resonance (NMR),15 pump–probe 2D IR,16 and femtosecond mid‐IR17 spectroscopic studies showed that these changes in the hydration bond network are accompanied by an increase in the relaxational and reorientational times of water around hydrophobes compared to bulk water. Water molecules around solvated methanol prefer to lie tangentially and form a cage around the methanol.14 Using vibrational spectroscopy, Ben‐Amotz and Bakker and co‐workers reported experimental evidence for a size‐ and temperature‐dependent change of water structures.18, 19 While at low temperatures a hydrophobically enhanced water structure with stronger H‐bonds was observed, for hydrophobic chains longer than 1 nm and for temperatures above 60 °C this tetrahedrally ordered hydration water structure is found to be increasingly replaced by a disordered structure with hydrogen bonds weaker than bulk water. Most recently, tetrahedral water structuring around the solvated hydrophobes was observed in the IR spectra of water around methane.26 For solvated propanol Duboué‐Dijon and Laage postulated the absence of ice‐like structures at the hydrophobic site: Based upon ab initio MD simulations they proposed the coexistence of strong water–water pair interactions and less ordered water configurations in the hydration shell of the hydrophobic moiety of propanol.21
THz spectroscopy is an experimental tool that is able to probe changes in the hydration bond network, which imprints its signature on the low‐frequency spectrum of the solvated alcohol at around 200 cm−1.5 Here, we used THz spectroscopy to probe hydrophobic hydration in the vicinity of alcohol chains.
In biomolecular recognition, directional hydrogen bonds, together with polar or charged residues, constitute a framework of noncovalent interactions between enzyme and substrate. Most strikingly, water, being a generic solvent, acts as a strong competing agent for all these interactions, leading to a delicate balance between functional structures and complete solvation. These interactions dictate the enthalpic (ΔH) and entropic (ΔS) contributions that mostly compensate and result in subtle energy differences of only a few kJ mol−1, which then dictate the biological function. Thus, mapping the local properties of water molecules’ solvating docking sites was introduced as a powerful simulation for drug design.4 Experimentally, differential and titration scanning calorimetry gives access to macroscopic changes in heat capacity Cp upon phase transitions1 or upon solvation under equilibrium conditions.2, 3 Here, we introduce THz calorimetry, wherein local changes of the hydration water are detected via their spectral fingerprints in the THz spectrum. These spectral changes can be linked to local heat capacities and thus local thermodynamics. The bridge between space‐resolved solvent dynamics and space‐resolved thermodynamics is evident, since under ambient, physiologically relevant conditions, 90 % of the states contributing to the total entropy of the protein solvent mixture are modes within the frequency range between 0 and 10 THz (300 cm−1).
Our present study explores whether experimental spectroscopic techniques probing the local hydration bond network modes in the vicinity of the solute yield information on the solute‐induced changes of the hydration network associated with changes in entropy and enthalpy. A correlation between spectroscopic and calorimetric data was previously proposed theoretically. Gallagher and Sharp found in their calculations a correlation between an increase in water–water pairs with low (linear) H‐bonds (when compared to bulk water) to an overall increase in the energy of water–water pairs and an increase in ΔCp=∂H 2/kT 2 with ∂H 2 being the mean squared fluctuations of the enthalpy.20 The presence of a solute perturbs the H‐bonding structure of the water in the hydration shell. If d 0, s 0, and θ 0 are the average H‐bond structural parameters for water in the absence of solute, i.e., for bulk water, then the change in heat capacity from an H‐bond with solute‐perturbed values of d, s, and θ can be calculated: The function ΔCp(d,s,θ) describes the incremental heat capacity per H‐bond as a function of solute‐induced H‐bond distortions. This yields the correlation ΔCp=∑NiΔCp(di,si,θi), where ΔCp(di,si,θi) is the contribution to heat capacity change arising from a summation of all H‐bonds which are perturbed by the solute.27
Inspired by this correlation, we investigated whether we can correlate the experimentally deduced percentage of tetrahedral or interstitial water pairs in the hydration water, as probed by THz spectroscopy, with changes in heat capacity, entropy, and enthalpy. Here, we present the results of a first study of solvated alcohols; in order to obtain the effective number of tetrahedral or interstitial hydration water molecules we recorded high‐precision temperature‐dependent spectra in the frequency range between 50 and 350 cm−1 as a function of temperature.
For water, collective modes dictate the THz range (100–700 cm−1), such as the translational, the intermolecular H‐bond stretch, and librational modes. The prominent peak seen at ca. 200 cm−1 for bulk water (Figure 1) is dominated by first‐shell dynamics, that is, the intermolecular H‐bond stretch, whereas concerted motions involving the second solvation shell, that is, collective translational motions, contribute most significantly to the spectrum below 100 cm−1. Any changes in the hydrogen bond network should imprint their signature on the low‐frequency spectrum probed around 200 cm−1.5 Here, we report the temperature‐dependent THz spectra of five alcohols with hydrocarbon chains of variable length (methanol, ethanol, propanol, butanol, pentanol) and a branched alcohol (tert‐butanol) at 0 °C, 10 °C, 20 °C, 30 °C, and 40 °C at a concentration of 0.5 mol L−1—or 0.2 mol L−1 for pentanol (see Figure 1 for butanol).
Figure 1.
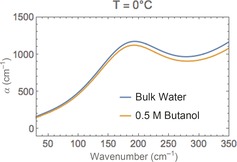
Low‐frequency spectrum of water and solvated butanol.
If we calculate the difference spectra (taking a density correction into account) we obtain the spectrum shown in Figure 2 for propanol. This spectrum can be decomposed into two parts: a positive part, which shows the spectrum of hydration water, and a negative part, which reflects the lack of bulk water due to volume exclusion. Based on this decomposition and following a well‐established protocol we deduced the effective number of hydration water molecules around the solute n w,h via ϵ solute = ϵ s + n w,h ϵ w,h − n w,h ϵ w,b where n w,h=c w,h/c s is the effective number of hydration water molecules per solute molecule that differ in their spectral properties from bulk water (see Ref. 22 for details). The number of affected water molecules, n w, increases with increasing chain length and with decreasing temperature. In order to check the similarity to clathrate structures, we recorded, in addition, the low‐frequency spectrum of a clathrate (19 % THF in water at 0 °C) and the low‐frequency spectrum of ice (see the Supporting Information). The spectrum of the THF clathrate can be decomposed in four bands, with the two main bands being centered at v=161 cm−1 and v=203 cm−1. For ice we observe two bands at 158 cm−1 and 214 cm−1. In order to test the hypothesis of a clathrate‐like structure, we tested whether the hydration water spectrum of the solvated alcohols can also be decomposed into two bands around 160 and 200 cm−1. Indeed, we found that the observed temperature‐dependent change of the hydration water can be decomposed into two bands with center frequencies of 164 cm−1 and 195 cm−1 for all alcohols (see Figure 2 and Figure 3).
Figure 2.
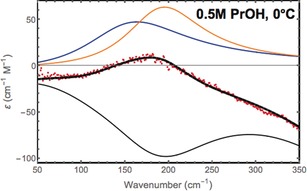
Dissection of the experimental difference spectrum (dots) into a negative part (lack of bulk water) and two positive parts attributed to hydration water for propanol. The reconstructed spectrum is shown for comparison.
Figure 3.
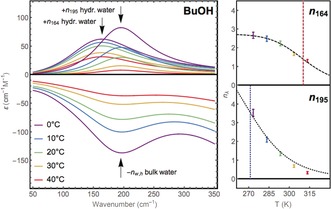
Left: Temperature‐dependent decomposition of the molar extinction of hydration water in two absorption bands: ν 164 and ν 195. The negative part accounts for a lack of bulk‐like water molecules. Right: Plot of the temperature‐dependent change of the equivalent number of water molecules for each hydration water band (n). The dashed line marks the melting temperature deduced from a two‐state thermodynamic model.
While the amplitude of each of these two bands, denoted as a 164 and a 195, is temperature and solute dependent, most interestingly, the two center frequencies and the linewidth remain the same for all alcohols and are fixed in the forthcoming analysis. As an example, the dissection of the positive hydration water peak of propanol into two low‐frequency modes centered at 164 and 195 cm−1 is shown in Figure 2. The temperature‐dependent change of the partial amplitude of each band for BuOH is shown in Figure 3, left.
The hydration water band at 195 cm−1 decreases more rapidly than the band at 164 cm−1 with increasing temperature. At 40 °C the partial contribution of the band centered at 195 cm−1 is almost zero, implying that this part of the water behaves in a bulk‐like fashion. Figure 3, right, shows the change in amplitude with increasing temperature. The effective number of hydration water molecules in each of the two bands can be fitted assuming a two‐state thermodynamics: n(T)=n(0)/(1+exp(ΔH/(R(1/T−1/T m))), where ΔH and T m are the difference in enthalpy and a melting temperature, that is, the temperature when half of the population behaves bulk‐like. As a result of a fit of the data, we obtain T 195,m=271(6) K independent of the alcohol, ΔH 195= 35(5) kJ mol−1 for methanol, and ΔH 195=40(3) kJ mol−1 for all other alcohol chains besides methanol. Two‐state thermodynamics yields ΔH 164=63(10) kJ mol−1 and a melting temperature T m of 310–330 K for all alcohols. By comparison we find a clear increase of the relative contribution of the band at 195 cm−1 upon increasing chain length and an even more significant increase when we increase the size of the hydrophobic moiety, that is, on going from BuOH to tBuOH.
Any strengthening of the hydrogen bond will result in a red shift of the intramolecular OH stretch and a blue shift of the intermolecular H‐bond stretch. In the IR, the OH peak at 3200 cm−1,18 is assigned to a tetrahedral hydration water structure. Here, we assign the hydration water mode ν 195 to the intermolecular hydrogen bond stretch mode of the enhanced tetrahedral water structure in the vicinity of the hydrophobic alkyl group. This assignment is supported by the fact that this band is enhanced for tBuOH compared to BuOH. The melting temperature T m is 271 K, which is close to the melting temperature of ice. ΔH 195 corresponds to the energy that is required to break two hydrogen bonds.23
The second mode ν 164 is red‐shifted compared to the H‐bond stretch of bulk water, indicating a weakening of the H‐bond, as is characteristic for distorted water. Ben‐Amotz et al.18 observed also a second, blue‐shifted OH‐stretch mode for solvated alcohols, that is, a dangling OH mode, which was assigned to distorted water molecules. Head‐Gordon pointed out that extensive networking in the first shell of a solute restricts the number and type of hydrogen bonding pathways that lead back to the bulk water.14 Thus, weaker hydrogen bonds are expected for interstitial water molecules at the interface between a solute or a clathrate‐like structure and bulk water. The amplitude of the band ν 164 correlates with both the number of CH2 groups and with the hydrophilic group moiety. T m of this component is 310–330 K. For higher alcohol concentrations the relative amplitude of these bands is enhanced compared to the ν 195 band. We assign this band to hydration waters that have been (sterically) forced into energetically less favorable water–water pair configurations in the first hydration shell. This band is partially attributed to ν OO of the solvated methanol–(H2O) complex (predicted at 163 cm−1)24 and partially to hydration water which is unable to form a perfect tetrahedral water network due to steric constraints.
Ab initio MD studies by Duboué‐Dijon and Laage revealed competing effects, that is, a contraction of the first‐shell oxygen–oxygen distances and a depletion in interstitial water molecules located between the first and second shell upon cooling.21 Here we find experimental evidence for both effects. While the increase of the ν 195 band is attributed to an increase of contracted water–water pairs at the hydrophobic site, the increase of the ν 164 is attributed to an increase of interstitial water compared to bulk water.
In the next step, we assume that each type of hydration water, denoted ν 164 and ν 195, has a specific molar heat capacity Cp, which differs from that of bulk water, that is, Cp 164 and Cp 195. The partial contribution of each of these modes to the hydration water is estimated to be proportional to n 164(T) und n 195(T), the effective number of water molecules for each type of hydration water, which are deduced from the experimentally observed amplitudes of a 164(T) and a 195(T). n 164(T)=c w,h164(T)/c s(T); n 195(T)=c w,h195(T)/c s(T), see the Supporting Information for details. Consequently, we make the following ansatz for the molar mixing heat capacity: ΔCp(T)=ΔCp 164 n 164(T) + ΔCp 195 n 195(T) + ΔCp solute; that is, we assume that any temperature dependence of ΔCp is attributed exclusively to changes in n 164(T) and n 195(T). ΔCp 164=(Cp 164−Cp w,bulk) and ΔCp 195=(Cp 195−Cp w,bulk) are constants and temperature independent. ΔCp solute summarizes solute‐specific changes of Cp with respect to bulk water at a given reference temperature. ΔH(T) and ΔS(T) can be deduced by integration of ΔCp(T) and ΔCp(T)/T, respectively. If we insert n 164(T) and n 195(T) we can predict the well‐documented macroscopic calorimetric observables23, 24 (ΔCp(T), ΔS(T), ΔH(T), and ΔG(T)) for all temperatures and all alcohol chains. The resulting 120 thermodynamic data points were fitted globally with a model containing 20 independent parameters. The result for Cp is shown in Figure 4. We find a remarkable quantitative agreement between the predicted temperature changes and the literature values! The fitted parameters are summarized in the Supporting Information. The blue line corresponds to the well‐known macroscopic calorimetric values, the red dots are the predicted values based on the result of the fit. Note that only two parameters, ΔCp 164 and ΔCp 195, are sufficient to describe the temperature dependence ΔCp(T) for all alcohols. The increase in Cp of hydration water probed at ν 164 and ν 195 is ΔCp 164=35(3) J mol K−1 and ΔCp 195=8.4(9) J mol K−1. Surprisingly, not the increase in tetrahedrally ordered water but changes of the partial contribution of interstitial hydration water dominate the temperature‐dependent increase in ΔCp and ΔG. Based on our result ΔCp can be predicted from the measurement of the hydration water localized at the CH3 and the OH moieties and a solute specific offset value.
Figure 4.
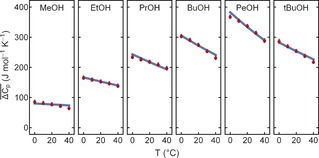
THz calorimetry probing hydrophobic hydration: Displayed are the tabulated temperature‐ and solute‐dependent changes in heat capacity taken from previous calorimetric references2, 3 (blue line) and the values deduced by THz calorimetry (red dots) where the temperature‐ and solute‐dependent low‐frequency spectra serve as an input.
Let us turn our attention to the solute‐specific offset values ΔCp solute and ΔG solute, which are deduced from the fit (see Figure 5). When the influence of the localized hydration water (n eff=0) is artificially switched off, by using a reference temperature of T=400 K, a simple, linear chain‐length dependence is obtained for all thermodynamic parameters. This is in agreement with Chandler's prediction that for small solutes cavity formation causes a change in free energy, ΔΔG, which is proportional to the increase in excluded volume and, therefore, proportional to the chain length.7 As shown in Figure 5 this prediction is in very good agreement with our results. For tBuOH, the change in free energy is dominated by entropy changes. For longer chains, such as PeOH, the enthalpic contribution to ΔG dominates. Our experimental data rationalize the anticipated crossover from entropic‐ to enthalpic‐governed behavior for increasing amphiphilicity, longer chains, and increasing temperatures.7 These results support the conclusions from previous Raman measurements in showing that the hydration water can be portioned in partial contributions due to more tetrahedral and due to more distorted water.18 These new results underline the significance of the weaker hydrogen‐bonded water for the changes measured by calorimetry. The concentration dependence and the measurement suggest that the interstitial or more disordered hydration water is dominant in the first hydration layer, since this band remains intact longer even at higher concentrations. We assign this to an air–water interface‐like structure at the interface between the solute and water. Note that ν164 has a higher T m compared to ν195.
Figure 5.
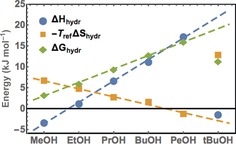
Fitted values for the individual solute‐specific offset of the solvation free energy at 400 K.
In this work we introduce the novel method of THz calorimetry: Spectral changes in the low‐frequency spectrum can be directly correlated with changes in heat capacity, enthalpy, and entropy. As a result, we have found that the change in free energy upon solvation of linear alcohol chains is dominated by an excluded‐volume effect. However, the prediction of the solute‐specific temperature dependence of ΔG depends sensitively on changes in the localized hydration waters. Owing to the sensitivity of THz calorimetry, it is possible to probe these local changes in hydration water, making it the first example of experimental water mapping to our knowledge. In the future, time‐resolved measurements under non‐equilibrium conditions can be performed with this method. Such investigations promise to reveal interesting details of the molecular process, but are clearly beyond the scope of conventional calorimetry.
Experimental Section
Spectra of sample solutions with concentrations of 0.5 m (0.2 m for PeOH) were recorded at five different temperatures (0 °C, 10 °C, 20 °C, 30 °C, and 40 °C) in the frequency range between 50 and 350 cm−1 using FTIR absorption spectroscopy.
THz/FIR absorption measurements were carried out using a Bruker Vertex 80v FTIR spectrometer equipped with a liquid‐helium‐cooled silicon bolometer from Infrared Laboratories as the detector. The sample solutions were placed in a leak‐free temperature‐controlled liquid transmission cell from Harrick with two amorphous diamond windows of 0.5 mm thickness supplied by Diamond Materials and a Kapton spacer of ca. 30 μm thickness. The exact thickness of the sample layer was determined prior to each measurement using the Fabry‐Pérot etalon effect of the empty cell. For each individual spectrum, 64 scans with a resolution of 2 cm−1 were averaged. During each series of measurements, the sample compartment was continuously purged with technical‐grade dry nitrogen to minimize humidity effects of the air. For a detailed description of the analysis see the Supporting Information.
Conflict of interest
The authors declare no conflict of interest.
Supporting information
As a service to our authors and readers, this journal provides supporting information supplied by the authors. Such materials are peer reviewed and may be re‐organized for online delivery, but are not copy‐edited or typeset. Technical support issues arising from supporting information (other than missing files) should be addressed to the authors.
Supplementary
Acknowledgements
We are grateful for helpful discussions with R. Glaves. M.H. acknowledges financial support from the Cluster of Excellence RESOLV (EXC 1069) funded by the Deutsche Forschungsgemeinschaft and support by the ERC Advanced Grant 695437 THz‐Calorimetry.
F. Böhm, G. Schwaab, M. Havenith, Angew. Chem. Int. Ed. 2017, 56, 9981.
References
- 1. Laage D., Stirnemann G., Hynes J. T., J. Phys. Chem. B 2009, 113, 2428–2435. [DOI] [PubMed] [Google Scholar]
- 2. Dohnal V., Fenclová D., Vrbka P., J. Phys. Chem. Ref. Data 2006, 35, 1621–1651. [Google Scholar]
- 3. Fenclová D., Dohnal V., Vrbka P., Lastovka V., J. Chem. Eng. Data 2007, 52, 989–1002. [Google Scholar]
- 4. Kamps J. J. A. G., Huang J. X., Poater J., Xu C., Pieters B. J. G. E., Dong A. P., Min J. R., Sherman W., Beuming T., Bickelhaupt F. M., Li H. T., Mecinovic J., Nat. Commun. 2015, 6, 8911. [DOI] [PMC free article] [PubMed] [Google Scholar]
- 5. Heyden M., Sun J., Funkner S., Mathias G., Forbert H., Havenith M., Marx D., Proc. Natl. Acad. Sci. USA 2010, 107, 12068–12073. [DOI] [PMC free article] [PubMed] [Google Scholar]
- 6. Raschke T. M., Levitt M., Proc. Natl. Acad. Sci. USA 2005, 102, 6777–6782. [DOI] [PMC free article] [PubMed] [Google Scholar]
- 7. Chandler D., Nature 2005, 437, 640–647. [DOI] [PubMed] [Google Scholar]
- 8. Matysiak S., Debenedetti P. G., Rossky P. J., J. Phys. Chem. B 2011, 115, 14859–14865. [DOI] [PubMed] [Google Scholar]
- 9. Huang D. M., Chandler D., Proc. Natl. Acad. Sci. USA 2000, 97, 8324–8327. [DOI] [PMC free article] [PubMed] [Google Scholar]
- 10. Garde S., Patel A. J., Proc. Natl. Acad. Sci. USA 2011, 108, 16491–16492. [DOI] [PMC free article] [PubMed] [Google Scholar]
- 11. Friesen A. D., Matyushov D. V., J. Chem. Phys. 2011, 135, 104501. [DOI] [PubMed] [Google Scholar]
- 12. Cheng Y. K., Rossky P. J., Nature 1998, 392, 696–699. [DOI] [PubMed] [Google Scholar]
- 13. Pratt L. R., Annu. Rev. Phys. Chem. 2002, 53, 409–436. [DOI] [PubMed] [Google Scholar]
- 14. Head-Gordon T., Proc. Natl. Acad. Sci. USA 1995, 92, 8308–8322. [DOI] [PMC free article] [PubMed] [Google Scholar]
- 15. Ishihara Y., Okouchi S., Uedaira H., J. Chem. Soc. Faraday Trans. 1997, 93, 3337–3342. [Google Scholar]
- 16. Bakulin A. A., Pshenichnikov M. S., Bakker H. J., Petersen C., J. Phys. Chem. A 2011, 115, 1821–1829. [DOI] [PubMed] [Google Scholar]
- 17. Petersen C., Tielrooij K. J., Bakker H. J., J. Chem. Phys. 2009, 130, 214511. [DOI] [PubMed] [Google Scholar]
- 18. Davis J. G., Gierszal K. P., Wang P., Ben-Amotz D., Nature 2012, 491, 582–585. [DOI] [PubMed] [Google Scholar]
- 19. Strazdaite S., Versluis J., Backus E. H. G., Bakker H. J., J. Chem. Phys. 2014, 140, 054711. [DOI] [PubMed] [Google Scholar]
- 20. Gallagher K. R., Sharp K. A., J. Am. Chem. Soc. 2003, 125, 9853–9860. [DOI] [PubMed] [Google Scholar]
- 21. Duboué-Dijon E., Laage D., J. Phys. Chem. B 2015, 119, 8406–8418. [DOI] [PMC free article] [PubMed] [Google Scholar]
- 22. Decka D., Schwaab G., Havenith M., Phys. Chem. Chem. Phys. 2015, 17, 11898–11907. [DOI] [PubMed] [Google Scholar]
- 23. Jorgensen W. L., Chandrasekhar J., Madura J. D., Impey R. W., Klein M. L., J. Chem. Phys. 1983, 79, 926–935. [Google Scholar]
- 24. Kirschner K. N., Woods R. J., J. Phys. Chem. A 2001, 105, 4150; [DOI] [PMC free article] [PubMed] [Google Scholar]; van Erp T. S., Meijer E. J., Chem. Phys. Lett. 2001, 333, 290–296. [Google Scholar]
- 25. Fox J. M., Kang K., Sherman W., Heroux A., Sastry G. M., Baghbanzadeh M., Lockett M. R., Whitesides G. M., J. Am. Chem. Soc. 2015, 137, 3859–3866. [DOI] [PMC free article] [PubMed] [Google Scholar]
- 26. Grdadolnik J., Merzel F., Avbelj F., Proc. Natl. Acad. Sci. USA 2017, 114, 322–327. [DOI] [PMC free article] [PubMed] [Google Scholar]
- 27. Sharp K. A., Madan B., J. Phys. Chem. B 1997, 101, 4343–4348. [Google Scholar]
Associated Data
This section collects any data citations, data availability statements, or supplementary materials included in this article.
Supplementary Materials
As a service to our authors and readers, this journal provides supporting information supplied by the authors. Such materials are peer reviewed and may be re‐organized for online delivery, but are not copy‐edited or typeset. Technical support issues arising from supporting information (other than missing files) should be addressed to the authors.
Supplementary


