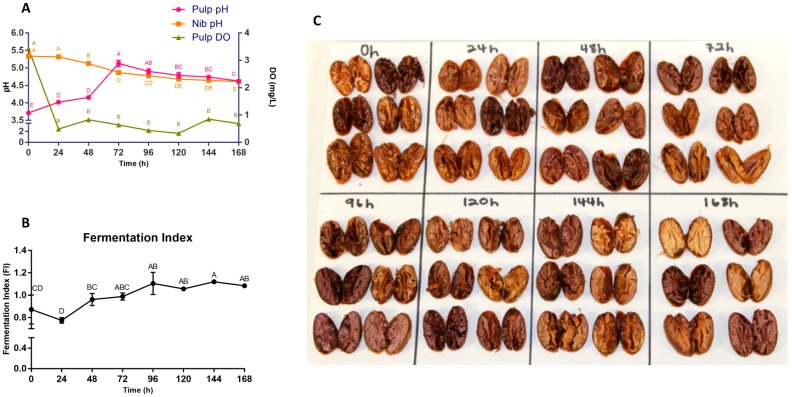
Figure 1.
(A) pH measurements for both simulated pulp media and bean nib. It is important to note that, for bean nib measurements, these values do not quantify the pH of the cocoa bean itself, but rather of the acidity derived when bean acids are diluted in water. These nib values are useful for comparison between the pH of the solution produced by beans at different time points. Dissolved oxygen (DO) measurements within the simulated pulp media are expressed in mg/L. (B) Fermentation index (FI) expressed as a ratio of absorbance at 460 and 530 nm. (C) Cut test of six randomly selected beans per each timepoint. Beans were selected from both fermentation treatments to form one composite representation. Values are presented as the mean ± SEM of fermentation replicates. Significance between time points for each value was determined by one-way ANOVA and Tukey’s HSD post-hoc test (p < 0.05). Time points with different letters are significantly different within values.

