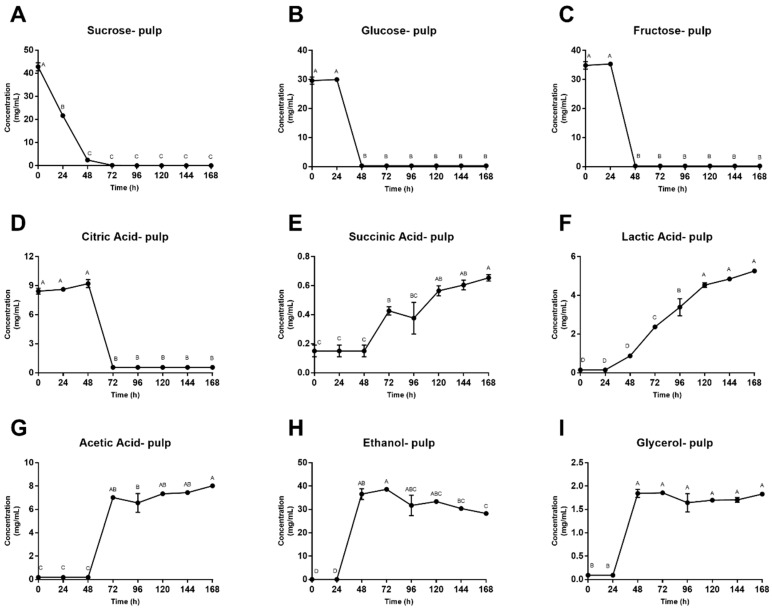
Figure 3.
(A–I) Concentration of fermentation substrates and metabolites in simulated pulp media across 168 h. Values are presented as the mean ± SEM of fermentation replicates. Significance between time points was determined by one-way ANOVA and Tukey’s HSD post-hoc test (p < 0.05). Time points with different letters are significantly different within values.

