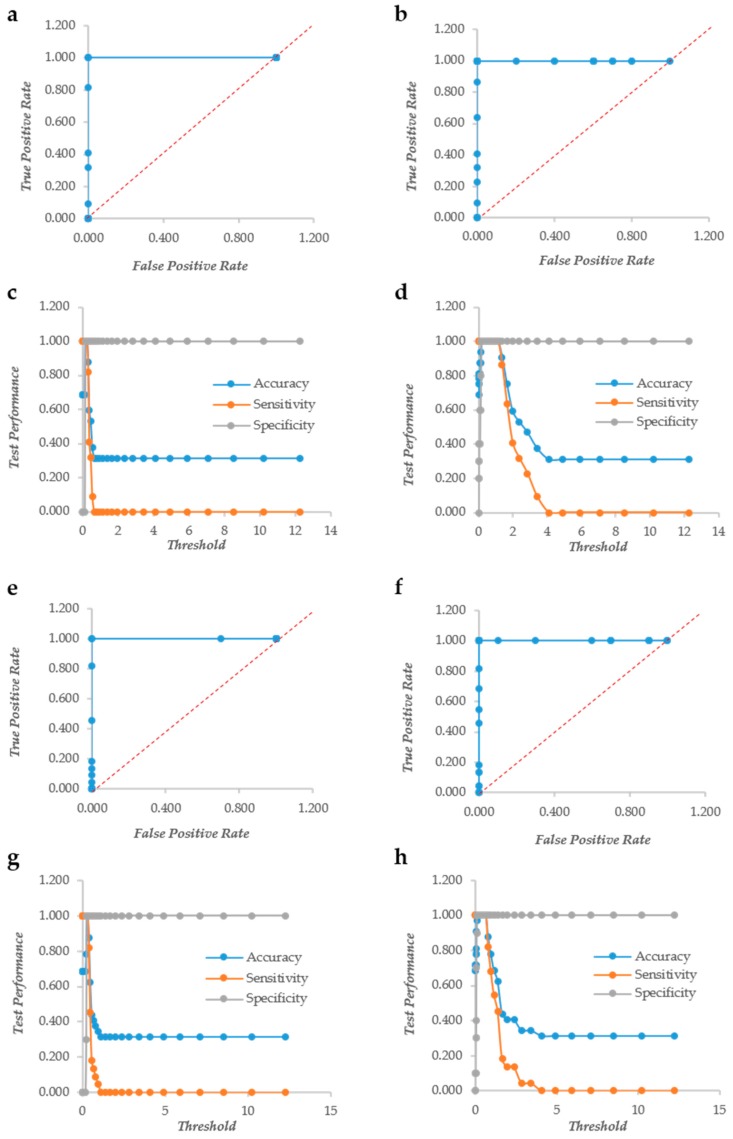
Figure 1.
The Response Operator Characteristic (ROC) curves showing the ability to classify raw and normalized CV and XTT TECAN reads of Candida biofilm. The ROC curve and its parameters were obtained from raw read values recorded for CV staining (Panel (a) and (c) respectively), from normalized read values calculated for CV staining (Panel (b) and (d) respectively), from raw read values recorded for XTT staining (Panel (e) and (g) respectively) and from normalized read values calculated for XTT staining (Panel (f) and (h) respectively).

