

Abstract
We propose a new technique for analyzing the raw neurogram which enables the study of the discharge behavior of individual and group neurons. It utilizes an ideal bandpass filter, a modified wavelet de-noising procedure, an action potential detector, and a waveform classifier. We validated our approach with both simulated data generated from muscle sympathetic neurograms sampled at high rates in five healthy subjects and data recorded from seven healthy subjects during lower body negative pressure suction. The modified wavelet method was superior to the classical discriminator method and the regular wavelet de-noising procedure when applied to simulated neuronal signals. The detected spike rate and spike amplitude rate of the action potentials correlated strongly with number of bursts detected in the integrated neurogram (r = 0.79 and 0.89, respectively, p < 0.001).
Eight major action potential waveform classes were found to describe more than 81% of all detected action potentials in all subjects. One class had characteristics similar in shape and in average discharge frequency (27.4 ± 5.1 spikes/min during resting supine position) to those of reported single vasoconstrictor units. The newly proposed technique allows a precise estimate of sympathetic nerve activity and characterization of individual action potentials in multiunit records.
Keywords: Nervous system, noise, pattern classification, signal detection, signal processing, wavelet transforms
I. Introduction
Microneurography is a common method used to directly measure the nerve activity in the sympathetic bundle of a mixed nerve and to estimate sympathetic outflow. Because the microneurographic signal has a very low amplitude, in the range of 1–10 µV, has a relatively high noise level, and uses a monopolar recording arrangement, the signal has to be preprocessed before being quantified and analyzed. The usual procedure is to create the linear envelope in analog form as shown in Fig. 1. The measured microneurographic signal, sometimes called the raw neurogram, is amplified (gain between 1000 and 99 000), bandpass filtered (from 700 to 2000 Hz), and full-wave rectified. At this point the base line noise will often be reduced with a threshold discriminator. The final step is to create the envelope with a first-order resistance-capacitance integrating network with a time constant of 0.1 s. This processed signal is also called the integrated or mean voltage neurogram [1], [2]. If neural activity is recorded from a nerve bundle which innervates the vessels in the muscle, the particular neurogram is called muscle sympathetic nerve activity (MSNA). Fig. 1 presents the preprocessing steps of MSNA. As shown in this figure, groups of action potentials firing closely together in time in the raw MSNA form bursts in the integrated MSNA. The amount of neural activity is often quantified by counting the number or time rate of these bursts [3]. Other quantification measures include: the estimation of mean burst amplitude [4], [5], total burst amplitude, or burst area [6]. These latter measures have their limitation for inter-individual comparisons because the burst magnitudes depend on the number of multiunit fibers the signal has been recorded from and on variable recording conditions (needle position relative to nerves, environmental noise level, and amplifier gain). Thus, normalization procedures have to be applied.
Fig. 1.

Common signal preprocessing steps to create an integrated neurogram from the recorded raw neurogram. The neurogram depicted above was recorded from nerve bundles innervating vessels in the muscle and is called muscle sympathetic nerve activity (MSNA).
Analysis of the raw neurogram itself has now been made possible due to recent advances in high-performance computing hardware. Semi-automated analysis of single-unit action potentials in the filtered neurogram has been implemented successfully [7]–[9]. One major challenge to this approach is the detection of low amplitude action potentials in neurograms with high background noise. Recently, wavelet de-noising methods have been developed to reduce background noise with random Gaussian characteristics in physiological and electrical signals, thus improving the signal-to-noise ratio (SNR) [10], [11]. We propose a new technique for analyzing the raw neurogram which utilizes the wavelet transform and could be implemented on microprocessor boards for data reduction. This wavelet method would enable the study of individual and group neuronal discharge behavior while minimizing the loss of physiological information. It is composed of an ideal bandpass filter, a wavelet de-noising procedure, an action potential detector, and a waveform classifier, Fig. 2. In this paper, we describe the development and accuracy of this technique and compare it against common methods of analysis.
Fig. 2.

Concept of digital signal processing of the raw neurogram based on a wavelet de-noising technique and spike detection and classification.
A. Methods
The technique was developed, tested, and validated in three different phases. We feel it is best to present the work organized into these three phases and then discuss and summarize them in one section. The goals of the three phases are stated below.
In phase I, the goals were to determine 1) the frequency characteristics of the raw neurogram, 2) the optimum sampling rate for acquiring the raw neurogram, and 3) the characteristics of noise in the filtered neurogram.
In phase II, the goals were 1) to create simulated signals consisting of action potential trains with various noise levels, 2) to create three methods for action potential detection, 3) to determine which method yields optimal detection results, and 4) to show that a 5-kHz sampling rate is sufficient for some action potential detection methods.
In phase III, the goals were 1) to demonstrate that direct measures of action potential activity correspond strongly to the presently accepted measures of sympathetic nerve activity and 2) to classify the shapes of the detected action potentials.
All calculations and analyses were performed in the MATLAB analysis environment (The Math Works Inc., Natick, MA) or PV-Wave environment (Visual Numerics, Inc., Boulder, CO).
II. Phase I
A. Methods
Data Acquisition—Dataset 1:
Microneurographic data were acquired from five healthy subjects (three males two females, 27 ± 2 yrs) in resting supine position. The MSNA was recorded from the peroneal nerve at the fibular head. A tapered, insulated tungsten electrode was inserted percutaneously into the sympathetic bundle of the peroneal nerve. The electrode had a 200-µm-diameter tip with an un-insulated portion approximately 1–2 µ.m in length (Fredrick Haer & Co., Bowdolnham, ME). A stainless-steel reference electrode was placed subcutaneously about 2 cm from the recording site. Satisfactory placement of the electrode for good recordings of MSNA was insured by adhering to generally accepted criteria described by Sundlof and Wallin [3].
The neurograms were measured with a nerve traffic analysis system (662C-3, Bioengineering of University of Iowa, Iowa City, IA). It performs the operations shown in Fig. 1. The raw neurogram is the output of the amplifier (raw MSNA), the filtered neurogram is the output of the bandpass filter with 700 Hz to 2 kHz (filtered MSNA), and the integrated neurogram (integrated MSNA) is the output of the integrator. All signals were digitized at a sampling rate of 47.16 kHz with a data acquisition system (VR-100A, INSTRUTECH Corp., Elmont, New York).
Neurograms of 3-min duration from all five subjects underwent analyses unless otherwise stated.
B. Analyses
Frequency Characteristics of the Raw Neurogram:
Baseline signals of 30-s duration in all subjects were analyzed for frequency content. The power spectral density (PSD) of the raw MSNA was estimated by Welch’s method [12]. The signals were partitioned into 59 segments, which overlapped by 50%. A Hanning window was applied to reduce the leakage error.
Optimal Sampling Rate:
To test for the optimal sampling frequency, the raw MSNA was interpolated to have a sampling rate of40 000 Hz. Signals with other sampling frequencies were produced by decimating this signal to 20 000, 10 000, 5000, and 2500 Hz. The adequacy of the sampling rate was assessed as follows: first, the signals with lower sample frequencies were interpolated back to 40 000 Hz.; then the squared error between the original signal and interpolated signal was calculated for the measure of adequacy.
Noise Characteristics of the Filtered Neurogram:
An amplitude histogram was generated and a Quantile-to-Quantile (Q-Q) plot analysis was performed to determine if the nonperiodic noise in the filtered MSNA had a Gaussian distribution [13].
C. Results
Frequency Characteristics of the Raw Neurogram:
The power spectral analysis of dataset 1 showed that 95% of the total power lies within the frequency range between 100 Hz and 2 kHz. However, harmonics of 60 Hz had their maximum power in the lower frequency range and this power decreased dramatically with frequencies above 600 Hz (Fig. 3). Therefore, a bandpass filter from 700 Hz to 2 kHz would be effective to eliminate power-line noise and limit the bandwidth of the signal.
Fig 3.

Power spectra of a high sampled raw MSNA signal
Optimal Sampling Rate:
The average total squared error ± one standard error(s.e.)between the original signal and the signals interpolated from the lower sampling rates are shown in Table I. The total squared error drops sharply at 10 kHz and asymptotically approaches zero. Thus, 10 kHz seems to be the optimal sampling rate for representing the amplitude features in the neurogram.
TABLE 1.
Average Total Squared Error Versus. Sampling FrequencY
| Frequency | 2.5 kHz | 5 kHz | 10 kHz | 20 kHz |
|---|---|---|---|---|
| Total Error | 18600±5843 | 98±28 | 0.02±0.00 | 0.00±0.00 |
Average ± Standard Error of Mean
Noise Characteristics of the Filtered Neurogram:
A representative result of the Q-Q plot analysis is shown in Fig. 4. A scaled Gaussian probability density function with the same mean and variance as the noise is superimposed on the histogram of the filtered signal amplitudes. The accompanying Q-Q plot was used to estimate the variance of the noise [13]. The figure illustrates that the lower amplitudes have a Gaussian distribution and, thus, may be considered random noise. The larger signal amplitudes (tails of the histogram) are not fit by the hypothetical Gaussian model and may, therefore, represent the peaks of the action potentials in the neurogram. Thus, the noise has a Gaussian distribution with a variance that can be estimated between the 5th and 95th percentile of amplitudes in the neurograms.
Fig. 4.

The amplitudes of the filtered neurogram are used to generate a histogram which was fitted with a Gaussian distribution (left), and Q-Q plot (right bottom). The Q-Q plot displays the calculated sample quantiles (thick line of+) versus the theoretical quantiles from the normal distribution (thin line −). A straight line suggests a normal distribution [13]. As demonstrated by the good fit of the Gaussian curve in the central region (left) and the alignment of straight portion of the sample quantiles with the ideal Gaussian line (right) the smaller amplitudes of the filtered neurogram appear to be fit well by a Gaussian distribution. However, the larger amplitudes deviate from the Gaussian curve and the straight line of the QQ-plot and, thus, cannot be considered Gaussian noise and are suspected to be parts of action potentials. The variance of the noise can be estimated from the fitted straight line in the Q-Q plot.
III. Phase II
A. Methods
Simulated Neurogram:
From data set 1 a 1-min segment with high SNR was selected. First, the noise variance was estimated using a Q-Q plot [13]. Signal amplitudes that exceed four standard deviations of the estimated noise amplitude were then identified as positive or negative action potential peaks. Next, all peaks occurring close in time were connected if they could smoothly form an action potential waveform with two or three phases. The continuity of the signal was validated by manual inspection to insure that the shapes of artificial action potential spikes were similar to the real ones.
Choice of Wavelet:
The wavelet types “Daubechies 4” and “Symlet 7” were chosen as candidate wavelets for the de-noising procedure [14]. These wavelets were selected based on their similarity to true action potential waveforms (Fig. 7).
Fig. 7.

(upper panel) Shape of an action potential, wavelet Symlet 7, and wavelet Daubechies 4. (lower panel) The effect of de-noising techniques on the final averaged waveform of action potentials after digital filtering only (A), filtering and de-noising with wavelet Symlet 7 (B), or filtering and de-noising with wavelet DB4 (C).
Wavelet Decomposition and De-Noising:
The Mallat algorithm for discrete wavelet transformation was used for fast signal decomposition and reconstruction of the neurogram. A block diagram and short explanation of the algorithm is presented in Fig. 5. Two de-noising techniques were examined based on the method developed by Donoho [15], [16]. Both involved thresholding of the detail coefficients. One implemented Donoho’s method directly (referred to here as the Regular Method). This procedure assumes that the noise is white and not band-limited. The second algorithm modified the Donoho method to account for the pre-filtering of the neurograms being de-noised (termed the modified method in this paper). The choice of decomposition level and modified threshold formula are also critical factors for the effectiveness of the de-noising procedure which must also be evaluated.
Fig. 5.

Block diagram of Mallat algorithm for discrete wavelet transformation (DWT) and reconstruction with an additional denoising step. The input signal (C) is passed through two complementary filters, a high-pass filter (g) and a low-pass filter (h). The filtered signals are subsequently decimated by a factor of 2 to maintain the same number of data points as the input signal. Two sets of DWT coefficients, the low frequency approximation coefficients (a) and high-frequency detail coefficients (d) are the result of these processes. These steps can then be repeated using the approximation coefficients as the input, resulting in another set of approximation and detail coefficients. The original signal can then be reconstructed by reversing the process. Applying a thresholding step prior to reconstruction allows for significant noise reduction.
Thresholding and Noise Estimation:
The regular wavelet de-noising technique proposed by Donoho [15], [16] includes a threshold for each decomposition level
| (1A) |
where σ is the standard deviation of the Gaussian noise and N is the number of samples in the signal. The σ for each level is estimated as the median absolute value of the wavelet coefficients divided by 0.6745, which is the 75th percentile of the standard normal distribution [15], [16]. Donoho then used detail coefficients which are modified by soft thresholding (2A) for reconstruction of the de-noised signal [15], [16].
| (2A) |
The proposed modified de-noising method uses 1) an additional correction factor k for the threshold calculation
| (1B) |
with estimation of σ from the Quantile to Quantile plot (Q-Q plot) [13], and 2) hard thresholding instead of soft thresholding (2B)
| (2B) |
The best method was determined by 1) adding Gaussian distributed noise of various levels to the simulated signal, 2) applying each method for de-noising, 3) identifying action potentials using a threshold detection method, and 4) calculating correctness of detection. The Gaussian distributed noise was generated within MATLAB using the built-in function to achieve SNRs from 1 to 6. The SNR was defined as the square-root of the ratio between the average action potential height squared and the noise variance.
Detection Performance.
We estimated the percentage of correct detection (PCD) as the percentage of correctly detected action potentials with respect to the total number in the simulated signal. We defined the percentage of error (PE) as the percentage of combined false (has no correspondent action potential in simulated signal) and missed (undetected action potentials present in the simulated signal) detections.
Optimal Decomposition Level.
After the best method was selected, the optimal decomposition level was chosen by determining which decomposition level yielded the lowest PE.
Comparison of Detection Methods:
In order to compare the performance of the two wavelet methods with respect to accepted techniques, a classical discriminator method was implemented to detect the action potentials [17], [18]. The threshold level was determined by (1B)
Effect of Sampling Rate on the Detection Results:
A comparison of the effect of sampling rate on correct spike detection in the nonfiltered raw neurogram was performed with several different detection methods. The previously generated simulated action potential signals with sampling rates of 5000 and 10 000 Hz were again used. Gaussian white noise with variance equal to original noise variance was added to each simulated signal. Action potentials were detected using the modified and classical detection methods.
B. Results
Simulated Neurogram:
A segment of the filtered neurogram and its resultant simulated, noiseless action potential signal are shown in Fig. 6. The simulated signal has the same randomness and clustering of action potentials as that displayed in the original neurogram. Thus, it appears to be a suitable test signal.
Fig. 6.

The simulated noiseless neurogram (Simulation) is shown below the measured neurogram (Filtered MSNA) from which it was created.
Choice of Wavelet:
The wavelet type “Symlet 7” has been chosen for all wavelet procedures for two reasons. Initially, it was selected as a candidate because its shape is very similar to that of an action potential spike, as demonstrated in Fig. 7 (upper panel). Symlet 7 also appears to generate de-noised signals which are more like the filtered signal input than those produced by similar wavelets, such as “Daubechies 4” [Fig. 7 (lower panel)]. Only the results of wavelet type “Symlet 7” will be shown in Sections III-B-III-IV.
Wavelet Decomposition and De-Noising:
Thresholding and Noise Estimation.
Fig. 8 shows the PE versus noise variance for the various correction factors tested. For all factors the PE increases as noise variance increases. The PE was lowest over almost the entire range of variances when the factor k in (IB) is 0.8.
Fig. 8.

Probability of error of detection for different threshold levels in wavelet denoising technique versus different noise levels
Optimal Decomposition Level.
Fig. 9 shows the PE for different decomposition levels. The PE ranges between 10.5% and 14%. The minimum value occurs at a decomposition level of 5.
Fig. 9.
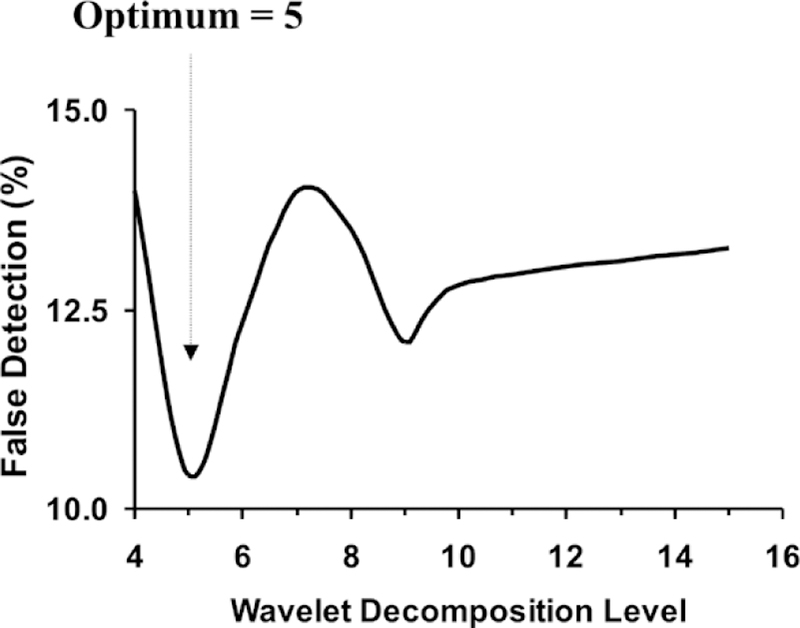
Percent detection error versus decomposition level for the modified method
Comparison of Detection Methods:
The two wavelet methods and the classical discriminator method for action potential detection were compared. Fig. 10 shows the results of the two measures used for quantifying the detection performance: PCD versus SNR and percentage of combined false and missed detections versus SNR. For high SNR the PCD for all methods is 100%. With decreasing SNR, the PCD for the classical discriminator method decreases much more than for the other two methods. The PCD of the regular and modified wavelet methods is approximately the same for all SNR’s. The real distinction between the performances of the two wavelet methods is demonstrated by the PE criterion. As is typical with all detection schemes, the PE increases as SNR decreases. However, the modified method has a much lower PE for a SNR of 3 or less.
Fig. 10.

Dependency of PCDs (left) and PE (right) on SNRs using classical spike discriminator method (open circles), regular wavelet de-noising method (open triangles), and modified wavelet method (open squares).
Effect of Sampling Rate on the Detection Results:
The detection performance of the classical discriminator and modified wavelet methods are shown in Tables II and III, respectively. The performances of these methods were evaluated using the PCD and PE of action potentials at 10- and 5-kHz sampling frequencies. Using the classical discriminator method, the PCD decreases significantly and the PE increases significantly when the sampling rate is reduced from 10 to 5 kHz (p < 0.002). In contrast, no significant change in performance occurs when the sample frequency is reduced using the modified wavelet method. The data demonstrated that the accuracy of detection with the wavelet method is not affected using sample frequencies at or above 5 kHz.
TABLE II.
Detection Performance Using Classical Discriminator Method
| Sampling Rate | Correct Detections | Errors of Detection |
|---|---|---|
| 5 kHz | 74.18%±1.33 | 27.64%±1.57 |
| 10kHz | 84.55%±1.06 | 17.44%±1.33 |
(Mean±Standard Error of Mean, n=5).
TABLE III.
Detection Performance Using Modified Wavelet Method
| Sampling Rate | Correct Detections | Errors of Detection |
|---|---|---|
| 5 kHz | 98.23%±0.16 | 9.50%±0.7 |
| 10kHz | 97.91%±0.21 | 10.90%±0.47 |
(Mean±Standard Error of Mean, n=5).
IV. Phase III
In the third phase, we validated the modified method against standard methods with data recordings in human subjects under resting conditions and different levels of sympathetic activation induced by lower-body negative-pressure (LBNP). Our laboratory has a rich library of neurograms from many experiments, including the experiments in the microgravity environment of the space shuttle measured during the NASA Neurolab Spacelab Mission [19]–[21] which has been used in part for this paper.
A. Methods
Dataset 2:
MSNA from the peroneal nerve were measured on seven healthy subjects (4 males, 3 females 33 ± 3 yrs) in supine position at rest, during LBNP suctions of − 15 and −30 mmHg, and then recovery. The measurement sessions lasted 7 mins for each situation. The device for creating LBNP was manufactured by Deutsche Agentur fur Raumfahrtangele-genheiten, Germany. The filtered and integrated neurograms, as in Fig. 1, were measured by a miniaturized nerve traffic analysis system (NASA, Houston, TX) [20]. It has the same hardware specifications as the system used for measuring data set 1. The data were digitized with a resolution of 14 bits and a sample frequency of 5 kHz using the WINDAQ data acquisition system (DI220, DATAQ, Acron, OH).
Integrated MSNA Measures:
Burst detection and analysis were performed on the integrated MSNA using software written in our laboratory using PV-WAVE (Visual Numerics Inc., Boulder, CO). Bursts were identified with an automated detection algorithm complete with artifact elimination, dynamic noise level detection, and signal-to-noise estimation. Bursts were accepted if the SNR was 2:1, latency to previous cardiac event was between 1.0 and 1.6 s, and burst width was around 0.3−1.6 s. The detection was verified manually by an experienced microneurographer. The activity in the integrated MSNA was quantified by two accepted measures: burst count during segments of 1 min, termed burst rate; and sum of area under the bursts during segments of 1 min, termed area rate. The segments chosen were the second through fifth minute.
Action Potential Measures:
For the same time segments as above, two measures of action potential activity were made in the filtered neurogram. These parameters included the number of action potentials in each minute (the spike rate), and the sum of action potentials amplitudes in each minute (the spike amplitude rate)
Statistical Comparison of Integrated MSNA and Action Potential Measures:
For each set of measures, cross comparisons were made by calculating the regression lines and computing the Pearson’s correlation coefficients. The Fisher z-test was used to test for differences between the correlation coefficients.
Classification Algorithm:
An adaptive template classification algorithm was implemented to identify similar waveforms in detected action potentials [23]–[25]. The first detected action potential was used as the first template. The following detected action potential was centered relative to the template using the cross-correlation function. At the position of maximum correlation, the sum squared error between newly detected action potential and the template was calculated. If the ratio between the sum squared error and the power of the template was less than 50% and correlation coefficient was greater 0.9, then the action potential was labeled as belonging to that template and the template was updated by averaging the two waveforms. Otherwise, the current action potential was used to create a new template and all subsequent action potentials are compared to each template in the same fashion. The classification was done for all subjects and across all subjects during different physiological conditions.
V. Results
Statistical Comparison of Integrated MSNA and Action Potentials:
For a qualitative comparison, the average burst rate and spike rate for each physiological state were calculated and plotted in Fig. 11. The trends correspond quite well. The results of the correlation and regression analyses are shown in Fig. 12 where “r” is the correlation coefficient and the line shows the linear relationship. All four correlation coefficients were significant for p < 0.001. The detected spike rate and spike amplitude rate of the action potentials correlated strongly with burst rate detected in the integrated neurogram (r = 0.79 and 0.89, respectively, p < 0.001). The correlation between spike amplitude and burst area rate was stronger than that between spike rate and burst area rate (r = 0.88 versus 0.52, Fisher z-Test, p < 0.05).
Fig. 11.

The averaged dynamic of total number of action potentials [(right) y axis] detected in the raw neurogram using wavelet de-noising techniques and number of bursts detected in the integrated neurogram [(left) y axis] of seven healthy subjects during baseline (BASE), lower-body negative-pressure suction (LBNP, —15 mmHg and — 30 mmHg), and recovery (RECOV).
Fig. 12.

Correlation between parameters derived from the integrated neurogram (number of bursts upper panels, area under the bursts lower panels) and parameters determined from the raw neurogram using the modified wavelet denoising method.
Classified Patterns:
The classification algorithm found that most detected action potentials could be described by one of eight major waveshapes. Four of these waveforms are depicted in Fig. 13 and are labeled A through D. The other four waveforms are approximately the mirror inverses of each of these templates. These waveshapes were found in all subjects and in all of the physiological states. The percentages of occurrence are shown in Table IV. Many other classes were generated, but each contained less than 0.6% of the action potentials. These findings imply that eight classes are sufficient to describe 81.2% of all action potential spikes for all subjects, and the other 18.8% of detected action potentials may consist of artifacts or multiple spikes events.
Fig. 13.

(upper panel) Major action potential waveforms classified in the raw neurogram and (lower panel The average spike rate of four major waveform classes in raw neurogram using modified wavelet de-noising techniques of seven healthy subjects during baseline (BASE), lower-body negative-pressure suction (LBNP, −15 mmHg and −30 mmHg), and recovery (RECOv).
TABLE IV.
Distribution of Action Potential Shapes
| Classes | A | A inv | B | B inv | C | C inv | D | D inv |
|---|---|---|---|---|---|---|---|---|
| % detected | 22.5 | 21.3 | 13.9 | 9.5 | 4.6 | 4.4 | 2.7 | 1.9 |
inv – inverse waveform
The firing rate of these major waveforms changed with the physiological state, Fig. 13. The firing rate increased as level of negative pressure increased and returned to baseline level during recovery. Classes A and B and their inverses (inv) demonstrated the most pronounced responses to LBNP. The responses of classes C and D and their inverses were modest in comparison.
VI. Discussion and Summary
We studied the frequency characteristics of the neurogram using high sampling rates and found that the major physiological information can be found in the frequency range from 100 to 2000 Hz. Due to the monopolar measurement of the neurogram, the signal is susceptible to electromagnetic interference from lighting and AC power, as well as electromyographic activity. Accordingly, bandpass filtering the signal to isolate the frequency range from 700 to 2000 Hz is appropriate to achieve optimal SNRs. This also has been suggested by others [2]. Although this frequency range implies that a sampling rate of 5 kHz should be sufficient according to the Nyquist criterion, we found that 10 kHz was optimal for the signal waveform reconstruction [25]. The finding that the classical discriminator method for detecting action potentials required at least a 10 kHz sample frequency for accurate detection also supported the selection of this high sampling rate. However, when using the modified wavelet method for detection, a sampling rate of only 5 kHz was required. Thus, the wavelet templates may replace some lost information when using data sampled at the lower frequency.
Due to the low amplitude of the neurogram, it can be easily contaminated by background noise. Several existing wavelet de-noising methods were created to operate on similar signals with Gaussian white (uncorrelated) noise, which, by definition, has power at all known frequencies. However, because bandpass filtering of the raw neurogram is necessary to remove a number nonrandom noise sources, the noise becomes bandlimited and the white noise methods do not function well. Therefore, we modified the regular wavelet method for de-noising the raw neurogram by choosing: the wavelet template to be Symlet 7, a decomposition level of 5, a hard thresholding procedure, and a modified threshold level using the noise variance and a correction factor 0.8. We then demonstrated that our modified wavelet method was superior to the classical discriminator method and the regular wavelet de-noising procedure using measures such as the PCD and PE when detecting action potentials. Useful summary measures of action potential activity such as spike rate and spike amplitude correlated well with commonly used measures of sympathetic activity, which are derived from the integrated MSNA. Therefore, we can conclude that our proposed method is sufficient to evaluate MSNA. Furthermore, the modified wavelet de-noising method could potentially provide a more accurate assessment of the raw MSNA than former methods based on the integrated MSNA because it is not dependent upon signal magnitudes.
This method not only allows for analysis of the rate of occurrence of individual action potentials but also for the classification of their shape. Several action potential waveforms classes have been detected in seven subjects during resting conditions and after application of LBNP. Eight major action potential waveform classes were found to describe more than 80% of all detected action potentials. The defined eight major classes reflected physiological changes of sympathetic activity during pressure changes.
The waveforms found in each of the classes have different peak-to-peak amplitudes and shapes. These disparities can be partially explained by the fact that the neurograms contain discharge activity measured from multiunit neuron groups. In such neuronal groupings, the probability that several neurons can fire at the same time is high, allowing for the superposition of their action potentials. The defined action potential class A in Fig. 13 has the highest peak-to-peak amplitude and long duration, suggesting the involvement of synchronized neurons in the generation of this waveform. Classes C and D had lower peak-to-peak amplitudes, but longer duration, which can be caused by desynchronized firing of more than one neuronal group. The class B waveform has the shortest duration and could possibly be generated by only one neuronal group. The average discharge frequency of class B was 27.4 ± 5.1 spikes/min during resting supine position. This firing rate is similar to the reported discharge frequency of 28.2 spikes/min (0.47 Hz) of single vasoconstrictor units [7], supporting the idea that class B could be generated by only one group of neurons. Surprisingly, the data also showed that the action potential rate in several multiunit recordings might not reflect the amount of sympathetic activity completely. The spike amplitude has been shown to correlate more highly than spike rate to classical measures of sympathetic activity especially to burst rate. Thus, both measures must be taken into account to achieve a more accurate assessment of sympathetic outflow in multiunit recordings.
VII. Conclusion
We demonstrated that the proposed analysis of the raw neurogram with a modified wavelet de-noising technique and classification algorithm is a useful tool for accurate detection of action potentials and assessment of sympathetic activity. It opens new possibilities for studying the firing patterns occurring during different stimuli in healthy subjects and patients. The potentials of this technique must be explored in future projects.
Acknowledgments
This work was supported in part by National Institutes of Health (NIH) under Grant RR00095 and Grant 1PO1 HL56693.
Biography

André Diedrich was born in Magdeburg, Germany, on 7 February 1961. He studied medicine/medical cybernetics and received the M.D. degree from the 2nd Medical Institute, Moscow, Russia, in 1985. He specialized in pathophysiology and received the Ph.D. degree in medicine from Humboldt University, Berlin, Germany, in 1991.
He was awarded with an external fellowship of the European Space Agency in 1996. He learned microneurographic techniques to study the baroreflex in humans at Dr. Dwain L. Eckberg’s laboratory at Virginia Commonwealth University, Richmond, from 1996 to 1997. He was a member of the team which studied cardiovascular effects in space at the “Neurolab” NASA space shuttle mission STS90. He received a fellowship at the Vanderbilt University, Nashville, TN, from 1997 to 2000. He has been a Research Assistant Professor in Medicine at the Vanderbilt University since 2000. His major fields of interest are sleep, cardiovascular research, and space physiology.
Dr. Diedrich is member of the American Heart Association and American Autonomic Society.

Warakorn Charoensuk (S’95) received the B.E. degree in control engineering from King Mongkut’s Institute of Technology, Ladkrabang, Thailand, in 1991 and the M.S. and Ph.D. degrees in electrical engineering from Vanderbilt University, Nashville, TN, in 1998 and 2001, respectively.
Currently, he is an Instructor of Electrical Engineering at Mahidol University, Bangkok, Thailand. His research interests include bioelectric signal processing and pattern recognition, and nonlinear system identification.
Robert J. Brychta received the B.S. degree in biology from Ursinus College, Collegeville PA, where he graduated with highest honors in 2000. Currently, he is pursuing the Ph.D. degree in biomedical engineering at Vanderbilt University, Nashville TN.
He has worked with the Vanderbilt Autonomic Dysfunction Center for the past two years. His main research interests include biomedical signal processing, biomedical pattern recognition, and autonomic control of the cardiovascular system.
Mr. Brychta is a member of the Sigma Pi Sigma, Beta Beta Beta, and Phi Beta Kappa honors societies.

Andrew C. Ertl received the B.S. degree from the University of Wisconsin and the M.S. and Ph.D. degrees from the University of California at Davis. He completed his dissertation work at NASA-Ames Research Center, Moffett Field, CA, and was a scientist and co-author on several benchmark bed rest and exercise countermeasure studies with Dr. J. Greenleaf and Dr. J. Vernikos.
He completed his postdoctoral work at Vanderbilt University Medical Center, Nashville, TN, with National Institutes of Health funding in cardiology, working with the Vanderbilt’s Autonomic Dysfunction group. He joined Vanderbilt’s faculty in Cardiology as a Research Instructor and NASA Space Biology Research Associate. He was also involved in Vanderbilt’s Center for Space Physiology and Medicine and helped design and carry out the Neurolab STS-90 autonomic experiments. He was Assistant Professor in Cardiology before accepting a Research Associate position at The Pennsylvania State College of Medicine, Hershey, PA, in 2000. He returned to Vanderbilt in 2002 as a Research Assistant Professor in the Department of Diabetes and Endocrinology continuing research using the sympathetic microneurography technique.
Richard Shiavi (S’68-M’72-SM’91) received the M.S. and Ph.D. degrees in biomedical engineering from Drexel University, Philadelphia, PA, in 1969 and 1972, respectively.
Since 1972, he has been actively engaged in teaching and research at Vanderbilt University, Nashville, TN, and is currently Professor of Biomedical Engineering. His main professional interests are in signal processing, in particular bioelectric signal processing. More recently, he has been involved with innovations in engineering education.
Dr. Shiavi has has served in the IEEE Engineering in Medicine and Biology Society in various capacities. In1996, he was appointed as a Fellow in the American Institute for Medical and Biological Engineering.
Contributor Information
André Diedrich, Autonomic Dysfunction Center, 1161 21st Avenue South, Suite AA3228, Vanderbilt University, Nashville, TN 37232-2195 USA.
Warakorn Charoensuk, Department of Biomedical Engineering, Vanderbilt University, Nashville, TN 37232-2195 USA..
Robert J Brychta, Department of Biomedical Engineering, Vanderbilt University, Nashville, TN 37232-2195 USA..
Andrew C. Ertl, Autonomic Dysfunction Center, Vanderbilt University, Nashville, TN 37232-2195 USA.
Richard Shiavi, Department of Biomedical Engineering, Vanderbilt University, Nashville, TN 37232-2195 USA..
References
- [1].Delius W, Hagbarth KE, Hongell A, and Wallin BG, “General characteristics of sympathetic activity in human muscle nerves,” Acta Physiol. Scand, vol. 84, no. 1, pp. 65–81, January 1972. [DOI] [PubMed] [Google Scholar]
- [2].Wallin BG and Sundlof G, “A quantitative study of muscle nerve sympathetic activity in resting normotensive and hypertensive subjects,”Hypertension, vol. 1, no. 2, pp. 67–77, March 1979. [DOI] [PubMed] [Google Scholar]
- [3].Sundlof G and Wallin BG, “The variability of muscle nerve sympathetic activity in resting recumbent man,” J. Physiol. (Lond.), vol. 272, no. 2, pp. 383–397, November 1977. [DOI] [PMC free article] [PubMed] [Google Scholar]
- [4].Sundlof G, “Human muscle nerve sympathetic activity at rest. Relationshipto blood pressure and age,” J. Physiol (Lond.), vol. 274, pp. 621–637, January 1978. [DOI] [PMC free article] [PubMed] [Google Scholar]
- [5].Sundlof G, “Muscle-nerve sympathetic activity in man. Relationship to blood pressure in resting normo- and hyper-tensive subjects,” Clin. Sci. Mol. Med. Suppl, vol. 4, pp. 387s–389s, December 1978. [DOI] [PubMed] [Google Scholar]
- [6].Sugiyama Y, Matsukawa T, Suzuki H, Iwase S, Shamsuzzaman AS, and Mano T, “A new method of quantifying human muscle sympathetic nerve activity for frequency domain analysis,” Electroencephalogr. Clin. Neurophysiol, vol. 101, no. 2, pp. 121–128, April 1996. [DOI] [PubMed] [Google Scholar]
- [7].Macefield VG, Wallin BG, and Vallbo AB, “The discharge behavior of single vasoconstrictor motoneurones in human muscle nerves,” J. Physiol. (Lond.), pt. 3, vol. 481, pp. 799–809, December 1994. [DOI] [PMC free article] [PubMed] [Google Scholar]
- [8].Macefield VG, Rundqvist B, Sverrisdottir YB, Wallin BG, and Elam M, “Firing properties of single muscle vasoconstrictor neurons in the sympathoexcitation associated with congestive heart failure,” Circulation, vol. 100, no. 16, pp. 1708–1713, October 1999. [DOI] [PubMed] [Google Scholar]
- [9].Macefield VG and Wallin BG, “Firing properties of single vasoconstrictor neurones in human subjects with high levels of muscle sympathetic activity,” J. Physiol. (Lond.), pt. 1, vol. 516, pp. 293–301, April 1999. [DOI] [PMC free article] [PubMed] [Google Scholar]
- [10].Akay M, “Wavelets in biomedical engineering,” Ann. Biomed. Eng, vol. 23, no. 5, pp. 531–542, September 1995. [DOI] [PubMed] [Google Scholar]
- [11].Akay M, “Introduction: Wavelet transforms in biomedical engineering,”Ann. Biomed. Eng, vol. 23, no. 5, pp. 529–530, September 1995. [DOI] [PubMed] [Google Scholar]
- [12].Welch PD, “The use of fast fourier transform for the estimation of power spectra: A method based on time averaging over short modified periodograms,” IEEE Trans. Audio Electroacoust, vol. AU-15, pp. 70–73, June 1967. [Google Scholar]
- [13].Johnson RA, Applied Multivariate Statistical Analysis, 3 ed. Englewood Cliffs, NJ: Prentice-Hall, 1992. [Google Scholar]
- [14].Daubechies I, Ten Lectures on Wavlets Montpelier Montpelier, VT: Capital City, 1992. [Google Scholar]
- [15].Donoho DJIM, “Ideal spatial adaptation by wavelet shrinkage,” Biometrika, vol. 81, no. 3, pp. 425–455, 1994. [Google Scholar]
- [16].Donoho D, “De-noising bysoft-thresholding,” IEEE Trans. Inform. Theory, vol. 41, pp. 613–627, March 1995. [Google Scholar]
- [17].Bak MJ and Schmidt EM, “An improved time-amplitude window discriminator,” IEEE Trans. Biomed. Eng, vol. BME-24, pp. 486–489, September 1977. [DOI] [PubMed] [Google Scholar]
- [18].Wiemer W, Kaack D, Kezdi P, and Klatt H, “Peak discrimination as a method for quantitative evaluation of neural activity by computer,” Med. Biol. Eng, vol. 13, no. 3, pp. 337–357, May 1975. [DOI] [PubMed] [Google Scholar]
- [19].Cox JF, Tahvanainen KU, Kuusela TA, Levine BD, Cooke WH, Mano T, Iwase S, Saito M, Sugiyama Y, Ertl AC, Biaggioni I, Diedrich A, Robertson RM, Zuckerman JH, Lane LD, Ray CA, White RJ, Pawelczyk JA, Buckey JC Jr, Baisch FJ, Blomqvist CG, Robertson D, and Eckberg DL, “Influence of microgravity on astronauts’ sympathetic and vagal responses to Valsalva’s manoeuvre,” J. Physiol, vol. 538, no. 1, pp. 309–320, January 2002. [DOI] [PMC free article] [PubMed] [Google Scholar]
- [20].Ertl AC, Diedrich A, Biaggioni I, Levine B, Robertson RM, Cox JF, Zuckerman JH, Pawelczyk JA, Ray CA, Buckey JC, Lane LD, Shiavi R, Gaffney AF, Costa F, Holt C, Blomqvist GC, Eckberg DL, Baisch FJ, and Robertson D, “Human muscle sympathetic nerve activity and plasma noradrenaline kinetics in space,” J. Appl. Physiol, vol. 538, no. 1, pp. 321–329, 2002. [DOI] [PMC free article] [PubMed] [Google Scholar]
- [21].Levine BD, Pawelczyk JA, Ertl AC, Cox JF, Zuckerman JH, Diedrich A, Biaggioni I, Ray CA, Smith ML, Iwase S, Saito M, Sugiyama Y, Mano T, Zhang R, Iwasaki K, Lane LD, Buckey JC Jr, Cooke WH, Baisch FJ, Eckberg DL, and Blomqvist CG, “Human muscle sympathetic neural and haemodynamic responses to tilt following spaceflight,” J. Physiol, vol. 538, no. 1, pp. 331–340, January 2002. [DOI] [PMC free article] [PubMed] [Google Scholar]
- [22].de Figueiredo RJ, “Separation of superimposed signals by cross-correlation method,” IEEE Trans. Acoust., Speech, Signal Processing, vol. ASSP-31, pp. 1084–1089, January 1983. [Google Scholar]
- [23].Goodall EV and Horch KW, “Separation of action potentials in multiunit intrafascicular recordings,”IEEE Trans. Biomed. Eng, vol. 39, pp. 289–295, March 1992. [DOI] [PubMed] [Google Scholar]
- [24].Stashuk D and de Bruin H, “Automatic decomposition of selective needle-detected myoelectric signals,” IEEE Trans. Biomed. Eng, vol. 35, pp. 1–10, January 1988. [DOI] [PubMed] [Google Scholar]
- [25].Otnes R and Enochson L, Digital Time Series Analysis New York: Wiley, 1972. [Google Scholar]