

Abstract
Following many years of evolutionary development, first at the National Synchrotron Light Source, Brookhaven National Laboratory, and then at the Advanced Photon Source (APS), Argonne National Laboratory, the APS ultrasmall-angle X-ray scattering (USAXS) facility has been transformed by several new developments. These comprise a conversion to higher-order crystal optics and higher X-ray energies as the standard operating mode, rapid fly scan measurements also as a standard operational mode, automated contiguous pinhole small-angle X-ray scattering (SAXS) measurements at intermediate scattering vectors, and associated rapid wide-angle X-ray scattering (WAXS) measurements for X-ray diffraction without disturbing the sample geometry. With each mode using the USAXS incident beam optics upstream of the sample, USAXS/SAXS/WAXS measurements can now be made within 5 min, allowing in situ and operando measurement capabilities with great flexibility under a wide range of sample conditions. These developments are described, together with examples of their application to investigate materials phenomena of technological importance. Developments of two novel USAXS applications, USAXSbased X-ray photon correlation spectroscopy and USAXS imaging, are also briefly reviewed.
Keywords: small-angle X-ray scattering, X-ray diffraction, microstructure characterization, insitu studies
Graphical Abstract
1. Introduction
Since its original inception at the first National Synchrotron Light Source (NSLS I), Brookhaven National Laboratory, Upton, NY, USA (Long et al., 1991; Allen et al., 1994), and its later transfer to the Advanced Photon Source (APS) Argonne National Laboratory, Argonne, IL, USA (Ilavsky et al., 2002), the APS ultra-small-angle X-ray scattering (USAXS) facility (Ilavsky et al., 2009) has been developed and improved over many years. Based on the principles of Bonse–Hart crystal optics (Bonse & Hart, 1965, 1966), the USAXS instrument, which incorporates a photodiode detector with sufficient linear dynamic range to span both the incident beam intensity and the much weaker small-angle scattered intensity, intrinsically provides the scattered intensity on an absolute scale without need for further intensity calibration. This, together with a continually expanded q range (where q = 4sin/λ with θ equal to one-half of the scattering angle and λ denoting the X-ray wavelength) for its standard slit-smeared operating mode, has enabled the USAXS instrument to be applied in a very wide range of research studies on metals and alloys, polymers, ceramics, coatings, gas sorbent materials and catalysts, fluid suspensions, and even aerosols (Ilavsky et al., 2013). Because of its use of a parallel (rather than converging) X-ray beam and its intrinsic absolute intensity calibration, made possible by the ten-plus decade effective linear dynamic range of its photodiode detector, the APS USAXS instrument has become well known as a resource to calibrate small-angle X-ray scattering (SAXS) intensity standards based on glassy carbon (Zhang et al., 2010), culminating in the primary certification measurements for a recently released NIST Standard Reference Material (SRM 3600) SAXS intensity standard, also based on glassy carbon (Allen et al., 2017). Meanwhile, the USAXS facility data reduction and interpretation software packages, written in Igor Pro1 (Wavemetrics, 2017) for both USAXS and SAXS, are now widely used by the small-angle scattering user community (Ilavsky & Jemian, 2009; Ilavsky, 2012).
We should acknowledge at the outset that several longflight-path SAXS facilities have been commissioned (or are planned) at some of the major synchrotron sources (Narayanan, 2009; Masunaga et al., 2011; Möller et al., 2016; Möller & Narayanan, 2017). By using converging X-ray beams and moveable and/or multiple state-of-the-art two-dimensional detectors, these instruments can, or will, provide a q range that extends down to what was once only possible with Bonse–Hart USAXS instruments. However, we note that the practical minimum q is actually constrained by beam-stop shadowing effects for such instruments. Furthermore, the X-ray optics in the Bonse–Hart USAXS crystal stages filter out any effects due to fluorescence or parasitic reflections around the beam-defining slits (Long et al., 1991; Ilavsky et al., 2009). Without correction, both of these effects can further constrain the true minimum q regime at which useful microstructure information can be obtained with a pinhole SAXS instrument. Also, while the linear dynamic range of new position-sensitive detectors is continually improving, it is unlikely to rival the effective ten-plus decade linear dynamic range of the USAXS photodiode detector, which is nowadays achieved using five switchable preamplifier circuits, each having a dynamic range of 2.5 decades (Jemian & Long, 1990; Long et al., 1991; Ilavsky et al., 2009). It is this linear dynamic range of the photodiode that allows four decades in q to be covered in a single USAXS scan. These points, coupled with its wide flexibility in measurement configuration, ensure that the APS USAXS instrument provides a valuable tool across a wide range of materials science. This role has been significantly enhanced by the developments we now present.
After many years of solid incremental progress, we can now report several innovative and potentially revolutionary changes, introduced recently to the APS USAXS facility, that have transformed it into a broad comprehensive materials characterization user facility, capable of measuring and quantifying, rapidly in real-time, a wide range of materials processes and phenomena under realistic in situ or operando conditions. It is these new developments and their application that form the basis of the present paper. The new capabilities of the APS USAXS facility arise from the following innovations. Firstly, we have exploited different crystal optics in the beamline monochromator, Si(111), and in the USAXS collimating M stage and analyser A stage, Si(220), to remove the need for harmonic rejection X-ray mirrors. The use of Si(220) crystal optics has also facilitated an increase in the commonly used USAXS operating X-ray energy, with further increased energies made accessible using Si(440) crystal optics (Ilavsky et al., 2012). This is important because higher X-ray energies permit the use of thicker samples that are highly absorbing, and thicker sample window materials, and hence allow the introduction of a greater range of realistic sample environments. The use of higher X-ray energies (e.g. 21 keV) also reduces X-ray absorption within the sample, and consequent beam damage, to levels that are comparable to those achievable with a third-generation X-ray synchrotron-based pinhole SAXS instrument using a converging X-ray beam at lower X-ray energies (e.g. 12 keV). Secondly, we have replaced the main step-scan rotator motions for USAXS with closed-loop direct-drive fly scan rotator motions, to enable rapid USAXS fly scans with an almost arbitrary density of data points in q, which can be defined (and varied with q) after the measurement during the subsequent data reduction. Thirdly, we have introduced a permanently set up, compact pinhole SAXS twodimensional detector configuration with an evacuated X-ray flight path after the sample, to extend the USAXS q range to larger q values. This not only extends the maximum q of the contiguous USAXS/SAXS data range, but also greatly improves the signal-to-background ratio at high q, while allowing the USAXS fly scans to be kept appropriately short to both maximize time resolution and minimize beam damage effects for sensitive samples. Fourthly, we have introduced a separate, wide-angle X-ray scattering (WAXS) two-dimensional detector configuration that enables X-ray diffraction (XRD) to be measured for the sample with q values up to ~7 Å−1, without disturbing the sample measurement configuration from that used in USAXS/SAXS. Finally, taking advantage of the fact that all of the combined USAXS/SAXS/ WAXS data can now be obtained in less than ~5 min, together with the ability to accommodate thicker sample cell windows for higher-energy X-rays, several new sample environments have been developed to support in situ or operando studies of materials phenomena and processes under realistic conditions.
In §2 we describe the technical innovations introduced and their use with the new sample environments. In §3 we illustrate the new capabilities with some examples. In §4, we briefly review advances in the more specialized USAXS facility operating modes of X-ray photon correlation spectroscopy (USAXS-XPCS) (Zhang et al., 2011) and USAXS imaging (Levine & Long, 2004) and tomography, as well as presenting opportunities for the USAXS facility to take advantage of the upcoming APS upgrade that will incorporate a multi-bend achromat (MBA)-based diffraction-limited storage ring design that will greatly enhance the coherent X-ray flux. In §5 we present some concluding remarks and summarize the present performance of the enhanced facility.
2. New instrumental capabilities
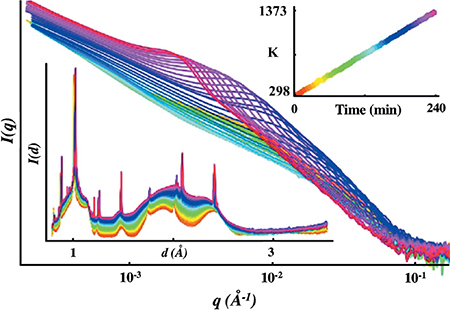
The new instrumental capabilities of the APS USAXS facility are due to several innovative technical changes in the way that the instrument operates, which have been introduced to the facility in recent years. The new capabilities result from various combinations of these changes but, here, each of the innovations introduced is discussed separately. Fig. 1(a) presents a schematic showing the measurement components of the instrument and highlighting several of the changes discussed in this section, except for the removal of harmonic rejection mirrors discussed in §2.1, which occurs upstream of the USAXS facility. Fig. 1(b) presents, as a function of annealing time, combined USAXS/SAXS/WAXS data sets measured during an advanced alloy annealing study. These data are illustrative of the new measurement capabilities.
Figure 1.

(a) Schematic showing combined USAXS/SAXS/WAXS instrument configurations highlighting advances and coordinated motions, shown in red [I0 = ion chamber (beam monitor), Diode = USAXS detector, Img = X-ray imaging camera for surveying sampling position]. (b) Generic example of USAXS/SAXS/WAXS data, showing combined USAXS/SAXS data (main plot) and XRD data (lower inset), for precipitate formation in an advanced alloy, all data measured in real time as a function of annealing temperature and time (see upper inset).
2.1. Use of high-order crystal reflections and removal of harmonic rejection mirrors
The APS USAXS facility is installed on an undulator beamline with an Si(111) monochromator. Like many SAXS instruments at synchrotron beamlines around the world, harmonic rejection mirrors have been used in the past to reduce X-ray energy (wavelength) contamination from harmonic radiation, e.g. X-rays with wavelength λ/3 being passed through the monochromator via the Si 333 reflection. Both kinematic and dynamical X-ray diffraction theories predict that when Si(111) crystal optics are also used within the USAXS instrument, itself, the USAXS M-stage crystal pair will diffract and pass through the same higher-order X-ray harmonics permitted by the Si(111) monochromator. Thus, when the USAXS instrument used Si(111) crystal optics, harmonic rejection X-ray mirrors played a critical role in removing harmonic X-rays. The stability of the mirror setup was integral to the overall stability of the USAXS instrument configuration.
With the introduction of Si(220) crystal optics for the USAXS M stage, it might be thought that the λ/2 X-ray harmonic would now be a problem owing to the allowed Si 440 reflection. However, the beamline monochromator remains Si(111), so no significant /2 harmonic is present. Thus, the first harmonic radiation of interest in the beam incident at the M stage remains at λ/3 because of the combined allowed reflections: Si 333 and Si 660. Kinematic X-ray diffraction theory (without refraction) predicts that the Si(220) M stage and the Si(111) monochromator diffract the harmonic and the fundamental X-rays at the same angle. However, a full analysis based on dynamical diffraction theory (AlsNielsen & McMorrow, 2011) predicts that this is not the case. As detailed elsewhere by some of the present authors (Zhang, Allen, Levine et al., 2018), when the Si(111) monochromator and Si(220) USAXS M stage are each separately optimized for the fundamental wavelength X-ray radiation, there is a small angular offset between the true diffraction angles of the fundamental and harmonic X-ray component. The key point is that these offset angles are different for Si(660) versus Si(220) compared to Si(333) versus Si(111). Together with the use of state-of-the-art crystal polishing methods that now provide a mirror crystal finish without straining the crystal surface layers, this combination of Si(111) and Si(220) crystals reduces the higher-order harmonics contribution by a factor of approximately 106 without need for any harmonic rejection mirror, as described elsewhere. Given that the harmonic content of the incident X-ray beam after the undulator and monochromator is of order 10–5 in any case, this puts the harmonic content incident at the sample after the USAXS M stage at ~10–10 for all USAXS/ SAXS/WAXS operating modes [and the instrument’s Si(220) A-stage crystals may provide further harmonic rejection for USAXS operation]. Under these circumstances, the harmonic rejection mirrors can be removed for all USAXS instrument operating modes, permitting greater stability, and more continuous and reliable energy tunability.
We note in passing that combined Si(111) and Si(220) crystal optics have been used previously for collimation purposes in two-dimensional collimated Bonse–Hart USAXS instruments (Diat et al., 1997; Sztucki & Narayanan, 2007). However, to the best of our knowledge, the present application at the APS USAXS facility is the first time this combination has been used to accomplish the rejection of higher-harmonic X-ray content in the incident beam, in place of using harmonic rejection mirrors.
2.2. Development of rapid fly scan capabilities
The primary scanning motion in a typical USAXS scan is the rotation of the A-stage crystal pair, first through the Bragg condition for the crystal reflection to establish the A-stage angular position for q = 0, and then rotation away from q = 0 to provide a succession of positive q values at which the USAXS intensity, I(q), is measured. Critical secondary motions are a vertical translation of the whole A-stage monolith and a corresponding vertical translation of the detector stage, in order to ‘catch’ the scattered beam at larger q values. In summary, I(q) versus q data collection requires all three motions to be closely and smoothly coordinated. Since the original inception of the USAXS instrument, this main A-stage rotation has been accomplished using an angular encoded rotation stage linked via worm-gear to a microstepping motor while secondary motions used worm-gear stepper-motor-driven stages. Typical USAXS scans have contained between 150 and 250 steps in q, with step sizes at the smallest q values given by the q resolution, and progressively larger steps at larger q values. However, linear step scans with a larger number of points have also been an option for monodispersed scattering features where the SAXS intensity exhibits strong Bessel function oscillations as a function of q. On moving to each q value, time is needed for the instrument to stabilize before the photodiode current (proportional to scattered intensity) is measured. Originally, the total dwell time at each q was 5 s. However, with progressively improved (smooth and precise), coordinated motor motions for the A-stage rotation and secondary vertical translations, together with improved vibration isolation throughout the USAXS instrument, the dwell time was eventually reduced to 1 s. Stage motions between q steps added additional time – especially at larger q values where the larger steps require larger stage motions. These incremental improvements, made over many years, eventually reduced the overall time for USAXS scans from 20 to 6 min, but could not be reduced further without compromising the stability of successive intensity measurements at each q.
In recent years, direct-drive motorized motion stages have been developed for both rotation and translation. Such motors can be programmed to follow a precise fly scan trajectory for position (or angle) versus time – including trajectories during which the speed of motion must be varied by several orders of magnitude, as is the case for USAXS fly scan data collection. All three USAXS motions have been upgraded using such closed-loop direct-drive systems. With careful tuning of the drive control electronics, USAXS fly scans can now be made to almost arbitrarily high precision in q as a function of the time elapsed during the scan. During a fly scan, all stages move according to pre-programmed trajectories and stop only after the whole scan is completed before the whole system returns to its starting configuration. Meanwhile, the USAXS photodiode detector current is continuously monitored and (typically) 8000 values are recorded as a function of scattering angle. Following a scan, the I(q) versus angle profile in the data set can be analysed and fitted to determine where q = 0. Furthermore, the number density of q data points can be selected as a function of q during the data reduction after the scan is completed within the Indra USAXS data reduction package (Ilavsky & Jemian, 2009) written in Igor Pro. USAXS fly scans can be completed much more rapidly than step scans. This is partly because the USAXS stage motions are not being continually started and stopped during the scan. Also, the introduction of a compact pinhole SAXS measurement (see below) reduces the maximum q value that is required for the USAXS scan, alone. Typically, USAXS fly scans can be completed in 90 s, even though times as short as 30 s and as long as 360 s can be used. Short data collection times greatly increase the potential for operando studies of materials phenomena and also reduce the potential for soft matter samples to suffer X-ray beam damage. We acknowledge that, because of the open-air nature of the instrument, USAXS measurements of biological macromolecules in solution remain difficult. However, this instrument has been widely used by the polymer community to investigate polymer morphology and phase separation, among other soft matter examples (Zhang & Ilavsky, 2010).
The photodiode current is recorded using a First Sensor X10-γ Si diode (First Sensor AG, Berlin, Germany) with a FEMTO DDPCA300 amplifier (FEMTO Messtechnik GmbH, Berlin, Germany). This photodiode has an absorption of ~75% for 12 keV X-rays and ~25% for 21 keV X-rays. A custom-built enclosure for the photodiode is used to shield it against electromagnetic fields, including light, to reduce the electronic background. The setup has been tested to measure photodiode current from ~20 fA to >0.5 mA (over ten decades dynamic range). A typical photon flux on the sample is ~5 × 10¹² photons per second (ph s–1) in a 1 mm2 beam at 12 keV and ~1 × 10¹² ph s–1 at 21 keV. A typical USAXS beam size is 0.8 × 0.8 mm.
2.3. Incorporation of compact pinhole SAXS
For several years, the APS USAXS capabilities were supplemented with the ad hoc addition of a compact twodimensional Pilatus 100K detector (Dectris AG, Baden, Switzerland) for pinhole SAXS measurements to extend the maximum q to larger values. With a pixel size of 172 × 172 μm, a 20 bit dynamic range, a usable energy range of 5–30 keVand a maximum frame rate of 300 Hz, and operating in singlephoton-counting mode, this compact detector is ideally suited for providing sector-averaged pinhole SAXS data over a sector of a small azimuthal angular range (Ilavsky et al., 2013). To realize the full potential of this arrangement, such a detector has been permanently installed in the facility. The Pilatus detector is attached to a vacuum chamber to provide an evacuated (low-background) path from the sample to the detector. The pinhole SAXS assembly is automatically moved into position such that there is only a minimal air path (5 mm or less) between the sample and the front end of the evacuated flight path. The pinhole SAXS configuration is set up so that the incident beam does not impinge directly on the detector, and it can be rapidly interchanged with the other instrument measurement configurations for USAXS and WAXS (see below).
The distance between the sample and the two-dimensional detector is approximately 540 mm with almost all of this in a permanently installed vacuum flight path. The pinhole SAXS configuration typically provides data in a q range from 0.05 to 1.7. Å–1 key requirement is that the pinhole SAXS configuration must be moved in and out of a precisely defined and accurately reproducible position that has been calibrated for both geometry and wavelength prior to any sample measurements. Calibration is carried out using silver behenate (AgBE) powder [formula: CH3(CH2)20COOAg], which provides several well known Bragg diffraction rings within the pinhole SAXS q range (Blanton et al., 1995). Since the APS undulator X-ray energy and wavelength, λ, are already well calibrated using standard X-ray absorption foils (Chantler et al., 2005), the AgBE calibration defines the position of the incident beam (just off the detector), the sample-to-detector distance and any small detector tilt (inevitable small departures of the detector plane from orthogonality to the incident beam direction). These calibration parameters determine the q value for each detector pixel, and they also define the geometry for obtaining one-dimensional sector-averaged I(q) versus q data.
Software procedures written in Igor Pro are available for automatic pinhole SAXS data acquisition and reduction, including the sector-averaging step, using the Nika routine package (Ilavsky, 2012). The sector averaging can be adjusted during processing to group detector pixels together so that the scatter in the resulting one-dimensional data points is minimized without compromising the q resolution. Alternatively, the number of points in the sector-averaged one-dimensional data set can be maximized to optimize the q resolution for small-angle diffraction peaks. In the latter case, the best q resolution ranges between 0.003 and 0.008 Å–1, depending on the X-ray energy. Accuracy in determining the q values for small-angle diffraction peaks relies heavily on the geometry calibration established using the AgBE standard – particularly the accuracy with which the sample-to-detector distance is determined. However, the peak position standard uncertainty in q is typically <0.001 Å–1.
Most conventional pinhole geometry SAXS instruments require intensity calibration using a scattering standard. However, in this case, the USAXS data are already intensity calibrated. Instead, the typical overlap in q of the pinhole SAXS data (~0.05 < q < ~1.7 Å–1 for 21 keV X-rays, for example) with the current typical USAXS data q range (0.0001 < q < 0.3 Å–1) is exploited for normalizing the pinhole SAXS intensity to the absolute-calibrated USAXS intensity. This is done in the Irena data reduction software (Ilavsky & Jemian, 2009), also written in Igor Pro, following appropriate flat-background subtractions and any desmearing of USAXS data or equivalent slit-smearing of pinhole SAXS data such as may be required. In this connection, we note that the standard one-dimensional USAXS mode collects data that are slit smeared, and so these data need to be desmeared using the well known Lake algorithm (Lake, 1967) if they are to be directly merged with azimuthally sector-averaged pinhole SAXS data (unsmeared as collected). However, desmearing introduces point-to-point noise in the desmeared USAXS data, and it is preferable to slit smear the sector-averaged pinhole SAXS data and then merge these with the calibrated slit-smeared USAXS data. In this case, scattering models are correspondingly slit smeared in the Irena package before fitting to the calibrated slit-smeared combined USAXS/SAXS data.
Pinhole SAXS exposure times are typically 5–60 s and the typical beam size is 0.8 mm horizontal × 0.2 mm vertical. The configuration changeover time for automated precision positioning of the instrument stages, going either from USAXS to pinhole SAXS or vice versa, is less than 30 s. Thus, contiguous USAXS/SAXS data sets (small-angle scattering only) over a q range from 0.0001 to 1.7 Å–1 are now obtainable within ~3 min.
2.4. Addition of WAXS detector for XRD measurements
The combination of SAXS (and USAXS) with WAXS (and XRD) is not, itself, new (Igarashi et al., 2011; Masunaga et al., 2011). However, an integrated USAXS/SAXS/WAXS instrument for rapid USAXS/SAXS and XRD measurements, which incorporate both absolute intensity calibration (from USAXS) and single-photon counting sensitivity in the SAXS and WAXS (XRD) regimes, has not been developed previously. Indeed, together with the introduction of USAXS fly scanning, the most significant recent upgrade of the USAXS facility is the introduction of a further two-dimensional detector mode for wide-angle scattering and diffraction. The WAXS detector is also a Dectris detector: a modified Pilatus 300K-W detector. The WAXS detector is independently mounted on its own automated translation stage, and it can be set up with various sample-to-detector geometries. Each detector module is similar to that used in the pinhole SAXS detector, but the X-ray-sensitive absorption layer is thicker (greater sensitivity at high X-ray energies) and two active modules are used, adjacent to each other. Unlike the pinhole SAXS detector, the WAXS detector is mounted in air and typically at about half the sample-to-detector distance of the SAXS detector. The WAXS detector is offset from the incident beam and extends the q range into the powder diffraction regime. For measurements using a typical X-ray energy of 21 keV, the WAXS q range is from 1.5 to 7.0 ≃−1. However, the maximum q can be limited for some sample environments because the scattered or diffracted beam direction may be restricted by the geometry. The minimum q provides sufficient overlap with the pinhole SAXS data to include small-angle diffraction peaks that may occur in the latter, and the maximum q extends well into the regime normally associated with XRD. Depending on the exact detector geometry used, the q resolution for the WAXS measurements is intrinsically twice as broad as for pinhole SAXS (similar detector resolution at half the sample-to-detector distance), ranging between 0.006 and 0.016 Å–1, depending on the X-ray energy. A typical diffraction peak full width at half-maximum is 0.04 Å–1, but peak fitting can enable a peak position in q to be determined to within a standard uncertainty of ±0.008 Å–1. We emphasize that this setup is not optimized for structure determination. Instead, because of the photon-counting ability of the Pilatus detector, it is sensitive to weak phases present in the sample volume and hence well suited for identifying crystalline phases and monitoring phase evolution kinetics during in situ measurements. Calibration of the WAXS measurement geometry is critical for achieving accuracy in XRD peak positions (just as when using the pinhole SAXS measurement mode). In this case, two NIST X-ray powder diffraction calibration line standards are available: SRM 640, based on silicon (Cline et al., 2011), and SRM 660, based on lanthanum hexaboride, LaB6 (Black et al., 2011).
The scattering angles are significant for the largest q values (~38°) and some distortion may occur in the XRD pattern at these scattering angles owing to the use of a parallel-sided sample coupon for USAXS and SAXS measurements, coupled with a planar detector orthogonal to the incident beam direction. Fortunately, geometric corrections can be made using the Nika data reduction software, which is applied to the WAXS data independently from its application to the pinhole SAXS data. Meanwhile, the rapid WAXS measurements, made without disturbing the sample configuration from that used for USAXS and pinhole SAXS, provide complementary information about changes in the sample crystal structure that can be correlated with changes in microstructure. Typical WAXS exposure times are 5–60 s, and the typical beam size is 0.8 mm horizontal × 0.2 mm vertical. Stage motions to insert or remove the WAXS configuration take <30 s. Thus, complete typical USAXS/SAXS/WAXS scans can be obtained within ~5 min, covering a contiguous q range (with appropriate Δq/q resolution throughout) from q = 0.0001 Å–1 to q ≃ 7.0 Å–1. For q < ~1.5 Å–1, low-background USAXS/SAXS measurement conditions apply; thereafter, XRD measurement conditions apply with potentially some air scattering. However, typical practice is to measure the WAXS air scattering background, transmission and other normalization data. During data reduction, the air scattering background is subtracted and the resulting data background is only slightly higher than in the SAXS data. This is especially useful when amorphous phase peaks or weak diffraction peaks must be identified. Fig. 1 highlights these various instrument developments. The measurement configurations are set up so as to provide significant overlaps between USAXS and pinhole SAXS data, and between SAXS and WAXS data, in order to provide contiguous data sets while retaining rapid reproducible configuration changes.
2.5. Development of in situ and operando sample environments
With the availability of rapid USAXS/SAXS/WAXS scans, many materials phenomena of technological importance may be followed in real time. To exploit these opportunities, it is essential to develop a suite of in situ sample environments that can be used to follow relevant microstructural and structural changes as a function of, for example, temperature, gas environment, pressure and fluid flow conditions. In this section, we review how some of these sample environments are being introduced.
2.5.1. Temperature.
One of the more powerful in situ applications enabled by short combined USAXS/SAXS/ WAXS measurement times is to follow material transformation or reaction processes as a function of temperature and time. By following such processes in real time during separate USAXS/SAXS/WAXS experiments carried out at different constant temperatures, it is possible to determine the transformation or reaction rate over many length scales as a function of absolute temperature, extract an Arrhenius plot and derive an activation energy for the process of interest. Such studies have long been a feature of small-angle X-ray and neutron scattering studies. However, the time resolution of such studies to cover the full Å to ~10 μm scale range is now dramatically improved, together with the ability to follow both morphology (microstructure) evolution and crystalline phase (structure) evolution within the same real-time study.
While several custom-designed temperature stages have been developed for use at the APS USAXS facility, the two main workhorse stages now available are Linkam thermal stages (Linkam Scientific Instruments Ltd, Tadworth, UK). One of these, a Linkam THMS600 stage, allows both cooling of the sample to as low as 77 K (–196°C) and heating to as high as 873 K (600°C) with <0.1 K stability. Samples can be mounted in this stage with no significant reduction in the accessible combined USAXS/SAXS/WAXS q range. The stability and precise control of this stage are sufficient to investigate temperature-sensitive morphology and phase transformations acting over many length scales, both in solid materials and in liquid suspensions. The THMS600 stage has also proved effective in controlling temperature for USAXSXPCS studies of nanoparticle dispersions.
A Linkam 1500 TS stage, also permanently available at the USAXS instrument, provides temperature control from ambient up to a nominal 1773 K (1500°C) with <1 K stability for investigation of high-temperature phenomena such as precipitate evolution during the annealing of additive-manufactured alloys or high-temperature morphology transformations in geological materials. This stage must be liquid cooled at high temperature and an inert gas (Ar) must be flowed through the stage to prevent oxidation of the sample at high temperatures. As a result of the required USAXS/SAXS/WAXS measurement geometry (pass through of incident and scattered X-ray beam), significant heat loss by thermal radiation occurs for the highest operating temperatures and a correction for the true sample temperature must be made above 1073 K (800°C). This correction factor varies somewhat as the sample emissivity changes and work on this is ongoing. By conducting XRD measurements on thin platinum (0.05 emissivity) and Al2O3 (0.9 emissivity) samples heated within the stage, we have used the well established Pt and Al2O3 thermal expansion coefficient variation with temperature to calibrate the true sample temperature as a function of the set thermocouple temperature. For a thermocouple temperature of just under 1600 K (~1300°C) the sample temperature can be more than 150 K less than the nominal temperature. While such temperature corrections are needed for fully quantitative studies, temperature and ramp rate control and logging versus time are fully integrated with the instrument controls for USAXS/SAXS/WAXS data collection. Fig. 1(b) illustrates the use of the Linkam 1500TS stage coupled with real-time USAXS/SAXS/WAXS data collection.
2.5.2. Gas pressure.
In recent years, there has been much interest in investigating solid sorbent materials for selective gas adsorption. Such studies, mainly based on X-ray and neutron powder diffraction, include research on flexible metal–organic framework (MOF) materials for hydrogen, methane or other fuel-gas separation (Bloch et al., 2012), carbon mitigation (CO2 adsorption), and other non-equilibrium gas separation processes (Peterson et al., 2017), and the development of new porous catalyst systems (Ristanović & Weckhuysen, 2014), and extend to investigations of geological materials (e.g. clays and sandstones) for enhanced oil and gas recovery (Michels et al., 2015). Frequently, the microstructures and structures of these material systems exist only under certain pressure and/or temperature conditions, following a specific pressure and/or temperature history. The upgraded APS USAXS facility affords the capability to characterize and correlate the relevant microstructures and structures under realistic temperature and pressure conditions. To provide this capability, samples can be subjected to gas pressures up to ~80 bar (1 bar = 100 kPa) in static equilibrium (Sieverts-type) mode or up to 50 bar in gas-flow mode. One or two gases can be used at any one time, and for static conditions, the sample may also be simultaneously heated to ~1373 K (1100°C) using a heating coil.
Fig. 2 presents schematics for the two high-pressure gas configurations available. Fig. 2(a) shows the capillary-tube sample design with two example gases. The total pressure (<80 bar) is achieved using a Teledyne D-1000 syringe pump system (Teledyne Isco Inc., Lincoln, NE, USA), while a custom-made heating coil positioned close to the capillary enables temperatures from ambient to 1373 K (1100°C) to be achieved – as determined by a thermocouple (Omega Engineering Inc., Norwalk, CT, USA) pushed into the powder sample. This configuration is based on a previous customdesigned sample environment cell, constructed for XRD, X-ray total scattering and X-ray absorption spectroscopy (XAS) studies (Chupas et al., 2008). The sample capillaries (Friedrich & Dimmock Inc., Millville, NJ, USA) are quartz and have a length of 50 mm and an external diameter of 1.5 mm with wall thickness of 0.1 mm. While providing acceptable X-ray transmission for X-ray energy ~21 keV, we find these sample capillaries can withstand internal gas pressures up to ~80 bar. Nevertheless, for safety and for safeguarding the USAXS/SAXS/WAXS instrument components and crystal optics, a protective shield (with quartz X-ray windows) is placed around the sample capillary and heater arrangement. Overall, this arrangement provides total gas pressures from ambient up to 80 bar under static conditions for a single gas or a mixture of two gases, at set sample temperatures between room temperature and ~1373 K (1100°C). Pressure and temperature control within these ranges, as well as control of approximate temperature ramp rate, can be integrated within the USAXS/SAXS/WAXS data acquisition system to provide automated measurements in real time. In practice, automated pressure control without manual intervention is limited by the expansion range of the syringe pump.
Figure 2.

Schematics of sample setups for gas use: (a) capillary-tube sample design with two example gases, total pressure < 80 bar possible using a syringe pump, and temperatures from ambient to 1373 K (1100°C) using a heating coil; (b) pressure cell design with one or two gases under controlled flow-mix conditions (total flow < 100 ml min–1), total pressure < 50 bar, and ambient temperature conditions using Hiden automated gas-flow system. Flammable gases can be accommodated using either setup.
In principle, the arrangement shown in Fig. 2(a) can be used for a flowing gas environment by partially opening the exit gas valve from the sample capillary. In practice, it is difficult to retain the sample powder in position under these conditions for anything more than a gentle gas flow at near ambient pressures. Nevertheless, such an arrangement is useful for in situ studies of microstructure and structure evolution during a chemical reaction under a controlled gas atmosphere at elevated temperatures. The effect of moisture can also be investigated with this arrangement.
For regulated single or dual gas flow, an alternative gaspressure sample environment is presented in Fig. 2(b). An automated Hiden XCS gas-flow system (Hiden Isochema Ltd, Warrington, UK) is used to provide a set total pressure of <50 bar, a total flow rate of <100 ml min–1 and a defined mix of flows when two gases are in use together. The sample cell design (see inset) holds the powder sample within a perforated tape envelope mounted and pressed in place inside the cell. In this way, significant pressures and gas-flow rates can be accommodated at ambient or near-ambient temperatures without disturbing the sample position. This configuration is important for selective gas sorption studies under gas-flow conditions relevant to, for example, CO2 adsorption from flue gas streams.
Apart from inert or non-flammable CO2, N2, He and Ar gas environments, the APS USAXS facility can also accommodate flammable gases, for exmaple CH4 and H2, as implied in Fig. 2(a). This is made possible by the recent installation of a flammable gas cabinet exterior to the APS sector 9-ID hutch, together with a hutch gas exhaust integrated with the APS experiment-hall gas-venting system. This not only presents opportunities to study the effects on both microstructure and structure of selective adsorption of these gases under both static and flow conditions, but also furthers the potential to exploit rapid USAXS/SAXS/WAXS measurements in studies of catalyst and formation reactions (Gadikota, 2017).
2.5.3. Miscellaneous and solution-mediated reaction environments.
A wide range of customized sample environments have been accommodated at the APS USAXS facility over the years. Apart from in situ studies of the effects of temperature and/or pressure, two other sample environments are particularly the subjects of new or continuing interest: real-time changes in microstructure and structure under changing electrochemical conditions (see Hammons & Ilavsky, 2017), and real-time studies of solution-mediated formation or degradation processes relevant to nanotechnology. With the most recent instrument developments, coupled with the progressive migration to higher operating X-ray energies, the scope of these sample environments for in situ study has been further extended and deepened. In virtually all cases, the key advance is that the rapid USAXS/SAXS/WAXS measurements can be used to quantitatively correlate real-time changes in microstructure with those in structure or crystalline composition. In the context of fluid flow-cell environments, previously established at the APS USAXS facility (Allen et al., 2008), morphological and microstructural changes in a flowing nanoparticle suspension can now be correlated with changes in nanoparticle crystalline phase. Despite the dilute nature of many nanoparticle suspensions, the WAXS capability of the facility is sufficiently sensitive to identify not only the primary phase XRD peaks from nanoparticles, accounting for <10–5 of the sample volume, but also the emergence of XRD peaks from phases resulting from reaction or transformation, which account for <10–6, and sometimes <10–7, of the sample volume, as we further illustrate below.
3. In situ and operando studies using new USAXS/SAXS/ WAXS capabilities
In this section, we present illustrative examples that demonstrate how the new capabilities of the USAXS/SAS/WAXS facility, and its available sample environments, are being applied to studies of material processes and phenomena in advanced technological materials. These examples are a small cross section of recent and ongoing user science at the facility, which actually encompasses (among other things) steels (Baker et al., 2017), lithium ion battery storage materials (Ye et al., 2016), cements (Cheshire et al., 2017), photonic materials (Han et al., 2017), deep eutectic solvents (Hammons et al., 2016) and foods including milk fats (Ramel et al., 2016). Most of the results that follow are associated with studies published elsewhere; except where specific information is given, standard uncertainties in measured overall intensity scaling (hence volume fraction or surface area) are typically ±10%, while those for size are typically ±5%.
3.1. Additive manufactured alloys
The ability to simultaneously measure the time-dependent microstructure and structure of advanced alloys during hightemperature isothermal annealing has provided critical information on the thermodynamics of precipitate formation. In addition to identifying and quantifying the various phases and precipitates as they evolve, measurement of the kinetics at different annealing temperatures provides important activation energies for the precipitation processes (Zhang et al., 2016; Zhang, Levine et al., 2017). Following precipitate phase evolution has proven particularly critical in supporting recent advances in additive manufacturing (AM) methods for alloy components. As-built AM alloy products frequently contain both highly segregated, non-equilibrium, compositional phases and locked-in residual stresses that must be reduced through stress relief heat treatments. Unfortunately, in this situation, the stress relief heat treatments normally applied in the case of conventionally fabricated or wrought alloy components can result in deleterious phases emerging in the microstructures and structures of nominally equivalent AM alloy components.
In this connection, some of the present authors have conducted in situ USAXS/SAXS/WAXS measurements (with other studies) on an as-built and solutionized Ni-based 718Plus superalloy, built by AM through a direct metal laser sintering technique (Idell et al., 2016). This alloy contains niobium, with a mean Nb content within a compositional range where the formation of any deleterious Nb-rich precipitate phases should be mitigated by dissolution at annealing temperatures above 1293 K (1020°C). However, micro-segregation associated with the AM fabrication process results in a dendritic microstructure whereby local Nb concentrations significantly exceed the mean. As Fig. 3 indicates, in situ USAXS/SAXS/WAXS measurements made during annealing of the alloy at a nominal temperature of 1339 K (1066°C), using the previously discussed Linkam TS1500 stage, reveal a progressive precipitation and growth of deleterious Ni3Nb δ phase. This is manifested by a plate-like scattering feature that can be modelled with the USAXS/SAXS data, together with a clear emergence of XRD peaks in the WAXS data, unambiguously identified with the δ phase (211 Bragg peak highlighted). With appropriate assumptions for δ-phase and matrix compositions and densities, the volume fraction, thickness and mean diameter of the δ-phase precipitates were quantified as a function of annealing time, together with the annealing-time dependence of the amount of crystalline δ phase from the increasing integrated Bragg peak intensity. Clearly, further homogenization heat treatments are required for this AM alloy. Along similar lines, the upgraded USAXS facility is making increasingly significant quantitative contributions to other AM alloy research, such as providing data for the Additive Manufacturing Benchmark Test series (AM-Bench) (see http://www.nist.gov/ambench).
Figure 3.

USAXS/SAXS and WAXS data as a function of annealing time at 1339 K (1066°C) for ATI 718Plus nickel-based superalloy produced by additive manufacturing. The main plot shows the changing USAXS/SAXS data during the anneal, together with the plate-like scattering features modelled. The TEM inset confirms the plate-like morphology of the δ phase. The remaining plots show theWAXS diffraction data and the evolution of the δ-phase 211 Bragg peak during annealing.
3.2. Selective adsorption phenomena in porous materials
The development of advanced solid sorbent materials for selective gas adsorption is of increasing importance in a range of industrial applications, including enhanced oil and gas recovery, carbon mitigation, and gas-stream catalytic processes (Yaghi et al., 2003). Flexible MOF materials offer significant potential for each of these applications, because of their tuneable and selective gas sorption capabilities (Sumida et al., 2010). In order for their potential to be fully realized, it is essential to determine the structural changes in flexible MOFs that underlie their selective gas sorption properties. In practice, this requirement includes more than characterizing structural changes associated with the measured sorption isotherms for the gas of interest at different pressures under static (Sieverts) conditions. It is also necessary to characterize structural changes occurring under flowing gas conditions, or when two or more gases are present, each contributing their own partial pressure to the total (Kauffman et al., 2011). Use of the gas-pressure environments, shown in Fig. 2, at the USAXS facility now enables structural changes in flexible MOFs to be correlated with (and normalized to) the typical powder morphology, including microstructural changes as a function of gas composition, pressure, flow or temperature. Changes in microstructure can be particularly important during supercritical adsorption. Supercritical gas adsorption is growing in importance as it is the physicochemical basis of more efficient engineering processes, such as separation/ purification of light hydrocarbons, storage of fuel gases in microporous solids, and adsorption from supercritical gases in extraction processes and chromatography (Nelson et al., 2009).
Related to ongoing work by some of the authors, Fig. 4(a) presents combined USAXS/SAXS/WAXS data on a log–log scale for supercritical CO2 adsorption in a model flexible MOF, denoted NiBpene (Allen et al., 2015), while Fig. 4(b) shows the XRD data for the system plotted using linear scales. The USAXS/SAXS curves exhibit a marked increase in scattering from fine features (high q), and consequent available surface area, as the threshold for supercritical adsorption (~73 bar) at 363 K (90°C) is passed, and dense CO2 (nearly 5 g cm–3) is adsorbed into the system. Meanwhile, many of the XRD peaks of the structure (monoclinic, space group P21/m) move to lower q values, particularly the 001 peak, most closely associated with swelling of the unit cell on CO2 adsorption (Wong-Ng et al., 2013). By modelling the USAXS/SAXS data and quantifying the changes in XRD pattern, such measurements allow the structural and microstructural changes (reversible and irreversible) during supercritical gas adsorption to be quantified. These methods show promise for providing new insights regarding supercritical CO2 adsorption and processing (Farha et al., 2012).
Figure 4.

(a) Merged USAXS/SAXS/WAXS data versus q for NiBpene flexible MOFat 363 K (90°C) with CO2 pressures ranging from 2 bar up to 80 bar. The red curve shows data after the sample is cooled to ~303 K (30°C) with CO2 pressure maintained at 80 bar. (b) SAXS/WAXS data for 0.4 < q < 4.0 <s>, replotted to display XRD patterns. Peak index labels based on previous assignments (Wong-Ng et al., 2013). The red curve in the main plot shows the effect of cooling to ~303 K (~30°C). However, the 303 K data are omitted from the inset for the 001 peak. This shifts to lower q with the onset of supercritical CO2 conditions, indicating significant opening of the unit cell in this direction.
3.3. Fluid-mediated nanoparticle reaction kinetics
Solution-mediated reactions involving silver nanoparticle (AgNP) ensembles in aqueous suspension remain of great interest owing to not only the significance of AgNPs in the field of environmental health and safety but also their potential in precision biological engineering and medicine. Our fluid flow-cell system has long been used for USAXS/SAXS measurements of nanoparticle ensemble morphology at the USAXS facility, including studies of AgNPs in aqueous suspension under various conditions (e.g. MacCuspie et al., 2011; Martin et al., 2014). The introduction of WAXS measurements allows changes in AgNPs or their ensemble morphologies to be associated with chemical reactions and phase changes within the AgNPs, themselves.
Fig. 5 summarizes results for recent and ongoing studies of AgNP sulfidation reactions (Zhang, Allen, Johnston-Peck et al., 2018) for a dilute AgNP ensemble in aqueous suspension. In this composite figure, the flow cell is shown schematically for pinhole SAXS measurements. However, the USAXS/ SAXS plot includes the USAXS data, which show little or no aggregation of the AgNPs as the solution-mediated sulfidation reactions proceed. Modelling the USAXS/SAXS data indicates scattering from globular features of slowly increasing size. Meanwhile, the WAXS data reveal a progressively decreasing Ag crystalline content (e.g. Ag 220 peak at q ≃ 4.35 Å–1), and a corresponding increasing Ag2S (less dense) crystalline component (e.g. Ag2S 112 peak at q ≃ 2.20 Å–1). We note that the new USAXS/SAXS/WAXS capabilities are sensitive to the formation of new crystalline phases during solution-mediated nanoparticle reactions, which can be associated with changes in the particle morphology. Both microstructural and structural components can be measured down to ~10–7 volume fractions in a suspension, and can be modelled, providing a uniquely detailed evaluation of solution-mediated nanoparticle reaction phenomena.
Figure 5.

Schematic of USAXS/SAXS/WAXS liquid flow-cell arrangement, together with USAXS/SAXS data showing increasing NP size as outer regions of AgNPs are replaced by Ag2S (data moving to left with time), and WAXS (XRD) data with decreasing (blue arrows) Ag peaks and increasing (red arrows) Ag2S peaks, as the sulfidation reactions proceed. In both right hand plots the traces go from violet at earliest sulfidation times to red at latest times.
4. Opportunities for further development
The present USAXS/SAXS/WAXS instrument provides rapid microstructure and phase composition information based on a limited azimuthal orientation of the sample (very limited for USAXS). While absolute-intensity-calibrated USAXS and single-photon-counting SAXS and WAXS detectors provide good, quantitative, sensitivity to changes in microstructure and composition, the effects of texture and stress are not recorded. In the immediate future we propose to incorporate a further two-dimensional flat panel detector into the instrument for full azimuthal diffraction ring analysis to quantify texture or strain in crystalline materials. Flat panel detectors have been used elsewhere (Igarashi et al., 2011) to provide WAXS data combined with SAXS. The difference here is that the flat panel measurement will be in addition to the present WAXS measurement as we wish to retain the present quantitative phase sensitivity the latter provides.
Other alternative modes of operation are available at the USAXS facility. At this time, these cannot be combined with pinhole SAXS or WAXS measurements, but each provides some other measurement capability not available elsewhere. The simplest of these is two-dimensional-collimated USAXS, where small side-reflection crystal pairs are placed before and after the sample. While USAXS scans continue to be made in just one azimuthal plane, the slit-smearing effect due to a relaxed collimation condition in the transverse direction is removed. Since this mode of operation has been presented in detail previously (e.g. see Ilavsky et al., 2002, 2009), we do not discuss this further here, except to indicate that ways of combining two-dimensional-collimated USAXS with pinhole SAXS and WAXS are being explored for the future. The other two measurement modalities considered here are USAXSXPCS (Zhang et al., 2011) and USAXS imaging (Levine & Long, 2004) and tomography. As each of these has also been presented previously, here we briefly summarize their current state of development at the APS USAXS facility, and we discuss prospects for their further development. In considering future opportunities, clearly the issue of greatest significance is how to exploit the forthcoming upgrade of the whole APS facility that will incorporate an MBA-based diffraction-limited storage ring design.
4.1. USAXS-XPCS
USAXS-XPCS measurements cannot compete with SAXSXPCS ‘speckle’ methods using a two-dimensional detector (Shinohara et al., 2007, 2010; Möller et al., 2016; Möller & Narayanan, 2017) across the whole spatial and temporal range of interest to materials and soft matter science. Nevertheless, USAXS-XPCS has a unique role in providing rich temporal–spatial information associated with the 10–4–10–3 Å–1 q range. In this connection, USAXS-XPCS measurements have been developed and applied using two different measurement modalities (Zhang et al., 2011). In both cases the incident beam collimation is reduced to ~15 × 50 μm or less to ensure the presence of a measurable coherent fraction of the incident beam intensity. Presently, at APS sector 9-ID, the maximum coherent fraction of the beam for 10.5 keV X-rays is <5% for the 15 × 50 μm slit size. (After the MBA upgrade, the coherent fraction will be significantly increased.) The current scale range of motions for which the dynamics can be measured is 500 Å–10 μm (although the size of microstructural features exhibiting the motion must be >0.1 μm), and the time resolution for measurable dynamics is ~10 ms. One of the modalities developed involves taking repeated short two-dimensional-collimated USAXS scans over a very restricted q range, typically 0.0001–0.0015 Å–1. XPCS ‘speckles’ show up as features in the short USAXS scan data, which, owing to their interferometric nature, serve as sensitive probes for subtle changes in the local microstructure. As these speckles slowly change with time, as a result of some incipient change in the local morphology, the correlation coefficients can be calculated, relating successive scans to either the original or final one. From this information, the time dependence of the local response of a material system to some incipient change process can be detected long before any statistically representative change is observable by other means, including more conventional USAXS methods. This method has been applied to detect incipient non-equilibrium (non-ergodic) structural changes in amorphous calcium phosphate-based dental composites (Zhang et al., 2014).
For the other USAXS-XPCS modality developed, the twodimensional-collimated form of USAXS is also used, but the USAXS analysing crystal monolith rotation angle (scattering angle) is set to specific values corresponding to selected q values. This technique primarily characterizes the equilibrium dynamics of fluid nanoparticle dispersions. However, provided the scattering is sufficiently strong, it could also be applied to other complex fluids. Temporal fluctuations in the scattered intensity, measured using a point detector at 100 Hz, are recorded at each q value. The intensity autocorrelation function can then be calculated to reveal the underlying dynamic timescales, e.g. those associated with the equilibrium dynamics of nanoparticles in a fluid suspension. Previously (Zhang et al., 2013), we have used this method to confirm the close connection between the inverse diffusion constant versus q in a nanoparticle suspension and the measured static structure factor, S(q). Very recently, some of the present authors have applied the temporal fluctuations method to investigate the important case of structure and dynamics in bimodal colloidal dispersions in a low-molecular-weight polymer solution (Zhang, Allen et al., 2017). In this connection, Fig. 6 summarizes some of the results for the measured dynamics in the bimodal particle suspension, where the results are noticeably more complex than those of single-component particle suspensions. We note that the large sizes accessible to USAXS-XPCS are associated with slower particle dynamics. This enables the dynamics in low-viscosity fluids, including aqueous systems, to be probed. In this way, we envisage USAXS-XPCS will become an important tool for elucidating the fundamental particle dynamics and interactions within a range of aqueous colloidal dispersions of technological importance.
Figure 6.

USAXS-XPCS results for particle dynamics of a bimodal dispersion: (a) inverse diffusion constant, τ2q, versus q for coarse particles in suspension with a low-molecular-weight polymer, demonstrating de Gennes narrowing; (b) dynamic relaxation time, τ, versus q for particle motions in suspension for both Sample 1 containing only coarse particles (5% volume coarse 0.86 μm diameter particles) and Sample 2 containing roughly equal volume fractions of coarse and fine particles (5% coarse plus ~5% fine 0.48 μm diameter particles); (c) dimensionless isothermal compressibility volume fraction of fine particles in suspension (coarse particle volume fraction roughly constant at ~5%). In (c) the most left hand point is for Sample 1 and the most right hand point is for Sample 2. Vertical bars in the plots represent computed standard deviation uncertainties. Dimensionless compressibility where ρ = total particle number density, kB = Boltzmann constant, T = absolute temperature and χT = isothermal compressibility.
A multiplexed form of USAXS-XPCS has also been developed by the authors for the case of material systems where there is a spatial gradient in the dynamics (Zhang et al., 2015). XPCS is not multiplexed in the sense of measuring speckles simultaneously in different scale and temporal regimes, as has been developed successfully elsewhere (see Möller et al., 2016). Rather, a nanofabricated slit array is used to deliver simultaneously small, partially coherent, incident X-ray beams at several locations on the sample. By taking advantage of two-dimensional USAXS beam collimation, coupled with use of small, independently gated, regions on a two-dimensional (Pilatus) detector, several independent USAXS-XPCS experiments are conducted simultaneously. The two-dimensional detector can be used in place of the photodiode for the short USAXS-XPCS scans, making this form of measurement ideal for probing spatial gradients in the dynamics of a non-ergodic system, especially when there is a front of changing dynamics slowly advancing across the sample. Alternatively, the equilibrium dynamics can be probed at selected q values for several places in a sample, simultaneously. Once final results (e.g. relaxation time versus q) have been obtained for each independent USAXS-XPCS study, these can be averaged to get a better overall statistical result. In effect, a larger beam is used for USAXS-XPCS studies without penalty of reduced coherence.
4.2. USAXS imaging
Several imaging modalities continue to advance at X-ray synchrotrons. The particular advantage of USAXS imaging and tomography is in relating visual feature distributions within a selected sample area directly to the quantitative microstructure and structure characterization afforded by the USAXS/SAXS/WAXS measurements. We illustrate with the following example.
Proton exchange membrane fuel cells (PEMFCs) are electrochemical energy conversion devices that are one of the most promising alternatives to combustion-based power systems owing to their high efficiency and low operating temperature relative to other types of fuel cell. They transform chemical energy to electrical energy through the electrochemical conversion of hydrogen and oxygen to water. To achieve the required performance, this reaction currently requires costly Pt catalysts to split the H2 and O2 molecules. Over the past decade, there have been intensive efforts to reduce the required Pt loading, especially on the cathode or oxygen reduction side of PEMFCs, through enhancements in the platinum oxygen reduction activity and improvements in reactant and product transport to/from active Pt sites. The transport properties and catalyst utilization are strongly related to the hierarchical microstructure of the electrode, which is composed of Pt catalyst particles supported on highsurface-area carbon, proton-conducting polymer and significant porosity. In this connection (Cetinbas et al., 2017), we present here a USAXS-imaging study of the microstructure of a PEMFC cathode catalyst layer consisting of dealloyed Pt/Ni catalysts deposited on an electro-conductive carbon black (KetjenBlack, Lion Speciality Chemicals Co. Ltd, Tokyo, Japan) support and Nafion ionomers (formula: C7HF13O5S C2F4; Dupont, Wilmington, DE, USA).
The conventional X-ray-absorption-based radiograph, acquired at q = 0, is shown in Fig. 7(a). Owing to the thinness of the catalyst layer and the low Pt/Ni concentration, it is apparent that the X-ray absorption contrast is low and the information content in this absorption image is limited. The USAXS-imaging data acquired at q = 0.0002 Å–1, shown in Fig. 7(b), on the other hand, clearly demonstrate the presence of micrometre-sized aggregates that are unevenly distributed in the catalyst layer – specifically, 1–3 μm diameter PtNi–carbon aggregates with minimal infiltration of ionomer at a local level. Moreover, USAXS imaging reveals an otherwise hidden network structure of these aggregates. Such information is important for understanding the interaction between the microstructure and the multiple transport processes in PEMFCs that determine their performance.
Figure 7.

X-ray images of catalyst ink layer: dealloyed Pt/Ni catalysts deposited on an electro-conductive carbon black support and Nafion ionomers. (a) Conventional X-ray absorption image acquired at q = 0; (b) USAXS image acquired at q = 0.0002 Å–1, showing the network structure of micrometre-sized aggregates.
4.3. High-resolution mode
Using Si(440) optics, the resolution of the instrument can be further improved and smaller q values become accessible. With Si(440) optics, one can achieve a q resolution of 3 × 10⁻⁵ Å–1 at the cost of having a lower counting efficiency and a higher sensitivity to vibrations and other instabilities within the instrument. This mode is routinely available to users, but its use is limited to cases where it can be justified. This mode is also compatible with the SAXS and WAXS modes, resulting in an even greater range of microstructural sizes being measurable. It should be noted that, owing to the lower X-ray efficiency and higher sensitivity to vibrations, data collection in this mode requires somewhat longer measurement times. Use of Si(440) crystal optics also favours the use of higher X-ray energies (Ilavsky et al., 2012). Consequently, studies of highly absorbing materials are enabled and thicker window materials can be used to contain aggressive sample environments.
4.4. Further prospects with upcoming APS MBA upgrade
Many new and existing hard X-ray synchrotrons around the world, including the APS, are planning to incorporate an MBA lattice design. The first such MBA diffraction-limited storage ring, Max IV, has started operation in Lund, Sweden (Tavares et al., 2014). The MBA upgrade at the APS, with its potential 100-fold increase in X-ray brightness, will provide unique opportunities to advance most instruments for a new generation of users. Depending on the details of the final undulator, monochromator and beam path for the USAXS instrument, we envisage a decrease in maximum incident beam size from the current 2.0 mm horizontal × 0.8 mm vertical to ~0.8 × 0.8 mm, with a consequent two- to threefold increase in its parallel-beam incident intensity. This will enable USAXS fly scan and SAXS/WAXS exposure times to be further reduced by comparable amounts. Furthermore, the main rotation axes of the optics are all currently horizontal as a result of the asymmetric properties of a typical synchrotron source (both in collimation and in typical beam dimensions). Once the MBA upgrade is completed, this asymmetry will be largely eliminated, allowing the USAXS instrument to be redesigned using vertical rotation axes. This change will provide much higher mechanical stability, opening the path to routine operations in high-resolution mode employing Si(440) and even Si(660) crystal optics, further extending the measured size range. This redesign will also enable faster geometry changes between the three main measurement modes (USAXS, SAXS and WAXS). Meanwhile, the higher coherence of the APS MBA beam will enable major improvements in the USAXS-XPCS technique. In particular, the increased coherence at X-ray energies significantly above the currently used 10 or 11 keV will enable the method to be applied to many engineering materials, allowing dynamics to be studied over the 500 Å–1 μm length scales, with USAXS-XPCS time resolution improved from the current 10 ms to perhaps 1 μs. Also, beam damage effects in USAXS-XPCS soft matter studies will be reduced by using higher-energy X-rays.
USAXS imaging will be significantly improved by the MBA upgrade. Most significantly, the USAXS-imaging working distance, between the sample and the USAXS crystal analyser stage, will be increased by an order of magnitude. Without compromising the image resolution, it should be possible to access a greatly increased USAXS-imaging q range, decrease exposure times and increase the X-ray energy up to ~24 keV. These improved characteristics will enable the use of environmental stages for in situ characterization of technologically important materials over a wide range of conditions. Furthermore, there will be adequate space for a high-angularresolution goniometer system, which would extend USAXS imaging to provide full tomographic reconstructions.
Finally, it should be possible, with other appropriate instrument upgrades, to have both USAXS-XPCS and USAXS imaging available as rapidly interchangeable options along with the standard USAXS, SAXS and WAXS geometries.
5. Conclusions
In this paper, we have described how the APS USAXS facility has recently been transformed into a powerful workhorse for studying materials phenomena and processes across all significant length scales in situ or operando and in real time. This has been accomplished by several new developments: a conversion to higher-order crystal optics and higher X-ray energies as the standard operating mode; rapid fly scan measurements in place of previous step scans, also as a standard operational mode; automated contiguous pinhole SAXS measurements at intermediate q; associated rapid WAXS measurements for XRD without disturbing the sample geometry; and removal of the harmonic rejection mirrors without compromising data integrity. With each mode using the USAXS incident beam optics upstream of the sample, a full set of contiguous USAXS/SAXS/WAXS measurements are now made within about 5 min, allowing operando measurement capabilities under a wide range of sample conditions. We have illustrated these developments with examples of their application to investigate materials phenomena of technological importance. In addition, we have briefly summarized the more specialized instrument measurement modes for USAXS-XPCS and USAXS imaging. We consider that recent and ongoing upgrades of the APS USAXS facility will position it well for the coming changes in the X-ray source, and we have summarized the prospects for future instrument development in the context of the forthcoming MBA upgrade of the APS. We propose that the APS USAXS facility design offers a practical combination of Bonse–Hart-based and conventional SAXS, together with XRD, XPCS and imaging options, well placed to address a large cross section of X-ray characterization needs relevant to the development of advanced precision-designed material systems.
Acknowledgements
The authors would like to thank the following staff in the X-ray Science Division, Argonne National Laboratory: Tim Mooney, Ron Sluiter and Kevin Peterson are acknowledged for all their work on implementation of fly scanning operations; Soenke Seifert and Sungsik Lee are acknowledged for their help and advice in deploying some of the gas-pressure sample environments presented in this paper. The authors would also like to thank Deborah Myers, Chemical Sciences and Engineering Division, Argonne National Laboratory, and Sarah Ball, Jonathan Sharman, Brian Theobald, Graham Hards and Dash Fongalland from Johnson Matthey Fuel Cells, London, UK, for the catalyst layer samples.
Funding information
The catalyst work is funded by the US Department of Energy, Energy Efficiency and Renewable Energy, Fuel Cell Technologies Office. This research used resources of the Advanced Photon Source, a US Department of Energy (DOE) Office of Science User Facility operated for the DOE Office of Science by Argonne National Laboratory, Argonne, IL, USA, under contract No. DE-AC02–06CH11357.
Footnotes
Certain commercial instruments, materials or processes are identified in this paper to adequately specify the experimental procedure. Such identification does not imply recommendation or endorsement by the National Institute of Standards and Technology, nor does it imply that the instruments, materials or processes identified are necessarily the best available for the purpose.
References
- Allen AJ, Espinal L, Wong-Ng W, Queen WL, Brown CM, Kline SR, Kauffman KL, Culp JT & Matranga C (2015). J. Alloys Compd 647, 24–34. [Google Scholar]
- Allen AJ, Hackley VA, Jemian PR, Ilavsky J, Raitano JM & Chan S-W (2008). J. Appl. Cryst 41, 918–929. [Google Scholar]
- Allen AJ, Jemian PR, Black DR, Burdette HE, Spal RD, Krueger S & Long GG (1994). Nucl. Instrum. Methods Phys. Res. A, 347, 487–490. [Google Scholar]
- Allen AJ, Zhang F, Kline RJ, Guthrie WF & Ilavsky J (2017). J. Appl. Cryst 50, 462–474. [DOI] [PMC free article] [PubMed] [Google Scholar]
- Als-Nielsen J & McMorrow D (2011). Elements of Modern X-ray Physics. Chichester: John Wiley and Sons. [Google Scholar]
- Baker BW, Knipling KE & Brewer LN (2017). Met. Mater. Trans. E, 4, 1–12. [Google Scholar]
- Black DR, Windover D, Henins A, Filliben J & Cline JP (2011). Powder Diffr. 26, 155–158. [Google Scholar]
- Blanton TN, Huang TC, Toraya H, Hubbard CR, Robie SB, Louër D, Göbel HE, Will G, Gilles R & Raftery T (1995). Powder Diffr. 10, 91–95. [Google Scholar]
- Bloch ED, Queen WL, Krishna R, Zadrozny JM, Brown CM & Long JR (2012). Science, 335, 1606–1610. [DOI] [PubMed] [Google Scholar]
- Bonse U & Hart M (1965). Appl. Phys. Lett 7, 238–240. [Google Scholar]
- Bonse U & Hart M (1966). Z. Phys 189, 151–162. [Google Scholar]
- Cetinbas FC, Ahluwalia RK, Kariuki N, De Andrade V, Fongalland D, Smith L, Sharman J, Ferreira P, Rasouli S & Myers DJ (2017). J. Power Sources, 344, 62–73. [Google Scholar]
- Chantler CT, Olsen K, Dragoset RA, Chang J, Kishore AR, Kotochigova SA & Zucker DS (2005). X-ray Form Factor, Attenuation, and Scattering Tables (Version 2.1). NIST, Gaithersburg, Maryland, USA, http://physics.nist.gov/ffast. [Google Scholar]
- Cheshire MC, Stack AG, Carey JW, Anovitz LM, Prisk TR & Ilavsky J (2017). Environ. Sci. Technol 51, 692–698. [DOI] [PubMed] [Google Scholar]
- Chupas PJ, Chapman KW, Kurtz C, Hanson JC, Lee PL & Grey CP (2008). J. Appl. Cryst 41, 822–824. [Google Scholar]
- Cline JP, Von Dreele RB, Winburn R, Stephens PW & Filliben JJ (2011). Acta Cryst. A 67, 357–367. [DOI] [PubMed] [Google Scholar]
- Diat O, Bösecke P, Lambard L & de Moor PPEA (1997). J. Appl. Cryst 30, 862–866. [Google Scholar]
- Farha OK, Eryazici I, Jeong NC, Hauser BG, Wilmer CE, Sarjeant AA, Snurr RQ, Nguyen ST, Yazaydin AO & Hupp JT (2012). J. Am. Chem. Soc 134, 15016–15021. [DOI] [PubMed] [Google Scholar]
- Gadikota G (2017). Minerals, 7, 169–182. [Google Scholar]
- Hammons JA & Ilavsky J (2017). Electrochim. Acta, 228, 462–473. [Google Scholar]
- Hammons JA, Ustarroz J, Muselle T, Torriero AAJ, Terryn H, Suthar K & Ilavsky J (2016). J. Phys. Chem C, 120, 1534–1545. [Google Scholar]
- Han J, Lee E, Dudoff JK, Bagge-Hansen M, Lee JRI, Pascall AJ, Kuntz JD, Willey TM, Worsley MA & Han TY-J (2017). Adv. Opt. Mater 5, 1600838. [Google Scholar]
- Idell Y, Levine LE, Allen AJ, Zhang F, Campbell CE, Olson GB, Gong J, Snyder DR & Deutchman HZ (2016). JOM, 68, 950–959. [Google Scholar]
- Igarashi N, Watanabe Y, Shinohara Y, Inoko Y, Matsuba G, Okuda H, Mori T & Ito K (2011). J. Phys. Conf. Ser 272, 012026. [Google Scholar]
- Ilavsky J (2012). J. Appl. Cryst 45, 324–328. [Google Scholar]
- Ilavsky J, Allen AJ, Levine LE, Zhang F, Jemian PR & Long GG (2012). J. Appl. Cryst 45, 1318–1320. [DOI] [PMC free article] [PubMed] [Google Scholar]
- Ilavsky J, Allen AJ, Long GG & Jemian PR (2002). Rev. Sci. Instrum 73, 1660–1662. [Google Scholar]
- Ilavsky J & Jemian PR (2009). J. Appl. Cryst 42, 347–353. [DOI] [PMC free article] [PubMed] [Google Scholar]
- Ilavsky J, Jemian PR, Allen AJ, Zhang F, Levine LE & Long GG (2009). J. Appl. Cryst 42, 469–479. [DOI] [PMC free article] [PubMed] [Google Scholar]
- Ilavsky J, Zhang F, Allen AJ, Levine LE, Jemian PR & Long GG (2013). Metall. Mater. Trans. A, 44, 68–76. [Google Scholar]
- Jemian PR & Long GG (1990). J. Appl. Cryst 23, 430–432. [Google Scholar]
- Kauffman KL, Culp JT, Allen AJ, Espinal L, Wong-Ng W, Brown TD, Goodman A, Bernardo MP, Pancoast RJ, Chirdon D & Matranga C (2011). Angew. Chem. Int. Ed 50, 10888–10892. [DOI] [PubMed] [Google Scholar]
- Lake JA (1967). Acta Cryst. 23, 191–194. [Google Scholar]
- Levine LE & Long GG (2004). J. Appl. Cryst 37, 757–765. [Google Scholar]
- Long GG, Jemian PR, Weertman JR, Black DR, Burdette HE & Spal R (1991). J. Appl. Cryst 24, 30–37. [Google Scholar]
- MacCuspie RI, Allen AJ & Hackley VA (2011). Nanotoxicology, 5, 140–156. [DOI] [PubMed] [Google Scholar]
- Martin MN, Allen AJ, MacCuspie RI & Hackley VA (2014). Langmuir, 30, 11442–11452. [DOI] [PubMed] [Google Scholar]
- Masunaga H et al. (2011). Polym. J 43, 471–477. [Google Scholar]
- Michels L, Fossum JO, Rozynek Z, Hemmen H, Rustenberg K, Sobas PA, Kalantzopoulos GN, Knudsen KD, Janek M, Plivelic TS & da Silva GJ (2015). Nat. Sci. Rep 5, 8775. [DOI] [PMC free article] [PubMed] [Google Scholar]
- Möller J, Chushkin Y, Prevost S & Narayanan T (2016). J. Synchrotron Rad. 23, 929–936. [DOI] [PMC free article] [PubMed] [Google Scholar]
- Möller J & Narayanan T (2017). Phys. Rev. Lett 118, 198001. [DOI] [PubMed] [Google Scholar]
- Narayanan T (2009). Curr. Opin. Colloid Interface Sci 14, 409–415. [Google Scholar]
- Nelson AP, Farha OK, Mulfort KL & Hupp JT (2009). J. Am. Chem. Soc 131, 458–460. [DOI] [PubMed] [Google Scholar]
- Peterson VK, Auckett JE & Pang W-K (2017). IUCrJ, 4, 540–554. [DOI] [PMC free article] [PubMed] [Google Scholar]
- Ramel PRR Jr, Peyronel F & Marangoni AG (2016). Food Chem. 203, 224–230. [DOI] [PubMed] [Google Scholar]
- Ristanović Z & Weckhuysen BM (2014). Angew. Chem. Int. Ed 53, 8556–8558. [DOI] [PMC free article] [PubMed] [Google Scholar]
- Shinohara Y, Imai R, Kishimoto H, Yagi N & Amemiya Y (2010). J. Synchrotron Rad 17, 737–742. [DOI] [PubMed] [Google Scholar]
- Shinohara Y, Kishimoto H, Maejima T, Nishikawa H, Yagi N & Amemiya Y (2007). Jpn. J. Appl. Phys 46, L300–L302. [Google Scholar]
- Sumida K, Horike S, Kaye SS, Herm ZR, Queen WL, Brown CM, Grandjean F, Long GJ, Dailly A & Long JR (2010). Chem. Sci 1, 184–191. [Google Scholar]
- Sztucki M & Narayanan T (2007). J. Appl. Cryst 40, s459–s462. [Google Scholar]
- Tavares PF, Leemann SC, Sjöström M & Andersson Å(2014). J. Synchrotron Rad 21, 862–877. [DOI] [PMC free article] [PubMed] [Google Scholar]
- Wavemetrics (2017). Igor Pro, http://www.wavemetrics.com.
- Wong-Ng W, Culp JT, Chen YS, Zavalij P, Espinal L, Siderius DW, Allen AJ, Scheins S & Matranga C (2013). CrystEngComm, 15, 4684–4693. [Google Scholar]
- Yaghi OM, O’Keeffe M, Ockwig NW, Chae HK, Eddaoudi M & Kim J (2003). Nature, 423 705–714. [DOI] [PubMed] [Google Scholar]
- Ye J, An Y, Montalvo E, Campbell PG, Worsley MA, Tran IC, Liu Y, Wood BC, Biener J, Jiang H, Tang M & Wang YM (2016). J. Mater. Chem. A, 4, 4032–4043. [Google Scholar]
- Zhang F, Allen AJ, Johnston-Peck A, Liu J & Pettibone JM (2018). ACS Nano. Submitted. [DOI] [PMC free article] [PubMed]
- Zhang F, Allen AJ, Levine LE, Ilavsky J & Long GG (2013). Langmuir, 29, 1379–1387. [DOI] [PubMed] [Google Scholar]
- Zhang F, Allen AJ, Levine LE, Ilavsky J, Long GG & Sandy AR (2011). J. Appl. Cryst 44, 200–212. [Google Scholar]
- Zhang F, Allen AJ, Levine LE, Long GG, Kuzmenko I & Ilavsky J (2018). J. Synchrotron Rad Submitted. [DOI] [PMC free article] [PubMed] [Google Scholar]
- Zhang F, Allen AJ, Levine LE, Mancini DC & Ilavsky J (2015). J. Synchrotron Rad 22, 653–660. [DOI] [PMC free article] [PubMed] [Google Scholar]
- Zhang F, Allen AJ, Levine LE, Tsai D-H & Ilavsky J (2017). Langmuir, 33, 2817–2828. [DOI] [PMC free article] [PubMed] [Google Scholar]
- Zhang F, Allen AJ, Levine LE, Vaudin MD, Skrtic D, Antonucci JM, Hoffman KM, Giuseppetti AA & Ilavsky J (2014). Dent. Mater 30, 1113–1125. [DOI] [PMC free article] [PubMed] [Google Scholar]
- Zhang F & Ilavsky J (2010). J. Macromol. Sci. C Polym. Rev 50, 59–90. [Google Scholar]
- Zhang F, Ilavsky J, Long GG, Quintana JPG, Allen AJ & Jemian PR (2010). Metall. Mater. Trans. A, 41, 1151–1158. [Google Scholar]
- Zhang F, Levine LE, Allen AJ, Campbell CE, Creuziger AA, Kazantseva N & Ilavsky J (2016). Acta Mater. 111, 385–398. [DOI] [PMC free article] [PubMed] [Google Scholar]
- Zhang F, Levine LE, Allen AJ, Campbell CE, Lass EA, Cheruvathur S, Stoudt MR, Williams ME & Idell Y (2017). Scr. Mater 131, 98–102. [DOI] [PMC free article] [PubMed] [Google Scholar]