

Summary
Diffuse large B‐cell lymphoma (DLBCL) is the most common subtype of non‐Hodgkin lymphoma. Because the prognosis of DLBCL patients varies considerably, there is an urgent need to identify novel prognostic factors. In this study, we investigated the expression levels of the signalling enzyme 3‐phosphoinositide‐dependent protein kinase‐1 (PDK1), the cell cycle regulatory enzyme Polo‐like kinase 1 (PLK1) and the transcription factor (c‐Myc) in DLBCL tissues and evaluated their clinical and prognostic significance. PDK1, PLK1 and c‐Myc were detected by immunohistochemical staining of paraffin‐embedded specimens from 152 DLBCL and 48 lymphadenitis patients. Expression levels were correlated with clinicopathological factors. PDK1, PLK1 and c‐Myc were more commonly expressed in DLBCL specimens than in lymphadenitis specimens, and the expression of each protein correlated positively with that of the other two molecules. High PDK1, PLK1 and c‐Myc expression, high international prognostic index score, high lactate dehydrogenase levels and late Ann Arbor stage were shown to correlate with shorter overall survival time. A multivariate Cox regression model showed that high expression levels of PLK1 and c‐Myc were independent prognostic factors for DLBCL. Our findings indicate that PLK1 and c‐Myc expression might be promising predictive biomarkers for DLBCL patients.
Keywords: c‐Myc, diffuse large B‐cell lymphoma, immunohistochemistry, PDK1, PLK1
1. INTRODUCTION
Diffuse large B‐cell lymphoma (DLBCL) is the most common subtype of non‐Hodgkin lymphoma, with an annual incidence of 7‐8 cases per 100 000.1 In the 2008 World Health Organization classification of lymphoid neoplasms, DLBCL subtypes were classified according to their gene expression profile—as activated B cell (ABC) like subtype, germinal centre B cell (GCB) like subtype and not otherwise specified (NOS) subtype.2 DLBCL primarily arises in lymph nodes or extranodal organs and presents as masses. Immunodeficiency is a major risk factor for DLBCL, and Epstein–Barr virus infection is closely associated with the progression of some subtypes of DLBCL.3 The standard treatment for DLBCL is CHOP (cyclophosphamide, doxorubicin, vincristine and prednisone) combined with the anti‐CD20 monoclonal antibody rituximab.4, 5 Local radiotherapy is also performed in some patients if the involved sites are appropriate for treatment. The International Prognostic Index (IPI) score, which estimates progression‐free and overall survival based on risk factors such as Ann Arbor tumour stage, extranodal sites and serum lactate dehydrogenase (LDH) levels, is widely used for the prognostic assessment of DLBCL patients.6 Although chemotherapy combined with targeted drugs has improved the efficacy of treatment for many patients, relapse and progression to refractory diseases are not uncommon and are usually attributed to chemotherapy resistance. DLBCL patients with the same IPI scores do not always have similar prognoses, indicating that individual patient differences are important contributing factors. Thus, there is an urgent need to identify novel prognostic biomarkers for DLBCL patients.
3‐Phosphoinositide‐dependent protein kinase‐1 (PDK1), sometimes referred to as PDPK1, plays a key role in signal transduction pathways activated by growth factors and hormones, including insulin.7, 8 As a member of the AGC protein kinase family,9 PDK1 is activated by the phosphorylation of serine T ring residues (Ser241).10 PDK1 expression is closely associated with the recurrence and progression of various tumours, including colon cancer, breast cancer and ovarian cancer.11, 12, 13 Although PDK1 inhibition has been shown to effectively reduce the growth of some tumours, little is known about its expression and function in DLBCL.
Polo‐like kinase‐1 (PLK1) belongs to the PLK family and is a serine/threonine protein kinase.14 It has multiple key roles in cell homoeostasis by regulating the cell cycle, acting as a control checkpoint in G1/M phase, regulating spindle formation and chromosome separation and maintaining genomic stability.15, 16, 17, 18, 19 PLK1 is thought to be a proto‐oncogene, and its downregulation can induce apoptotic pathways and inhibit cell growth.20 PLK1 is highly expressed in a variety of malignant tumours, where it functions in cell proliferation and metastasis; not surprisingly, PLK1 expression is also closely associated with poor prognosis.21, 22, 23 Previous work showed that PLK1 expression correlates with event‐free survival in DLBCL patients24 and that a PLK1 inhibitor has anti‐tumour effects in multiple xenograft models of DLBCL.25
c‐Myc is a member of the Myc family of transcription factor regulatory proteins, and its activity can be elevated through a number of mechanisms, including insertional mutation, translocation and gene amplification.26 This protein plays roles in many crucial cell processes, including the cell cycle, apoptosis, cell immortalization and stem cell self‐renewal and differentiation.27, 28, 29 In tumour cells, c‐Myc plays dual roles in proliferation and is also associated with tumour metastasis and invasion.30
c‐Myc expression is an important predictor of DLBCL, as recognized by the recent concept of double‐ and triple‐hit lymphomas.31 Tan et al7 found that PDK1 overexpression induced the phosphorylation of PLK1, which in turn upregulated c‐Myc expression state. Moreover, the PDK1‐PLK1‐c‐Myc signalling pathway was strongly linked to cancer cell growth and survival. Because c‐Myc is known to be a prognostic predictor of DLBCL, we hypothesized that expression of components of the PDK1‐PLK1‐c‐Myc signalling pathway may correlate with DLBCL prognosis.
In this study, therefore, we investigated the expressions of PDK1, PLK1 and c‐Myc in DLBCL specimens and evaluated their clinical and prognostic significance.
2. MATERIALS AND METHODS
2.1. Patient population and sample collection
A total of 152 patients diagnosed with DLBCL at Xiangya Hospital of Central South University and Hunan Cancer Hospital between April 2011 and December 2014 were retrospectively studied. All patients had de novo DLBCL, and none had received chemotherapy, radiotherapy or any other anti‐tumour therapies before DLBCL diagnosis. Clinical information collected from patient records included the involved body sites, specimen types, age, gender, treatment, IPI score, LDH level (elevated was defined as >245 U/L), B symptoms (fever—[temperature >38°C for 3 consecutive days], weight loss without trying—[exceeding 10% of body weight in 6 months], and drenching night sweats), Ann Arbor stage and subtype (defined by cell of origin classification, using immunohistochemistry [IHC]—according to the Hans algorithm). All patients had complete clinical and follow‐up data. As controls, we also retrospectively studied another group of 48 patients from Xiangya Hospital of Central South University who were diagnosed with chronic superficial lymphadenitis between April 2011 and December 2014, the same time period as the DLBCL group. Paraffin‐embedded specimens were collected in accordance with the ethical standards set by the responsible committee on human experimentation (institutional and national).
2.2. Ethical approval
The study was approved by the ethical committee of Xiangya Hospital of Central South University (No. 201603172) and was conducted in accordance with the Helsinki Declaration of 1975 (revised in 2008), and all patients provided written informed consent.
2.3. Follow‐up
All 152 DLBCL patients were followed from the day of diagnosis to January 2017. Overall survival (OS) was calculated from the date of diagnosis.
2.4. Immunohistochemistry
Protein expression was evaluated by IHC with a streptavidin‐peroxidase staining kit according to the manufacturer's instructions. Tissues known to express the antigen of interest were used as positive controls, and tissues processed without the primary antibody were used as negative controls. The paraffin‐embedded tissue sections were first dewaxed and hydrated, and antigen was then retrieved by incubation in citrate buffer with heating (pH 6.0). The sections were incubated in 3% hydrogen peroxide for 20 minutes at 37°C, blocked with serum for 30 minutes at 37°C and then incubated at 4°C overnight with the primary monoclonal antibody: rabbit—anti‐PDK1 (Abcam, Cambridge, UK, ab52893, 1:100), mouse—anti‐PLK1 (Abcam, Cambridge, UK, ab17057, 1:200) or rabbit—anti‐c‐Myc (Abcam, Cambridge, UK, ab32072, 1:200). After washing, sections were incubated with the appropriate biotin‐conjugated secondary antibody for 20 minutes at 37°C and then with horseradish peroxidase‐linked streptavidin for 30 minutes at 37°C. The sections were developed using 3,3′‐diaminobenzidine as a chromogen and counterstained with haematoxylin. Finally, the slides were dehydrated, mounted and visualized using a Leica microscope.
We randomly selected five areas of high‐quality staining under high‐magnification (400×) for each sample, and the slides were evaluated by two experienced pathologists in a blinded fashion. Expression of PDK1 and PLK1 was evaluated by assigning a semi‐quantitative immunoreactivity score (IRS).32 The IRS was calculated by multiplying the staining intensity score (0 = no colour, 1 = weak staining, 2 = moderate staining, 3 = strong staining) by the score for the percentage of positively stained cells (0 = no positive cells, 1 = 1%‐30%, 2 = 31%‐60%, 3 > 60%). The final IRS score thus reflected the overall intensity and extent of expression: 0 = negative, 1‐2 = weak, 3‐5 = moderate and 6‐9 = strong expression. The average IRS of five high‐magnification (400×) areas was reported. Weak, moderate and strong intensities were considered positive expression. Negative and weak intensities were considered low expression, and moderate and strong intensities were considered high expression.33, 34 Based on a previous study, we used a cut‐off score of 40% positively stained cells to define high c‐Myc expression.35 None of the cases were evaluated for c‐Myc rearrangements or amplifications.
2.5. Statistical analysis
We used SPSS statistical software for data analysis (version 17.0; SPSS Inc., Chicago, IL, USA). A rank sum test was used to compare the expression of PDK1, PLK1 and c‐Myc in DLBCL and lymphadenitis groups. Correlations among PDK1, PLK1 and c‐Myc expression levels were assessed using Spearman rank correlation analysis. Pearson's chi‐square test was used to compare clinicopathological features and PDK1, PLK1 or c‐Myc expression. Survival curves were constructed according to the Kaplan–Meier method. Multivariate analysis was performed using a Cox regression model. A two‐sided P value of <0.05 was considered statistically significant.
3. RESULTS
3.1. Patient characteristics
The clinicopathological features of the 152 DLBCL patients are summarized in Table 1.
Table 1.
Clinicopathological features of DLBCL patients
| Characteristics | Number | Percentage (%) |
|---|---|---|
| Body site | ||
| Nodal | 87 | 57.24 |
| Extranodal | 65 | 42.76 |
| Specimen type | ||
| Core biopsy | 112 | 73.68 |
| Excision | 40 | 26.32 |
| Gender | ||
| Male | 98 | 64.47 |
| Female | 54 | 35.53 |
| Age | ||
| <60 years | 109 | 71.71 |
| ≧60 years | 43 | 28.29 |
| IPI score | ||
| Low‐risk group | 76 | 50 |
| Low‐ to medium‐risk group | 43 | 28.29 |
| High‐ to medium‐risk group | 22 | 14.47 |
| High‐risk group | 11 | 7.24 |
| LDH | ||
| Elevated | 55 | 36.18 |
| Normal | 97 | 63.82 |
| B symptoms | ||
| Present | 26 | 17.11 |
| Absent | 126 | 82.89 |
| Ann Arbor stage | ||
| I + II | 81 | 53.29 |
| III + IV | 71 | 46.71 |
| Subtype | ||
| non‐GCB | 79 | 51.97 |
| GCB | 73 | 48.03 |
| Treatment | ||
| Chemotherapy | 130 | 85.53 |
| Radiochemotherapy | 22 | 14.47 |
3.2. PDK1, PLK1 and c‐Myc expression in DLBCL and lymphadenitis tissues
The expression of PLK1 and c‐Myc was localized to the nucleus, whereas PDK1 expression was seen in the cytoplasm or membranes. Representative stained sections are shown in Figure 1. The positive expression rates for the three proteins were as follows: PDK1 78.29% (119/152) in the DLBCL group and 45.83% (22/48) in the lymphadenitis group; PLK1 79.61% (121/152) in the DLBCL group and 50% (24/48) in the lymphadenitis group; and c‐Myc 80.92% (123/152) in the DLBCL group and 29.17% (14/48) in the lymphadenitis group (Table 2). All of the positively stained lymphadenitis tissues showed only low expression of PDK1, PLK1 and c‐Myc in the cortex of the lymph nodes. In contrast, among the positively stained DLBCL tissues, PDK1 was detected at low and high levels in 71 and 81 tissues, respectively; PLK1 in 73 and 79 tissues, respectively; and c‐Myc in 76 and 76 tissues respectively. The rates of PDK1, PLK1 and c‐Myc expression were significantly different between DLBCL and lymphadenitis patients (all P < 0.001).
Figure 1.
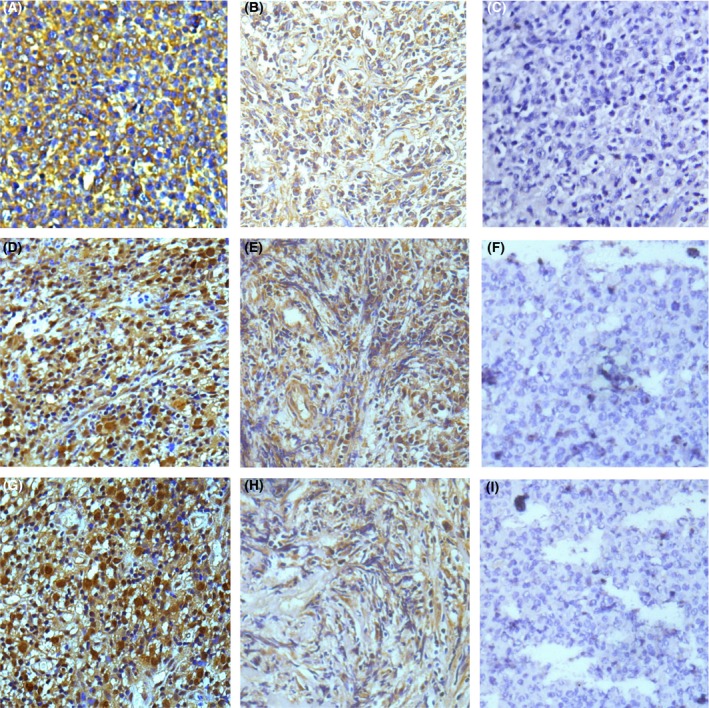
Immunohistochemical staining for PDK1, PLK1 and c‐Myc in DLBCL and lymphadenitis (400×). (A) PDK1 positively expressed in DLBCL. (B) PDK1 positively expressed in lymphadenitis. (C) PDK1 negatively expressed in lymphadenitis. (D) PLK1 positively expressed in DLBCL. (E) PLK1 positively expressed in lymphadenitis. (F) PLK1 negatively expressed in lymphadenitis. (G) c‐Myc positively expressed in DLBCL. (H) c‐Myc positively expressed in lymphadenitis. (I) c‐Myc negatively expressed in lymphadenitis [Colour figure can be viewed at wileyonlinelibrary.com]
Table 2.
Expressions of PDK1, PLK1 and c‐Myc in DLBCL and lymphadenitis patients
| Disease | Positive expression (%) | ||
|---|---|---|---|
| PDK1 | PLK1 | c‐Myc | |
| DLBCL | 119 (78.29) | 121 (79.61) | 123 (80.92) |
| Lymphadenitis | 22 (45.83) | 24 (50) | 14 (29.17) |
| P value | <0.001 | <0.001 | <0.001 |
3.3. Correlations between PDK1, PLK1 and c‐Myc expression
The expression of each molecule correlated positively with that of the other two molecules (Tables 3, 4, 5).
Table 3.
Correlation between PDK1 and PLK1 expression
| PLK1 | r | P value | ||
|---|---|---|---|---|
| Low | High | |||
| PDK1 | ||||
| Low | 71 | 0 | 0.739 | <0.001 |
| High | 2 | 79 | ||
Table 4.
Correlation between PDK1 and c‐Myc expression
| c‐Myc | r | P value | ||
|---|---|---|---|---|
| Low | High | |||
| PDK1 | ||||
| Low | 71 | 0 | 0.61 | <0.001 |
| High | 5 | 76 | ||
Table 5.
Correlation between PLK1 and c‐Myc expression
| c‐Myc | r | P value | ||
|---|---|---|---|---|
| Low | High | |||
| PLK1 | ||||
| Low | 73 | 0 | 0.64 | <0.001 |
| High | 3 | 76 | ||
3.4. Associations between PDK1, PLK1 and c‐Myc expression and clinicopathological features
High expression of PDK1, PLK1 and c‐Myc correlated with IPI score, LDH levels and Ann Arbor stage (all P < 0.001), but not with age, gender, B symptoms, subtypes or treatment (P > 0.05, Table 6).
Table 6.
Association between PDK1, PLK1 and c‐Myc expression and clinicopathological features
| Characteristics | No. | PDK1 | P value | PLK1 | P value | c‐Myc | P value | |||
|---|---|---|---|---|---|---|---|---|---|---|
| Low | High | Low | High | Low | High | |||||
| Gender | ||||||||||
| Male | 98 | 44 | 54 | 0.546 | 50 | 48 | 0.32 | 47 | 51 | 0.498 |
| Female | 54 | 27 | 27 | 23 | 31 | 29 | 25 | |||
| Age | ||||||||||
| <60 years | 109 | 51 | 58 | 0.975 | 57 | 52 | 0.094 | 57 | 52 | 0.368 |
| ≧60 years | 43 | 20 | 23 | 16 | 27 | 19 | 24 | |||
| IPI score | ||||||||||
| Low‐risk group | 76 | 54 | 22 | <0.001 | 56 | 20 | <0.001 | 60 | 16 | <0.001 |
| Low‐ to medium‐risk group | 43 | 15 | 28 | 14 | 29 | 14 | 29 | |||
| High‐ to medium‐risk group | 22 | 2 | 20 | 3 | 19 | 2 | 20 | |||
| High‐risk group | 11 | 0 | 11 | 0 | 11 | 0 | 11 | |||
| LDH | ||||||||||
| Elevated | 55 | 15 | 40 | <0.001 | 18 | 37 | <0.001 | 16 | 39 | <0.001 |
| Normal | 97 | 56 | 41 | 55 | 42 | 60 | 37 | |||
| B symptoms | ||||||||||
| Present | 26 | 11 | 15 | 0.621 | 11 | 15 | 0.521 | 11 | 15 | 0.389 |
| Absent | 126 | 60 | 66 | 62 | 64 | 61 | 65 | |||
| Ann Arbor stage | ||||||||||
| I + II | 81 | 52 | 29 | <0.001 | 54 | 27 | <0.001 | 58 | 23 | <0.001 |
| III + IV | 71 | 19 | 52 | 19 | 52 | 18 | 53 | |||
| Subtype | ||||||||||
| non‐GCB | 79 | 33 | 46 | 0.204 | 38 | 41 | 0.985 | 38 | 41 | 0.626 |
| GCB | 73 | 38 | 35 | 35 | 38 | 38 | 35 | |||
| Treatment | ||||||||||
| Chemotherapy | 130 | 60 | 70 | 0.738 | 64 | 66 | 0.47 | 63 | 67 | 0.356 |
| Radiochemotherapy | 22 | 11 | 11 | 9 | 13 | 13 | 9 | |||
3.5. Survival and prognostic factors
Of the 152 DLBCL patients, 80 died from the disease with a median OS of 29.5 months. Among the clinicopathological features, IPI score, LDH level and Ann Arbor stage were significant predictors of OS (P < 0.001), whereas gender, age, B symptoms, subtype and treatment showed no relationship to OS (P > 0.05, Table 7).
Table 7.
Association of OS and clinicopathological features
| Characteristics | Median OS (months) | P value |
|---|---|---|
| Gender | ||
| Male | 41 | 0.644 |
| Female | 36 | |
| Age | ||
| <60 years | 50 | 0.069 |
| ≧60 years | 24 | |
| IPI score | ||
| Low‐risk group | Not reached | <0.001 |
| Low‐ to medium‐risk group | 23 | |
| High‐ to medium‐risk group | 19 | |
| High‐risk group | 10 | |
| LDH | ||
| Elevated | 20 | <0.001 |
| Normal | 62 | |
| B symptoms | ||
| Present | 28 | 0.423 |
| Absent | 41 | |
| Ann Arbor stage | ||
| I + II | Not reached | <0.001 |
| III + IV | 21 | |
| Subtype | ||
| non‐GCB | 34 | 0.605 |
| GCB | 41 | |
| Treatment | ||
| Chemotherapy | 36 | 0.21 |
| Radiochemotherapy | Not reached | |
A multivariate Cox regression model showed that the expression levels of PLK1 and c‐Myc were independent predictors of OS (Table 8).
Table 8.
Multivariate analysis of prognostic factors affecting OS of DLBCL patients
| Parameters | HR | 95% CI | P value |
|---|---|---|---|
| IPI score (0‐1/2/3/4‐5) | 0.126‐1.637 | >0.05 | |
| LDH (elevated/normal) | 1.582 | 0.941‐2.66 | 0.084 |
| Ann Arbor stage (I + II/III + IV) | 0.556 | 0.297‐1.044 | 0.068 |
| PDK1 statues (low/high) | 0.561 | 0.296‐1.063 | 0.076 |
| PLK1 status (low/high) | 2.735 | 1.436‐5.21 | 0.002 |
| c‐Myc status (low/high) | 20.596 | 8.385‐50.59 | <0.001 |
Kaplan–Meier OS curves for DLBCL patients stratified by tumour expression of PDK1, PLK1 and c‐Myc are shown in Figure 2. High expression of each of these three molecules was significantly associated with unfavourable prognosis (P < 0.001).
Figure 2.
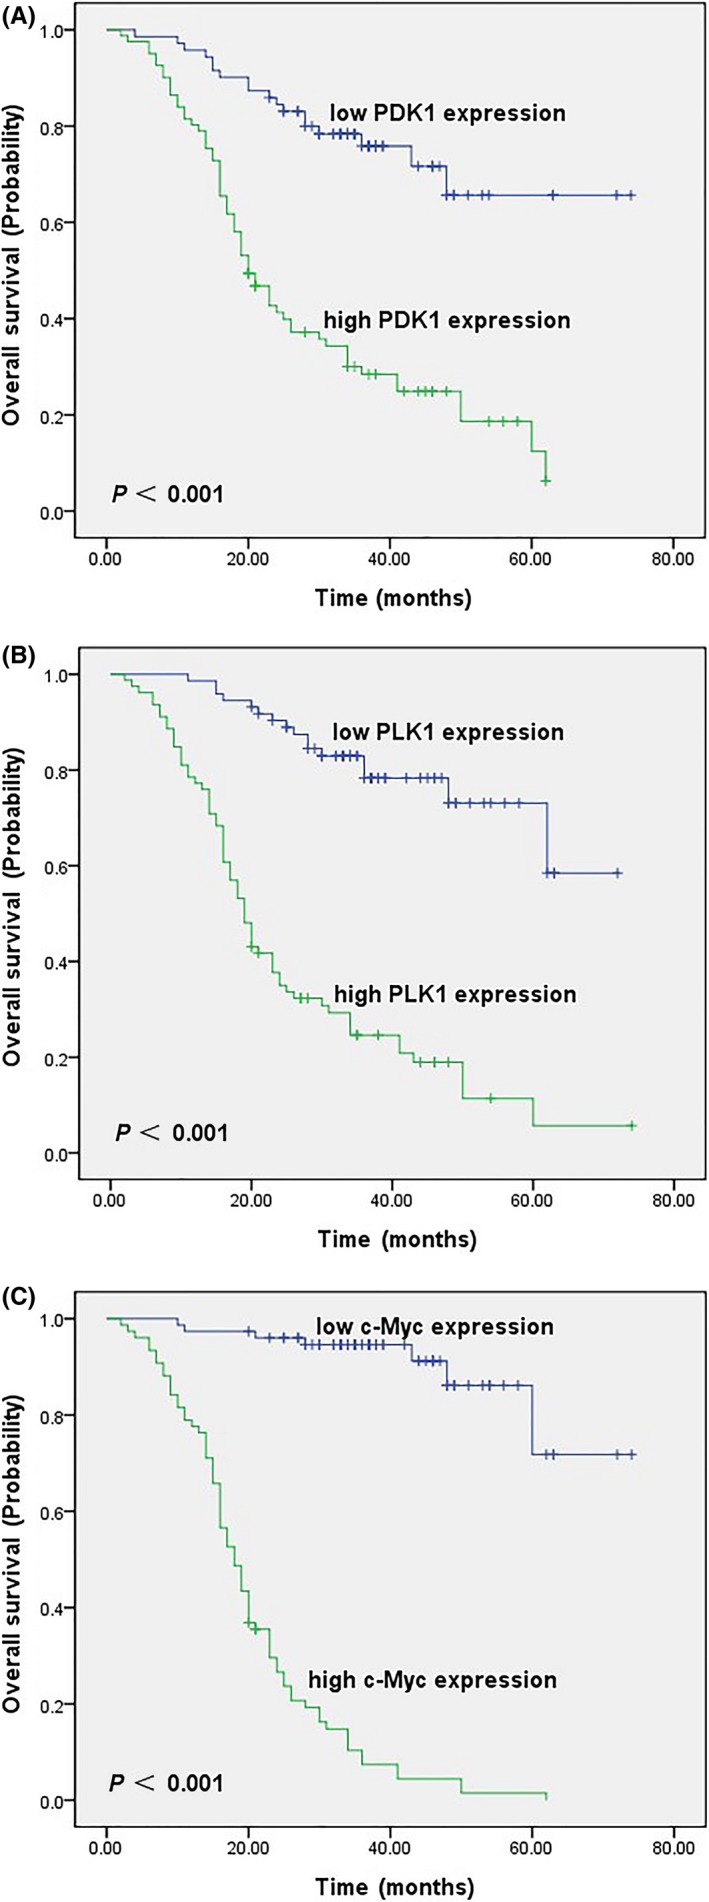
Kaplan–Meier survival curves of DLBCL patients. (A) OS for PDK1 low and high expression state (P < 0.001). (B) OS for PLK1 low and high expression state (P < 0.001). (C) OS for c‐Myc low and high expression state (P < 0.001) [Colour figure can be viewed at wileyonlinelibrary.com]
4. DISCUSSION
DLBCL is a highly heterogeneous haematological malignancy. Although chemotherapy combined with targeted drugs, such as rituximab, has improved the survival rates of DLBCL patients, the rates of relapse and refractory disease, thought to be related to drug resistance, remain high. The prognosis of DLBCL patients varies considerably for unknown reasons, underscoring the need for novel prognostic indicators. To this end, we analysed the expression levels of PDK1, PLK1 and c‐Myc in 152 DLBCL and 48 lymphadenitis tissues and explored their relationships with patient clinicopathological features and prognosis. All three proteins were expressed at low levels in the cortex of lymph node specimens from the lymphadenitis patients, which is consistent with their known pattern of expression in normal lymph nodes (https://www.proteomicsdb.org).
PDK1 plays a role in cell proliferation, survival, metabolism and transformation36 and is associated with tumour progression and metastasis through activating PI3K/AKT pathway.37, 38 Our study showed that PDK1 was positively expressed in 78.29% of DLBCL specimens compared with 45.83% of lymphadenitis patients. High PDK1 expression in DLBCL correlated with IPI score, LDH level and Ann Arbor stage but not with age, gender, B symptoms, subtype or treatment. We also found that high PDK1 expression was associated with a shorter OS, but that it was not an independent predictor of prognosis. Lohneis et al39 examined PDK1 expression by IHC in 253 primary ovarian serous carcinomas and found that positive expression was an independent predictor of shorter OS in patients with high‐grade disease. Similarly, Bai et al40 analysed PDK1 mRNA and protein expression by qRT‐PCR and IHC respectively, in 156 gastric cancers and showed that positive expression was an independent negative prognostic factor. Our results conflict with these two studies, possibly due to the smaller number of patients and shorter follow‐up period. Although we found a significant correlation between PDK1 expression and OS, which may be helpful in decision‐making for early intervention in DLBCL patients, further work will be needed to understand the precise role played by PDK1 in DLBCL as well as the source of conflict between our data and the studies of Lohneis et al39 and Bai et al.40
We found that PLK1 was expressed in 79.61% of DLBCL specimens and 50% of lymphadenitis specimens. A high frequency of expression was expected because PLK1 plays important roles in regulating the cell cycle and genomic stability. In DLBCL patients, high PLK1 expression correlated with IPI score, LDH level and Ann Arbor stage, but not with age, gender, B symptoms, subtype or treatment. Furthermore, high PLK1 expression was associated with a shorter OS and was an independent predictor of poor prognosis. Tut et al41 examined PLK1 by IHC in 286 rectal cancer specimens and found that low PLK1 expression was an independent predictor of better OS. Our results are consistent with this study, suggesting that PLK1 could be a useful prognostic factor for DLBCL patients.
Finally, we found that c‐Myc was expressed in 80.92% of DLBCL specimens and 29.17% of lymphadenitis specimens. Like PDK1 and PLK1, high c‐Myc expression correlated with IPI score, LDH level and Ann Arbor stage, but not with age, gender, B symptoms, subtype or treatment. DLBCL patients with high c‐Myc expression also had a shorter OS than those with low c‐Myc expression, and c‐Myc was an independent predictor of poor prognosis. Green et al42 investigated c‐Myc expression in breast cancer patients and found that its overexpression predicted poor prognosis and conferred resistance to endocrine therapy. Our results are consistent with the former finding, indicating that c‐Myc may be a useful predictor of poor prognosis in DLBCL.
Interestingly, we also found a positive correlation between the expression of PDK1, PLK1 and c‐Myc with the other two molecules, which is consistent with the results of a previous study by Tan et al7 These authors found that PDK1 induced the phosphorylation of PLK1, and that PLK1 then directly induced c‐Myc protein accumulation in a PDK1‐dependent manner. Thus, a PDK1‐PLK1‐c‐Myc signalling pathway related to cancer cell growth and survival was identified.
In conclusion, our results suggest that high expression levels of PLK1 and c‐Myc are predictors of poor prognosis in DLBCL patients. Further work will be needed to understand the role of the PDK1‐PLK1‐c‐Myc pathway in DLBCL.
CONFLICT OF INTEREST STATEMENT
The authors declare no conflicts of interest.
ACKNOWLEDGEMENTS
We greatly appreciate the technical support of the Departments of Oncology and Pathology, Xiangya Hospital of Central South University and the Department of Pathology, Hunan Cancer Hospital. This work was supported by the National Natural Science Foundation of China (No. 81570200).
Feng Y, Lin J, Liu Y, Tang Y, Zhou Y, Zhong M. Investigation of expressions of PDK1, PLK1 and c‐Myc in diffuse large B‐cell lymphoma. Int J Exp Path 2019;100:32–40. 10.1111/iep.12307
REFERENCE
- 1. Morton LM, Wang SS, Devesa SS, Hartge P, Weisenburger DD, Linet MS. Lymphoma incidence patterns by WHO subtype in the United States, 1992‐2001. Blood. 2006;107:265‐276. [DOI] [PMC free article] [PubMed] [Google Scholar]
- 2. Swerdlow SH, Campo E, Harris NL, Pileri S, Stein H, Jaffe ES. WHO Classification of Tumours of Haematopoietic and Lymphoid Tissues, 4th ed Lyon, France: International Agency for Research on Cancer; 2008:313‐314. [Google Scholar]
- 3. Martelli M, Ferreri AJ, Agostinelli C, Di Rocco A, Pfreundschuh M, Pileri SA. Diffuse large B‐cell lymphoma. Crit Rev Oncol Hematol. 2013;87:146‐171. [DOI] [PubMed] [Google Scholar]
- 4. Ansell SM. Non‐Hodgkin lymphoma: diagnosis and treatment. Mayo Clin Proc. 2015;90:1152‐1163. [DOI] [PubMed] [Google Scholar]
- 5. Ninan MJ, Wadhwa PD, Gupta P. Prognostication of diffuse large B‐cell lymphoma in the rituximab era. Leuk Lymphoma. 2011;52:360‐373. [DOI] [PubMed] [Google Scholar]
- 6. Kubuschok B, Held G, Pfreundschuh M. Management of diffuse large B‐cell lymphoma (DLBCL). Cancer Treat Res. 2015;165:271‐288. [DOI] [PubMed] [Google Scholar]
- 7. Tan J, Li Z, Lee PL, et al. PDK1 signaling toward PLK1–MYC activation confers oncogenic transformation, tumor‐initiating cell activation, and resistance to mTOR‐targeted therapy. Cancer Discov. 2013;3:1156‐1171. [DOI] [PubMed] [Google Scholar]
- 8. Tamguney T, Zhang C, Fiedler D, Shokat K, Stokoe D. Analysis of 3‐phosphoinositide‐dependent kinase‐1 signaling and function in ES cells. Exp Cell Res. 2008;314:2299‐2312. [DOI] [PMC free article] [PubMed] [Google Scholar]
- 9. Calleja V, Alcor D, Laguerre M, et al. Intramolecular and intermolecular interactions of protein kinase B define its activation in vivo. PLoS Biol. 2007;5:e95. [DOI] [PMC free article] [PubMed] [Google Scholar]
- 10. Riojas RA, Kikani CK, Wang C, et al. Fine tuning PDK1 activity by phosphorylation at Ser163. J Biol Chem. 2006;281:21588‐21593. [DOI] [PubMed] [Google Scholar]
- 11. Arsenic R. Immunohistochemical analysis of PDK1 expression in breast cancer. Diagn Pathol. 2014;9:82. [DOI] [PMC free article] [PubMed] [Google Scholar]
- 12. Lu CW, Lin SC, Chien CW, et al. Overexpression of pyruvate dehydrogenase kinase 3 increases drug resistance and early recurrence in colon cancer. Am J Pathol. 2011;179:1405‐1414. [DOI] [PMC free article] [PubMed] [Google Scholar]
- 13. Galgano MT, Conaway M, Spencer AM, Paschal BM, Frierson HF Jr. PRK1 distribution in normal tissues and carcinomas: overexpression and activation in ovarian serous carcinoma. Hum Pathol. 2009;40:1434‐1440. [DOI] [PMC free article] [PubMed] [Google Scholar]
- 14. Watanabe N, Sekine T, Takagi M, et al. Deficiency in chromosome congression by the inhibition of Plk1 polo box domain‐dependent recognition. J Biol Chem. 2009;284:2344‐2353. [DOI] [PubMed] [Google Scholar]
- 15. Lee KS, Oh DY, Kang YH, Park JE. Self‐regulated mechanism of Plk1 localization to kinetochores: lessons from the Plk1‐PBIP1 interaction. Cell Div. 2008;3:4. [DOI] [PMC free article] [PubMed] [Google Scholar]
- 16. Barr FA, Sillje HH, Nigg EA. Polo‐like kinases and the orchestration of cell division. Nat Rev Mol Cell Biol. 2004;5:429‐440. [DOI] [PubMed] [Google Scholar]
- 17. Song B, Liu XS, Davis K, Liu X. Plk1 phosphorylation of Orc2 promotes DNA replication under conditions of stress. Mol Cell Biol. 2011;31:4844‐4856. [DOI] [PMC free article] [PubMed] [Google Scholar]
- 18. Liu XS, Song B, Liu X. The substrates of Plk1, beyond the functions in mitosis. Protein Cell. 2010;1:999‐1010. [DOI] [PMC free article] [PubMed] [Google Scholar]
- 19. Lens SM, Voest EE, Medema RH. Shared and separate functions of polo‐like kinases and aurora kinases in cancer. Nat Rev Cancer. 2010;10:825‐841. [DOI] [PubMed] [Google Scholar]
- 20. Cholewa BD, Liu X, Ahmad N. The role of polo‐like kinase 1 in carcinogenesis: cause or consequence? Cancer Res. 2013;73:6848‐6855. [DOI] [PMC free article] [PubMed] [Google Scholar]
- 21. Takai N, Hamanaka R, Yoshimatsu J, Miyakawa I. Polo‐like kinases (Plks) and cancer. Oncogene. 2005;24:287‐291. [DOI] [PubMed] [Google Scholar]
- 22. Strebhardt K, Ullrich A. Targeting polo‐like kinase 1 for cancer therapy. Nat Rev Cancer. 2006;6:321‐330. [DOI] [PubMed] [Google Scholar]
- 23. de Oliveira JC, Brassesco MS, Pezuk JA, et al. In vitro PLK1 inhibition by BI 2536 decreases proliferation and induces cell‐cycle arrest in melanoma cells. J Drugs Dermatol. 2012;11:587‐592. [PubMed] [Google Scholar]
- 24. Liu L, Zhang M, Zou P. Expression of PLK1 and survivin in diffuse large B‐cell lymphoma. Leuk Lymphoma. 2007;48:2179‐2183. [DOI] [PubMed] [Google Scholar]
- 25. Shi JQ, Lasky K, Shinde V, et al. MLN0905, a small‐molecule plk1 inhibitor, induces antitumor responses in human models of diffuse large B‐cell lymphoma. Mol Cancer Ther. 2012;11:2045‐2053. [DOI] [PubMed] [Google Scholar]
- 26. Meyer N, Penn LZ. Reflecting on 25 years with MYC. Nat Rev Cancer. 2008;8:976‐990. [DOI] [PubMed] [Google Scholar]
- 27. Hofmann JW, Zhao X, De Cecco M, et al. Reduced expression of MYC increases longevity and enhances healthspan. Cell. 2015;160:477‐488. [DOI] [PMC free article] [PubMed] [Google Scholar]
- 28. Carroll PA, Diolaiti D, McFerrin L, et al. Deregulated Myc requires MondoA/Mlx for metabolic reprogramming and tumorigenesis. Cancer Cell. 2015;27:271‐285. [DOI] [PMC free article] [PubMed] [Google Scholar]
- 29. Conacci‐Sorrell M, McFerrin L, Eisenman RN. An overview of MYC and its interactome. Cold Spring Harb Perspect Med. 2014;4:a014357. [DOI] [PMC free article] [PubMed] [Google Scholar]
- 30. Song ZB, Gao SS, Yi XN, et al. Expression of MUCI in esophageal squamous‐cell carcinoma and its relationship with prognosis of patients from Linzhou city, a high incidence area of northern China. World J Gastroenterol. 2003;9:404. [DOI] [PMC free article] [PubMed] [Google Scholar]
- 31. Kawamoto K, Miyoshi H, Yoshida N, et al. MYC translocation and/or BCL 2 protein expression are associated with poor prognosis in diffuse large B‐cell lymphoma. Cancer Sci. 2016;107(6):853‐861. [DOI] [PMC free article] [PubMed] [Google Scholar]
- 32. Wu H, Zhu L, Zhang H, et al. Coexpression of EGFR and CXCR4 predicts poor prognosis in resected pancreatic ductal adenocarcinoma. PLoS ONE. 2015;10:e0116803. [DOI] [PMC free article] [PubMed] [Google Scholar]
- 33. Li J, Chen P, Liu W, Xia Z, Shi F, Zhong M. Expression and significance of Ku80 and PDGFR‐α in nasal NK/T‐cell lymphoma. Pathol Res Pract. 2016;212:204‐209. [DOI] [PubMed] [Google Scholar]
- 34. Jiang J, Liu Y, Tang Y, et al. ALDH1A1 induces resistance to CHOP in diffuse large B‐cell lymphoma through activation of the JAK2/STAT3 pathway. Onco Targets Ther. 2016;9:5349‐5360. [DOI] [PMC free article] [PubMed] [Google Scholar]
- 35. Green TM, Young KH, Visco C, et al. Immunohistochemical double‐hit score is a strong predictor of outcome in patients with diffuse large B‐cell lymphoma treated with rituximab plus cyclophosphamide, doxorubicin, vincristine, and prednisone. J Clin Oncol. 2012;30:3460‐3467. [DOI] [PubMed] [Google Scholar]
- 36. Di Blasio L, Gagliardi PA, Puliafito A, Primo L. Serine/Threonine kinase 3‐phosphoinositide‐dependent protein kinase‐1 (PDK1) as a key regulator of cell migration and cancer dissemination. Cancers (Basel). 2017;9:E25. [DOI] [PMC free article] [PubMed] [Google Scholar]
- 37. Pearce LR, Komander D, Alessi DR. The nuts and bolts of AGC protein kinases. Nat Rev Mol Cell Biol. 2010;11:9‐22. [DOI] [PubMed] [Google Scholar]
- 38. Martini M, De Santis MC, Braccini L, Gulluni F, Hirsch E. PI3K/AKT signaling pathway and cancer: an updated review. Ann Med. 2014;46:372‐383. [DOI] [PubMed] [Google Scholar]
- 39. Lohneis P, Darb‐Esfahani S, Dietel M, Gulluni F, Hirsch E. PDK1 is expressed in ovarian serous carcinoma and correlates with improved survival in high‐grade tumors. Anticancer Res. 2015;35:6329‐6334. [PubMed] [Google Scholar]
- 40. Bai X, Li P, Xie Y, et al. Overexpression of 3‐phosphoinositide‐dependent protein kinase‐1 is associated with prognosis of gastric carcinoma. Tumour Biol. 2016;37:2333‐2339. [DOI] [PubMed] [Google Scholar]
- 41. Tut TG, Lim SH, Dissanayake IU, et al. Upregulated polo‐like kinase 1 expression correlates with inferior survival outcomes in rectal cancer. PLoS ONE. 2015;10:e0129313. [DOI] [PMC free article] [PubMed] [Google Scholar]
- 42. Green AR, Aleskandarany MA, Agarwal D, et al. MYC functions are specific in biological subtypes of breast cancer and confers resistance to endocrine therapy in luminal tumours. Br J Cancer. 2016;114:917‐928. [DOI] [PMC free article] [PubMed] [Google Scholar]