

Abstract
Background
Muscle atrophy and weakness are adverse effects of high dose or the sustained usage of glucocorticoids. Loss of mitochondria and degradation of protein are highly correlated with muscle dysfunction. The deacetylase sirtuin 1 (SIRT1) plays a vital role in muscle remodelling. The current study was designed to identify myricanol as a SIRT1 activator, which could protect skeletal muscle against dexamethasone‐induced wasting.
Methods
The dexamethasone‐induced atrophy in C2C12 myotubes was evaluated by expression of myosin heavy chain, muscle atrophy F‐box (atrogin‐1), and muscle ring finger 1 (MuRF1), using western blots. The mitochondrial content and oxygen consumption were assessed by MitoTracker staining and extracellular flux analysis, respectively. Muscle dysfunction was established in male C57BL/6 mice (8–10 weeks old, n = 6) treated with a relatively high dose of dexamethasone (25 mg/kg body weight, i.p., 10 days). Body weight, grip strength, forced swimming capacity, muscle weight, and muscle histology were assessed. The expression of proteolysis‐related, autophagy‐related, apoptosis‐related, and mitochondria‐related proteins was analysed by western blots or immunoprecipitation.
Results
Myricanol (10 μM) was found to rescue dexamethasone‐induced muscle atrophy and dysfunction in C2C12 myotubes, indicated by increased expression of myosin heavy chain (0.33 ± 0.14 vs. 0.89 ± 0.21, *P < 0.05), decreased expression of atrogin‐1 (2.31 ± 0.67 vs. 1.53 ± 0.25, *P < 0.05) and MuRF1 (1.55 ± 0.08 vs. 0.99 ± 0.12, **P < 0.01), and elevated ATP production (3.83 ± 0.46 vs. 5.84 ± 0.79 nM/mg protein, **P < 0.01), mitochondrial content (68.12 ± 10.07% vs. 116.38 ± 5.12%, *P < 0.05), and mitochondrial oxygen consumption (166.59 ± 22.89 vs. 223.77 ± 22.59 pmol/min, **P < 0.01). Myricanol directly binds and activates SIRT1, with binding energy of −5.87 kcal/mol. Through activating SIRT1 deacetylation, myricanol inhibits forkhead box O 3a transcriptional activity to reduce protein degradation, induces autophagy to enhance degraded protein clearance, and increases peroxisome proliferator‐activated receptor γ coactivator‐1α activity to promote mitochondrial biogenesis. In dexamethasone‐induced muscle wasting C57BL/6 mice, 5 mg/kg myricanol treatment reduces the loss of muscle mass; the percentages of quadriceps and gastrocnemius muscle in myricanol‐treated mice are 1.36 ± 0.02% and 0.87 ± 0.08%, respectively (cf. 1.18 ± 0.06% and 0.78 ± 0.05% in dexamethasone‐treated mice, respectively). Myricanol also rescues dexamethasone‐induced muscle weakness, indicated by improved grip strength (70.90 ± 4.59 vs. 120.58 ± 7.93 g, **P < 0.01) and prolonged swimming exhaustive time (48.80 ± 11.43 vs. 83.75 ± 15.19 s, **P < 0.01). Myricanol prevents dexamethasone‐induced muscle atrophy and weakness by activating SIRT1, to reduce muscle protein degradation, enhance autophagy, and promote mitochondrial biogenesis and function in mice.
Conclusions
Myricanol ameliorates dexamethasone‐induced skeletal muscle wasting by activating SIRT1, which might be developed as a therapeutic agent for treatment of muscle atrophy and weakness.
Keywords: Myricanol, SIRT1, Dexamethasone, Muscle atrophy, Autophagy, PGC‐1α
Introduction
Muscle wasting is a debilitating consequence of multiple diseases, such as diabetes, advanced cancer, and renal failure, which contributes to reduced physical performance and quality of life.1, 2 Glucocorticoids (GCs) are widely used as anti‐inflammatory and immunosuppressive agents.3 Skeletal muscle wasting is one of the adverse effects of high dose or the sustained usage of GCs, and it also occurs when the endogenous GCs are increased under stressful conditions, such as sepsis and cachexia.4 The GC‐induced loss of muscle mass is mainly because of decreased protein synthesis and increased protein degradation, which results in reduction of muscle fibre area and density.5, 6 Myofibrillar protein degradation depends on ubiquitin proteasome machinery and autophagy‐lysosome machinery, which plays a major role in the catabolic action of GCs.7 The ubiquitin proteasome system is activated under GCs treatment.8 Two muscle specific ubiquitin E3 ligases, muscle atrophy F‐box (atrogin‐1) and muscle ring finger 1 (MuRF1), are critical determinants of muscle atrophy.9, 10 Inhibition of MuRF1 attenuates muscle atrophy.11 Autophagy is critical to trigger mitochondrial fragmentation in GC‐induced muscle atrophy.12 The inhibitory effect of GC on muscle protein synthesis is considered to result mainly from the inhibition of the mammalian target of rapamycin/S6 kinase 1 pathway.13
The control of mitochondrial content and function seems to be crucial for maintaining muscle function.14 Peroxisome proliferator‐activated receptor γ coactivator 1α (PGC‐1α) is the master regulator of mitochondrial biogenesis.15 Mitochondrial function and biogenesis could be protected through activating PGC‐1α, which undergoes robust down‐regulation in various forms of muscle atrophy, and its overexpression counters the effect of forkhead box O (FoxO) on muscle mass.14 In GC‐induced muscle atrophy model, PGC‐1α overexpression maintains muscle mass by attenuating FoxO3a activity, thereby providing protective effects against atrophy.16 SIRT1 (NAD+‐dependent deacetylase Sirtuin 1) is a key regulator of muscle metabolism; SIRT1 directly deacetylates PGC‐1α and FoxOs to regulate their nuclear translocation and activity.17 Activation of SIRT1 by resveratrol increases mitochondrial biogenesis in skeletal muscle and prevents dexamethasone (DEX)‐induced muscle atrophy.18, 19 Thus, SIRT1 is a potential therapeutic target for treatment of muscle dysfunction.
Chinese bayberry, Myrica rubra (Lour.) Sieb. et Zucc (Myricaceae), has been cultivated in southern China for more than 2000 years, and its flavonoid constituents, such as quercetin, dihydromyricetin, myricetin, and their glycosides, are well recognized for their nutritional and medicinal values. Research evidences have shown that Chinese bayberry possesses regulatory effects on muscle function. Quercetin and myricetin are the major flavonols from Chinese bayberry. Quercetin prevents muscle atrophy by targeting mitochondria in denervated mice model.20 Myricetin enhances mitochondrial activity by activating PGC‐1α and SIRT1, to improve physical endurance in mice.21 Dihydromyricetin, a dihydroflavonol isolated from Chinese bayberry, has a wide variety of bioactivities, including anti‐inflammatory, antioxidative, and anti‐tumorigenic effects. A recent study showed dihydromyricetin ameliorates D‐galactose‐induced atrophy of skeletal muscle through AMP‐activated protein kinase (AMPK)/SIRT1/PGC‐1α signalling cascade.22 Myricanol (MY, Figure 1A), a diarylheptanoid isolated from the barks of M. rubra, 23 possesses anti‐inflammatory,24 anti‐cancer,25 and anti‐neurodegenerative properties.26 In addition, MY promotes autophagic tau clearance in HEK293T cells.27 Herein, the role of MY in protecting against DEX‐induced muscle dysfunction is evaluated in C2C12 myotubes in vitro and C57BL/6 mice in vivo, and the underlying mechanisms are further elucidated.
Figure 1.
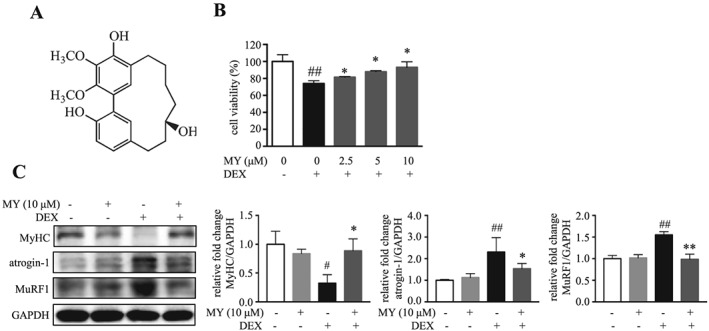
MY rescues DEX‐induced muscle atrophy in C2C12 myotubes. (A) Chemical structure of MY. (B) Cell viability of C2C12 myotubes treated with DEX and different concentrations of MY. (C) Expression levels of MyHC, atrogin‐1, and MuRF1. GAPDH was used as a loading control. Data are shown as mean ± SD, n = 6–9. *P < 0.05, **P < 0.01, MY vs. DEX. # P < 0.05, ## P < 0.01, control vs. DEX. DEX, dexamethasone; MuRF1, muscle ring finger 1; MY, myricanol; MyHC, myosin heavy chain.
Materials and methods
Reagents and antibodies
Myricanol (purity ≥98%) was isolated from the barks of M. rubra as described previously.23 EX‐527 was purchased from Selleck Chemicals (Houston, TX). All the compounds were dissolved in DMSO. Phosphate buffered saline (PBS) powder, Dulbecco's modified eagle medium (DMEM), penicillin–streptomycin (P/S, 10 000 U/mL of penicillin and 10 000 μg/mL of streptomycin), foetal bovine serum and horse serum were purchased from Life Technologies (Grand Island, NY). All other chemicals (analytical grade) unless specified were obtained from Sigma‐Aldrich (St. Louis, MO). Protein A/G agarose was purchased from Santa Cruz Biotechnology (Santa Cruz, CA). The primary antibody against myosin heavy chain (MyHC) was supplied by R&D Systems (Minneapolis, MN). All other primary and secondary antibodies were purchased from Cell Signaling Technology (Danvers, MA) or Santa Cruz Biotechnology (Table S1).
C2C12 cell culture and differentiation
Mouse C2C12 myoblasts were obtained from ATCC and maintained in DMEM with 10% foetal bovine serum and 1% P/S. To initiate differentiation, the cells were grown to 70–80% confluence and incubated with DMEM containing 2% heat‐inactivated horse serum and 1% P/S for 4 days. Medium was refreshed every other day. The fully differentiated myotubes were treated with 10 μM DEX, with or without different concentrations of MY and 20 μM EX‐527 as indicated, for 24 h. DMSO was used as a vehicle control. In the cell‐based assays, the final DMSO concentration was less than 0.1%. On the basis of previous report, Ex‐527 occupies the nicotinamide site and a neighbouring pocket and contacts the ribose of NAD+ or of the coproduct 2′‐O‐acetyl‐ADP ribose, thus inhibiting SIRT1 catalytic activity.28
Cell viability
Cell viability was determined by MTT [3‐(4,5‐dimethylthiazol‐2‐yl)‐2,5‐diphenyltetrazolium bromide] assay as described previously.29 C2C12 cells were seeded in 96‐well plates at a density of 1 × 10⁴ cells per well. After fully differentiated, the myotubes were treated with different concentrations of MY, with or without 10 μM DEX, for 24 h. Then, cell viability was determined by incubation with DMEM containing MTT (1 mg/mL) for 4 h, followed by dissolving the formazan crystals with DMSO. The absorbance at 570 nm was measured by a SpectraMax M5 microplate reader (Molecular Devices, CA). The calculation equation for relative cell viability was as follows: cell viability (%) = (As − A0)/(Ac − A0) × 100%, where As, A0, and Ac were the absorptions of test sample, background, and control (DMSO), respectively.
Western blot analysis
Myotubes or skeletal muscle samples were lysed with cold RIPA buffer (Beyotime Biotechnology, Shanghai, China) containing freshly added phosphatase inhibitor cocktails and phenylmethane sulfonylfluoride on ice for 30 min. Whole cell lysates were centrifuged at 17 400 g for 20 min, and the supernatants were transferred into new tubes. Protein concentration of each sample was quantified using a BCA protein assay kit (Life Technologies, Grand Island, NY). The same amount of proteins (30 μg) were separated by 8% or 12% SDS‐PAGE, transferred to PVDF membranes (Bio‐Rad, Hercules, CA), blocked with 5% nonfat milk in TBST buffer (100 mM NaCl, 10 mM Tris–HCl, pH 7.5, and 0.1% Tween‐20) for 1 h at room temperature, and incubated with specific primary antibody overnight at 4 °C. After washing with TBST thrice, a horseradish peroxidase conjugated secondary antibody was added and incubated for 2 h at room temperature. Signals were developed using a SuperSignal West Femto Maximum Sensitivity Substrate kit (Thermo, Rockford, IL). Then, specific protein bands were visualized using the ChemiDoc MP Imaging System (Bio‐Rad). Intensity of individual bands in western blots was quantitated using Image Lab 5.1 (Bio‐Rad) and expressed relative to reference protein signal, as a measure of protein relative abundance in the different samples. The relative abundance of DEX‐treated, MY‐treated, or EX‐527‐treated groups was then normalized by that of the vehicle control group.
Molecular docking study
Crystal structure of SIRT1 used in this study was obtained from Brookhaven Protein Data Bank. The PDB entry is 4ZZH.30 Python Molecular Viewer (PMV version 1.5.6)31 was used to deal with both the ligand and receptor. Whole structure of SIRT was edited including deleting water molecule and the two ligands including 4TO and ZN. Hydrogens were added using AutoDockTools31, 32 integrated in PMV. MY structure downloaded from ChemSpider database was treated as ligand. For the ligand, Gasteiger charges were assigned with nonpolar hydrogens merged. The atom types and bond types were assigned and hydrogens were added using AutoDockTools that integrated in PMV (version 1.5.6). The docking area was defined by a 120 × 120 × 120 Å3 3D grid centred around the ligand binding site with a 0.375 Å grid space. The grid maps were generated using the auxiliary program autogrid4 package. All bond rotations for the receptor was ignored, and the Lamarckian genetic algorithm was employed for docking process.
Immunoprecipitation
To examine the acetylated levels of PGC‐1α and FoxO3a, the immunoprecipitation (IP)/western blot analyses were performed as described previously.29, 33 The detailed procedure was described as follows: protein A/G agarose beads were washed with RIPA lysis buffer thrice prior to IP. Primary antibody was incubated with protein A/G agarose beads at 4 °C for 1 h with gently mixing. Then, the cell lysate was incubated with antibody‐beads mixture at 4 °C under rotary agitation overnight. The immune complex was washed by RIPA lysis buffer thrice and boiled in protein loading buffer for 5 min at 95 °C. Finally, the immunoprecipitate was analysed by western blot.
MitoTracker Green and LysoTracker Red staining
C2C12 cells were seeded with 1.0 × 10⁵ cells per well in six‐well plates. After fully differentiation, myotubes were treated with 10 μM DEX, with or without different concentrations of MY, for 24 h. Living cells were directly stained with MitoTracker Green or LysoTracker Red probes (Beyotime Biotechnology) following the manufacturer's instructions. Fluorescent images were captured with a Leica TCS SP8 Confocal Laser Scanning Microscope System (Buffalo Grove, IL).
Determination of ATP content
Cellular ATP content was measured using an ATP content kit following the manufacture's instruction (Beyotime Biotechnology). ATP contents were measured with a luminometer (SpectraMax M5). ATP level was further normalized by protein content.
Sirtuin1 deacetylase activity
SIRT1 deacetylase activity was quantified using the fluorometric SIRT1 assay kit (Sigma‐Aldrich) according to the manufacturer's instructions. Fluorescence intensity was monitored at an excitation wavelength of 355 nm and an emission wavelength of 450 nm, using a SpectraMax M5 microplate reader, and normalized by the amount of protein. The SIRT1 deacetylase activity of MY‐treated cells was represented as fold of the vehicle control group.
Seahorse analysis
A Seahorse Bioscience XF24‐3 Extracellular Flux Analyzer (Agilent, Santa Clara, CA) was used to measure the oxygen consumption rate (OCR) and extracellular acidification rate (ECAR). C2C12 myoblasts were seeded in XF24‐well microplates (Seahorse Bioscience, Billerica, MA) at 5 × 10⁴ cells per well. The cells were induced to fully differentiation and treated with compounds as indicated. Then, the cells were incubated in the absence of CO2 for 1 h. XF assay medium was low‐buffered bicarbonate‐free DMEM (pH 7.4) and replicated the glucose and pyruvate/glutamax composition of the respective experimental conditions. After measuring basal OCR and ECAR, 1 μM oligomycin and 1 μM carbonyl cyanide‐p trifluoromethoxyphenylhydrazone were introduced in real time. After detection, cellular protein content was quantitated with a BCA kit, and OCR and ECAR were normalized accordingly.
Dexamethasone‐induced muscle atrophy mice model
All animal experiments were approved by the Animal Ethical and Welfare Committee of University of Macau (No. ICMS‐AEC‐2015‐07). All procedures involved in the animal experiments were carried out in accordance with the approved guidelines and regulations. Male C57BL/6 mice (8–10 weeks old) were obtained from the Faculty of Health Science, University of Macau (Macau, China). The mice were housed at 22 ± 1 °C with 12 h light–dark cycles and fed with a regular chow diet (Guangdong Medical Lab Animal Center, Guangzhou, Guangdong, China) and water ad libitum under standard conditions (specific‐pathogen‐free) with air filtration. Forty‐two C57BL/6 mice were randomly divided into seven groups (n = 6). The mice in control group (ctrl) were administrated with PEG 400 solution (10 mL/kg body weight, 30% in 0.9% saline). The other six groups of mice were administrated with the same volume of PEG 400 solution with high dosage of MY (ctrl + MY‐50, 50 mg/kg MY), DEX solution (DEX, 25 mg/kg dexamethasone, dissolved in PEG 400 solution), DEX solution with low dosage of MY (DEX + MY‐5, 5 mg/kg MY), DEX solution with high dosage of MY (DEX + MY‐50, 50 mg/kg MY), DEX solution with EX‐527 (DEX + EX‐527, 10 mg/kg EX‐527), and DEX solution with high dosage of MY and EX‐527 (DEX + MY‐50 + EX‐527, 50 mg/kg MY, and 10 mg/kg EX‐527), respectively. The mice were intraperitoneally injected once a day for 10 days. Body weight was recorded daily. Grip strength of each mouse was recorded thrice every other day using the grip strength test metre for mice and rats (Yiyan Science and Technology Development Co. Ltd, Zhejiang, China). Twenty‐four hours after the last injection, blood samples were collected and sera were aliquoted and stored at −80 °C. Quadriceps, gastrocnemius (Gast), soleus, tibialis anterior (TA), and extensor digitorum longus (EDL), as well as liver, were dissected. The tissue samples were quickly weighed by an analytical balance (MS205DU, Mettler Toledo, Switzerland, sensitivity 0.01 mg) and frozen in liquid nitrogen. The atrophy rate was calculated by the ratio of muscle weight to body weight.
Forced swimming test
The mice in all the groups were subjected to the forced swimming test 30 min after the last administration. The test was carried out as previously described, with some modification.34 In brief, the mice were placed in an acrylic plastic pool (50 × 40 × 50 cm) filled with fresh water (25 ± 1 °C) to a depth of 30 cm. Exhaustion was defined as loss of coordinated movements and failure to rise to the surface within 7 s, and the swimming time was recorded.
Histological analysis of skeletal muscle
A middle part of Gast, TA, and EDL muscle samples was fixed in 4% paraformaldehyde overnight and then embedded into paraffin; 4 μm sections were cut and used for H&E staining, following the standard staining procedures. The muscle fibre cross‐sectional diameter was estimated by CellSens image analysis system (Olympus, Tokyo, Japan). Using a microscope (20× objective, Olympus, Tokyo, Japan), a total of 20 views were randomly selected from each slide that contains muscle cut in cross section. The diameter of all the muscle fibre in each view was automatically calculated by the CellSens image analysis system. The muscle fibre diameter of each group was expressed as the percentage of that of the control group.
Statistical analysis
All data were expressed as mean ± SD and analysed by Graphpad Prism 6 (GraphPad Software, San Diego, CA). One‐way analysis of variance was used for statistical comparison, Dunnett's test was used for pairwise comparison, and P‐values less than 0.05 were considered statistically significant.
Results
Myricanol protects C2C12 myotubes against dexamethasone‐induced atrophy
In searching for small molecules protecting muscle against DEX‐induced atrophy, a series of diarylheptanoids from the barks of M. rubra were assessed on C2C12 myotubes. Among them, MY was the only one that concentration‐dependently prevented DEX‐induced cell death (Figure 1B). Twenty‐four hours treatment of MY alone did not show apparent cytotoxicity on C2C12 myotubes (with an IC50 value of 104.12 ± 2.66 μM, Figure S1). Next, western blot results indicated that 10 μM DEX treatment caused around 67.4% loss of MyHC expression, whereas treatment of 10 μM MY clearly minimized the loss of MyHC expression (Figure 1C). As expected, DEX treatment robustly increased the expression of atrogin‐1 and MuRF1 (Figure 1C). MY treatment completely abrogated DEX‐induced increase of atrogin‐1 and MuRF1 expression (Figure 1C). Thus, MY protected C2C12 myotubes against DEX‐induced atrophy.
Myricanol protects C2C12 myotubes against dexamethasone‐induced atrophy through activating sirtuin 1
SIRT1 plays a critical role in muscle remodelling35; 10 μM DEX treatment reduced SIRT1 level in C2C12 myotubes; interestingly, MY rescued SIRT1 level in a concentration‐dependent manner (Figure 2A). MY failed to change SIRT1 expression in normal C2C12 myotubes at the concentration of 10 μM (Figure 2A). To verify whether MY directly binds SIRT1, virtual docking analysis was conducted. A total of 10 different conformations of the complex were generated from the software. After ranking the conformations by Gibbs free energy, the first rank was regarded as the optimal docking result and was selected for downstream analysis. The binding energy of the complex was −5.87 kcal/mol, and the inhibitory constant Ki was 49.41 μM. The interactive sites were composed of Ile359, Ile360, Gln361, Gly364, Ser365, Ala367, Thr368, Glu410, and Pro419. Hydrogen bond was formed between MY and Gln361, as shown in Figure 2B. Furthermore, the fluorometric SIRT1 assay was performed on lysate from MY‐treated cells to verify whether MY affected SIRT1 deacetylase activity. As a result, DEX suppressed SIRT1 deacetylase activity; MY dose‐dependently increased SIRT1 deacetylase activity in DEX‐treated myotubes (Figure 2C). Thus, MY directly bound and activated SIRT1 in DEX‐treated myotubes.
Figure 2.
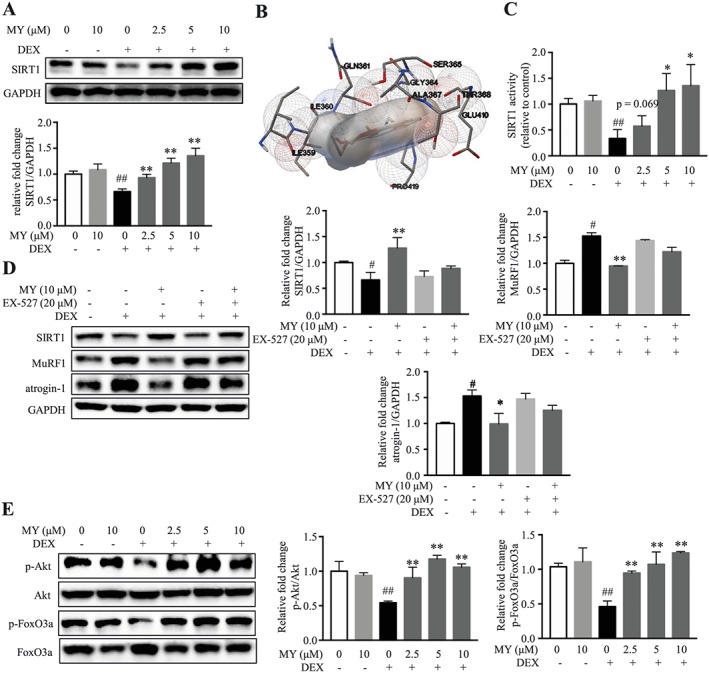
MY protects against DEX‐induced muscle atrophy through activating SIRT1. (A) MY increased SIRT1 expression dose‐dependently in DEX‐treated C2C12 myotubes. (B) Interactive sites between MY and SIRT1 by docking analysis. (C) MY enhanced SIRT1 deacetylase activity in C2C12 myotubes. (D) EX‐527 almost reversed MY‐induced changes of SIRT1, MuRF1, and atrogin‐1 expression in DEX‐treated myotubes. (E) MY increased phosphorylation of Akt and FoxO3a in DEX‐treated C2C12 myotubes. GAPDH was used as a loading control. Data are shown as mean ± SD, n = 6–9. *P < 0.05, **P < 0.01, MY or EX‐527 vs. DEX. ## P < 0.01, control vs. DEX. DEX, dexamethasone; MY, myricanol; SIRT1, sirtuin 1.
To verify whether the protective effect of MY against DEX‐induced myotube atrophy is mediated through activating SIRT1, C2C12 myotubes were treated with a SIRT1 specific inhibitor, EX‐527, together with MY. When co‐treated with EX‐527, the changes of SIRT1, atrogin‐1, and MuRF1 expression in MY‐treated myotubes were almost abolished (Figure 2D). The deacetylase SIRT1 rescues muscle atrophy by blocking the activation of Akt and FoxO3a.35 As expected, DEX decreased the phosphorylated levels of Akt and FoxO3a, which was totally reversed by MY treatment (Figure 2E). Therefore, MY mitigated DEX‐induced muscle atrophy in C2C12 myotubes via the SIRT1‐Akt‐FoxO3a axis.
Myricanol enhances mitochondrial biogenesis and function in dexamethasone‐treated C2C12 myotubes
Dexamethasone‐induced muscle atrophy is accompanied with mitochondrial loss and dysfunction. The MitoTracker green staining showed DEX caused an obvious decrease of mitochondrial content; and MY treatment elevated mitochondrial content in a concentration‐dependent manner, which was almost abolished by co‐treatment of EX‐527 (Figure 3A). Moreover, MY concentration‐dependently stimulated the ATP production (Figure 3B) and elevated the expression of mitochondrial markers, including Tom20, Cox2, and uncoupling protein 3 (UCP3, Figure 3C) in DEX‐treated C2C12 myotubes. DEX treatment remarkably decreased the expression of PGC‐1α, and MY treatment reversed the change (Figure 3C). PGC‐1α is one of the deacetylating substrates of SIRT1, and the deacetylated PGC‐1α is the biologically activated form.36 The IP results showed that MY treatment reversed DEX‐induced increase of the acetylated PGC‐1α level (Figure 3D). As expected, co‐treatment of EX‐527 almost blocked the effect of MY on total and acetylated PGC‐1α expression (Figure 3D). FoxO3a is involved in the transcriptional regulation of atrogin‐1 and MuRF1.37 SIRT1 directly deacetylates FoxO3a. As shown in Figure 3E, MY completely reversed DEX‐induced increase of total and acetylated FoxO3a levels; while co‐treatment of EX‐527 attenuated the effect of MY. To further assess the role of MY in regulating mitochondrial function, the cellular OCR was analysed using the Seahorse XF Extracellular Flux Analyzer. MY remarkably reversed DEX‐induced suppression of OCR, indicated by a higher maximum respiration level, but did not affect ECAR (Figure 3F). Therefore, MY enhanced mitochondrial content and function in DEX‐treated C2C12 myotubes through SIRT1‐PGC‐1α‐FoxO3a pathway.
Figure 3.
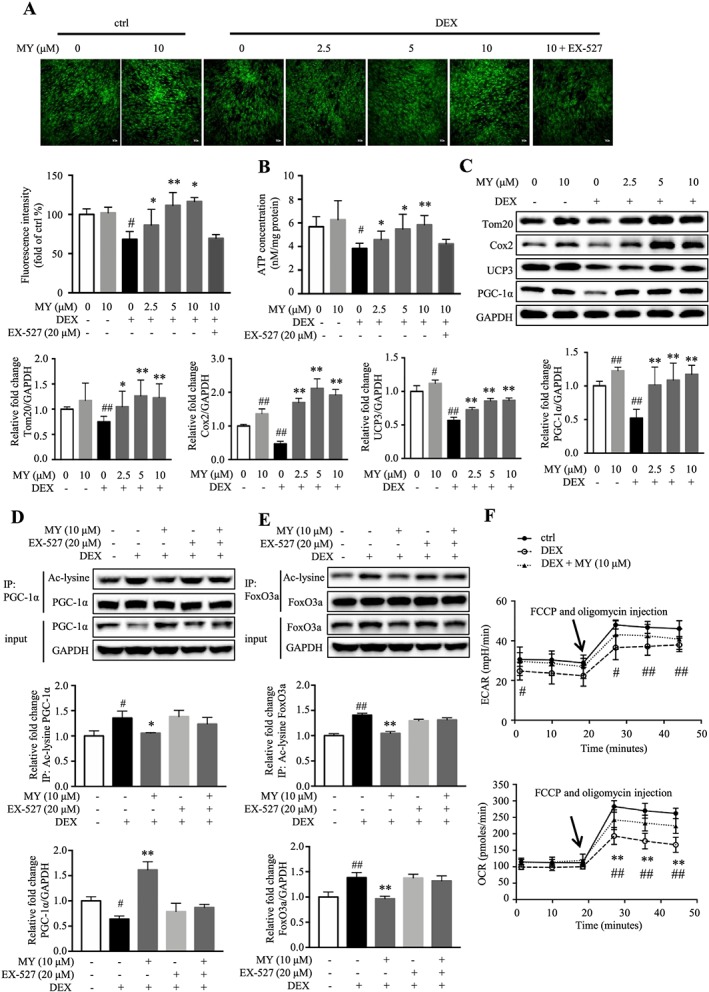
MY reverses DEX‐induced loss of mitochondrial content and function in C2C12 myotubes. (A) MY increased mitochondrial content in DEX‐treated C2C12 myotubes, as assessed by MitoTracker Green staining. Scale bar = 100 μm. The images were captured using a Leica TCS SP8 Confocal Laser Scanning Microscope System with a 10× objective. (B) The effect of MY on ATP concentration in DEX‐treated C2C12 myotubes. (C) MY increased the expression levels of Cox2, Tom20, UCP3, and PGC‐1α. GAPDH was used as a loading control. (D) MY reversed DEX‐induced decrease of PGC‐1α expression and increase of acetylated PGC‐1α level, which were abolished by co‐treatment of EX‐527. (E) MY reversed DEX‐induced increases of total and acetylated FoxO3a levels, which were abolished by co‐treatment of EX‐527. (F) MY increased OCR in DEX‐treated C2C12 myotubes, as assessed by Seahorse assay. Data are shown as mean ± SD, n = 6–9. *P < 0.05, **P < 0.01, MY vs. DEX. # P < 0.05, ## P < 0.01, control vs. DEX or EX‐527. DEX, dexamethasone; MY, myricanol; OCR, oxygen consumption rate; UCP3, uncoupling protein 3.
Myricanol balances apoptosis and autophagy in dexamethasone‐treated C2C12 myotubes
Autophagy plays a critical role to remove damaged organelles and degraded protein in skeletal muscle; and autophagy flux is important to preserve muscle mass and to maintain myofiber integrity. Apoptotic and autophagic signalling pathways have been implicated in skeletal muscle atrophy, and the impairment of autophagy is associated with an accumulation of cell damage and cell death.5, 6 To determine the role of MY in the regulation of autophagy, the expression levels of autophagy‐related proteins, including microtubule‐associated protein light chain 3 (LC3), Beclin1, and p62, were evaluated. Compared with the control group, DEX treatment suppressed autophagy, indicated by reduced LC3‐II/LC3‐I ratio and Beclin1 expression, and elevated p62 expression (Figure 4A). MY concentration‐dependently activated autophagy in DEX‐treated C2C12 myotubes but did not affect autophagy in normal cells (Figure 4A). Additionally, the lysotracker staining results suggested that MY reversed DEX‐induced reduction of lysosomes in C2C12 cells, whereas co‐treatment of EX‐527 abolished the effect of MY (Figure 4B). Thus, MY enhanced autophagy‐lysosomal activity in DEX‐treated C2C12 myotubes.
Figure 4.
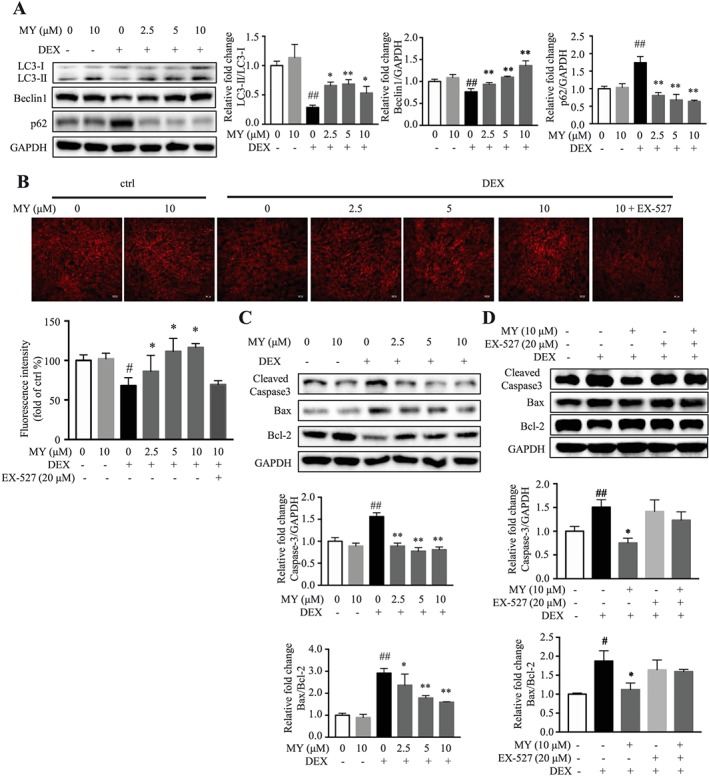
Effects of MY on apoptosis and autophagy in DEX‐treated C2C12 myotubes. (A) MY elevated the expression of autophagy‐related proteins LC3 and Beclin1 and suppressed the expression of p62. (B) MY increased lysosome content in DEX‐treated C2C12 myotubes, as assessed by LysoTracker fluorescence staining. Scale bar = 100 μm. The images were captured using a Leica TCS SP8 Confocal Laser Scanning Microscope System with a 10× objective. (C) Expression of apoptosis‐associated proteins, Bcl‐2, Bax, cleaved caspase‐3. GAPDH was used as a loading control. (D) Co‐treatment of EX‐527 abolished the effect of MY on expression of apoptosis‐associated proteins. Data are shown as mean ± SD, n = 6–9. *P < 0.05, **P < 0.01, MY or EX‐527 vs. DEX. ## P < 0.01, control vs. DEX. DEX, dexamethasone; MY, myricanol.
Impaired autophagy is associated with the aggregation of proteins, eventually leading to cell degeneration. In the present study, the expression of Bcl‐2‐associated X protein (Bax) and the cleaved caspase‐3 was remarkably increased, and the expression of B‐cell lymphoma 2 (Bcl‐2) was decreased in DEX‐treated C2C12 myotubes; and MY almost reversed the earlier observation (Figure 4C). As expected, co‐treatment of EX‐527 almost abolished the effect of MY in apoptosis (Figure 4D). Overall, MY ameliorated DEX‐induced apoptosis on C2C12 myotubes through the corresponding activation of autophagy to adjust cellular homeostasis.
Myricanol protects mice against dexamethasone‐induced muscle dysfunction
To further verify the effect of MY in ameliorating muscle atrophy, a relatively high dose of DEX (25 mg/kg body weight, i.p., 10 days)‐induced muscle atrophy mouse model was generated. The loss of body weight in DEX group was observed 2 days after injection, and either high or low dosage of MY treatment markedly reduced DEX‐induced decrease of body weight (Figure 5A). The grip strength test indicated that DEX decreased the muscle strength 2 days after injection, which was completely reversed by MY treatment, either low or high dosage (Figure 5B). Furthermore, the forced swimming test showed that MY markedly prolonged swimming exhaustive time in DEX‐treated mice (Figure 5C). However, co‐treatment of EX‐527 abolished the protective effects of MY on body weight, muscle strength, and forced swimming capacity in DEX‐treated mice (Figure 5A and C). Next, the muscles on hind legs were dissected and weighed. DEX treatment apparently reduced muscle index, especially for Gast and quadriceps, but did not affect liver index (Figure 5D and E, Figure S2), whereas MY treatment markedly reduced the loss of muscle mass in DEX‐treated mice (Figure 5D and E, Figure S2). The H&E staining of Gast, TA, and EDL muscle was performed to better characterize the protective effect of MY against muscle atrophy. The cross‐sectional diameter of muscle fibre in DEX‐treated mice was remarkably smaller than that from the control group (Figure 5F and G, Figure S3). Meanwhile, MY treatment prevented DEX‐induced reduction of the cross‐sectional diameter of muscle fibre (Figure 5F and G, Figure S3). As expected, EX‐527 treatment blocked the protective effect of MY against muscle atrophy (Figure 5D and G, Figures S2 and S3). Overall, MY executed the preventive function against DEX‐induced muscle atrophy and weakness.
Figure 5.
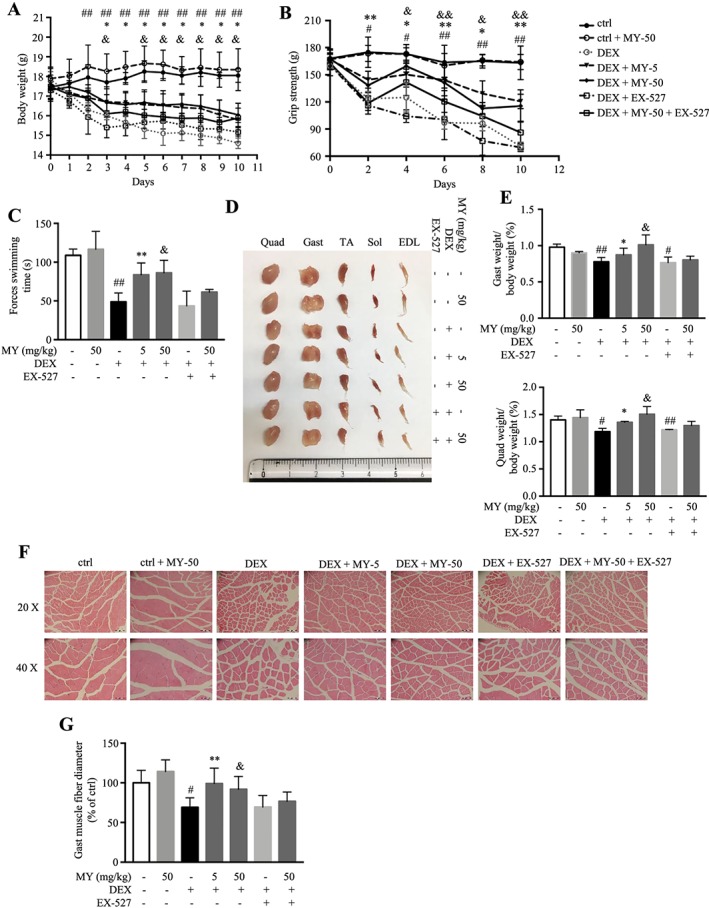
MY protects against DEX‐induced muscle dysfunction in mice. (A) Body weight. [two‐way ANOVA: time effect F (10, 180) = 60.98, P < 0.0001; treatment effect F (6, 18) = 11.96, P < 0.0001; interaction F (60, 180) = 11.26, P < 0.0001]. (B) Grip strength. [two‐way ANOVA: time effect F (5, 140) = 81.00, P < 0.0001; treatment effect F (7, 28) = 152.00, P < 0.0001; interaction F (35, 140) = 6.40, P < 0.0001]. (C) Forced swimming time. (D) Comparison of representative samples of dissected skeletal muscle, including Gast, soleus, EDL, Quad, and TA. (E) The ratios of Gast and Quad muscle weight to body weight. (F) Representative H&E staining of myofiber cross section of Gast. Scale bar = 100 or 50 μm on top and bottom, respectively. A microscope with a 10× or 20× objective was used to capture the images. (G) The cross‐sectional diameter of Gast muscle fibre. Ctrl: PEG 400 solution; ctrl + MY‐50: PEG 400 solution with 50 mg/kg MY; DEX: PEG 400 solution with 25 mg/kg dexamethasone; DEX + MY‐5: DEX solution with 5 mg/kg MY; DEX + MY‐50: DEX solution with 50 mg/kg MY; DEX + EX‐527: DEX solution with 10 mg/kg EX‐527; DEX + MY‐50 + EX‐527: DEX solution with 50 mg/kg MY and 10 mg/kg EX‐527. Data are shown as mean ± SD, n = 6. *P < 0.05, **P < 0.01, DEX + MY‐5 vs. DEX. & P < 0.05, && P < 0.01, DEX + MY‐50 vs. DEX. # P < 0.05, ## P < 0.01, control vs. DEX. ANOVA, analysis of variance; DEX, dexamethasone; EDL, extensor digitorum longus; Gast, gastrocnemius; MY, myricanol; Quad, quadriceps; TA, tibialis anterior.
Glucocorticoid‐induced muscle atrophy is characterized by apparent loss of fast‐twitch type II glycolytic muscle fibre with reduced or no impact on type I fibres.38 Gast muscle consists of about 6%, 8%, 22%, and 60% for types I, IIa, IIx, and IIb fibres, respectively.39 Thus, we chose Gast muscle in the following studies. As shown in Figure 6A, the expression of SIRT1 and the phosphorylated levels of Akt and FoxO3a were remarkably decreased in Gast muscle from DEX‐treated mice, resulting in elevated atrogin‐1 and MuRF1 expression; while MY treatment totally reversed the earlier changes, in either low dose and high dose group. MY also induced autophagy in Gast muscle from DEX‐treated mice, indicated by higher LC3‐II/LC‐3I ratio and expression of Beclin1 and lower p62 expression (Figure 6B). Moreover, MY suppressed the level of cleaved caspase‐3 and reduced Bax/Bcl‐2 ratio, thereby inhibiting apoptosis (Figure 6B). MY also enhanced the expression levels of Tom20, UCP3, and Cox2 in Gast muscle from DEX‐treated mice by increasing PGC‐1α expression (Figure 6C). Co‐treatment of EX‐527 with MY almost hindered the earlier changes (Figure 6A and C). Taken together, MY protected the mice against DEX‐induced muscle atrophy through reducing muscle protein degradation, enhancing autophagy, and promoting mitochondrial biogenesis and function.
Figure 6.
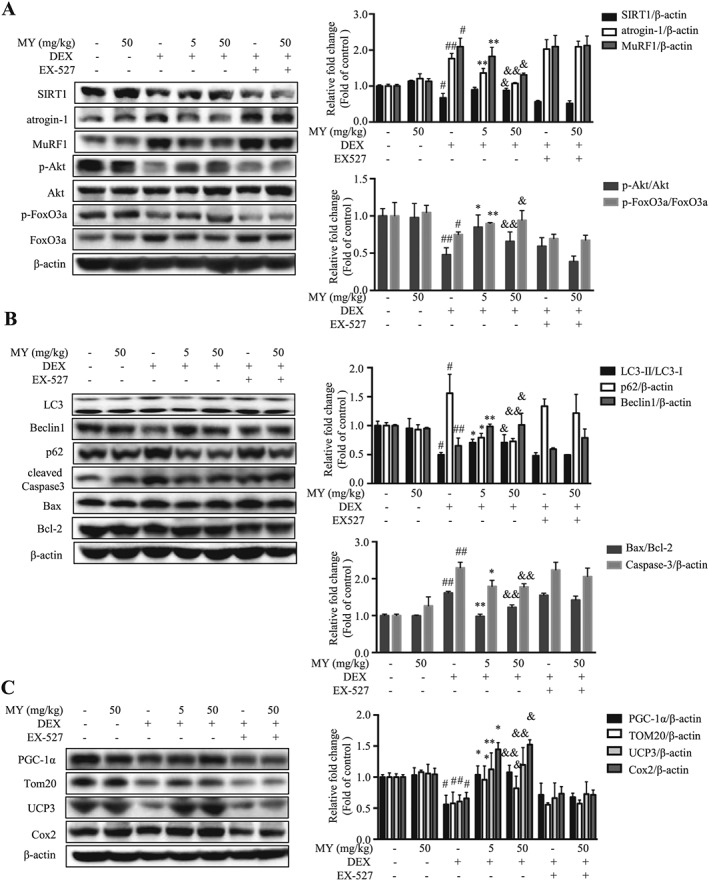
Western blotting analysis of key proteins in Gast muscle. (A) The expression of SIRT1, atrogin‐1, MuRF1, phosphorylated Akt, total Akt, phosphorylated FoxO3a, and total FoxO3a. (B) The expression of LC3, Beclin1, p62, cleaved caspase‐3, Bcl‐2, and Bax. (C) The expression of PGC‐1α, Tom20, UCP3, and Cox2. β‐actin was used as a loading control. Data are shown as mean ± SD, n = 6. *P < 0.05, **P < 0.01, DEX + MY‐5 vs. DEX. & P < 0.05, && P < 0.01, DEX + MY‐50 vs. DEX. # P < 0.05, ## P < 0.01, control vs. DEX. DEX, dexamethasone; MuRF1, muscle ring finger 1; MY, myricanol; SIRT1, sirtuin 1; UCP3, uncoupling protein 3.
Discussion
Muscle atrophy is a devastating symptom that frequently occurs in sepsis and cachexia, as well as other chronic diseases. Although escalating evidences have been disclosed to unveil the molecular mechanisms of muscle wasting, only few treatments, including specific growth factors and anabolic steroids, are available in clinical practice for cachexia and wasting conditions.40 Recombinant growth hormone was approved by the US Food and Drug Administration for muscle wasting treatment in acquired immune deficiency syndrome, parenteral nutrition‐dependent short bowel syndrome, and so forth. However, its side effects, including insulin resistance, sodium retention, and peripheral oedema, are unavoidable.40 Megestrol acetate improves cancer cachexia‐induced cardiomyopathy by regulating autophagy,41 which has long been approved for cancer‐associated and acquired immune deficiency syndrome‐associated cachexia. Side effects of megestrol acetate include thromboembolism at high dosage, transient adrenal insufficiency, and central nervous system effects.40 Thus, more effective therapies with less side effects against muscle atrophy are urgently needed. Several molecules have been reported with potent protective effects against muscle atrophy on different models, such as the androgen receptor modulators42, 43 and ursolic acid.44 Herein, MY was identified to ameliorate DEX‐induced muscle dysfunction in vitro and in vivo; thus, it could be a candidate for the treatment of muscle atrophy and weakness.
Sirtuin 1 is highly involved in regulating skeletal muscle remodelling, which directly deacetylates and activates PGC‐1α to regulate mitochondrial biogenesis,45 modulates FoxOs transcriptional activity to control loss of muscle mass and function,35 and affects MyoD and myogenic factor 2 to inhibit myogenesis.46 Therefore, activation of SIRT1 is a potential therapeutic approach to prevent and/or rescue muscle dysfunctional wasting. Several compounds, including resveratrol, ampelopsin, and quercetin, act as SIRT1 activators in treating muscle atrophy. Resveratrol inhibits DEX‐induced muscle wasting through up‐regulating UCP3 in a SIRT1‐dependent mechanism.19 Quercetin increases the expression of the mitochondrial biogenesis markers, including PGC‐1α, cytochrome c, and SIRT1, in skeletal muscle.47 Ampelopsin activates autophagy via stimulating SIRT1/AMPK/PGC‐1α signalling cascade during muscle aging process.22 In molecular docking screening, MY was predicted to bind the activating site of SIRT1 with high affinity, sharing the similar binding pattern with other SIRT1 activators.30 Furthermore, MY enhances the deacetylase activity of SIRT1. Thus, MY is identified as a novel SIRT1 activator.
In the ubiquitin proteasome pathway, the FoxO transcription factors are dephosphorylated and/or acetylated to induce nuclear translocation, which in turn enhances the expression of two E3 ubiquitin ligases, MuRF1 and atrogin‐1, and causes muscle atrophy.48, 49 In the current study, MY treatment reverses DEX‐induced dephosphorylation and acetylation of FoxO3a and increases of atrogin‐1 and MuRF1 expression. Consistently, a recent study showed a high dose of DEX decreases the phosphorylation of FoxO3a.7 Collectively, our data suggest MY may activate SIRT1 to increase FoxO3a phosphorylation and decrease FoxO3a acetylation, which, in turn, potentially prevents the nuclear translocation of FoxO3a and suppresses the expression of atrogin‐1 and MuRF1.
Mitochondrial dysfunction is the key factor in the aetiology of muscle atrophy induced by disuse and diseases.50 Mitochondrial biogenesis is regulated by PGC‐1α and PGC‐1β.50 PGC‐1 orchestrates the genetic program that allows skeletal muscle adaptation to meet the energetic demands driven by environmental stress, nutrient availability, or increased muscle activity. PGC‐1α directly interacts with the nuclear respiratory factor 1 and modulates its target, mitochondrial transcription factor A, to translocate to the mitochondria and activate mitochondrial DNA replication, resulting in mitochondrial biogenesis.51 MY increases PGC‐1α expression and decreases the acetylated PGC‐1α level to enhance its activity. AMPK directly phosphorylates PGC‐1α at Thr177 and Ser538 to enable SIRT1 deacetylation.52 Actually, our data showed that MY activates AMPK in C2C12 myotubes ( Figure S4). Thus, MY might protect myotubes against DEX‐induced mitochondrial decreases through AMPK‐SIRT1‐PGC‐1α axis. Meanwhile, MY acts as an enhancer of mitochondrial function and remarkably reverses the DEX‐induced reduction of OCR in myotubes. Moreover, MY reverses DEX‐induced muscle weakness in mice, as assessed by grip strength test and forced swimming test. Taken together, MY can benefit muscle function through activating SIRT1.
Inadequate or defective autophagy can contribute to skeletal muscle atrophy during various disease states.53 Skeletal muscle‐specific knockout of Atg7 induces skeletal muscle atrophy and myopathy in rodents.54 The equilibrium of skeletal muscle autophagy is important for maintaining muscle mass and function. SIRT1‐AMPK pathway plays a vital role in regulating autophagy. It has been reported that two SIRT1 activators, resveratrol and SRTAW04, mediate oxidative stress‐induced autophagy, indicating that SIRT1 and activation of autophagy form an essential protective mechanism for cell survival.55 Resveratrol, a SIRT1 activator, elevates the expression of Beclin‐1 and LC3 and inhibits the expression of apoptotic proteins.56 Previous evidence also suggested that MY induces autophagic clearance of tau to reduce the formation of neurofibrillary tangles.27 Notably, AMPK activator, such as AICAR (5‐aminoimidazole‐4‐carboxamide ribonucleotide), has been reported to clean the damaged mitochondria through activating autophagy, resulting in improved dystrophic phenotype in diaphragm atrophy.57 Interestingly, MY increased the phosphorylated AMPK level in C2C12 myotubes, and co‐treatment of compound C (CC), the AMPK inhibitor, abolished the effect of MY ( Figure S4). Collectively, our data suggested that, regardless of mechanism, MY increases SIRT1 expression and activates AMPK in myotubes, which in turn induces autophagy. Caspases are also involved in muscle protein degradation. Caspase‐3 is a key regulator for the initial step of muscle protein loss under catabolic conditions.58 Herein, the protective role of MY against DEX‐induced muscle atrophy was proved to be mediated through apoptotic and autophagic signalling pathways.
Symptomatic steroid myopathy, which involves proximal muscle weakness and eventual wasting, occurs in approximately 10% of patients, and the incidence is increased in elderly patients and after prolonged use of high‐dose corticosteroids. Muscle atrophy can develop in as little as 2–3 weeks in patients taking 16 mg of DEX daily. Myopathy is reversible upon discontinuation of the steroid, usually in a few days to several months. Peripheral muscle weakness has been also observed in patients with Cushing's syndrome who exhibit high levels of endogenous GCs.59 Administration of high dose GCs to animals causes not only decreased muscle mass but also muscle dysfunction characterized by reduced force and weakness.60 Although the mechanism of GCs action has been described, not all the molecular aspects are clear. It is important to note that different dosages and treatment periods of DEX could cause opposite effects.60 Recently, biphasic effects of DEX on cell viability and autophagy were reported, indicating that a high dose of DEX (>1 μM) accelerates cell apoptosis, whereas a low dose of DEX (<0.01 μM) increases cell viability. Furthermore, increased autophagy was observed in cells treated with DEX less than 0.01 μM for 6 h. In contrast, higher concentration of DEX did not cause autophagy.61 Our data also supported that low dosage of DEX activated AMPK and induced autophagy, whereas high dosage of DEX inactivated AMPK and suppressed autophagy in C2C12 myotubes ( Figure S5). High dose of DEX‐induced atrophy may have substantial clinical implications. Currently, high dosage of DEX was used to induce muscle atrophy in both C2C12 myotubes in vitro and C57BL/6 mice in vivo.
Conclusions
Taken together, MY possesses protective effect against DEX‐induced skeletal muscle dysfunction, via reducing atrogene expression, promoting mitochondrial biogenesis, and enhancing muscle function. Moreover, MY reduces DEX‐induced muscle dysfunction through various aspects of SIRT1 signalling (summarized in Figure 7). Thus, our in vitro and in vivo data suggest that MY could potentially counteract DEX‐induced muscle atrophy in humans, but more research is needed to test this hypothesis.
Figure 7.
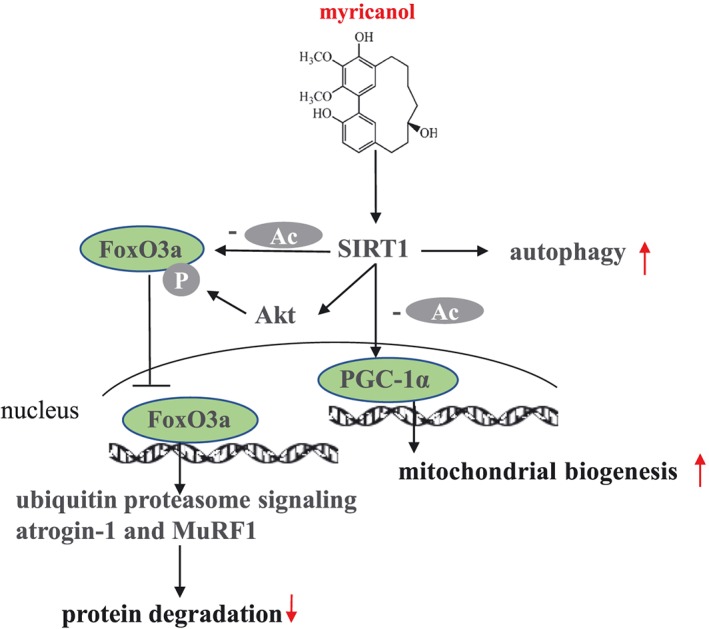
Schematic models of molecular targets of MY in DEX‐induced muscle atrophy. DEX, dexamethasone; MY, myricanol.
Conflict of interest
The authors declare that there are no conflicts of interest.
Funding
Financial support by Science and Technology Development Fund, Macao S.A.R (FDCT 102/2017/A), National Natural Science Foundation of China (81872754), and the Research Fund of University of Macau (MYRG2017‐00109‐ICMS and MYRG2018‐00037‐ICMS) are gratefully acknowledged.
Author contribution statement
S.S., Q.L., and J.L. conducted research and analysed data. S.S. and L.L. designed the experiments and wrote the paper; R.P. and S.L. consulted for the study and proofread the paper. L.L. conceived the study.
Supporting information
Data S1 Supporting information
Table S1 Antibodies for immunoblotting
Figure S1 Cytotoxicity of MY on C2C12 myotubes. Data are shown as mean ± SD, n = 6.
Figure S2 The ratios of liver, TA, EDL and soleus muscle to body weight. Data are shown as mean ± SD, n = 6.
Figure S3 Representative H&E staining of myofiber cross section of TA (A) and EDL (B). Scale bar = 100 or 50 μm on top and bottom, respectively. A microscope with a 10× or 20× objective was used to capture the images. The cross‐sectional diameter of TA (C) and EDL (D) muscle fibre. Ctrl: PEG 400 solution; ctrl + MY‐50: PEG 400 solution with 50 mg/Kg MY; DEX: PEG 400 solution with 25 mg/Kg dexamethasone; DEX + MY‐5: DEX solution with 5 mg/Kg MY; DEX + MY‐50: DEX solution with 50 mg/Kg MY; DEX + EX‐527: DEX solution with 10 mg/Kg EX‐527; DEX + MY‐50 + EX‐527: DEX solution with 50 mg/Kg MY and 10 mg/Kg EX‐527. Data are shown as mean ± SD, n = 6. ** P < 0.01, DEX + MY‐5 vs. DEX. & P < 0.05, DEX + MY‐50 vs. DEX. ## P < 0.01, control vs. DEX.
Figure S4 MY increased AMPK phosphorylation in C2C12 myotubes, and Compound C (CC, the AMPK inhibitor, 10 μM) almost abolished the effect of MY. AICAR (the AMPK activator) was used as a positive control. Data are shown as mean ± SD, n = 6. * P < 0.05, ** P < 0.01, MY or AICAR vs. control.
Figure S5 The expression of p‐AMPK, AMPK, p62, Beclin1, LC3 in C2C12 myotubes treated with different concentrations of DEX for 24 hours. GAPDH was used as a loading control. Data are shown as mean ± SD, n = 6. # P < 0.05, ## P < 0.01, ctrl vs. DEX.
Acknowledgement
The authors certify that they comply with the ethical guidelines for authorship and publishing of the Journal of Cachexia, Sarcopenia, and Muscle.62
Shen, S. , Liao, Q. , Liu, J. , Pan, R. , Lee, S. M.‐Y. , and Lin, L. (2019) Myricanol rescues dexamethasone‐induced muscle dysfunction via a sirtuin 1‐dependent mechanism. Journal of Cachexia, Sarcopenia and Muscle, 10: 429–444. 10.1002/jcsm.12393.
References
- 1. Bowen TS, Schuler G, Adams V. Skeletal muscle wasting in cachexia and sarcopenia: molecular pathophysiology and impact of exercise training. J Cachexia Sarcopenia Muscle 2015;6:197–207. [DOI] [PMC free article] [PubMed] [Google Scholar]
- 2. Gielen E, O'Neill TW, Pve SR, Adams JE, Wu FC, Laurent MR, et al. Endocrine determinants of incident sarcopenia in middle‐aged and elderly European men. J Cachexia Sarcopenia Muscle 2015;6:242–252. [DOI] [PMC free article] [PubMed] [Google Scholar]
- 3. Rhen T, Cidlowski JA. Antiinflammatory action of glucocorticoids—new mechanisms for old drugs. N Engl J Med 2005;353:1711–1723. [DOI] [PubMed] [Google Scholar]
- 4. Braun TP, Marks DL. The regulation of muscle mass by endogenous glucocorticoids. Front Physiol 2015;6:12. [DOI] [PMC free article] [PubMed] [Google Scholar]
- 5. Fanzani A, Conraads VM, Penna F, Martinet W. Molecular and cellular mechanisms of skeletal muscle atrophy: an update. J Cachexia Sarcopenia Muscle 2012;3:163–179. [DOI] [PMC free article] [PubMed] [Google Scholar]
- 6. Drescher C, Konishi M, Ebner N, Springer J. Loss of muscle mass: current developments in cachexia and sarcopenia focused on biomarkers and treatment. J Cachexia Sarcopenia Muscle 2015;6:303–311. [DOI] [PMC free article] [PubMed] [Google Scholar]
- 7. Cid‐Diaz T, Santos‐Zas I, Gonzalez‐Sanchez J, Gurriaran‐Rodriguez U, Mosteiro CS, Casabiell X, et al. Obestatin controls the ubiquitin‐proteasome and autophagy‐lysosome systems in glucocorticoid‐induced muscle cell atrophy. J Cachexia Sarcopenia Muscle 2017;8:974–990. [DOI] [PMC free article] [PubMed] [Google Scholar]
- 8. Altun M, Besche HC, Overkleeft HS, Piccirillo R, Edelmann MJ, Kessler BM, et al. Muscle wasting in aged, sarcopenic rats is associated with enhanced activity of the ubiquitin proteasome pathway. J Biol Chem 2010;285:39597–39608. [DOI] [PMC free article] [PubMed] [Google Scholar]
- 9. Bodine SC, Latres E, Baumhueter S, Lai VK‐M, Nunez L, Clarke BA, et al. Identification of ubiquitin ligases required for skeletal muscle atrophy. Science 2001;294:1704–1708. [DOI] [PubMed] [Google Scholar]
- 10. Clarke BA, Drujan D, Willis MS, Murphy LO, Corpina RA, Burova E, et al. The E3 Ligase MuRF1 degrades myosin heavy chain protein in dexamethasone‐treated skeletal muscle. Cell Metab 2007;6:376–385. [DOI] [PubMed] [Google Scholar]
- 11. Bowen TS, Adams V, Werner S, Fischer T, Vinke P, Brogger MN, et al. Small‐molecule inhibition of MuRF1 attenuates skeletal muscle atrophy and dysfunction in cardiac cachexia. J Cachexia Sarcopenia Muscle 2017;8:939–953. [DOI] [PMC free article] [PubMed] [Google Scholar]
- 12. Troncoso R, Paredes F, Parra V, Gatica D, Vasquez‐Trincado C, Quiroga C, et al. Dexamethasone‐induced autophagy mediates muscle atrophy through mitochondrial clearance. Cell Cycle 2014;13:2281–2295. [DOI] [PMC free article] [PubMed] [Google Scholar]
- 13. Wang HM, Kubica N, Ellisen LW, Jefferson LS, Kimball SR. Dexamethasone represses signaling through the mammalian target of rapamycin in muscle cells by enhancing expression of REDD1. J Biol Chem 2006;281:39128–39134. [DOI] [PubMed] [Google Scholar]
- 14. Sandri M, Lin J, Handschin C, Yang W, Arany ZP, Lecker SH, et al. PGC‐1α protects skeletal muscle from atrophy by suppressing FoxO3 action and atrophy‐specific gene transcription. Proc Natl Acad Sci U S A 2006;103:16260–16265. [DOI] [PMC free article] [PubMed] [Google Scholar]
- 15. Jager S, Handschin C, St‐Pierre J, Spiegelman BM. AMP‐activated protein kinase (AMPK) action in skeletal muscle via direct phosphorylation of PGC‐1α. Proc Natl Acad Sci U S A 2007;104:12017–12022. [DOI] [PMC free article] [PubMed] [Google Scholar]
- 16. Rahnert JA, Zheng B, Hudson MB, Woodworth‐Hobbs ME, Price SR. Glucocorticoids alter CRTC‐CREB signaling in muscle cells: impact on PGC‐1α expression and atrophy markers. PLoS One 2016;11:e0159181. [DOI] [PMC free article] [PubMed] [Google Scholar]
- 17. Pardo PS, Boriek AM. The physiological roles of Sirt1 in skeletal muscle. Aging 2011;3:430–437. [DOI] [PMC free article] [PubMed] [Google Scholar]
- 18. Lagouge M, Argmann C, Gerhart‐Hines Z, Meziane H, Lerin C, Daussin F, et al. Resveratrol improves mitochondrial function and protects against metabolic disease by activating SIRT1 and PGC‐1α. Cell 2006;127:1109–1122. [DOI] [PubMed] [Google Scholar]
- 19. Alamdari N, Aversa Z, Castillero E, Gurav A, Petkova V, Tizio S, et al. Resveratrol prevents dexamethasone‐induced expression of the muscle atrophy‐related ubiquitin ligases atrogin‐1 and MuRF1 in cultured myotubes through a SIRT1‐dependent mechanism. Biochem Biophys Res Commun 2012;417:528–533. [DOI] [PMC free article] [PubMed] [Google Scholar]
- 20. Mukai R, Matsui N, Fujikura Y, Matsumoto N, Hou DX, Kanzaki N, et al. Preventive effect of dietary quercetin on disuse muscle atrophy by targeting mitochondria in denervated mice. J Nutr Biochem 2016;31:67–76. [DOI] [PubMed] [Google Scholar]
- 21. Jung HY, Lee D, Ryu HG, Choi B‐H, Go Y, Lee N, et al. Myricetin improves endurance capacity and mitochondrial density by activating SIRT1 and PGC‐1α. Sci Rep 2017;7:6237. [DOI] [PMC free article] [PubMed] [Google Scholar]
- 22. Kou X, Li J, Liu X, Yang X, Fan J, Chen N. Ampelopsin attenuates the atrophy of skeletal muscle from d‐gal‐induced aging rats through activating AMPK/SIRT1/PGC‐1α signaling cascade. Biomed Pharmacother 2017;90:311–320. [DOI] [PubMed] [Google Scholar]
- 23. Shen S, Xia F, Li H, Liu Y, Pan R. A new cyclic diarylheptanoid from the bark of Myrica rubra . Acta Pharm Sin 2015;50:746–748. [PubMed] [Google Scholar]
- 24. Tao J, Morikawa T, Toguchida I, Ando S, Matsuda H, Yoshikawa M. Inhibitors of nitric oxide production from the bark of Myrica rubra: structures of new biphenyl type diarylheptanoid glycosides and taraxerane type triterpene. Bioorg Med Chem 2002;10:4005–4012. [DOI] [PubMed] [Google Scholar]
- 25. Dai GH, Meng GM, Tong YL, Chen X, Ren ZM, Wang K, et al. Growth‐inhibiting and apoptosis‐inducing activities of myricanol from the bark of Myrica rubra in human lung adenocarcinoma A549 cells. Phytomedicine 2014;21:1490–1496. [DOI] [PubMed] [Google Scholar]
- 26. Jones JR, Lebar MD, Jinwal UK, Abisambra JF, Koren J 3rd, Blair L, et al. The diarylheptanoid (+)‐aR,11S‐myricanol and two flavones from bayberry (Myrica cerifera) destabilize the microtubule‐associated protein tau. J Nat Prod 2011;74:38–44. [DOI] [PMC free article] [PubMed] [Google Scholar]
- 27. Martin MD, Calcul L, Smith C, Jinwal UK, Fontaine SN, Darling A, et al. Synthesis, stereochemical analysis, and derivatization of myricanol provide new probes that promote autophagic tau clearance. ACS Chem Biol 2015;10:1099–1109. [DOI] [PMC free article] [PubMed] [Google Scholar]
- 28. Gertz M, Fischer F, Nguyen GT, Lakshminarasimhan M, Schutkowski M, Weyand M, et al. Ex‐527 inhibits Sirtuins by exploiting their unique NAD+‐dependent deacetylation mechanism. Proc Natl Acad Sci U S A 2013;110:E2772–E2781. [DOI] [PMC free article] [PubMed] [Google Scholar]
- 29. Li D, Liu QY, Sun W, Chen XP, Wang Y, Sun YX, et al. 1,3,6,7‐Tetrahydroxy‐8‐prenylxanthone ameliorates inflammatory responses resulting from the paracrine interaction of adipocytes and macrophages. Br J Pharmacol 2018;175:1590–1606. [DOI] [PMC free article] [PubMed] [Google Scholar]
- 30. Dai H, Case AW, Riera TV, Considine T, Lee JE, Hamuro Y, et al. Crystallographic structure of a small molecule SIRT1 activator‐enzyme complex. Nat Commun 2015;6:7645. [DOI] [PMC free article] [PubMed] [Google Scholar]
- 31. Sanner MF. Python: a programming language for software integration and development. J Mol Graph Model 1999;17:57–61. [PubMed] [Google Scholar]
- 32. Morris GM, Huey R, Lindstrom W, Sanner MF, Belew RK, Goodsell DS, et al. AutoDock4 and AutoDockTools4: automated docking with selective receptor flexibility. J Comput Chem 2009;30:2785–2791. [DOI] [PMC free article] [PubMed] [Google Scholar]
- 33. Liu JX, Li D, Zhang T, Tong Q, Ye RD, Lin LG. SIRT3 protects hepatocytes from oxidative injury by enhancing ROS scavenging and mitochondrial integrity. Cell Death Dis 2017;8:e3158. [DOI] [PMC free article] [PubMed] [Google Scholar]
- 34. Xia F, Zhong Y, Li M, Chang Q, Liao Y, Liu X, et al. Antioxidant and anti‐fatigue constituents of okra. Nutrients 2015;7:8846–8858. [DOI] [PMC free article] [PubMed] [Google Scholar]
- 35. Lee D, Goldberg AL. SIRT1 protein, by blocking the activities of transcription factors FoxO1 and FoxO3, inhibits muscle atrophy and promotes muscle growth. J Biol Chem 2013;288:30515–30526. [DOI] [PMC free article] [PubMed] [Google Scholar]
- 36. Yuan Y, Cruzat VF, Newsholme P, Cheng J, Chen Y, Lu Y. Regulation of SIRT1 in aging: roles in mitochondrial function and biogenesis. Mech Ageing Dev 2016;155:10–21. [DOI] [PubMed] [Google Scholar]
- 37. Milan G, Romanello V, Pescatore F, Armani A, Paik JH, Frasson L, et al. Regulation of autophagy and the ubiquitin–proteasome system by the FoxO transcriptional network during muscle atrophy. Nat Commun 2015;6:6670. [DOI] [PMC free article] [PubMed] [Google Scholar]
- 38. Wang Y, Pessin JE. Mechanisms for fiber‐type specificity of skeletal muscle atrophy. Curr Opin Clin Nutr Meta Care 2013;16:243–250. [DOI] [PMC free article] [PubMed] [Google Scholar]
- 39. Eng CM, Smallwood LH, Rainiero MP, Lahey M, Ward SR, Lieber RL. Scaling of muscle architecture and fiber types in the rat hindlimb. J Exp Biol 2008;211:2336–2345. [DOI] [PubMed] [Google Scholar]
- 40. Gullett NP, Hebbar G, Ziegler TR. Update on clinical trials of growth factors and anabolic steroids in cachexia and wasting. Am J Clin Nutr 2010;91:1143S–1147S. [DOI] [PMC free article] [PubMed] [Google Scholar]
- 41. Musolino V, Palus S, Tschirner A, Drescher C, Gliozzi M, Carresi C, et al. Megestrol acetate improves cardiac function in a model of cancer cachexia‐induced cardiomyopathy by autophagic modulation. J Cachexia Sarcopenia Muscle 2016;7:555–566. [DOI] [PMC free article] [PubMed] [Google Scholar]
- 42. Thum T, Springer J. Breakthrough in cachexia treatment through a novel selective androgen receptor modulator?! J Cachexia Sarcopenia Muscle 2011;2:121–123. [DOI] [PMC free article] [PubMed] [Google Scholar]
- 43. Wendowski O, Redshaw Z, Mutungi G. Dihydrotestosterone treatment rescues the decline in protein synthesis as a result of sarcopenia in isolated mouse skeletal muscle fibres. J Cachexia Sarcopenia Muscle 2017;8:48–56. [DOI] [PMC free article] [PubMed] [Google Scholar]
- 44. Yu R, Chen JA, Xu J, Cao J, Wang Y, Thomas SS, et al. Suppression of muscle wasting by the plant‐derived compound ursolic acid in a model of chronic kidney disease. J Cachexia Sarcopenia Muscle 2017;8:327–341. [DOI] [PMC free article] [PubMed] [Google Scholar]
- 45. Gurd BJ. Deacetylation of PGC‐1α by SIRT1: importance for skeletal muscle function and exercise‐induced mitochondrial biogenesis. Appl Physiol Nutr Metab 2011;36:589–597. [DOI] [PubMed] [Google Scholar]
- 46. Fulco M, Cen Y, Zhao P, Hoffman EP, McBurney MW, Sauve AA, et al. Glucose restriction inhibits skeletal myoblast differentiation by activating SIRT1 through AMPK‐mediated regulation of Nampt. Dev Cell 2008;14:661–673. [DOI] [PMC free article] [PubMed] [Google Scholar]
- 47. Davis JM, Murphy EA, Carmichael MD, Davis B. Quercetin increases brain and muscle mitochondrial biogenesis and exercise tolerance. Am J Physiol Regul Integr Comp Physiol 2009;296:R1071–R1077. [DOI] [PubMed] [Google Scholar]
- 48. Cho JE, Fournier M, Da X, Lewis MI. Time course expression of Foxo transcription factors in skeletal muscle following corticosteroid administration. J Appl Physiol 2010;108:137–145. [DOI] [PMC free article] [PubMed] [Google Scholar]
- 49. Senf SM, Dodd SL, Judge AR. FOXO signaling is required for disuse muscle atrophy and is directly regulated by Hsp70. Am J Physiol Cell Physiol 2010;298:C38–C45. [DOI] [PMC free article] [PubMed] [Google Scholar]
- 50. Romanello V, Sandri M. Mitochondrial biogenesis and fragmentation as regulators of protein degradation in striated muscles. J Mol Cell Cardiol 2013;55:64–72. [DOI] [PubMed] [Google Scholar]
- 51. Wu Z, Puigserver P, Andersson U, Zhang C, Adelmant G, Mootha V, et al. Mechanisms controlling mitochondrial biogenesis and respiration through the thermogenic coactivator PGC‐1. Cell 1999;98:115–124. [DOI] [PubMed] [Google Scholar]
- 52. Cantó C, Gerhart‐Hines Z, Feige JN, Lagouge M, Noriega L, Milne JC, et al. AMPK regulates energy expenditure by modulating NAD+ metabolism and SIRT1 activity. Nature 2009;458:1056–1060. [DOI] [PMC free article] [PubMed] [Google Scholar]
- 53. Sandri M. Autophagy in skeletal muscle. FEBS Lett 2010;584:1411–1416. [DOI] [PubMed] [Google Scholar]
- 54. Masiero E, Agatea L, Mammucari C, Blaauw B, Loro E, Komatsu M, et al. Autophagy is required to maintain muscle mass. Cell Metab 2009;10:507–515. [DOI] [PubMed] [Google Scholar]
- 55. Ou X, Lee MR, Huang X, Messina‐Graham S, Broxmeyer HE. SIRT1 positively regulates autophagy and mitochondria function in embryonic stem cells under oxidative stress. Stem Cells 2014;32:1183–1194. [DOI] [PMC free article] [PubMed] [Google Scholar]
- 56. Zhao H, Chen S, Gao K, Zhou Z, Wang C, Shen Z, et al. Resveratrol protects against spinal cord injury by activating autophagy and inhibiting apoptosis mediated by the SIRT1/AMPK signaling pathway. Neuroscience 2017;348:241–251. [DOI] [PubMed] [Google Scholar]
- 57. Pauly M, Daussin F, Burelle Y, Li T, Godin R, Fauconnier J, et al. AMPK activation stimulates autophagy and ameliorates muscular dystrophy in the mdx mouse diaphragm. Am J Pathol 2012;181:583–592. [DOI] [PubMed] [Google Scholar]
- 58. Lee SW, Dai G, Hu Z, Wang X, Du J, Mitch WE. Regulation of muscle protein degradation: coordinated control of apoptotic and ubiquitin‐proteasome systems by phosphatidylinositol 3 kinase. J Am Soc Nephrol 2004;15:1537–1545. [DOI] [PubMed] [Google Scholar]
- 59. Decramer M, Lacquet LM, Fagard R, Rogiers P. Corticosteroids contribute to muscle weakness in chronic airflow obstruction. Am J Respir Crit Care Med 1994;150:11–16. [DOI] [PubMed] [Google Scholar]
- 60. Macedo AG, Krug AL, Souza LM, Martuscelli AM, Constantino PB, Zago AS, et al. Time‐course changes of catabolic proteins following muscle atrophy induced by dexamethasone. Steroids 2016;107:30–36. [DOI] [PubMed] [Google Scholar]
- 61. Zhang S, Liu Y, Liang Q. Low‐dose dexamethasone affects osteoblast viability by inducing autophagy via intracellular ROS. Mol Med Rep 2018;17:4307–4316. [DOI] [PMC free article] [PubMed] [Google Scholar]
- 62. von Haehling S, Morley JE, Coats AJS, Anker SD. Ethical guidelines for publishing in the journal of cachexia, sarcopenia and muscle: update 2017. J Cachexia Sarcopenia Muscle 2017;8:1081–1083. [DOI] [PMC free article] [PubMed] [Google Scholar]
Associated Data
This section collects any data citations, data availability statements, or supplementary materials included in this article.
Supplementary Materials
Data S1 Supporting information
Table S1 Antibodies for immunoblotting
Figure S1 Cytotoxicity of MY on C2C12 myotubes. Data are shown as mean ± SD, n = 6.
Figure S2 The ratios of liver, TA, EDL and soleus muscle to body weight. Data are shown as mean ± SD, n = 6.
Figure S3 Representative H&E staining of myofiber cross section of TA (A) and EDL (B). Scale bar = 100 or 50 μm on top and bottom, respectively. A microscope with a 10× or 20× objective was used to capture the images. The cross‐sectional diameter of TA (C) and EDL (D) muscle fibre. Ctrl: PEG 400 solution; ctrl + MY‐50: PEG 400 solution with 50 mg/Kg MY; DEX: PEG 400 solution with 25 mg/Kg dexamethasone; DEX + MY‐5: DEX solution with 5 mg/Kg MY; DEX + MY‐50: DEX solution with 50 mg/Kg MY; DEX + EX‐527: DEX solution with 10 mg/Kg EX‐527; DEX + MY‐50 + EX‐527: DEX solution with 50 mg/Kg MY and 10 mg/Kg EX‐527. Data are shown as mean ± SD, n = 6. ** P < 0.01, DEX + MY‐5 vs. DEX. & P < 0.05, DEX + MY‐50 vs. DEX. ## P < 0.01, control vs. DEX.
Figure S4 MY increased AMPK phosphorylation in C2C12 myotubes, and Compound C (CC, the AMPK inhibitor, 10 μM) almost abolished the effect of MY. AICAR (the AMPK activator) was used as a positive control. Data are shown as mean ± SD, n = 6. * P < 0.05, ** P < 0.01, MY or AICAR vs. control.
Figure S5 The expression of p‐AMPK, AMPK, p62, Beclin1, LC3 in C2C12 myotubes treated with different concentrations of DEX for 24 hours. GAPDH was used as a loading control. Data are shown as mean ± SD, n = 6. # P < 0.05, ## P < 0.01, ctrl vs. DEX.