

Abstract
Background
Excess reactive oxygen species (ROS) and muscle weakness occur in parallel in multiple pathological conditions. However, the causative role of skeletal muscle mitochondrial ROS (mtROS) on neuromuscular junction (NMJ) morphology and function and muscle weakness has not been directly investigated.
Methods
We generated mice lacking skeletal muscle‐specific manganese‐superoxide dismutase (mSod2KO) to increase mtROS using a cre‐Lox approach driven by human skeletal actin. We determined primary functional parameters of skeletal muscle mitochondrial function (respiration, ROS, and calcium retention capacity) using permeabilized muscle fibres and isolated muscle mitochondria. We assessed contractile properties of isolated skeletal muscle using in situ and in vitro preparations and whole lumbrical muscles to elucidate the mechanisms of contractile dysfunction.
Results
The mSod2KO mice, contrary to our prediction, exhibit a 10–15% increase in muscle mass associated with an ~50% increase in central nuclei and ~35% increase in branched fibres (P < 0.05). Despite the increase in muscle mass of gastrocnemius and quadriceps, in situ sciatic nerve‐stimulated isometric maximum‐specific force (N/cm2), force per cross‐sectional area, is impaired by ~60% and associated with increased NMJ fragmentation and size by ~40% (P < 0.05). Intrinsic alterations of components of the contractile machinery show elevated markers of oxidative stress, for example, lipid peroxidation is increased by ~100%, oxidized glutathione is elevated by ~50%, and oxidative modifications of myofibrillar proteins are increased by ~30% (P < 0.05). We also find an approximate 20% decrease in the intracellular calcium transient that is associated with specific force deficit. Excess superoxide generation from the mitochondrial complexes causes a deficiency of succinate dehydrogenase and reduced complex‐II‐mediated respiration and adenosine triphosphate generation rates leading to severe exercise intolerance (~10 min vs. ~2 h in wild type, P < 0.05).
Conclusions
Increased skeletal muscle mtROS is sufficient to elicit NMJ disruption and contractile abnormalities, but not muscle atrophy, suggesting new roles for mitochondrial oxidative stress in maintenance of muscle mass through increased fibre branching.
Keywords: Skeletal muscle, Mitochondria, MnSOD, Reactive oxygen species, Fibre branching, Hyperplasia
Introduction
Oxidative stress, the imbalance between pro‐oxidant generation and antioxidant defence, has been implicated in pathological conditions of skeletal muscle, including sarcopenia,1, 2, 3 denervation,4, 5 and cancer cachexia.6 Excess levels of reactive oxygen species (ROS) impair contractile function of skeletal muscle7 and activate proteases that are associated with degradation of contractile machinery.2, 8 A primary source of oxidative stress is superoxide anions generated from a number of cellular sources, including the mitochondrial electron transport chain (ETC) and nicotinamide adenine dinucleotide phosphate (NADPH) oxidase. Superoxide can be converted to other radical and non‐radical species including hydroxyl radicals, peroxynitate, and hydrogen peroxide. Because superoxide and its derivatives can generate oxidative damage to cellular lipids, proteins, and DNA, controlling superoxide levels is a first and primary line of defence against oxidative stress and damage. Superoxide is primarily scavenged by copper zinc‐superoxide dismutase (CuZnSOD) in the cytosol, and manganese‐superoxide dismutase (MnSOD) in the mitochondrial matrix.
Our laboratory and others have provided insights into potential mechanisms of skeletal muscle weakness associated with oxidative stress during aging (i.e. sarcopenia) using mice lacking CuZnSOD (Sod1KO), the cytoplasmic superoxide scavenger.1, 9, 10 Sod1KO mice reveal a number of phenotypes that mimic features of sarcopenia in old wild‐type (WT) mice, including loss of innervation, mitochondrial dysfunction, and increased generation of mitochondrial ROS (mtROS).2, 11, 12, 13 We have also shown that loss of innervation is associated with increased mtROS and downstream activation of muscle atrophy and weakness.4, 11, 14 In this study, we asked whether increased skeletal muscle mtROS induced by skeletal muscle‐specific deletion of the mitochondrial form of SOD (MnSOD), independent of loss of innervation, is sufficient to induce muscle atrophy and weakness.
Previous studies have shown that global deletion of the Sod2 gene (Sod2 −/−) leads to neonatal lethality supporting the importance of controlling superoxide levels.15, 16 We demonstrated that heterozygous deletion of MnSOD (Sod2 +/−) does not affect survival but leads to mitochondrial dysfunction.17 Muscle mass is not altered in heterozygous MnSOD knockout mice; however, skeletal muscle mitochondrial adenosine triphosphate (ATP) production is reduced, and hydrogen peroxide generation is significantly increased in skeletal muscle.18 Using a model of Sod2 deficiency targeted specifically to fast twitch (type IIB) skeletal muscle fibres, we reported an increase in ROS generation and oxidative modifications in fast twitch fibres that was not associated with skeletal muscle atrophy or contractile dysfunction in young and old mice.19, 20 The impact of skeletal muscle‐specific Sod2 deletion on exercise intolerance has also been reported,21 but its role on neuromuscular junction (NMJ) disruption and skeletal muscle mass and contractile properties have not been directly tested.
Here, we tested whether mitochondrial oxidative stress within skeletal muscle, in the absence of neuronal oxidative stress and denervation, contributes to muscle atrophy and weakness using a mouse model in which MnSOD (Sod2) is deleted specifically in skeletal muscle using a cre‐Lox approach driven by human skeletal actin (HSA). Contrary to our expectation, mSod2KO mice exhibit a significant increase in muscle mass associated with dramatic increases in central nuclei, hyperplasia, and fibre branching. Despite the increase in muscle mass, contractile function is impaired because of NMJ fragmentation and intrinsic alterations within myofibers, presumably elicited by excess hydrogen peroxide in cytoplasm. Excess superoxide in mitochondrial matrix induces a dramatic loss of succinate dehydrogenase (SDH) and severe functional defects of the mitochondria. Our findings demonstrate, for the first time, that mtROS from skeletal muscle is sufficient to induce NMJ disruption and contractile dysfunction. We also report our novel findings that elevated skeletal muscle mtROS leads to increases in muscle mass through hyperplasia and fibre branching.
Methods
Detailed methods are available in Online supplementary material.
Generation of muscle‐specific Sod2 knockout mice
Tissue‐specific Sod2 KO (Sod2 fl/fl) mice were described previously and provided to Dr Van Remmen by Dr Takahiko Shimizu.19, 22 Briefly, Sod2 f/fl mice were generated using mouse Sod2 genomic DNA, in which the neomycin resistance gene and exon 3 were flanked by two loxP sites. Sod2 f/fl mice were then bred to mice containing cre recombinase (Cre) driven by HSA promotor (HSA Cre). PCR was used to identify mice carrying the Cre and Flox constructs by previously described primer sequences and methods.19
Animals
Approximately 6‐ to 8‐month‐old female and male mSod2KO and WT mice were used for all experiments with an exception of mice used for calcium kinetics assays (these mice were 9–13 months). Sod2 fl/fl mice were considered WT in the absence of HSA Cre and mSod2KO in the presence of Sod2 fl/fl. All mice were housed under pathogen‐free barrier conditions where water and foods were provided ad libitum. The Institutional Animal Care and Use Committee at Oklahoma Medical Research Foundation (Oklahoma City, OK, USA) approved all procedures.
Enzyme activity
Activities of CuZnSOD and MnSOD were determined using native gels with negative staining as a method previously described.13 For histological assessment of SDH activity in muscle sections, mid‐belly of gastrocnemius was cut in cross section and stained with a buffer containing, 50 mM sodium phosphate (pH 7.4), 84 mM succinic acid, 0.2 mM phenazine methasulfate, 2 mg/mL nitroblue tetrazolium, and 4.5 mM EDTA. For SDH activity in isolated mitochondria (see succeeding texts for mitochondrial isolation), we diluted 0.25 mg/mL of mitochondria in a buffer containing 210 mM mannitol, 70 mM sucrose, 5.0 MM KH2PO4 and 10 mM MOPS, pH 7.4.
Isolation of skeletal muscle mitochondria
Mitochondria were isolated from gastrocnemius muscle following a previously established method.18
Rate of hydrogen peroxide generation, adenosine triphosphate production, and calcium retention capacity
The rate of mitochondrial H2O2 production was measured using Amplex Red (77.8 μM), horseradish peroxidase (1 U/mL), and SOD (37.5 U/mL) based on a previously described method with minor modifications.13 Mitochondrial complex I was activated by glutamate (5 mM) and malate (5 mM), while complex II‐specific activation was achieved by succinate (10 mM) and rotenone (1 μM). Antimycin A (1 μM) was added to determine maximum rate of H2O2 generation. Fluorescence was measured at an excitation wavelength of 545 nm and emission wavelength of 590 nm. The slope of increase in fluorescence was converted to the rate of H2O2 generation using a standard curve. The rate of ATP synthesis was measured using the luciferin/luciferase assay following a previously described method.23 Mitochondrial calcium retention capacity (CRC) was determined using the membrane impermeable dye, Calcium Green‐5N, based on a previously described method with modifications.24
Fibre permeabilization
Preparation for skeletal muscle fibre permeabilization was previously described.25 Briefly, a small piece (~3–5 mg) of red gastrocnemius muscle was carefully dissected, and we separated fibres along their striations using fine forceps in ice‐cold buffer X containing (in mM) 7.23 K2EGTA, 2.77 CaK2EGTA, 20 imidazole, 0.5 DTT, 20 taurine, 5.7 ATP, 14.3 PCr, 6.56 MgCl2‐6H2O, 50 K‐MES (pH 7.1). The muscle bundle was permeabilized in saponin solution (30 μg/mL) for 30 min, followed by 3 × 5 min washes in ice‐cold wash buffer containing (in mM) 105 K‐MES, 30 KCl, 10 K2HPO4, 5 MgCl2‐6H2O, 0.5 mg/mL BSA, 0.1 EGTA (pH 7.1).
Measurement of respiration and hydrogen peroxide production
Oxygen consumption rate (OCR) and the rate of mitochondrial hydrogen peroxide production were measured using the Oxygraph‐2k (O2k, OROBOROS Instruments, Innsbruck, Austria) by a previously described method26 with minor modifications. OCR was determined using an oxygen probe, while rates of hydrogen peroxide generation were determined using O2k‐Fluo LED2‐Module Fluorescence‐Sensor Green. Data for both OCR and rates of hydrogen peroxide generation were normalized by milligrams of muscle bundle wet weights.
Measurements of mitochondrial superoxide release
Mitochondrial superoxide release was determined by using electron paramagnetic resonance (EPR) spin‐trap, 5‐(2,2‐dimethyl‐1,3‐propoxycyclophosphoryl)‐5‐methyl‐1‐pyrroline‐N‐oxide by a previously described method with minor modifications.27
Markers of oxidative modifications
Levels of F2‐isoprostanes in gastrocnemius were determined by a previously described method28 with minor modifications. The levels of glutathione (GSH) and oxidized GSH (GSSG) were determined using reverse‐phase high‐performance liquid chromatography and electrochemical detection.29 GSH and GSSG were extracted from tissue homogenate by treatment with 5% metaphosphoric acid. Myofibrillar (MF) proteins were isolated based on a previously reported method.30 Abundance of carbonyl groups in muscle homogenate and MF proteins was determined by FTC based on a previously described method.31
Energy charge
Ratio of energy charge in gastrocnemius muscles was determined by using a previously published method.32 All analytes were extracted from tissue homogenate by treatment with 150 mM potassium hydroxide. Concentrations of ATP, adenosine diphosphate (ADP), AMP, NAD+, and NADP+ were detected by absorption at 254 nm. Concentrations of NADH and NADPH were detected by fluorescence at excitation 340 nm and emission 430 nm. All analytes were quantified on the basis of the integrated area of standards.
Contractile properties of skeletal muscle
Isometric contractile properties for in situ gastrocnemius muscle and in vitro extensor digitorum longus (EDL) muscle were measured based on previously established methods.9
Assessment of calcium kinetics using skeletal muscle
Experiments to determine the dynamic calcium responses to twitch stimuli were performed on lumbrical muscles from WT and mSod2KO mice (age 9–13 months). Details on the techniques and apparatus used to measure lumbrical muscle contractile properties and fluorescence have been described previously.33, 34
Sarcoplasmic/endoplasmic reticulum calcium ATPase activity
The measurement of sarcoplasmic/endoplasmic reticulum calcium ATPase activity was performed at 37°C by using a spectrophotometric assay as described elsewhere.35
Neuromuscular junction staining
Neuromuscular junctions were stained following a previously established method with minor modifications.36
Histology
Gastrocnemius muscle tissues were frozen in liquid nitrogen‐cooled isopentane; 10 μm cross sections were made using a microcryotome (−20°C), dried and used for immunohistochemistry staining.
Quantification of myofiber branching
Myofiber branching was determined based on a previously established method with modifications.37, 38
Quantification of protein abundances by selected reaction monitoring
We used targeted quantitative mass spectrometry to measure protein abundance as previously described.39
Determination of mitochondrial DNA copy number
Absolute copy number of mitochondrial DNA (mtDNA) was quantified (copies per ng input DNA) by digital PCR based on a previously reported method.40, 41
Immunoblot and qPCR
Standard procedures were used for western blots and qPCR. Antibodies and primers used are detailed in Table S2.
Statistical analyses
Data were analysed using unpaired two‐tailed t tests. Levels of significance were set at P < 0.05 in all cases. Data are presented as mean ± SEM.
Results
Defects of mitochondrial respiration and increased H2O2 generation in mSod2KO mice
To test the causality of excess mtROS on skeletal muscle weakness, we generated a muscle‐specific Sod2 knockout mouse line (mSod2KO mice). We confirmed the extent and specificity of the MnSOD deletion by measuring the activity (Figure S1A) and protein abundance (Figure S1B) of MnSOD in gastrocnemius muscle and heart. Our PCR data also confirm Sod2 deletion specifically in skeletal muscle (not in heart) of Acta cre‐positive Sod2 fl/fl mice. Cre‐negative Sod2 fl/fl mice show no deletion as expected (Figure S1C). CuZnSOD activity is not altered in response to the loss of MnSOD. We measured mitochondrial function using isolated skeletal muscle mitochondria. We found that mitochondrial H2O2 generation with complex I substrates is significantly higher in isolated skeletal muscle mitochondria from mSod2KO compared with WT mitochondria while H2O2 generation is dramatically lower with complex II substrates. Antimycin A‐induced H2O2 generation rate is significantly higher in mitochondria from the mSod2KO mice (Figure 1A). The between‐group differences in all conditions disappeared after catalase addition confirming that the signal is generated by H2O2 (data not shown). Consistent with the reduced H2O2 generation from complex II substrates, mitochondria from the mSod2KO mice have a dramatically lower SDH activity than WT mitochondria (Figure S1D–F). The mRNA levels of complex II subunits A and B are not decreased in muscle from mSod2KO (Figure S1G, H), suggesting that the decrease in complex II may be due to post‐translational modifications and protein degradation, consistent with previous findings from our laboratory and others.19, 21
Figure 1.
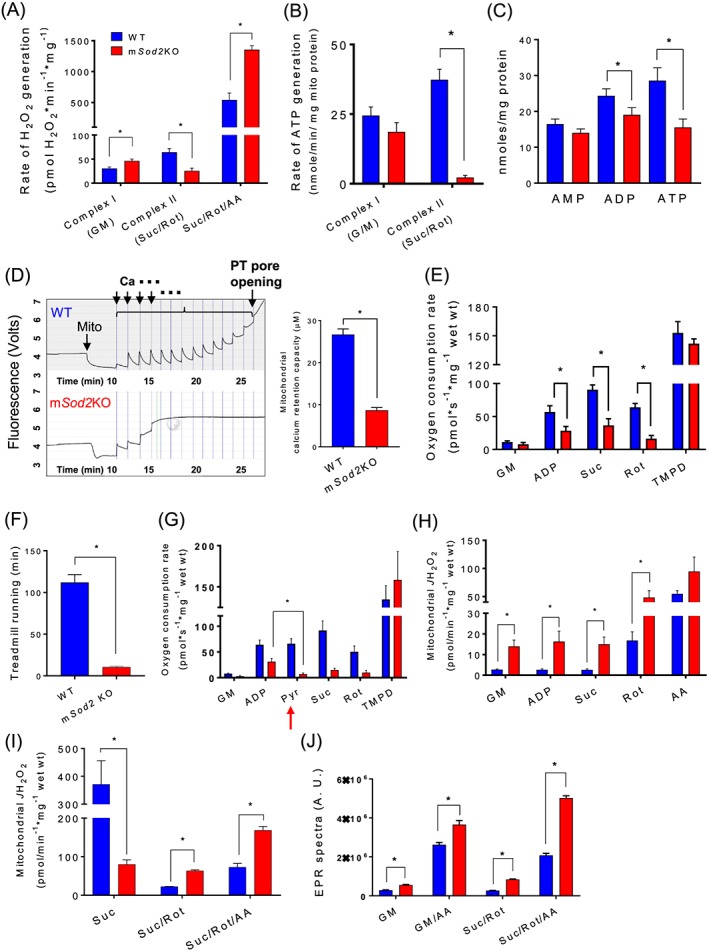
Defects of mitochondrial respiration and increased H2O2 generation in mSod2KO mice. (A) Rates of hydrogen peroxide generation determined in isolated mitochondria from gastrocnemius muscle using Amplex Red (n = 3–6). Substrates and inhibitors were added to determine reactive oxygen species generation in response to substrates and inhibitors of mitochondrial ETC. (B) Rates of adenosine triphosphate production determined in isolated mitochondria from complex I and II (n = 4–5). (C) Contents of cellular nucleotides determined in gastrocnemius tissue homogenate (n = 7–8). (D) Left: A sample observation of CRC of isolated mitochondria (wild‐type vs. mSod2KO). Calcium levels were determined using membrane‐impermeable calcium indicator, Calcium‐Green 5N. Right: Quantified calcium retention capacity (n = 4–5). (E) Mitochondrial oxygen consumption rate in response to sequential addition of substrates and inhibitors in permeabilized gastrocnemius fibres (n = 4–5). (F) Running time on a treadmill (n = 6). (G) Mitochondrial oxygen consumption rate in response to sequential addition of substrates and inhibitors in permeabilized gastrocnemius fibres‐testing the impact of pyruvate on mitochondrial oxygen consumption rate (n = 3). (H) Rate of hydrogen peroxide generation determined in response to sequential addition of substrates and inhibitors in permeabilized gastrocnemius fibres using Amplex UltraRed (n = 4–5). (I) Hydrogen peroxide generation rate assessed from permeabilized gastrocnemius fibres in the absence of adenosine diphosphate (n = 4). (J) Mitochondrial superoxide release measured by spin trap CYPMPO using isolated mitochondria. Data are quantification of electron paramagnetic resonance spectra (n = 5). Values are mean ± SEM. *P < 0.05. Abbreviations: ETC, electron transport chain; GM, glutamate and malate; Suc, succinate; Rot, Rotenone; AA, Antimycin A; Asc, Ascorbate; TMPD, N,N,N′,N′‐tetramethyl‐p‐phenylenediamine.
Excess mtROS, in particular superoxide anions, have been shown to alter mitochondrial function.42 In agreement with the observed decrease in SDH enzyme activity, complex II‐induced ATP generation of mSod2KO is dramatically decreased, while complex I‐induced ATP generation is not altered (Figure 1B). Consequently, the levels of ATP in gastrocnemius muscle are decreased by ~40% in mSod2KO compared with WT mice (Figure 1C). Mitochondria play an important role in cytoplasmic calcium homeostasis by absorbing calcium ions from cytoplasm.24 To test mitochondrial CRC, we challenged isolated mitochondria by adding 2 μM calcium chloride (CaCl2) per minute until the mitochondrial calcium release level overrides calcium uptake because of permeability transition pore opening. CRC in mSod2KO mice is reduced by ~70% compared with WT (Figure 1D).
Preparation of isolated mitochondria can cause damage to the organelle altering mitochondrial morphology and function and induce selection bias during the centrifugation step.43 Also, mitochondria in vivo have the added complexity of interactions with neighbouring organelles and proteins. To address these potential limitations, we measured mitochondrial OCR and H2O2 generation rate in permeabilized ‘red’ gastrocnemius muscle fibres located in the lateral heads of the gastrocnemius. These fibres are visually more red in colour than surrounding fibres. Consistent with our previous results in isolated mitochondria, we observed that complex II‐induced OCR is selectively decreased in mSod2KO mice (Figure 1E), and ROS generation is elevated (Figure 1H). The rates of mitochondrial H2O2 production are significantly elevated by about four‐fold to five‐fold at basal and during complex I and II‐activated conditions in mSod2KO mice. These observations are different from the findings in isolated mitochondria (Figure 1B) potentially due to the presence of ADP in permeabilized fibres. Thus, we also measured ROS generation in the absence of ADP using permeabilized fibres (Figure 1I). In muscle mitochondria from WT mice, we observed a steep rise in H2O2 generation in response to succinate, suggesting superoxide generation through reverse electron transfer.23 The rise in H2O2 generation is substantially lower in mSod2KO in response to succinate consistent with complex II deficiency.
To test mitochondrial function in vivo, we measured total running time to exhaustion for the mice on a treadmill, which shows a substantial reduction in mSod2KO mice 10 min compared with ~2 h in WT mice (Figure 1F). Voluntary cage activity of the mSod2KO mice trended to decrease (P < 0.07) during the active (dark) phase (Figure S2A, B). Lactate build‐up caused by decreased pyruvate utilization has been suggested to be the underlying cause of the exercise intolerance in mSod2KO mice.19, 21 To test pyruvate utilization of skeletal muscle fibres from WT and mSod2KO mice, we directly added pyruvate as a substrate in the permeabilized fibres while measuring mitochondrial respiration, indicated as red arrow in Figure 1G. Pyruvate effectively shuts down oxidative phosphorylation in mSod2KO mice.
The rate of ROS generation in the isolated mitochondria or permeabilized fibres was determined using Amplex Red or Amplex UltraRed probes, respectively, which detect H2O2, but not superoxide. Because of the deficiency of MnSOD in the matrix in mSod2KO mice, the superoxide within the matrix will not be detected. To directly determine mitochondrial superoxide release, we used EPR in conjunction with superoxide‐targeted spin trap. Mitochondria isolated from gastrocnemius muscle were used for the measurements. Superoxide levels derived by EPR signals in mSod2KO mice are significantly elevated for complex I and II‐linked substrates and the inhibitor Antimycin A (Figure 1J). Complex I and III inhibitors, rotenone and Antimycin A, increase superoxide generation from mitochondria for WT and mSod2KO, but a greater increase is observed in mitochondria from mSod2KO than from WT mice. Addition of exogenous CuZnSOD in the buffer effectively abolished the superoxide‐derived EPR signals for complex I and II‐linked substrates (Figure S1I). These observations are consistent with previous data from our laboratory in which we measured an increase in superoxide generation in fast‐twitch muscle specific deletion of Sod2KO mice.19
Markers of oxidative stress and redox potential
To test whether a reduction in MnSOD leads to an increase in oxidative modifications, we assessed lipid peroxidation, protein carbonyls, and tyrosine nitration in gastrocnemius muscle. Lipid peroxidation was determined by F2‐isoprostane levels, which are stable products formed by free radical‐catalysed peroxidation of arachidonic acids. F2‐isoprostane levels are elevated by ~80% in the mSod2KO mice (Figure 2A). To measure protein oxidation of skeletal muscles, we determined the level of carbonylation of proteins using muscle homogenate and observed a trend of increase (P < 0.1) in the mSod2KO mice (Figure 2E). Because skeletal muscle is a heterogeneous tissue and MF proteins are highly sensitive to oxidative damage, we isolated MF proteins and determined the levels of carbonylation, which are significantly elevated by ~30% in mSod2KO mice (Figure 2F). Nitration of protein tyrosine residues represents another important post‐translational modification caused by nitrosative and oxidative stress. The formation of 3‐nitrotyrosine is the most commonly studied covalent modification of protein nitration, and elevated levels of this product are implicated in many oxidative stress‐associated pathologies, including aging.44 We observed that protein nitration is elevated by ~60% in muscle from mSod2KO mice (Figure 2C).
Figure 2.
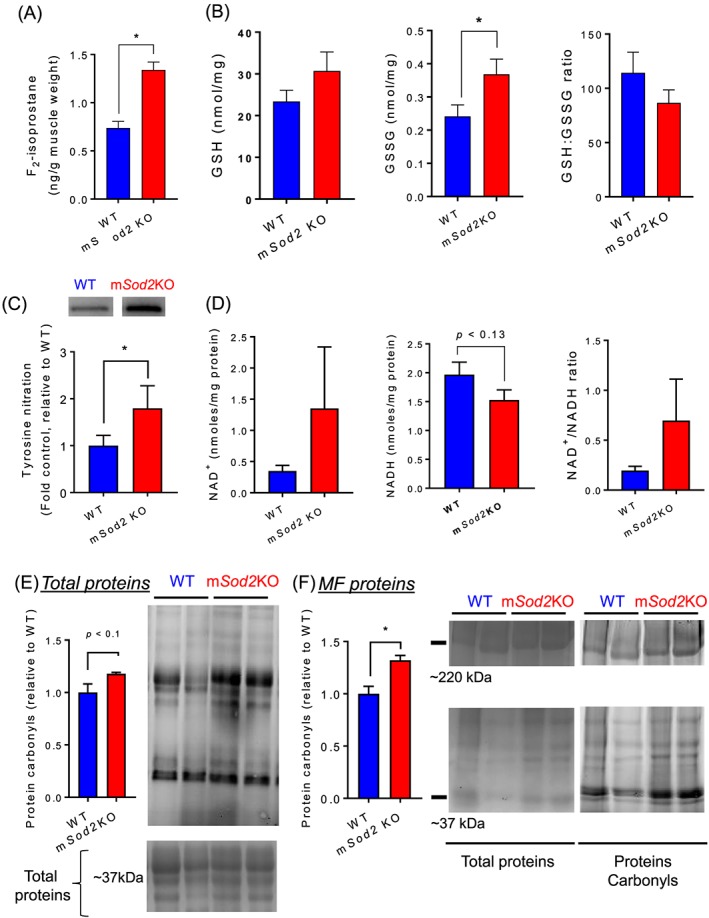
Markers of oxidative stress and redox potential. (A) Lipid peroxidation determined by F2‐isoprostane in gastrocnemius muscles. Values are ng F2‐isoprostane/g muscle tissue (n = 7–8). (B) Reduced glutathione, oxidized glutathione, and the ratio (glutathione:oxidized glutathione) in gastrocnemius muscles (n = 8–9). (C) Immunoblot images and quantified data showing the proteins conjugated with tyrosine nitration from wild‐type and mSod2KO (n = 7). (D) NAD+, NADH, and the ratio (NAD+/NADH) was determined using high‐performance liquid chromatography in gastrocnemius muscles (n = 9–10). (E) Left: Quantified data for carbonylated proteins from total gastrocnemius homogenate (n = 4–5). Right: Representative images showing carbonylated proteins (Top) and Coomassie‐stained total proteins (Bottom). (F) Left: Quantified data for carbonylated proteins from isolated myofibrillar proteins (n = 4). Right: Representative images showing carbonylated myofibrillar proteins (Top) and Coomassie‐stained total myofibrillar proteins (Bottom). Values are mean ± SEM. *P < 0.05.
Changes in redox status have a major impact on cellular and physiological processes and may underlie many functional deficits associated with aging and oxidative stress.3, 45 Removal of H2O2 is catalysed by the antioxidant enzymes catalase, GSH peroxidase, and peroxiredoxins. GSH peroxidase and peroxiredoxins require oxidation of GSH and thioredoxin, respectively. The ratio of reduced and oxidized GSH (i.e. GSH:GSSG) is used as an index of redox potential.46 We found a significant increase in the content of GSSG suggesting oxidative stress, although the GSH:GSSG ratio in mSod2KO mice shows only a trend (P < 0.07) for a decrease in the ratio (Figure 2B). Reduction of GSH is catalysed by GSH reductase, which requires oxidation of NADPH to NADP+. Similarly, reduction of oxidized thioredoxin requires oxidation of NADH to NAD+. Perhaps surprisingly, the muscle from mSod2KO mice does not show a significant change in NAD+, NADH, or the NAD+/NADH ratio (Figure 2D). Figure S5 illustrates the role of antioxidant enzymes and their co‐factors in redox homeostasis.
Skeletal muscle myofibrils and mitochondrial proliferation
To evaluate the impact of mitochondrial oxidative stress on skeletal muscle ultrastructure, we obtained transmission electron micrograph images of tibialis anterior muscles. In mSod2KO, myofibrils are shorter and smaller and not as regularly organized as in WT skeletal muscle (Figure S6A). Myofilaments appear to be less tightly packed, I‐bands around Z disks (shown as ‘Z’ in Figure S6A) are indistinct in many areas, and the M‐lines (shown as ‘M’ in Figure S6A) are frequently out of alignment and faint. Mitochondria (shown as white arrow head in Figure S6A) in mSod2KO exhibit localized accumulations between myofibrils and appear to be bigger than those of WT. The location of mitochondria in WT skeletal muscle is near Z‐disks, but in mSod2KO mice, their cellular locations are irregular. We measured the protein content of isolated mitochondria in gastrocnemius muscle and found ~30% increase in mitochondrial protein content in muscle from mSod2KO mice compared with WT mice (data not shown). The mitochondrial proliferation is consistent with an increased level of mRNA levels of PGC1‐α (Figure 3A).
Figure 3.
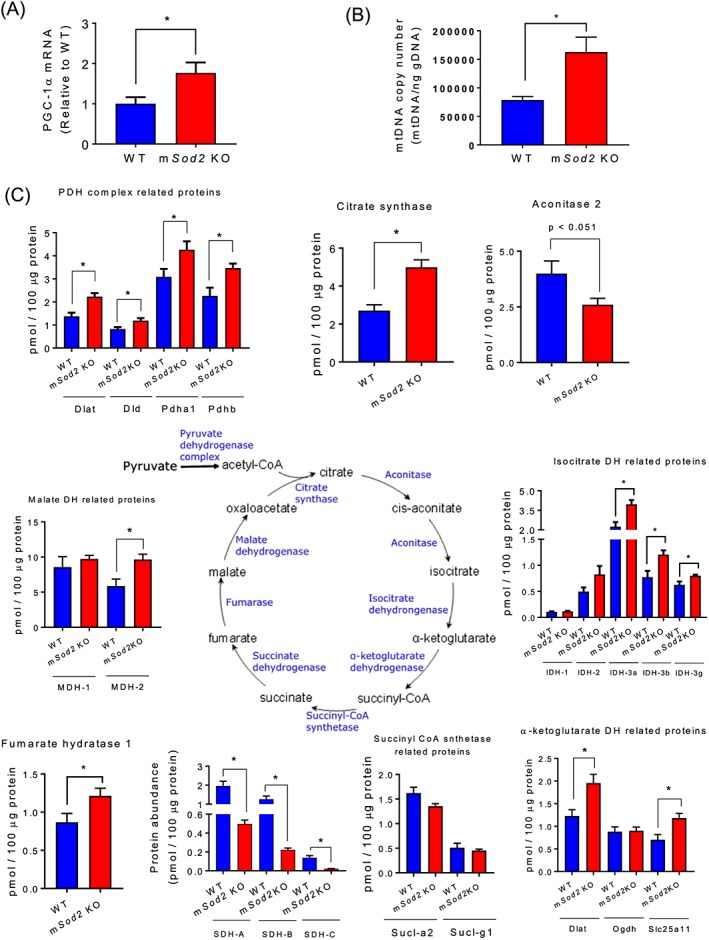
Skeletal muscle myofibrils and mitochondrial proliferation. (A) Levels of PGC1‐α mRNA in wild‐type and mSod2KO mice (n = 7–8). (B) Mitochondrial DNA copy numbers per nanogram genomic DNA from gastrocnemius muscle (n = 9–10). (C) Protein expression of isoforms and subunits in Krebs cycle enzymes (n = 6). Values are mean ± SEM. *P < 0.05.
Mitochondrial proliferation was confirmed by measuring targeted mitochondrial protein abundance using selected reaction monitoring. We observed that many Tricardoxylic acid (TCA) cycle enzymes are increased in mSod2KO with the notable exceptions of aconitase and SDH (Figure 3C), which are known to be highly sensitive to oxidative stress. Similarly, many enzymes in the fatty acid oxidation pathway are increased (Figure S4) consistent with mitochondrial proliferation. Proteins involved in glycolysis are largely unchanged (Table S1). We determined the abundance of antioxidant enzymes and found that many of the antioxidant enzymes are significantly elevated in mSod2KO except Sod1 and a few others (Figure S5). Upregulation of TCA cycle, fatty acid oxidation, and antioxidant enzymes suggests a compensatory mechanism for decreased oxidative phosphorylation and excess oxidants.
Excess oxidants are known to cause oxidative damage to DNA and to increase mtDNA copy number in skeletal muscle40 and potentially mtDNA sequence variants. Thus, we determined the copy number of mitochondrial and nuclear DNA using gastrocnemius muscles of WT and mSod2KO mice. We found a significant increase in mtDNA copy number (Figure 3B) with no change in the copy number of nuclear DNA (data not shown). Our analyses of heteroplasmic single nucleotide variant (SNV) frequency reveal no change in mtDNA mutational load (Figure S3A). A specific nucleotide, thymine, trends to show increased SNV frequency in mSod2KO (Figure S3B), suggesting that thymine might be more subject to oxidative modifications. Interestingly, occurrence of SNVs higher than 1% frequency is increased in mSod2KO (Figure S3C). These increases in SNVs are localized in D‐Loop and Rnr1/2.
Contractile dysfunction and calcium mishandling in mSod2KO skeletal muscle
Excess ROS is known to cause contractile dysfunction in skeletal muscles.9 To test the impact of mtROS on skeletal muscle from WT and mSod2KO mice, we measured in situ and in vitro contractile function of skeletal muscle. The in vitro contractile properties of soleus and extensor digitorum longus (EDL) muscles reveal a significant decrease in maximum isometric specific force (N/cm2) for muscles of mSod2KO compared with WT mice (Figure S6B, C) with unchanged fatiguability (Figure S6D, E). Our in situ experiments using direct stimulation on the gastrocnemius similarly demonstrates a ~40% decrease in specific force for mSod2KO. The force deficit is exacerbated in sciatic nerve‐stimulated force generation (Figure 4A, B), suggesting disruption and abnormalities of the NMJ. Intrinsic force deficit is highly associated with calcium mishandling, including intracellular calcium transient, sensitivity, and uptake kinetics.47 We find a significant reduction in intracellular calcium transient measured in mSod2KO lumbrical muscles (Figure 4C), while specific force and intracellular calcium fall time are unchanged (Figure 4D, E). The drop in peak intracellular‐free calcium may be affected by a decrease in calcium release, enhanced calcium buffering, or faster calcium uptake in mSod2KO. Arguing against the latter, we find severe defects in mitochondrial buffering (Figure 1D) and sarcoplasmic/endoplasmic reticulum calcium ATPase pump (Figure 4F).
Figure 4.
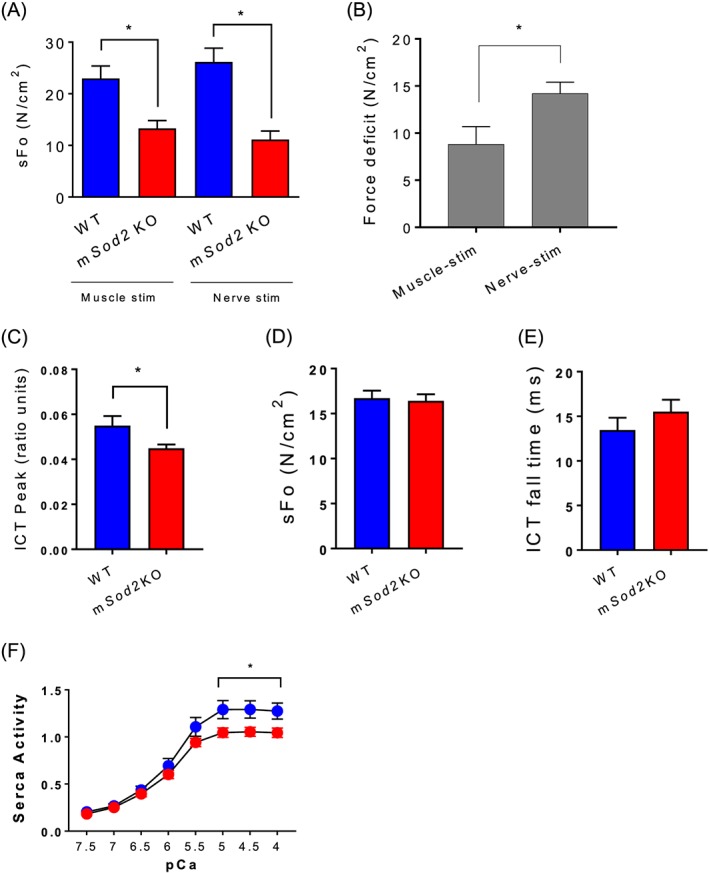
Contractile dysfunction and calcium mishandling in mSod2KO skeletal muscle. (A) Isometric contractile function of gastrocnemius muscles were determined using in situ preparation. Maximum isometric specific force (sFo), force per cross‐sectional area (n = 5–7). (B) Force deficit induced by muscle or nerve stimulation (n = 5–7). (C) Intracellular calcium transient (n = 6). (D) Specific force generation (kPa) (n = 6–7). (E) Intracellular calcium transient fall time (n = 6). Isolated lumbrical muscles are used for C–E. (F) Activity of sarcoplasmic/endoplasmic reticulum calcium ATPase (sarcoplasmic/endoplasmic reticulum calcium ATPase pump) in response to varying calcium concentrations from gastrocnemius (n = 6). Values are mean ± SEM. *P < 0.05.
Neuromuscular junction disruption and fragmentation of mSod2KO skeletal muscle
Because our contraction data suggest that NMJ abnormalities may exist in the muscle from mSod2KO mice, we asked whether the loss of MnSOD and increased mtROS alters the mRNA and protein levels of the acetylcholine receptor (AchR). We found about two‐fold increase in the mRNA level for the AchRα‐isoform (Figure 5A). Despite the increase in the mRNA level, the protein abundance of AchR is decreased by ~50% in mSod2KO (Figure 5B), which may be due to an increase in protein degradation. To further determine morphological alterations by excess mtROS, we measured the size of NMJ and the number of fragments and found significant increases in mSod2KO (Figure 5C–E), which are typical of denervation and sarcopenia phenotypes.2 Note that scoring of the percentage of denervated NMJ reveals no effect of MnSOD deficiency (Figure 5F).
Figure 5.
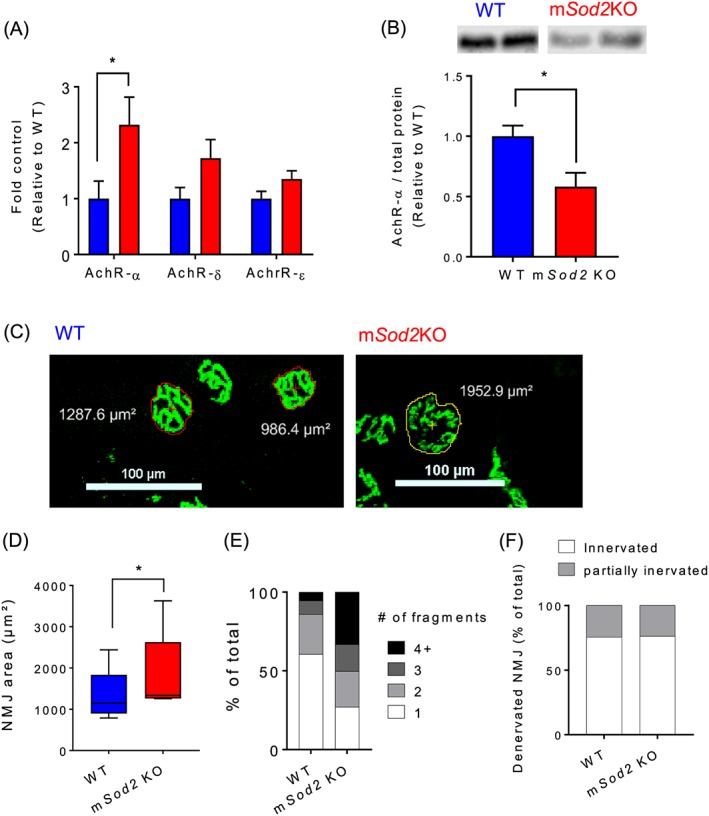
Neuromuscular junction disruption and fragmentation of mSod2KO skeletal muscle. (A) Levels of acetylcholine receptors mRNAs. mRNA levels of three acetylcholine receptor isoforms (α, δ, and ε) were determined by qRT‐PCR using gastrocnemius muscles (n = 7–8). (B) Protein abundance of acetylcholine receptor‐α was determined using immunoblot analysis (n = 8). (C) Representative neuromuscular junction immunofluorescence images from gastrocnemius muscle from wild‐type (Left) and mSod2KO (Right). Acetylcholine receptors are stained with Alexa‐488‐conjugated α‐bungarotoxin (n = 5). (D) Quantification of neuromuscular junction area. (E) Categorization of neuromuscular junctions by the number of fragments. (F) Percent of denervated neuromuscular junction. Averages of 30–50 neuromuscular junctions were used as each data point from each mouse. Values are mean ± SEM. *P < 0.05.
Mitochondrial oxidative stress increases muscle mass via hyperplasia
Contrary to our expected results, mSod2KO mice do not exhibit a loss in muscle mass (Figure 6A). Indeed, in gastrocnemius and quadriceps muscles, there are ~10–15% increases in muscle mass, while no changes were observed in smaller muscles. The increase in muscle mass observed in female mice is also evident in male mice (Figure S6A). We find that isolated skeletal muscles from mSod2KO are more red in colour than WT muscles (Figure S1J) as reported previously.21 To test a potential shift in muscle fibre type, we performed immunohistochemistry using isoform‐specific antibodies on cross sections and found a significant increase in type 2x fibres in mSod2KO gastrocnemius (Figure 6B). We postulate that accumulation of mitochondria is the underlying cause of red pigment of the skeletal muscle. In line with the idea, our mSod2KO mice demonstrated mitochondrial proliferation (Figure 3A–C). An animal model leading to a significant mitochondrial dysfunction (ANT1KO) and compensatory proliferation exhibits redness of the muscle.48 Another animal model with PGC1‐α overexpression demonstrates increased pigment in skeletal muscle tissues.49 Increase in muscle mass in gastrocnemius is not caused by a change in fibre size (i.e. hypertrophy) but rather by an increase in the number of fibres by ~60% (hyperplasia) (Figure 6C–E). Furthermore, ~50% of the fibres contain central nuclei in mSod2KO (Figure 6F, G), suggesting generation of new fibres. Regardless of the dramatic increase in central nuclei, embryonic myosin heavy chain expression is not increased in mSod2KO mice (Figure 6H). Histogram analysis of fibre area in mSod2KO reveals highly variable and distorted bell‐shaped distributions, as opposed to normally distributed WT gastrocnemius (Figure 6I).
Figure 6.
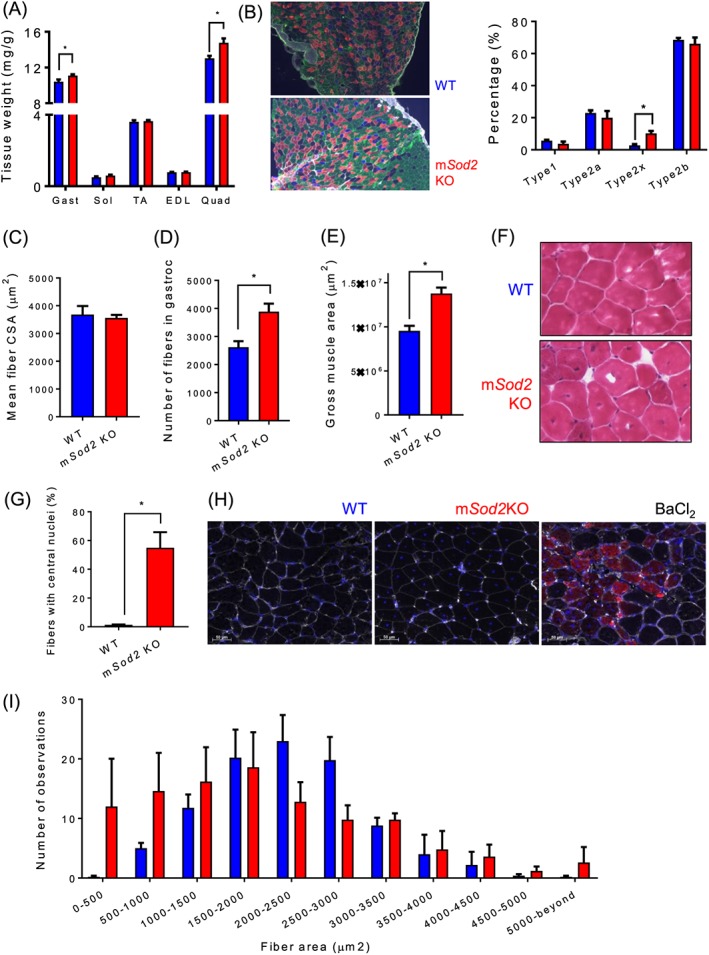
Mitochondrial oxidative stress increases muscle mass via hyperplasia. (A) Relative muscle weights were determined by skeletal muscle mass (mg) normalized by body weight (g) (n = 30–35). (B) Left: Representative images of fibre typing from wild‐type (top) and mSod2KO (bottom). Type 1 fibres were peudo‐coloured blue, type 2a fibres red, type 2b fibres green, and extracellular matrix was coloured white. Right: Quantified fibre type distribution by percent of total. (C) Mean fibre cross‐sectional area. (D) Total number of fibres. (E) Gross area of gastrocnemius muscle (n = 3). (F) Haemotoxylin and eosin‐stained cross‐sectional images of gastrocnemius from wild‐type (top) and mSod2KO (bottom). Dark brown dots indicate nuclei. (G) Percent of fibres with central nuclei (n = 5). (H) Immuno‐fluorescent images showing expression of embryonic myosin heavy chain by barium chloride injection (Right), but not in wild‐type and mSod2KO gastrocnemius (Left, Middle). (I) A histogram demonstrating fibre sizes from wild‐type and mSod2KO gastrocnemius (~80–100 fibres per mouse) was used for size measurements (n = 5). Values are mean ± SEM. *P < 0.05.
Fibre branching as a mechanism of an increase in muscle mass in mSod2KO
To directly test the mechanism responsible for hyperplasia, we teased out single fibres from gastrocnemius muscles and determined the number of fibres with or without branches (Figure 7A). We find that ~35% of the fibres contain fibre branches in muscle from the mSod2KO mice, while no fibres exhibit branches in muscle from WT mice (Figure 7B). In addition to fibre branching, we examined changes of a calcium‐mediated protein degradation pathway calpain, a muscle protease. We find protein expression of calpain‐1 significantly lower in mSod2KO mice (Figure 7C). To measure the activity of calpain, we determined the abundance of breakdown products from α‐II spectrin at ~150 kDa,50 which is significantly decreased in mSod2KO mice (Figure 7D).
Figure 7.
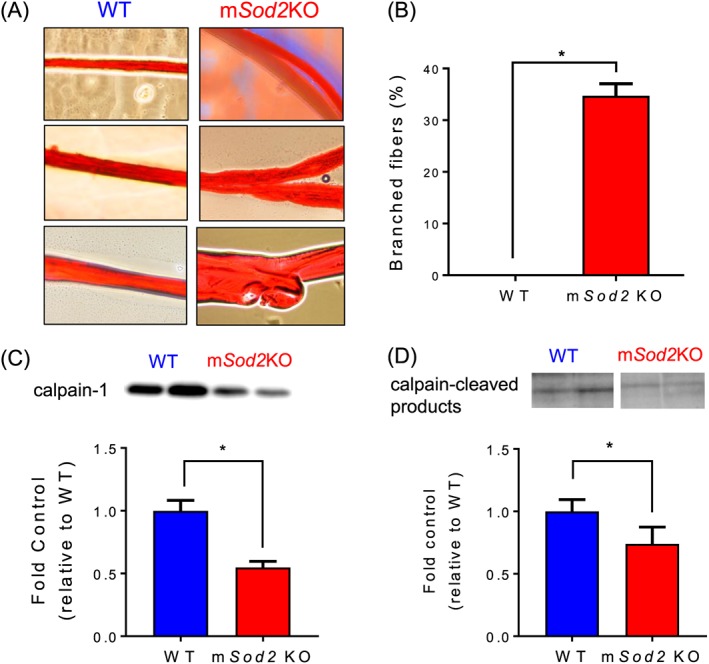
Fibre branching as a mechanism for an increase in muscle mass in mSod2KO. (A) Representative images of gastrocnemius single fibres that are unbranched (left) and branched (right). (B) Quantifications by percent of branched fibres from wild‐type and mSod2KO mice. (C) Protein contents of calpain‐1 determined by immunoblot (n = 4–7). (D) Calpain‐cleaved products of αII‐spectrin at ~145 kDa (n = 6–7).
Discussion
The goal of this study is to determine whether compromised function of skeletal muscle mitochondria and elevated mtROS generation are sufficient to cause muscle atrophy independent of loss of muscle innervation. Contrary to our prediction, elevated mitochondrial oxidative stress leads to increases in muscle mass and hyperplasia via fibre branching. Despite the compensatory increase in muscle mass, contractile function is impaired associated with NMJ disruption and possibly due to a calcium mishandling within myofibers. Excess superoxide in mitochondrial matrix leads to dramatic loss of SDH and severe exercise intolerance as reported in animals and patients with SDH deficiency.51, 52 Our findings demonstrate, for the first time, that mtROS from skeletal muscle is sufficient to induce NMJ disruption but not denervation. We also report our novel findings that ROS from skeletal muscle mitochondria increase muscle mass through fibre branching.
MnSOD is localized in the mitochondrial matrix where it is poised to protect the ETC subunits and other matrix proteins from oxidative insult induced by ETC generation of superoxide. In the absence of MnSOD, superoxide is unchecked and the mitochondria are susceptible to oxidative damage that can impair function. We measured a number of indicators of mitochondrial function in muscle from mSod2KO mice. One of the most dramatic changes is the substantial decrease in the level of complex II (SDH) protein subunits despite upregulation of the mRNA levels. The mechanisms by which increased superoxide causes SDH‐specific deficiency are unclear, but potential causes include deficiency or dysfunction of SDH import proteins, assembly factors, or activation of mitochondrial proteases, including Lon protease.53 Previous studies have shown that loss of SDH contributes to substantial reductions in ETC activity and ATP generation rate, leading to severe exercise intolerance in animals19, 21 and in patients.51, 52 Mitochondrial respiration in response to complex II substrate is also significantly lower in mitochondria from mSod2KO mice compared with WT mice. Complex I activity is partially reduced, but the loss of SDH is much more substantial than other complexes of ETC in agreement with previous reports in mice lacking MnSOD in skeletal and cardiac muscles.21, 54 We confirmed the impaired mitochondrial function in vivo using treadmill running time. The mSod2KO mice are more susceptible to exhaustion during treadmill running. Although our data exhibit ETC activity only, mitochondria are also responsible for fatty acid oxidation, defects in which are likely to contribute to exercise intolerance as shown before.55 Overall, our results confirm that mitochondrial function is significantly compromised by the loss of MnSOD.
In addition to severe defects in respiration, mitochondria from mSod2KO mice have increased generation of ROS. Excess ROS are known to impair contractile function of skeletal muscle.9 Isolated skeletal muscle incubated with varying hydrogen peroxide concentrations has demonstrated dose‐dependent effects on maximum force generation.7, 56 Increased hydrogen peroxide is known to induce lipid peroxidation in the sarcolemma, which was supported by our data (Figure 2A). Excess oxidants also induce oxidative modifications in proteins associated with the contractile machinery (i.e. thiol oxidation). To test this idea, we isolated MF proteins using previously established methods30 and found that carbonylated proteins were significantly elevated in mSod2KO mice. These data support the concept that multiple factors can contribute to muscle weakness, including altered signal transmission through the NMJ and intrinsic changes to the proteins response for carrying out contractile force generation.
Alterations in the NMJ are a critical contributor to sarcopenia,45 but it is not clear whether defective mitochondrial function precede or follow changes in NMJ and skeletal muscle atrophy and contractile dysfunction.57 Our laboratory and others previously demonstrated that denervation plays a causal role in AchR fragmentation and degeneration, leading to skeletal muscle atrophy.12 Furthermore, recent studies support an association between skeletal muscle mtROS and NMJ disruption in multiple pathological conditions, including aging and denervation.2, 36, 55, 57 In this study, we were interested in determining whether the increased mtROS and mitochondrial dysfunction in the skeletal muscle of mSod2KO mice compromises the NMJ in a feedback manner to potentially initiate muscle atrophy. Our results are consistent with alterations in the NMJ in gastrocnemius muscle of the mSod2KO mice. For example, our in situ contractile function data reveal that the maximum isometric specific force of the gastrocnemius is decreased by ~40% with stimulation directly on the muscle, but force generation through sciatic nerve stimulation shows a greater reduction (~60%). This result suggests compromised signalling through the NMJ in the mSod2KO mice. Consistent with these findings, the expression of the AchR‐α is decreased in gastrocnemius muscle from the mSod2KO despite an upregulation of AchR‐α mRNA levels.2 Further analyses of NMJ morphology reveals that fragmentation and size of the NMJ area are increased in mSod2KO. Together, these changes suggest that elevated mtROS and oxidative stress induce morphological changes in the AchR, including a potentially increased degradation of AchR‐α or reduced stability of the AchR complex. Notably, however, we did not find any evidence of loss of innervation in gastrocnemius muscle from the mSod2KO mice. Thus, for the first time, we demonstrate a causal role of excess ROS from skeletal muscle mitochondria on NMJ disruption and muscle weakness, supporting a retrograde effect of muscle mtROS in vivo.58
Contrary to our expected results, significant damage to the mitochondria and excess ROS do not cause atrophy in skeletal muscle. Rather, we find an increase in muscle mass in gastrocnemius and quadriceps. Our findings differ from an existing report, which found no change in skeletal muscle mass in mSod2KO mice.21 Our study includes data collected from 30–35 female mice per group compared with five mice per group in the study that did not see a difference in mass. Our findings in female mice were confirmed in male mice (Figure S7A, B). Notably, the impact of mitochondrial oxidative stress causing hypertrophy on large muscle groups (gastrocnemius and quadriceps), but not in small muscles (tibialis anterior, EDL, and soleus), remains unclear. Another redox‐dependent pathological condition, Duchenne Muscular Dystrophy, also preferentially affects muscle groups as reported.59, 60, 61 We predict that the preferential calf hypertrophy results from overuse while functioning to stabilize the body against gravity. A case report of a patient with familiar mitochondrial myopathy, who demonstrated deficiencies in SDH and aconitase with lifelong exercise intolerance, reported calf hypertrophy consistent with our report.51, 52 We also previously found a similar increase in muscle mass in mice with a muscle specific deletion of CuZnSOD.13 Together, these data point to a modulation of muscle mass by oxidative stress that leads to increased muscle mass, but not atrophy.
The increase in muscle mass in the mSod2KO mice is associated with increased central nuclei21 and a dramatic increase in the number of fibres appearing in a cross section. The increase in fibre number results from fibre branches rather than independently separated fibres. The cause of fibre branching is unknown, but one explanation is incomplete lateral fusion of myotubes during regeneration elicited by injury‐induced necrosis,62 which is dramatically elevated in mSod2KO mice.21 The increased fibre branching has previously been shown in EDL muscle from old compared with young rats.63 Fibre branching is also the basis for the increase in fibre numbers in mdx mice, where there is also an increase in oxidative stress leading to skeletal muscle hypertrophy and decreased specific force37 as in mSod2KO skeletal muscle. Although branched fibres compensate for skeletal muscle cell death via necrosis in mSod2KO mice,21 excitation‐contraction coupling is disturbed in the branched myofibers,37 and calcium‐activated force production has been shown to be reduced.64 The mdx mice have shown an increase in muscle mass but exhibited decreases in calcium transients in branched fibres compared with unbranched fibres.65 The calcium transient is indeed decreased in mSod2KO skeletal muscle. Considering that there is no matching increase in synapse number with fibre branching,37 branched fibres may also contribute to neuromuscular dysfunction.
Conclusions
In summary, our results demonstrate that loss of MnSOD increases superoxide in mitochondrial matrix, leading to SDH deficiency, mitochondrial defects, and severe exercise intolerance. Excess hydrogen peroxide produced from the mitochondria induces NMJ alterations through a retrograde effect on NMJ proteins, contributing to neuromuscular dysfunction‐induced skeletal muscle weakness. Despite reports of neurogenic atrophy in multiple pathological conditions (i.e. aging, inactivity, and chronic inflammatory diseases), skeletal muscle mass of large muscle groups, including gastrocnemius and quadriceps, is increased because of hyperplasia via fibre branching that may also contribute to NMJ dysfunction.
Conflict of interest
B.A., R.R., P.P., G.P., K.M.P., S.M., D.R.C., K.R., J.J., S.B., K.S.N., E.B., B.W., M.K., K.M.H., T.M.G., W.M.F., A.R., S.V.B., and H.V.R. declare that they have no conflict of interest.
Funding
This work was supported by the National Institute of Aging (P01AG051442, R01‐AG047879, R01‐AG055395, P30AG050911, T32AG052363), National Institute of General Medical Sciences (5P30GM114731), and a Merit Review Grant to HVR from the US Department of Veterans Affairs.
Supporting information
Figure S1. The mSod2KO mice exhibit skeletal muscle specific loss of MnSOD activity and dramatic loss of complex II activity in electron transport chain (ETC). (A) A representative image showing activities of MnSOD and CuZnSOD in skeletal and cardiac muscle homogenates. (B) Immunoblot analysis using gastrocnemius muscle homogenates shows protein abundance of MnSOD in WT, but not in mSod2KO (n = 7–8/group). (C) A representative PCR results showing deletion of floxed site by human skeletal actin (HAS) cre recombinase. (D) Representative SDH activity performed on sections of gastrocnemius muscle. (E) Representative profile of spectrophotometric SDH activity using isolated mitochondria (25 μg/mL) from gastrocnemius. Activation of the SDH enzyme was achieved by 2 min incubation with succinate. (F) Quantification of the succinate consumption rate at active conditions (n = 2). (G) mRNA levels of SDH subunits (n = 7–8). (H) Protein expression of SDH subunits determined by mass spectrometry (n = 6). (I) Representative EPR spectra for measurement of mitochondrial superoxide release rate using isolated skeletal muscle mitochondria with or without superoxide dismutase. Abbreviations (concentrations): glu, glutamate (25 mM); mal, malate (2.5 mM); suc, succinate (25 mM); rot, rotenone (1 μM); SOD, superoxide dismutase (250 U/mL). (J) Representative images of isolated gastrocnemius (top) and TA (bottom) muscles that demonstrate redness of the mSod2KO muscle. Values are mean ± SEM. *p < 0.05.
Figure S2. Spontaneous home cage activity. Mice were individually housed in cages with motion and activity detector units. (A) Hourly activity during 24 hours divided by lights on or off. (B) Average hourly activity during Light Phase and Dark Phase. n = 6. Values are mean ± SEM.
Figure S3. Mitochondrial DNA variants. (A) Total frequency of mitochondrial DNA variants from gastrocnemius (n = 8–9). (B) Nucleotide‐specific variant frequencies of mitochondrial DNA (n = 4–9). (C) A circos plot image demonstrating single nucleotide variants higher than 1% from WT (black) and mSod2KO (red).
Figure S4. Isoform and subunit expression of the enzymes involved in beta‐oxidation. Gastrocnemius muscle homogenate was used to determine protein abundance (n = 6). Data are shown as pmol per 100 μg protein. Values are mean ± SEM. *p < 0.05. Abbreviation: Cpt, carnitine palmitoyltransferase. See Table 2 for gene id and protein names.
Figure S5. Isoform and subunit expression of antioxidant enzymes. Gastrocnemius muscle homogenate was used for the data (n = 6). Data are shown as pmol per 100 μg protein. Values are mean ± SEM. *p < 0.05. Abbreviations: Sod, superoxide dismutase; Prx, peroxiredoxin; Trx, thioredoxin; TR, thioredoxin reductase; GSH, glutathione; Gpx, glutathione peroxidase; GR, glutathione reductase; Cat, catalase. See Table 2 for gene id and protein names.
Figure S6. In vitro contractile properties of isolated fast (EDL) and slow (soleus) twitch muscles. (A) Transmission electron microscopic (TEM) images showing sarcomeric proteins and two subpopulations of mitochondria, subsarcollemal (SS) and intermyofibrillar (IMF) mitochondria. M; M‐line, Z; Z‐disc. White arrow heads, mitochondria. Isometric maximum specific force (sFo, N/cm2), force per cross‐sectional area in EDL (B) and soleus (C). Relative force (percent of initial) during fatigue protocol in EDL (C) and soleus (D). n = 6. Values are mean ± SEM. *p < 0.05.
Figure S7. Muscle mass and mitochondrial ATP generation rate in 6–8 months old male mice. (A) Isolated skeletal muscle mass. Abbreviations: Gast, gastrocnemius; Sol, soleus; TA, tibialis anterior; EDL, extensor digitorum longus; Quad, quadriceps. (B) Rate of ATP generation from isolated skeletal muscle mitochondria from male mice (n = 3). Values are mean ± SEM. *p < 0.05. Abbreviations: GM, glutamate and malate; Suc, succinate; Rot, Rotenone.
Table S1. Enzymes in glycolysis and gluconeogenesis. Gastrocnemius muscle homogenate was used determine protein abundance (n = 6). Data are shown as pmol per 100 μg protein. Values are mean ± SEM. *p < 0.05. See Table 2 for gene id and protein names.
Table S2. Gene IDs and protein names in TCA cycle (A), beta‐oxidation (B), antioxidant enzymes (C) and glucose metabolism (D).
Table S3. List of antibody catalog numbers and qRT‐PCR primer sequences.
Acknowledgements
The authors would like to thank the Targeted DNA Methylation & Mitochondrial Heteroplasmy, Integrative Redox Biology, and Multiplex Protein Quantification Cores at Nathan Shock Center for sharing their expertise. The authors certify that they comply with the ethical guidelines for authorship and publishing of the Journal of Cachexia, Sarcopenia and Muscle.66
Ahn, B. , Ranjit, R. , Premkumar, P. , Pharaoh, G. , Piekarz, K. M. , Matsuzaki, S. , Claflin, D. R. , Riddle, K. , Judge, J. , Bhaskaran, S. , Satara Natarajan, K. , Barboza, E. , Wronowski, B. , Kinter, M. , Humphries, K. M. , Griffin, T. M. , Freeman, W. M. , Richardson, A. , Brooks, S. V. , and Van Remmen, H. (2019) Mitochondrial oxidative stress impairs contractile function but paradoxically increases muscle mass via fibre branching. Journal of Cachexia, Sarcopenia and Muscle, 10: 411–428. 10.1002/jcsm.12375.
References
- 1. Muller FL, Song W, Liu Y, Chaudhuri A, Pieke‐Dahl S, Strong R, et al. Absence of CuZn superoxide dismutase leads to elevated oxidative stress and acceleration of age‐dependent skeletal muscle atrophy. Free Radic Biol Med 2006;40:1993–2004. [DOI] [PubMed] [Google Scholar]
- 2. Jang YC, Lustgarten MS, Liu Y, Muller FL, Bhattacharya A, Liang H, et al. Increased superoxide in vivo accelerates age‐associated muscle atrophy through mitochondrial dysfunction and neuromuscular junction degeneration. FASEB J 2010;24:1376–1390. [DOI] [PMC free article] [PubMed] [Google Scholar]
- 3. Boengler K, Kosiol M, Mayr M, Schulz R, Rohrbach S. Mitochondria and ageing: role in heart, skeletal muscle and adipose tissue. J Cachexia Sarcopenia Muscle 2017;8:349–369. [DOI] [PMC free article] [PubMed] [Google Scholar]
- 4. Muller FL, Song W, Jang YC, Liu Y, Sabia M, Richardson A, et al. Denervation‐induced skeletal muscle atrophy is associated with increased mitochondrial ROS production. Am J Physiol Regul Integr Comp Physiol 2007;293:R1159–R1168. [DOI] [PubMed] [Google Scholar]
- 5. Csukly K, Ascah A, Matas J, Gardiner PF, Fontaine E, Burelle Y. Muscle denervation promotes opening of the permeability transition pore and increases the expression of cyclophilin D. J Physiol (Lond) 2006;574:319–327. [DOI] [PMC free article] [PubMed] [Google Scholar]
- 6. Brown JL, Rosa‐Caldwell ME, Lee DE, Blackwell TA, Brown LA, Perry RA, et al. Mitochondrial degeneration precedes the development of muscle atrophy in progression of cancer cachexia in tumour‐bearing mice. J Cachexia Sarcopenia Muscle 2017;8:926–938. [DOI] [PMC free article] [PubMed] [Google Scholar]
- 7. Plant DR, Gregorevic P, Williams DA, Lynch GS. Redox modulation of maximum force production of fast‐and slow‐twitch skeletal muscles of rats and mice. J Appl Physiol 2001;90:832–838. [DOI] [PubMed] [Google Scholar]
- 8. McClung JM, Judge AR, Talbert EE, Powers SK. Calpain‐1 is required for hydrogen peroxide‐induced myotube atrophy. Am J Physiol Cell Physiol 2009;296:C363–C371. [DOI] [PMC free article] [PubMed] [Google Scholar]
- 9. Larkin LM, Davis CS, Sims‐Robinson C, Kostrominova TY, Van Remmen H, Richardson A, et al. Skeletal muscle weakness due to deficiency of CuZn‐superoxide dismutase is associated with loss of functional innervation. Am J Physiol Regul Integr Comp Physiol 2011;301:R1400–R1407. [DOI] [PMC free article] [PubMed] [Google Scholar]
- 10. Shi Y, Ivannikov MV, Walsh ME, Liu Y, Zhang Y, Jaramillo CA, et al. The lack of CuZnSOD leads to impaired neurotransmitter release, neuromuscular junction destabilization and reduced muscle strength in mice. PLoS ONE 2014;9:e100834. [DOI] [PMC free article] [PubMed] [Google Scholar]
- 11. Jang YC, Liu Y, Hayworth CR, Bhattacharya A, Lustgarten MS, Muller FL, et al. Dietary restriction attenuates age‐associated muscle atrophy by lowering oxidative stress in mice even in complete absence of CuZnSOD. Aging Cell 2012;11:770–782. [DOI] [PMC free article] [PubMed] [Google Scholar]
- 12. Sakellariou GK, Davis CS, Shi Y, Ivannikov MV, Zhang Y, Vasilaki A, et al. Neuron‐specific expression of CuZnSOD prevents the loss of muscle mass and function that occurs in homozygous CuZnSOD‐knockout mice. FASEB J 2014;28:1666–1681. [DOI] [PMC free article] [PubMed] [Google Scholar]
- 13. Zhang Y, Davis C, Sakellariou GK, Shi Y, Kayani AC, Pulliam D, et al. CuZnSOD gene deletion targeted to skeletal muscle leads to loss of contractile force but does not cause muscle atrophy in adult mice. FASEB J 2013;27:3536–3548. [DOI] [PMC free article] [PubMed] [Google Scholar]
- 14. Vasilaki A, Richardson A, Van Remmen H, Brooks SV, Larkin L, McArdle A, et al. Role of nerve‐muscle interactions and reactive oxygen species in regulation of muscle proteostasis with ageing. J Physiol (Lond) 2017;595:6409–6415. [DOI] [PMC free article] [PubMed] [Google Scholar]
- 15. Lebovitz RM, Zhang H, Vogel H, Cartwright J, Dionne L, Lu N, et al. Neurodegeneration, myocardial injury, and perinatal death in mitochondrial superoxide dismutase‐deficient mice. Proc Natl Acad Sci U S A 1996;93:9782–9787. [DOI] [PMC free article] [PubMed] [Google Scholar]
- 16. Li Y, Huang TT, Carlson EJ, Melov S, Ursell PC, Olson JL, et al. Dilated cardiomyopathy and neonatal lethality in mutant mice lacking manganese superoxide dismutase. Nat Genet 1995;11:376–381. [DOI] [PubMed] [Google Scholar]
- 17. Van Remmen H, Ikeno Y, Hamilton M, Pahlavani M, Wolf N, Thorpe SR, et al. Life‐long reduction in MnSOD activity results in increased DNA damage and higher incidence of cancer but does not accelerate aging. Physiol Genomics 2003;16:29–37. [DOI] [PubMed] [Google Scholar]
- 18. Mansouri A, Muller FL, Liu Y, Ng R, Faulkner J, Hamilton M, et al. Alterations in mitochondrial function, hydrogen peroxide release and oxidative damage in mouse hind‐limb skeletal muscle during aging. Mech Ageing Dev 2006;127:298–306. [DOI] [PubMed] [Google Scholar]
- 19. Lustgarten MS, Jang YC, Liu Y, Muller FL, Qi W, Steinhelper M, et al. Conditional knockout of Mn‐SOD targeted to type IIB skeletal muscle fibers increases oxidative stress and is sufficient to alter aerobic exercise capacity. Am J Physiol Cell Physiol 2009;297:C1520–C1532. [DOI] [PMC free article] [PubMed] [Google Scholar]
- 20. Lustgarten MS, Jang YC, Liu Y, Qi W, Qin Y, Dahia PL, et al. MnSOD deficiency results in elevated oxidative stress and decreased mitochondrial function but does not lead to muscle atrophy during aging. Aging Cell 2011;10:493–505. [DOI] [PMC free article] [PubMed] [Google Scholar]
- 21. Kuwahara H, Horie T, Ishikawa S, Tsuda C, Kawakami S, Noda Y, et al. Oxidative stress in skeletal muscle causes severe disturbance of exercise activity without muscle atrophy. Free Radic Biol Med 2010;48:1252–1262. [DOI] [PubMed] [Google Scholar]
- 22. Ikegami T, Suzuki Y, Shimizu T, Isono K, Koseki H, Shirasawa T. Model mice for tissue‐specific deletion of the manganese superoxide dismutase (MnSOD) gene. Biochem Biophys Res Commun 2002;296:729–736. [DOI] [PubMed] [Google Scholar]
- 23. Muller FL, Liu Y, Abdul‐Ghani MA, Lustgarten MS, Bhattacharya A, Jang YC, et al. High rates of superoxide production in skeletal‐muscle mitochondria respiring on both complex I‐ and complex II‐linked substrates. Biochem J 2008;409:491–499. [DOI] [PubMed] [Google Scholar]
- 24. Picard M, Csukly K, Robillard M‐E, Godin R, Ascah A, Bourcier‐Lucas C, et al. Resistance to Ca2+‐induced opening of the permeability transition pore differs in mitochondria from glycolytic and oxidative muscles. Am J Physiol Regul Integr Comp Physiol 2008;295:R659–R668. [DOI] [PubMed] [Google Scholar]
- 25. Kuznetsov AV, Veksler V, Gellerich FN, Saks V, Margreiter R, Kunz WS. Analysis of mitochondrial function in situ in permeabilized muscle fibers, tissues and cells. Nat Protoc 2008;3:965–976. [DOI] [PubMed] [Google Scholar]
- 26. Krumschnabel G, Fontana‐Ayoub M, Sumbalova Z, Heidler J, Gauper K, Fasching M, et al. Simultaneous high‐resolution measurement of mitochondrial respiration and hydrogen peroxide production. Methods Mol Biol 2015;1264:245–261. [DOI] [PubMed] [Google Scholar]
- 27. Matsuzaki S, Kotake Y, Humphries KM. Identification of mitochondrial electron transport chain‐mediated NADH radical formation by EPR spin‐trapping techniques. Biochemistry 2011;50:10792–10803. [DOI] [PubMed] [Google Scholar]
- 28. Roberts LJ, Morrow JD. Measurement of F(2)‐isoprostanes as an index of oxidative stress in vivo. Free Radic Biol Med 2000;28:505–513. [DOI] [PubMed] [Google Scholar]
- 29. McLain AL, Cormier PJ, Kinter M, Szweda LI. Glutathionylation of α‐ketoglutarate dehydrogenase: the chemical nature and relative susceptibility of the cofactor lipoic acid to modification. Free Radic Biol Med 2013;61:161–169. [DOI] [PMC free article] [PubMed] [Google Scholar]
- 30. Avner BS, Hinken AC, Yuan C, Solaro RJ. H2O2 alters rat cardiac sarcomere function and protein phosphorylation through redox signaling. Am J Physiol Heart Circ Physiol 2010;299:H723–H730. [DOI] [PMC free article] [PubMed] [Google Scholar]
- 31. Chaudhuri AR, de Waal EM, Pierce A, Van Remmen H, Ward WF, Richardson A. Detection of protein carbonyls in aging liver tissue: a fluorescence‐based proteomic approach. Mech Ageing Dev 2006;127:849–861. [DOI] [PubMed] [Google Scholar]
- 32. Lane RS, Fu Y, Matsuzaki S, Kinter M, Humphries KM, Griffin TM. Mitochondrial respiration and redox coupling in articular chondrocytes. Arthritis Res Ther 2015;17:54. [DOI] [PMC free article] [PubMed] [Google Scholar]
- 33. Claflin DR, Brooks SV. Direct observation of failing fibers in muscles of dystrophic mice provides mechanistic insight into muscular dystrophy. Am J Physiol Cell Physiol 2008;294:C651–C658. [DOI] [PubMed] [Google Scholar]
- 34. Qaisar R, Bhaskaran S, Premkumar P, Ranjit R, Natarajan KS, Ahn B, et al. Oxidative stress‐induced dysregulation of excitation‐contraction coupling contributes to muscle weakness: oxidative stress causes muscle defect via calcium imbalance. J Cachexia Sarcopenia Muscle 2018; 10.1002/jcsm.12339. [DOI] [PMC free article] [PubMed] [Google Scholar]
- 35. Fu MH, Tupling AR. Protective effects of Hsp70 on the structure and function of SERCA2a expressed in HEK‐293 cells during heat stress. Am J Physiol Heart Circ Physiol 2009;296:H1175–H1183. [DOI] [PubMed] [Google Scholar]
- 36. Falk DJ, Todd AG, Lee S, Soustek MS, ElMallah MK, Fuller DD, et al. Peripheral nerve and neuromuscular junction pathology in Pompe disease. Hum Mol Genet 2015;24:625–636. [DOI] [PMC free article] [PubMed] [Google Scholar]
- 37. Faber RM, Hall JK, Chamberlain JS, Banks GB. Myofiber branching rather than myofiber hyperplasia contributes to muscle hypertrophy in mdx mice. Skelet Muscle 2014;4:10. [DOI] [PMC free article] [PubMed] [Google Scholar]
- 38. Roberts BM, Ahn B, Smuder AJ, Al‐Rajhi M, Gill LC, Beharry AW, et al. Diaphragm and ventilatory dysfunction during cancer cachexia. FASEB J 2013;27:2600–2610. [DOI] [PMC free article] [PubMed] [Google Scholar]
- 39. Ahn B, Pharaoh G, Premkumar P, Huseman K, Ranjit R, Kinter M, et al. Nrf2 deficiency exacerbates age‐related contractile dysfunction and loss of skeletal muscle mass. Redox Biol 2018;17:47–58. [DOI] [PMC free article] [PubMed] [Google Scholar]
- 40. Masser DR, Clark NW, Van Remmen H, Freeman WM. Loss of the antioxidant enzyme CuZnSOD (Sod1) mimics an age‐related increase in absolute mitochondrial DNA copy number in the skeletal muscle. Age (Dordr) 2016;38:323–333. [DOI] [PMC free article] [PubMed] [Google Scholar]
- 41. Masser DR, Otalora L, Clark NW, Kinter MT, Elliott MH, Freeman WM. Functional changes in the neural retina occur in the absence of mitochondrial dysfunction in a rodent model of diabetic retinopathy. J Neurochem 2017;143:595–608. [DOI] [PMC free article] [PubMed] [Google Scholar]
- 42. Williams MD, Van Remmen H, Conrad CC, Huang TT, Epstein CJ, Richardson A. Increased oxidative damage is correlated to altered mitochondrial function in heterozygous manganese superoxide dismutase knockout mice. J Biol Chem 1998;273:28510–28515. [DOI] [PubMed] [Google Scholar]
- 43. Picard M, Ritchie D, Wright KJ, Romestaing C, Thomas MM, Rowan SL, et al. Mitochondrial functional impairment with aging is exaggerated in isolated mitochondria compared to permeabilized myofibers. Aging Cell 2010;9:1032–1046. [DOI] [PubMed] [Google Scholar]
- 44. Webster RP, Roberts VHJ, Myatt L. Protein nitration in placenta—functional significance. Placenta 2008;29:985–994. [DOI] [PMC free article] [PubMed] [Google Scholar]
- 45. Sakellariou GK, Lightfoot AP, Earl KE, Stofanko M, McDonagh B. Redox homeostasis and age‐related deficits in neuromuscular integrity and function. J Cachexia Sarcopenia Muscle 2017;8:881–906. [DOI] [PMC free article] [PubMed] [Google Scholar]
- 46. McLain AL, Szweda PA, Szweda LI. α‐Ketoglutarate dehydrogenase: a mitochondrial redox sensor. Free Radic Res 2011;45:29–36. [DOI] [PMC free article] [PubMed] [Google Scholar]
- 47. Gordon AM, Homsher E, Regnier M. Regulation of contraction in striated muscle. Physiol Rev 2000;80:853–924. [DOI] [PubMed] [Google Scholar]
- 48. Morrow RM, Picard M, Derbeneva O, Leipzig J, McManus MJ, Gouspillou G, et al. Mitochondrial energy deficiency leads to hyperproliferation of skeletal muscle mitochondria and enhanced insulin sensitivity. Proc Natl Acad Sci U S A 2017;114:2705–2710. [DOI] [PMC free article] [PubMed] [Google Scholar]
- 49. Lin J, Wu H, Tarr PT, Zhang C‐Y, Wu Z, Boss O, et al. Transcriptional co‐activator PGC‐1α drives the formation of slow‐twitch muscle fibres. Nature 2002;418:797–801. [DOI] [PubMed] [Google Scholar]
- 50. Weiss ES, Wang KKW, Allen JG, Blue ME, Nwakanma LU, Liu MC, et al. Alpha II‐spectrin breakdown products serve as novel markers of brain injury severity in a canine model of hypothermic circulatory arrest. Ann Thorac Surg 2009;88:543–550. [DOI] [PMC free article] [PubMed] [Google Scholar]
- 51. Haller RG, Henriksson KG, Jorfeldt L, Hultman E, Wibom R, Sahlin K, et al. Deficiency of skeletal muscle succinate dehydrogenase and aconitase. Pathophysiology of exercise in a novel human muscle oxidative defect. J Clin Invest 1991;88:1197–1206. [DOI] [PMC free article] [PubMed] [Google Scholar]
- 52. Larsson LE, Linderholm H, Mueller R, Ringqvist T, Soernaes R. Hereditary metabolic myopathy with paroxysmal myoglobinuria due to abnormal glycolysis. J Neurol Neurosurg Psychiatry 1964;27:361–380. [DOI] [PMC free article] [PubMed] [Google Scholar]
- 53. Quirós PM, Langer T, López‐Otín C. New roles for mitochondrial proteases in health, ageing and disease. Nat Rev Mol Cell Biol 2015;16:345–359. [DOI] [PubMed] [Google Scholar]
- 54. Nojiri H, Shimizu T, Funakoshi M, Yamaguchi O, Zhou H, Kawakami S, et al. Oxidative stress causes heart failure with impaired mitochondrial respiration. J Biol Chem 2006;281:33789–33801. [DOI] [PubMed] [Google Scholar]
- 55. Tsuda M, Fukushima A, Matsumoto J, Takada S, Kakutani N, Nambu H, et al. Protein acetylation in skeletal muscle mitochondria is involved in impaired fatty acid oxidation and exercise intolerance in heart failure. J Cachexia Sarcopenia Muscle 2018; 10.1002/jcsm.12322. [DOI] [PMC free article] [PubMed] [Google Scholar]
- 56. Powers SK, Jackson MJ. Exercise‐induced oxidative stress: cellular mechanisms and impact on muscle force production. Physiol Rev 2008;88:1243–1276. [DOI] [PMC free article] [PubMed] [Google Scholar]
- 57. Gonzalez‐Freire M, Adelnia F, Moaddel R, Ferrucci L. Searching for a mitochondrial root to the decline in muscle function with ageing. J Cachexia Sarcopenia Muscle 2018;9:435–440. [DOI] [PMC free article] [PubMed] [Google Scholar]
- 58. Giniatullin AR, Giniatullin RA. Dual action of hydrogen peroxide on synaptic transmission at the frog neuromuscular junction. J Physiol (Lond) 2003;552:283–293. [DOI] [PMC free article] [PubMed] [Google Scholar]
- 59. Kornegay JN, Childers MK, Bogan DJ, Bogan JR, Nghiem P, Wang J, et al. The paradox of muscle hypertrophy in muscular dystrophy. Phys Med Rehabil Clin N Am 2012;23:149–xii. [DOI] [PMC free article] [PubMed] [Google Scholar]
- 60. Webster C, Silberstein L, Hays AP, Blau HM. Fast muscle fibers are preferentially affected in Duchenne muscular dystrophy. Cell 1988;52:503–513. [DOI] [PubMed] [Google Scholar]
- 61. Karpati G, Carpenter S, Prescott S. Small‐caliber skeletal muscle fibers do not suffer necrosis in mdx mouse dystrophy. Muscle Nerve 1988;11:795–803. [DOI] [PubMed] [Google Scholar]
- 62. Mackey AL, Kjaer M. The breaking and making of healthy adult human skeletal muscle in vivo. Skelet Muscle 2017;7:24. [DOI] [PMC free article] [PubMed] [Google Scholar]
- 63. Blaivas M, Carlson BM. Muscle fiber branching—difference between grafts in old and young rats. Mech Ageing Dev 1991;60:43–53. [DOI] [PubMed] [Google Scholar]
- 64. Lovering RM, Michaelson L, Ward CW. Malformed mdx myofibers have normal cytoskeletal architecture yet altered EC coupling and stress‐induced Ca2+ signaling. Am J Physiol Cell Physiol 2009;297:C571–C580. [DOI] [PMC free article] [PubMed] [Google Scholar]
- 65. Lynch GS, Hinkle RT, Chamberlain JS, Brooks SV, Faulkner JA. Force and power output of fast and slow skeletal muscles from mdx mice 6‐28 months old. J Physiol (Lond) 2001;535:591–600. [DOI] [PMC free article] [PubMed] [Google Scholar]
- 66. von Haehling S, Morley JE, Coats AJS, Anker SD. Ethical guidelines for publishing in the journal of cachexia, sarcopenia and muscle: update 2017. J Cachexia Sarcopenia Muscle 2017;8:1081–1083. [DOI] [PMC free article] [PubMed] [Google Scholar]
Associated Data
This section collects any data citations, data availability statements, or supplementary materials included in this article.
Supplementary Materials
Figure S1. The mSod2KO mice exhibit skeletal muscle specific loss of MnSOD activity and dramatic loss of complex II activity in electron transport chain (ETC). (A) A representative image showing activities of MnSOD and CuZnSOD in skeletal and cardiac muscle homogenates. (B) Immunoblot analysis using gastrocnemius muscle homogenates shows protein abundance of MnSOD in WT, but not in mSod2KO (n = 7–8/group). (C) A representative PCR results showing deletion of floxed site by human skeletal actin (HAS) cre recombinase. (D) Representative SDH activity performed on sections of gastrocnemius muscle. (E) Representative profile of spectrophotometric SDH activity using isolated mitochondria (25 μg/mL) from gastrocnemius. Activation of the SDH enzyme was achieved by 2 min incubation with succinate. (F) Quantification of the succinate consumption rate at active conditions (n = 2). (G) mRNA levels of SDH subunits (n = 7–8). (H) Protein expression of SDH subunits determined by mass spectrometry (n = 6). (I) Representative EPR spectra for measurement of mitochondrial superoxide release rate using isolated skeletal muscle mitochondria with or without superoxide dismutase. Abbreviations (concentrations): glu, glutamate (25 mM); mal, malate (2.5 mM); suc, succinate (25 mM); rot, rotenone (1 μM); SOD, superoxide dismutase (250 U/mL). (J) Representative images of isolated gastrocnemius (top) and TA (bottom) muscles that demonstrate redness of the mSod2KO muscle. Values are mean ± SEM. *p < 0.05.
Figure S2. Spontaneous home cage activity. Mice were individually housed in cages with motion and activity detector units. (A) Hourly activity during 24 hours divided by lights on or off. (B) Average hourly activity during Light Phase and Dark Phase. n = 6. Values are mean ± SEM.
Figure S3. Mitochondrial DNA variants. (A) Total frequency of mitochondrial DNA variants from gastrocnemius (n = 8–9). (B) Nucleotide‐specific variant frequencies of mitochondrial DNA (n = 4–9). (C) A circos plot image demonstrating single nucleotide variants higher than 1% from WT (black) and mSod2KO (red).
Figure S4. Isoform and subunit expression of the enzymes involved in beta‐oxidation. Gastrocnemius muscle homogenate was used to determine protein abundance (n = 6). Data are shown as pmol per 100 μg protein. Values are mean ± SEM. *p < 0.05. Abbreviation: Cpt, carnitine palmitoyltransferase. See Table 2 for gene id and protein names.
Figure S5. Isoform and subunit expression of antioxidant enzymes. Gastrocnemius muscle homogenate was used for the data (n = 6). Data are shown as pmol per 100 μg protein. Values are mean ± SEM. *p < 0.05. Abbreviations: Sod, superoxide dismutase; Prx, peroxiredoxin; Trx, thioredoxin; TR, thioredoxin reductase; GSH, glutathione; Gpx, glutathione peroxidase; GR, glutathione reductase; Cat, catalase. See Table 2 for gene id and protein names.
Figure S6. In vitro contractile properties of isolated fast (EDL) and slow (soleus) twitch muscles. (A) Transmission electron microscopic (TEM) images showing sarcomeric proteins and two subpopulations of mitochondria, subsarcollemal (SS) and intermyofibrillar (IMF) mitochondria. M; M‐line, Z; Z‐disc. White arrow heads, mitochondria. Isometric maximum specific force (sFo, N/cm2), force per cross‐sectional area in EDL (B) and soleus (C). Relative force (percent of initial) during fatigue protocol in EDL (C) and soleus (D). n = 6. Values are mean ± SEM. *p < 0.05.
Figure S7. Muscle mass and mitochondrial ATP generation rate in 6–8 months old male mice. (A) Isolated skeletal muscle mass. Abbreviations: Gast, gastrocnemius; Sol, soleus; TA, tibialis anterior; EDL, extensor digitorum longus; Quad, quadriceps. (B) Rate of ATP generation from isolated skeletal muscle mitochondria from male mice (n = 3). Values are mean ± SEM. *p < 0.05. Abbreviations: GM, glutamate and malate; Suc, succinate; Rot, Rotenone.
Table S1. Enzymes in glycolysis and gluconeogenesis. Gastrocnemius muscle homogenate was used determine protein abundance (n = 6). Data are shown as pmol per 100 μg protein. Values are mean ± SEM. *p < 0.05. See Table 2 for gene id and protein names.
Table S2. Gene IDs and protein names in TCA cycle (A), beta‐oxidation (B), antioxidant enzymes (C) and glucose metabolism (D).
Table S3. List of antibody catalog numbers and qRT‐PCR primer sequences.