Abstract
Purpose:
While meibography has proven useful in identifying structural changes in the meibomian gland (MG), little is known regarding the MG spectral transmission and absorption characteristics. The purpose of this study was to measure the transmission/absorption spectra of the MG compared to other eyelid tissues.
Methods:
Human and rabbit eyelids were fixed in paraformaldehyde, serial sectioned (50 μm) using a cryotome and imaged by brightfield and reflectance microscopy. Eyelid regions (MG, muscle, tarsus and dermis) were then illuminated by a 100 μm spot using a infrared enhanced white light source. Transmission spectra over a 550–950 nm range were then measured using a spectrometer and differences compared using two-way analysis of variance.
Results:
Brightfield microscopy of both human and rabbit eyelid tissue showed a marked decrease in light transmission for MG acini compared to other eyelid tissues. In rabbit, the dermis showed 5 × and the muscle showed 2 × more light transmission compared to MG (P < .001 and P < .001, respectively). For human, the muscle showed 14 × and the tarsus showed 84 × more light transmission compared to MG (P < .01 and P < .001, respectively). No specific spectral region of light absorption could be detected in either rabbit or human MG. Loss of light transmission in MG was localized to acini containing small lipid droplets, averaging 2.7 ± 0.8 μm in diameter.
Conclusions:
The data suggest that light transmission is dramatically reduced in the acini due to light scattering by small lipid droplets, suggesting that Meibography detects active lipid synthesis in differentiating meibocytes.
Keywords: Meibomian gland, Meibography, Meiboscopy, Light transmission
1. Introduction
Dry eye syndrome is a common eye disorder comprising both an aqueous deficient and evaporative dry eye disease [1]. One of the major causes of evaporative dry eye syndrome is meibomian gland dysfunction (MGD) [1–3]. Meibomian glands are modified sebaceous glands that are embedded in the tarsal plate, underlying the orbicularis muscle of both the upper and lower eyelids [4]. The meibomian gland excretes oil, or meibum, onto ocular surface, which forms part of the lipid layer of the tear film. Thinning of the lipid layer caused by meibomian gland dysfunction (MGD) leads to excessive evaporation of water from the ocular surface leading to increased tear osmolarity, ocular surface damage and evaporative dry eye syndrome [5,6].
Detection of MGD has relied principally on meibography, which is an imaging technique used to detect meibomian gland dropout [7,8]. Traditional meibography uses transilluminated light applied to the skin side of the eyelid with imaging of the glands taken from the conjunctival side using an infrared detector or film [9,10]. Using transillumination meibography, meibomian glands appear as dark, grape like clusters of acini that extend the length of the tarsal plate. More recently a noncontact form of meibography has been developed that uses an infrared light source focused on the conjunctiva [11]. In noncontact meibography, acini appear as bright clusters within the tarsal plate.
Why acini of meibomian glands show distinct differences in their transillumination and reflected light appearance is not known, but likely involves the spectral absorption/scattering characteristics of the gland compared to other eyelid structures. While the spectral absorption characteristics of the eyelid muscle has been previously studied [12], to our knowledge the spectral absorption/scattering characteristics of the meibomian gland have not been previously reported. As suggested by Pult and Nichols in 2012, knowing the spectral absorption characteristics of the meibomian gland may provide better insight into the assessment of gland structure and function [13]. To address this issue, we have measured the spectral absorption profile for the meibomian gland and other eyelid structures including eyelid muscle and tarsal plate. We report that the meibomian gland shows a greatly reduced transmission of light that increases with increased wavelength into the infrared. This pattern appears to be caused by increased light scattering from small lipid droplets within differentiating meibomian gland acinar cells that is likely due to the difference in refractive indices between cell cytoplasm and meibum lipid (1.35 vs 1.48) [14,15]. This increased light scattering and not absorption likely explains the dark appearance on transillumination and the white appearance on reflection of the meibomian gland acini.
2. Methods
2.1. Tissue preparation
Human eyelid tissue was obtained from the upper eyelid of a 64 year-old female with sebaceous cell carcinoma of left upper eyelid and was fixed in 4% paraformaldehyde (PFA). Tissue was obtained from Seoul St. Mary's Hospital as approved by the Institutional Review Board of Seoul St. Mary's Hospital (IRB #KC14TISI0671). PFA fixed rabbit eyelid tissue was obtained from a one-year old New Zealand pigmented rabbit that was humanely sacrificed under an IACUC approved protocol from the University of California, Irvine. Tissues were embedded in O.C.T. Compound (Tissue-Tek, Torrance, CA), snap frozen in liquid nitrogen, and cryo-sectioned using a Leica CM1850 cryostat (Leica Biosystems, Buffalo Grove, IL). Tissue sections (50 μm thick) were collected and placed in phosphate-buffered saline (PBS), pH 7.2 and stored at 4 °C.
2.2. Brightfield microscopy
Tissue sections were mounted onto glass slides (Micro Slides, Corning, NY) in PBS and covered by a thin glass coverslip. Brightfield microscopy was then performed using a Leica DMI6000 B (Leica Microsystems, Wetzlar, Germany) with an automated stage. The eyelid section was then digitally imaged using Metamorph (Molecular Devices, San Jose, CA) and a montage of images over the entire eyelid section were collected and stitched using the Scan Slide subroutine of the imaging application program.
2.3. Reflectance microscopy
Reflectance microscopy of tissue sections was taken with Stereomicroscope (SteREO Discovery.V12, Carl Zeiss Microscopy GmbH, Jena, Germany). Tissue sections were illuminated at a 45° angle respective to the tissue section and images collected using a Nikon D200 digital camera connected to the microscope using a C-mount.
2.4. Measurement of spectral transmission of eyelid structures
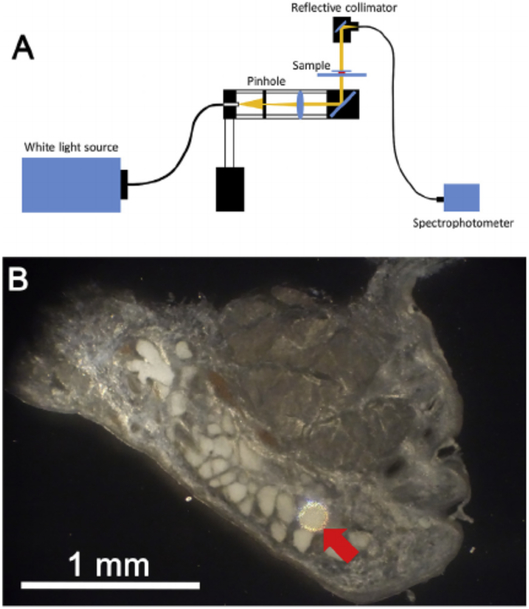
Spectral transmission characteristics of eyelid structures including the meibomian gland acini, muscle, dermis, and tarsus were measured using a spectrometer (CCS200/M, Thorlabs, Newton, NJ) and an infrared-enhanced, broadband white light source (OSL2 and OSL2BIR, Thorlabs, Newton, NJ). Sections were placed on the glass slide with a cover slip, and mounted on a BH2 Olympus microscope (Olympus Optical, Tokyo, Japan). Regions of interest were first identified using a 10 × 0.1 NA, DPlan 4 objective (Olympus, Feasterville, PA). The eyelid structures of interest were then illuminated using the system shown in Fig. 1A that was attached to the BH2 Olympus microscope. Briefly, white light was delivered by a optic fiber cable (M93L01, Thorlabs, Newton, NJ) focused through a 100 μm-diameter pinhole (P100S, Thorlabs, Newton, NJ) and then collimated light directed to specific regions of the eyelid tissue using a mirror (Fig. 1 B). Light passing through the tissue was then collected using a reflective collimator (RC04SMA-P0, Thorlabs, Newton, NJ), which was rotated into place by the objective turret holding the 10 × objective. Light passing through the reflective collimator was then directed to the sensor of the spectrometer. Because the transmitted light through the acinus was very weak, the measurements were done in a dark room.
Fig. 1.
Measurement of eyelid tissue optical transmission. A. Light from a broad spectrum, white light source was focused on a 100 μm diameter pinhole, and light collimated and focused onto the eyelid tissue through a reflecting mirror. Light passing through the eyelid tissue was then reflected to fiber optic cable connected to a spectrometer. B. Reflected light image of rabbit eyelid tissue section showing a 100 μm illuminated spot (Red arrow) that covered the area of a single acini.
The transmittance through the meibomian gland acini, muscle, and dermis were measured for rabbit eyelid and the transmittance through meibomian gland acini, muscle and tarsus were measured for human eyelid. In the rabbit eyelid, ten, thick (50 μm) tissue sections covering multiple meibomian glands, were used. In each section, one point within the acinus, muscle, and dermis was chosen for measuring the transmittance spectrum. In human eyelid, five, thick (50 μm) tissue sections covering 3 meibomian glands were used. In each section, one point within acinus, muscle, and tarsus was chosen for transmittance measurements. First, the light spectrum through a control region of the glass slide, PBS and cover slip was measured (A). Then the light spectrum through glass slide, PBS, tissue section, and cover slip was measured (B). Then transmittance was defined as the ratio (100% *B/A) within the transmittance spectrum from 550-950 nm. For 10 tissue sections of rabbit eyelid, mean transmittance was calculated for each region (acinus, muscle, dermis) by averaging the percent transmittance over the spectral range of 550 nm–950 nm and reported as %T 550-950, and the average and standard deviation calculated for all 10 samples. Differences between regions were determined using Student-Newman-Keuls, multiple comparison, two-way ANOVA. For human tissue, the same analysis was performed on 5 sections and region measurements were made of acinus, muscle and tarsus.
2.5. Lipidtox staining
To measure lipid droplet size, tissue sections were stained with LipidTox (Thermo Fisher Scientific, Eugene, OR), a flouorescent neutral lipid stain. The human eyelid was cryosectioned (10 μm thickness), stained with LipidTox and imaged using a Leica DMI6000 B. Corresponding brightfield microscopy was also performed on the same sample for comparison. To measure lipid droplet size, 5 acini from 5 different tissue sections were evaluated using the count particle sub-routine in the Metamorph image processing software.
3. Results
3.1. Bright field microcopy
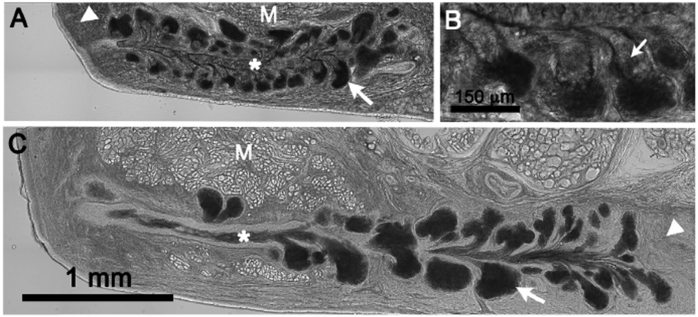
In the rabbit eyelid, meibomian gland acini showed the least transmission of light and appeared darkest by brightfield microscopy (Fig. 2A, arrows). Other structures showing decreased light transmission in descending order included the meibomian gland duct (asterisk), dermis (arrowhead) and orbicularis muscle (M). It was also noted that in the acinus the peripheral area containing early differentiating meibocytes synthesizing lipid appeared the darkest while disintegrated meibocytes adjacent to acinar ductules appeared distinctly brighter (Fig. 2B, small arrows).
Fig. 2.
Brightfield microscopy of the eyelid. A. Rabbit eyelid showing very dark, acinar regions (arrow) indicating markedly decreased light transmission through the tissue section. Other areas showing increased light transmission compared to the acini were the central duct (asterisk), dermis (arrowhead) and orbicularis muscle (M). B. Note that the area adjacent to the acini in the region of disintegrating meibocytes releasing meibum into the short ductules (small arrows) showed increased transmission of light compared to the acini. C. Human eyelid showing similar loss of light transmission through the acini, and increased light transmission through the central duct (asterisk), tarsus (arrowhead) and orbicularis muscle (M).
Similar to the rabbit eyelid, the acinus of human meibomian glands showed the lowest light transmission and appeared to be the darkest structures within the eyelid tissue section (Fig. 2C, arrow). Other structures including the meibomian gland duct (asterisk), tarsus (arrowhead), and orbicularis muscle (M) appear to transmit much great light and appeared noticeably brighter.
3.2. Reflectance microscopy
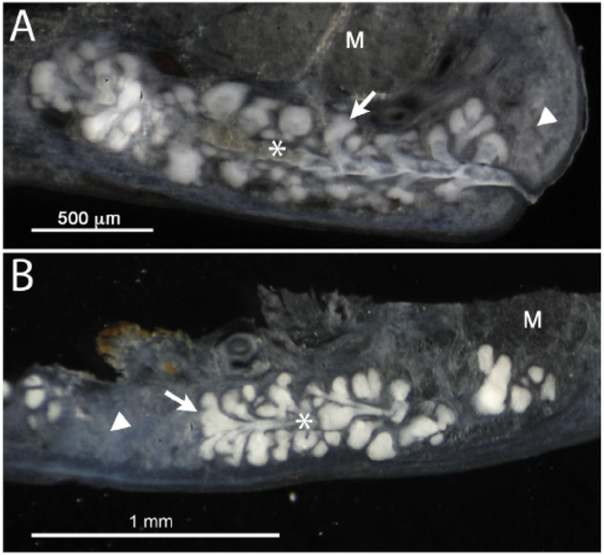
As shown in Fig. 3, reflectance microscopy, where illuminating light is reflected back from the tissue section, showed marked scattering of light from the meibomian gland acini in both the rabbit (A) and human (B) eyelid tissue sections. Light scattering was also detected to a lesser extent in the meibomian gland duct (asterisk), dermis/tarsus (arrowhead) and orbicularis muscle (M).
Fig. 3.
Reflectance microscopy of rabbit (A) and human (B) eyelid tissue section. Note the marked scattering of light from acini (arrow) in both the rabbit and human meibomian gland. Substantially less scattering was detected from the meibomian gland duct (asterisk), dermis in the rabbit (arrowhead), tarsus in the human (arrowhead) and orbicularis muscle (M).
3.3. Transmittance/absorption
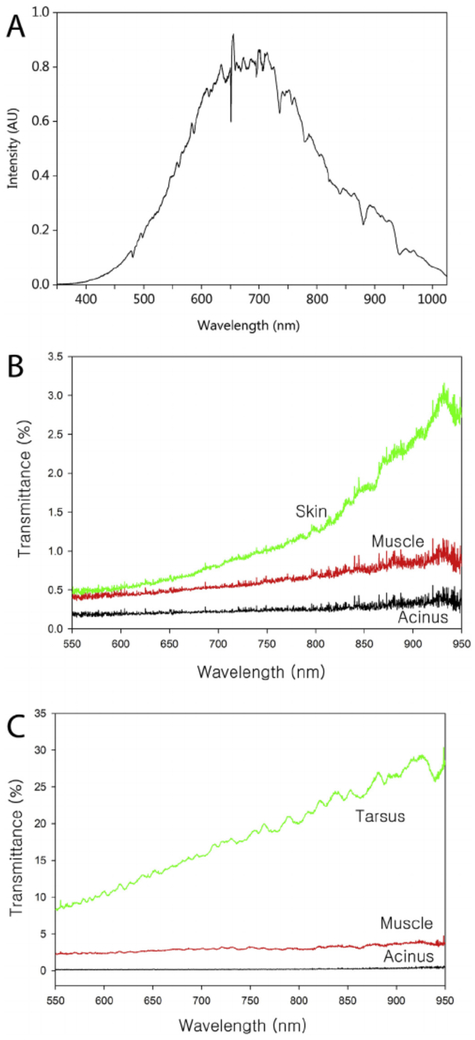
The spectral profile of the IR enhanced light passing through a glass slide, PBS and coverslip, and collected by the spectrometer is shown in Fig. 4A. This spectrum was centered on 650–700 nm and extended from 400 nm to 1000 nm. For analysis of transmission of light through different eyelid structures, light was collected from 550 nm to 950 nm. Typical transmission curves from different regions of the rabbit eyelid are shown in Fig. 4B. For the most part, the rabbit eyelid tissue section showed very little light transmission at the different wavelengths, ranging from less than 0.5% transmission at 550 nm to less than 3.0% transmission at 950 nm depending on the eyelid tissue region. In general, light transmission increased with increasing wavelength as expected. Acini showed the least transmission, having an average %T 550-950 of 0.25 ± 0.09% (Table 1). The orbicularis muscle showed twice the light transmission, averaging 0.63 ± 0.27%, while the dermis showed over 5 times the light transmission, averaging 1.26 ± 0.74%. A typical transmission curve for the human eyelid is shown in Fig. 4C, showing almost no light transmission by the acini, and a %T 550-950 averaging 0.22 ± 0.04% (Table 2), similar to that of the rabbit acini. By comparison, the orbicularis muscle and tarsus showed 14 times and 84 times more light transmission, averaging 3.02 ± 1.35% and 18.34 ± 5.47% respectively (Table 2). Overall, there was a statistically significant difference between all three eyelid structures in both rabbit and human with acini showing the least transmission and dermis/tarsus showing the greatest.
Fig. 4.
A. Spectral intensity curve for the infrared enhanced light that was passed through a glass side, PBS and coverslip. This spectrum was used as a control for measuring the percentage of light transmission through the different eyelid tissue sections. B. Percent transmission of light for rabbit eyelid tissue regions as a function of wavelength from 550 nm to 950 nm. Note that there was very low light transmission in the different regions, with the lowest transmission detected for the acini at less than 0.5%/wavelength and the highest was skin at 3% transmission at 925 nm. C. Percent transmission of light for human eyelid tissue regions. Note that like the rabbit, the acini region shows almost no transmission of light. In contrast, other regions including the muscle and tarsus show greater transmission of light compared to the rabbit eyelid.
Table 1.
Average %T550-950 for rabbit eyelid.
| Slide# | Acinus | Muscle | Dermis |
|---|---|---|---|
| 57 | 0.27 | 0.40 | 1.65 |
| 65 | 0.15 | 0.44 | 0.80 |
| 74 | 0.41 | 1.19 | 2.70 |
| 84 | 0.16 | 0.64 | 0.62 |
| 91 | 0.30 | 0.65 | 2.43 |
| 61 | 0.36 | 0.99 | 0.93 |
| 70 | 0.21 | 0.64 | 0.85 |
| 75 | 0.25 | 0.43 | 0.91 |
| 80 | 0.29 | 0.43 | 0.95 |
| 87 | 0.12 | 0.47 | 0.74 |
| Mean ± SDa | 0.25 ± 0.09 | 0.63 ± 0.27 | 1.26 ± 0.74 |
| P-valueb | – | < .001 | < .001 |
SD (Standard deviation).
Student-Newman-Keuls, multiple comparison of acini to muscle and dermis.
Table 2.
Average %T550-950 for human eyelid.
| Slide# | Acinus | Muscle | Tarsus |
|---|---|---|---|
| 25 | 0.21 | 3.08 | 26.36 |
| 28 | 0.16 | 2.21 | 19.47 |
| 38 | 0.26 | 5.34 | 18.64 |
| 40 | 0.23 | 2.28 | 11.48 |
| 47 | 0.23 | 2.17 | 15.75 |
| Mean ± SDa | 0.22 ± 0.04 | 3.02 ± 1.35 | 18.34 ± 5.47 |
| P-valueb | – | < .01 | < .001 |
SD (Standard deviation).
Student-Newman-Keuls, multiple comparison of acini to muscle and tarsus.
3.4. Lipidtox stain
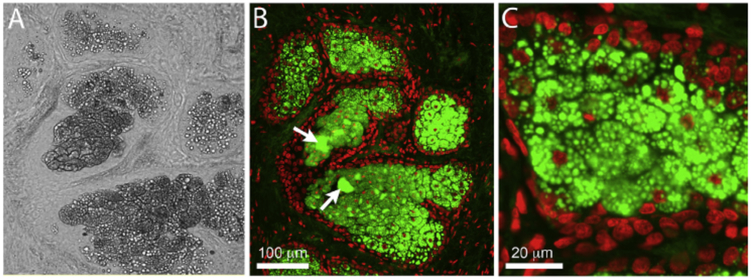
LipidTox staining of human eyelid tissue revealed that meibomian gland acinar regions characterized by diminished light transmission using brightfield microscopy (Fig. 5A) were filled with small diameter, neutral lipid droplets (Fig. 5B and C). The mean lipid droplet diameter in these more peripheral regions of the acinus averaged 2.7 ± 0.8 μm. At the interface between the acinus and the duct much larger lipid droplets over 40 μm in diameter were detected (Fig. 5B, arrows), most likely associated with disintegration of acinar cells and the coalescence of lipid droplets to form mature meibum.
Fig. 5.
Brightfield (A) and fluorescent imaging (B and C) of LipidTox stained human eyelid tissue showing presence of small lipid droplets in regions of diminished light transmission within the meibomian gland acini.
To confirm the role of lipid droplets in blocking light transmission through the meibomian gland, rabbit eyelid tissue sections were imaged using brightfield microscopy before (Fig. 6A) and after (Fig. 6B) 10 min extraction in acetone to remove tissue lipids. As shown in Fig. 6, acetone extraction markedly increased the transmission of light through the acini of the meibomian gland. No effects on light transmission of other eyelid structures were noted, such as eyelid cilia (arrow).
Fig. 6.
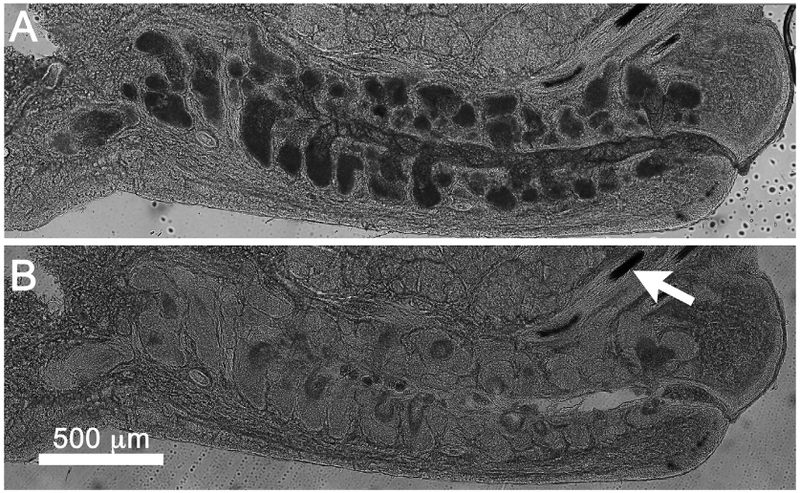
Brightfield image of thick rabbit eyelid tissue section before (A) and after (B) acetone extraction. Note that acinar regions show marked increase in light transmission after acetone treatment and extraction of lipid from intracellular droplets. No change in light transmission was detected for other tissue regions including the eyelid cilia (arrow).
4. Discussions
In this paper we report on the spectral transmission of light through the meibomian gland acinus and surrounding tissues in the rabbit and human eyelid and show that the meibomian gland acinus transmits 2 to 5 times less light compared to orbicularis and dermis in the rabbit and 14 to 84 times less light compared to orbicularis and tarsus in the human over the spectral range from 550 nm to 950 nm. While Borchman et al. has used infrared spectroscopy to measure the chemical composition of purified meibum and tear film lipids [16], to our knowledge this is the first report to document the IR enhanced, white light transmission properties of different eyelid structures. Previous work by Bierman et al. measured spectral transmittance through the full thickness eyelid in 27 human subjects [12]; however, the transmission properties were only localized to the intact eyelid and not specific structures, as well as only covering the visible light spectrum from 450 nm to 650 nm. While they detected drops in light transmission from 515 nm to 600 nm due to absorption by oxy- and deoxyhemoglobin, in general light transmission increased with increasing wavelength, a similar finding detected in our study. In our study we did not detect any decrease in transmission from 515 nm to 600 nm, most likely due to the fact that the eyelid tissue was fixed and sectioned to facilitate transmission spectral measurement in specific eyelid structures. Another important difference in our study was to expanded spectral range from 650 nm to 950 nm, which covers the frequently used spectral wavelengths used in transillumination and non-contact meibography.
In this experiment, the transmittance of light through the meibomian gland acini was very low compared to light transmission through other eyelid tissues structures. This finding was consistent with the brightfield microscopy images of the eyelid, which showed dramatic loss of light transmission localized to the acini of the meibomian gland, again consistent with transillumination meibography images of the eyelid that show meibomian glands as clusters of hypotransilluminated spots [9,10]. Using reflected light imaging, the acini showed markedly enhanced light scattering compared to other eyelid structures, suggesting that differential light scattering from the acini compared to other eyelid tissue structures is the primary mechanism by which meibography is capable of detecting the meibomian gland. This is confirmed by the finding that there was no spectral wavelength from 550 nm to 950 nm that showed enhanced light absorption, indicating that the differences in light transmission was due to physical light scattering rather than chemical absorption by meibum lipid.
Importantly, meibomian gland acinar regions showing the greatest decrease in light transmission by brightfield microscopy was associated with the presence of small lipid droplets detected by neutral lipid fluorescent staining. In the peripheral region of the acini, droplet size averaged 2.7 ± 0.8 μm, while droplet size appeared to dramatically increase in disintegrating regions of the acini at the interface between acini and duct. The refractive index of mature meibum has been previously measured by Tiffany and reported to be in the range of 1.46–1.53 for pooled human meibum [14]. For normal, non-lipid producing cells, the cellular refractive index has been report to between 1.35 to 1.37, suggesting a potential mismatch in the refractive index between intracellular lipid droplets and the cell cytoplasm [15]. This difference along with the small droplet size may lead to enhanced light scattering from developing acinar cells. As cells disintegrate and lipid droplets coalesce the number of droplet surfaces capable of scattering light would greatly diminish, allowing increased transmission of light and perhaps explaining why other structure within the meibomian gland are not detected by meibography, including the central duct and gland orifice. To further confirm the importance of lipid droplets in blocking light transmission through the acini, rabbit eyelid tissue sections were imaged before and after acetone extraction. Our finding that light transmission through the acini markedly increased after lipid extraction strongly supports our hypothesis that light scattering by small lipid droplets is the major cause of meibomian gland light scattering and decreased light transmission.
Recently, diffuse optical scattering imaging (DOSI) has been used as an imaging technology to measure tissue health and function, detecting differences in oxy- and deoxyhemoglobin and fat by their absorption characteristics [17]. While work by Bierman et al. showed that transmitted light through the eyelid could detect signals for oxy- and deoxyhemoglobin, no signature for fat or meibum were detected [12]. This finding was similar to that in our study where we were not able to detect any absorption spectra specific for meibum over the spectral range of 550–950 nm. Using DOSI, fat tissue is detected by the absorption maxima of around 925 nm [18]. Since Bierman et al. only surveyed the spectral region from 450 nm to 650 nm, they would not have detected eyelid fat. While we surveyed the spectral range from 550 nm to 950 nm, the intensity of light above 900 nm was most likely not sufficient to detect any absorption by meibum lipid. Additional study using a broader range infrared light is therefore needed to probe the absorption characteristics of meibum. Such additional study may be helpful in both assessing meibomian gland function and improving on meibomian gland imaging.
This research has some limitations. First, as mentioned above, we could not measure the transmittance above 950 nm and our ability to probe the region between 900 nm and 950 nm was limited by the low light intensity of our white light source. Second, all measurements were performed at room temperature. Since meibum undergoes many physiochemical changes around body temperature [19], the study of meibum at room temperature may likely have affected our measurements of light transmission. To evaluate this effect we performed brightfield microscopy on tissue sections warmed to body temperature and still detected markedly diminished light transmission in meibomian acini (data not shown). Additionally, it should be noted that light transmission did not decrease substantially in the meibomian gland duct, where meibum concentration would be higher after the coalescence of meibum from disintegrating acinar cells. Although additional study using temperature controlled conditions should be performed, our findings suggest that the physiochemical state of meibum may be less important to light transmission and scattering than size and density of the meibum droplets. Third, it should be noted that both human and rabbit eyelid tissue was fixed in 4% PFA to facilitate sectioning of tissue. While it is likely that tissue fixation alters light transmission through the tissue, this effect seems not to have had a major effect on light scattering from the meibomian gland since lipid extraction alone markedly increased light transmission through the acini. Finally, the human sample was obtained from a patient who had a lid removal due to sebaceous cell carcinoma. While the region investigated was free of cancer and the patient had not had prior cancer treatment, we cannot be certain that there were not some changes to the meibomian gland structure and maximum light transmission through other regions of the eyelid.
In summary, this is the first study to evaluate the spectral transmission characteristics of the meibomian gland. Overall, the data show that light transmission is dramatically reduced in the acini due to light scattering by small lipid droplets. These findings suggesting that meibography detects the presence of small lipid droplets, presumably produced by acinar cells actively synthesizing lipid.
Acknowledgments
Funding
NIH/NEI EY021510 and a Research to Prevent Blindness Unrestricted Grant, a grant of the Korea Health Technology R&D Project through the Korea Health Industry Development Institute (KHIDI), funded by the Ministry of Health & Welfare, Republic of Korea (grant number: HI17C0659), and Basic Science Research Program through the National Research Foundation of Korea(NRF) funded by the Ministry of Education(No. 2017R1A1A2A10000681).
Footnotes
Appendix A. Supplementary data
Supplementary data related to this article can be found at http://dx.doi.org/10.1016/j.jtos.2018.07.001.
References
- [1].Lemp MA, Crews LA, Bron AJ, Foulks GN, Sullivan BD. Distribution of aqueous-deficient and evaporative dry eye in a clinic-based patient cohort: a retrospective study. Cornea 2012;31:472–8. [DOI] [PubMed] [Google Scholar]
- [2].Lemp MA, Nichols KK. Blepharitis in the United States 2009: a survey-based perspective on prevalence and treatment. Ocul Surf 2009;7:S1–14. [DOI] [PubMed] [Google Scholar]
- [3].Tong L, Chaurasia SS, Mehta JS, Beuerman RW. Screening for meibomian gland disease: its relation to dry eye subtypes and symptoms in a tertiary referral clinic in Singapore. Invest Ophthalmol Vis Sci 2010;51:3449–54. [DOI] [PubMed] [Google Scholar]
- [4].Jester JV, Nicolaides N, Smith RE. Meibomian gland studies: histologic and ultrastructural investigations. Invest Ophthalmol Vis Sci 1981;20:537–47. [PubMed] [Google Scholar]
- [5].Mathers WD. Ocular evaporation in meibomian gland dysfunction and dry eye. Ophthalmology 1993;100:347–51. [DOI] [PubMed] [Google Scholar]
- [6].Mishima S, Maurice DM. The oily layer of the tear film and evaporation from the corneal surface. Exp Eye Res 1961;1:39–45. [DOI] [PubMed] [Google Scholar]
- [7].Arita R, Itoh K, Maeda S, Maeda K, Tomidokoro A, Amano S. Efficacy of diagnostic criteria for the differential diagnosis between obstructive meibomian gland dysfunction and aqueous deficiency dry eye. Jpn J Ophthalmol 2010;54:387–91. [DOI] [PubMed] [Google Scholar]
- [8].Nichols JJ, Berntsen DA, Mitchell GL, Nichols KK. An assessment of grading scales for meibography images. Cornea 2005;24:382–8. [DOI] [PubMed] [Google Scholar]
- [9].Jester JV, Rife L, Nii D, Luttrull JK, Wilson L, Smith RE. In vivo biomicroscopy and photography of meibomian glands in a rabbit model of meibomian gland dysfunction. Invest Ophthalmol Vis Sci 1982;22:660–7. [PubMed] [Google Scholar]
- [10].Tapie R Etude biomicroscopique des glandes de meibomius. Ann Oculistique 1977;210:637. [Google Scholar]
- [11].Arita R, Itoh K, Inoue K, Amano S. Noncontact infrared meibography to document age-related changes of the meibomian glands in a normal population. Ophthalmology 2008;115:911–5. [DOI] [PubMed] [Google Scholar]
- [12].Bierman A, Figueiro MG, Rea MS. Measuring and predicting eyelid spectral transmittance. J Biomed Optic 2011;16:067011. [DOI] [PubMed] [Google Scholar]
- [13].Pult H, Nichols JJ. A review of meibography. Optom Vis Sci 2012;89:E760–9. [DOI] [PubMed] [Google Scholar]
- [14].Tiffany JM. Refractive index of meibomian and other lipids. Curr Eye Res 1986;5:887–9. [DOI] [PubMed] [Google Scholar]
- [15].Liang XJ, Liu AQ, Lim CS, Ayi TC, Yap PH. Determining refractive index of single living cell using an integrated microchip. Sensor Actuator Phys 2007;133:349–54. [Google Scholar]
- [16].Borchman D, Foulks GN, Yappert MC, Tang D, Ho DV. Spectroscopic evaluation of human tear lipids. Chem Phys Lipids 2007;147:87–102. [DOI] [PubMed] [Google Scholar]
- [17].Tromberg BJ, Pogue BW, Paulsen KD, Yodh AG, Boas DA, Cerussi AE. Assessing the future of diffuse optical imaging technologies for breast cancer management. Med Phys 2008;35:2443–51. [DOI] [PMC free article] [PubMed] [Google Scholar]
- [18].Mustafa FH, Jones PW, McEwan AL. Near infrared spectroscopy for body fat sensing in neonates: quantitative analysis by GAMOS simulations. Biomed Eng Online 2017;16:14. [DOI] [PMC free article] [PubMed] [Google Scholar]
- [19].Leiske Danielle L, Leiske Christopher I, Leiske Daniel R, Toney Michael F, Senchyna M, Ketelson Howard A, Meadows David L. Fuller Gerald G: temperature-induced transitions in the structure and interfacial rheology of human meibum. Biophys J 2012;102:369–76. [DOI] [PMC free article] [PubMed] [Google Scholar]


