

Abstract
Objective
To investigate the predictive value of clinical variables on the poor prognosis at 90-day follow-up from acute stroke onset, and compare the diagnostic performance between back propagation artificial neural networks (BP ANNs) and Logistic regression (LR) models in predicting the prognosis.
Methods
We studied the association between clinical variables and the functional recovery of 435 acute ischemic stroke patients. The patients were divided into 2 groups according to modified Rankin Scale scores evaluated on the 90th day after stroke onset. Both BP ANNs and LR models were established for predicting the poor outcome and their diagnostic performance were compared by receiver operating curve.
Results
Age, free fatty acid, homocysteine and alkaline phosphatase were closely related with the poor outcome in acute ischemic stroke patients and finally enrolled in models. The accuracy, sensitivity and specificity of BP ANNs were 80.15%, 75.64% and 82.07% respectively. For the LR model, the accuracy, sensitivity and specificity was 70.61%, 88.46% and 63.04% respectively. The area under the ROC curve of the BP ANNs and LR model was 0.881and 0.809.
Conclusions
Both BP ANNs and LR model were promising for the prediction of poor outcome by combining age, free fatty acid, homocysteine and alkaline phosphatase. However, BP ANNs model showed better performance than LR model in predicting the prognosis.
Keywords: Back propagation artificial neural networks, Logistic regression model, Acute ischemic stroke, Poor outcome, Clinical variables
1. Introduction
Stroke is one of the major causes of disability and mortality worldwide [1]. It places a tremendous burden on healthcare resources because of its high prevalence and recurrence in China [2]. In acute ischemic stroke (AIS) timely assessment of the prognosis is pivotal for optimized therapy and allocation of healthcare resources to improve outcome [3]. Consequently, a reliable model for the prognostic evaluation of AIS is a worthwhile study. Ischemic stroke leads to rapid changes in the metabolic processes and signaling pathways. Ischemic cascade, activation of the immune system, brain vascular damage and blood-brain barrier dysfunction result in expression of biomarkers and the detection of these biomarkers in the peripheral blood thereafter. Therefore, biomarkers of the pathological processes active in AIS might have a significant role on the establishment of the model.
LR model is a universal linear model, which assumes the outcome variable to be a linear combination of input variables applied to a non-linear link function. Although LR is widely used in biomedical fields with ubiquitous availability and simple interpretation, true linear relationships rarely exist in epidemiology. However, ANNs are not limited to linear predictive rules. The model can “learn” mathematical relationship between a series of input (independent, predictor) variables and the matching output (dependent, outcome) variables. This is accomplished by “training” the network with the training data set, which consists of predictor variables and associated outcomes [4]. BP ANNs “train” with backward error propagation algorithm, and which has functions of high degree fault-tolerance, nonlinear mapping, self-learning and self-organization [5]. BP ANNs has been used to predict mortality risk of liver failure, diagnose cancers and predict the plasma concentration of drug [6-8].
Previous studies reported that ANNs are superior to LR model for medical outcome prediction [9] while other authors suggested ANNs are not superior to LR model [10]. However, to our knowledge no previous studies have compared these models to predict prognosis of AIS in China. So this study was to investigate the relationship between clinical variables at admission and short-term prognosis in AIS patients, and compare the diagnostic performance of BP ANNs and LR models for prediction of prognosis.
2. Materials and methods
2.1. Study population
From June 2015 to June 2017, all consecutive patients with first-ever AIS admission to the inpatient department of neurology of the Sixth Affiliated Hospital of Guangzhou Medical University were recruited to participate in the study. All patients were admitted into the hospital from 2.5 to 24 hours after stroke onset and experienced a new global or focal neurological event. All patients were diagnosed with AIS according to the World Health Organization criteria. Brain MRI was performed routinely within 24 hours after admission. Patients were excluded in accordance with the following criteria: more than 24 hours from symptom recognition to admission, MRI could not be performed, cerebral arteriosclerosis (severe cerebral artery sclerosis, cerebral hemorrhage, epileptic seizure activity or coma, malignancy, acute or chronic inflammatory disease). The treatments included general care, blood pressure regulation, anticoagulation (antiplatelets intravenous thrombolysis), plasma lipid regulation, et al. Patients with diabetes were treated with diabetic diet, oral hypoglycemic drugs and intravenous injection insulin.
2.2. Ethical considerations
The Institutional Ethics Committee on Human Research of the Sixth Affiliated Hospital of Guangzhou Medical University approved the study protocol. All subjects received oral and written information concerning the background and procedures of the study, and the subjects or their relatives gave written informed consent prior to participating in the study.
2.3. Data collection
After admission, demographic data (age, sex and blood pressure), and history of risk factors (smoking habit, alcohol abuse, hypertension, hyperlipoidemia, diabetes mellitus, atrial fibrillation and coronary artery disease) were collected. At admission, the neurological deficit of all subjects was quantified according to the National Institutes of Health Stroke Scale (NIHSS) [11].
Brain MRI with diffusion-weighted imaging (DWI) was available in all AIS patients. We considered the endpoint was as follows: (a) functional outcome on the 90th day after AIS onset. Outcome was evaluated by modified Rankin Scale (mRS, the good prognosis was defined as a mRS of 0-2 points, and the poor prognosis was defined as a mRS of 3-6 points) [12].The functional outcome evaluation was performed by one trained clinician who was blinded to the study, if discharged, with telephone interview. (b) all causes of mortality within 90 days.
Blood samples were collected in the second morning after fasting for at least 8 hours after admission. Plasma or serum aliquots were collected and centrifuged at 3000 g for 10 min at ambient room temperature and were then frozen at -80℃ until assayed. The concentration of plasma markers (prothrombin time, activated partial thromboplastin time, thrombin time and fibrinogen) was measured with a particle-enhanced, immunoturbidimetric assay in a calibrated Sysmex 1500 analyzer (Sysmex Corporation, Hyogo, Japan). The concentration of serum markers (free fatty acid, homocysteine, alkaline phosphatase, angiotensin converting enzyme, haptoglobin, blood urea nitrogen, high sensitive C reactive protein, et al.) was measured with the continuous monitoring assay in a calibrated Hitachi 7180 automatic analyzer (Hitachi High-Tech Science Systems Corporation, Hitachinaka-shi, Japan).
2.4. Statistical analysis
Continuous variables were shown as mean ± standard deviation or median (interquartile range, IQR). Categorical variables were expressed as percentages. Independent samples t-test or Mann-Whitney U test was used to compare continuous variables, and Chi-Square test was defined to compare categorical variables. Associations between the prognosis of AIS and clinical variables were respectively assessed using BP ANNs and multivariate logistic regression models. Furthermore, their diagnostic performance was compared by receiver operating curve. P <.05 showed statistical significance, P <.001 showed extremely statistical significance. As only 435 participants were recruited in the current study, training set and test set was used to build the final model. Statistical analysis was performed using SPSS software, version 20.0(IBM SPSS Statistics) and R Project nnet packages glm function, version R 3.3.2.
3. Results
3.1. Clinical variables predicted poor prognosis in AIS patients in univariate analysis
Patients were divided into good and poor prognosis groups based on mRS scores evaluated on the 90th day after AIS onset. As shown in Table 1, in comparison to good prognosis group, patients from poor prognosis group accounted to 54.48% (n = 435) and were older (69.10 ± 12.32 versus 60.69± 13.40, P <.001), had higher systolic blood pressure (SBP) (152.35±22.82 versus 144.47±21.88, P<.001), higher percentage of male patients(75.53% versus 64.14%, P<.05), more current smoker(42.61% versus 30.81%, P <.05), more hypertension (86.92% versus 75.25%, P <.05); more diabetes mellitus (35.02% versus 22.22%, P <.05) and more serious stroke conditions on admission [11(7-16) versus 4(3-7), P <.05)].
Table 1.
Clinical characteristic of patients with acute ischemic stroke
| Characteristics | Total | Prognosis |
P-value | |
|---|---|---|---|---|
| Good | Poor | |||
| Number of patients, n | 435 | 198 | 237 | |
| Age(years), mean±SD | 64.18±13.20 | 60.69±13.40 | 69.10±12.32 | <0.001**a |
| Male, n(%) | 306 (70.34%) | 127 (64.14%) | 179 (75.53%) | <0.05*c |
| SBP(mm Hg), mean±SD | 148.77±22.72 | 144.47±21.88 | 152.35±22.82 | <0.001**a |
| DBP (mm Hg), mean±SD | 85.01±13.96 | 84.16±12.68 | 85.72±14.93 | 0.255a |
| Alcohol abuse, n (%) | 94 (21.61%) | 41 (20.71%) | 53(22.36%) | 0.516c |
| Current smoker, n (%) | 162 (37.24%) | 61 (30.81%) | 101(42.61%) | <0.05*c <0.05*c |
| Hypertension, n(%) | 355 (81.61%) | 149 (75.25%) | 206 (86.92%) | |
| Hyperlipoidemia, n (%) | 67 (15.40%) | 28 (14.14%) | 39 (16.46%) | 0.505c |
| Diabetes mellitus, n (%) | 127 (29.20%) | 44 (22.22%) | 83 (35.02%) | <0.05*c |
| Atrial fibrillation, n (%) | 91 (20.92%) | 39 (19.70%) | 52(21.94%) | 0.531c |
| Coronary heart disease, n (%) | 120 (27.59%) | 52 (26.26%) | 68 (28.69%) | 0.572c |
| Intravenous thrombolysis, n (%) | 40 (9.20%) | 16( 8.08%) | 24(10.13%) | 0.511c |
| Stroke severity, median NIHSS score(IQR) | 9 (6-12) | 4 (3-7) | 11 (7-16) | <0.05*b |
Abbreviations: SD, standard deviation; NIHSS, National Institutes of Health Stroke Scale; IQR, interquartile range.
*: p<.05; **: p<.001; a: Independent samples t test; b: Mann-Whitney U test; c: Chi-Square test.
Creatinine (CREA), uric acid (UA), blood urea nitrogen (BUN) and activated partial thromboplastin time (APTT) levels were higher in the poor prognosis group than the good prognosis group (P <.05). However, high density lipoprotein (HDL) levels were lower in the poor prognosis group than the good prognosis group (P <.05). Furthermore, free fatty acid (FFA), haptoglobin (HP), homocysteine (Hcy), alkaline phosphatase (ALP), prothrombin time (PT), fibrinogen (Fbg) and high sensitive C reactive protein (Hs-CRP) levels were prominently higher in the poor prognosis group than the good prognosis group (P <.001). However albumin (ALB) levels were prominently lower in the poor prognosis group than the good prognosis group (P <.001) (Table 2).
Table 2.
Laboratory parameters of patients with acute ischemic stroke
| Laboratory parameters | Total | Prognosis |
P-value | |
|---|---|---|---|---|
| Good | Poor | |||
| GLU(mmol L-1) | 6.04±2.50 | 5.97±2.25 | 6.10±2.70 | 0.602a |
| CREA(umol L-1) | 85.37±28.97 | 82.78±22.94 | 89.38±31.03 | <0.05*a |
| UA(umol L-1) | 337.37±103.86 | 324.05±99.16 | 348.49±106.56 | <0.05*a |
| FRUC(mmol L-1) | 281.62±102.29 | 280.15±105.58 | 282.85±99.67 | 0.784a |
| FFA(μmol L-1) | 575.04±264.63 | 508.83±243.17 | 630.35±269.57 | <0.001**a |
| ACE(U L-1) | 23.77±12.44 | 23.97±11.25 | 23.60±13.38 | 0.754a |
| HP(g L-1) | 1.60±0.80 | 1.39±0.69 | 1.78±0.85 | <0.001**a |
| TC(mmol L-1) | 4.67±2.27 | 4.58±1.23 | 4.74±2.87 | 0.447a |
| HDL(mmol L-1) | 1.04±0.28 | 1.07±0.28 | 1.01±0.28 | <0.05*a |
| LDL(mmol L-1) | 3.03±1.05 | 2.97±1.02 | 3.07±1.07 | 0.302a |
| BUN(mmol L-1) | 5.97±2.78 | 5.66±1.55 | 6.28±3.38 | <0.05*a |
| Hcy(umol L-1) | 14.63±7.80 | 10.29±3.49 | 18.25±8.53 | <0.001**a |
| ALP(U L-1) | 81.19±24.50 | 74.11±22.81 | 89.28±24.75 | <0.001**a |
| TP(g L-1) | 66.77±6.55 | 66.97±5.77 | 66.61±7.14 | 0.563a |
| ALB(g L-1) | 37.77±4.55 | 38.80±3.62 | 36.92±5.05 | <0.001**a |
| PT(s) | 12.08±1.44 | 11.80±0.82 | 12.31±1.77 | <0.001**a |
| APTT(s) | 27.16±4.22 | 26.67±4.15 | 27.56±4.25 | <0.05*a |
| TT(s) | 17.68±1.83 | 17.72±1.43 | 17.65±2.11 | 0.702a |
| Fbg(g L-1) | 3.44±1.16 | 3.16±0.83 | 3.67±1.33 | <0.001**a |
| HS-CRP(mg L-1) | 2.68(0.96-8.63) | 1.42(0.59-3.57) | 4.56(1.90-14.09) | <0.001**b |
| Lpa(mg L-1) | 278.00(179.00-446.00) | 256.00(164.50-431.00) | 291.00(194.50-458.50) | 0.197b |
Abbreviations: GLU, glucose; CREA, creatinine; UA, uric acid; FRUC, fructosamine; FFA, free fatty acid; ACE, angiotensin converting enzyme; HP, haptoglobin; TC, total cholesterol; HDL, high density lipoprotein; LDL, low density lipoprotein; BUN, blood urea nitrogen; Hcy, homocysteine; ALP, alkaline phosphatase; TP, total protein; ALB, albumin; PT, prothrombin time; APTT, activated partial thromboplastin time; TT, thrombin time; Fbg, fibrinogen; Hs-CRP, high sensitive C reactive protein; Lpa, lipoprotein a.
Data are mean ± standard deviation values or the median (interquartile range)
*: p<.05; **: p<.001; a: Independent samples t test; b: Mann-Whitney U test.
3.2. Clinical variables predicted poor prognosis in AIS patients in multivariate Logistics regression model and BP ANNs model respectively
By gradually variable screening, age (Z=3.45; P<.01), FFA (Z=2.59; P<.01), Hcy (Z=2.98; P<.01) and ALP (Z=3.33; P<.01) were retained in the final model (Table 3).
Table 3.
Multivariate Logistics Regression of Prognosis among Training Set
| Parameters | Estimate | Standard Error | z-value | p-value |
|---|---|---|---|---|
| Age | .04 | .01 | 3.45 | <.01** |
| FFA | .59 | .21 | 2.59 | <.01** |
| Hcy | .04 | .02 | 2.98 | <.01** |
| ALP | .03 | .01 | 3.33 | <.01** |
**: p<.01
Based on the ROC curve, the cutoff value of Logistic regression model for predicting of poor outcome was 0.787, more than 0.787 considered as poor outcome, and less than 0.787 considered as good outcome. The area under the ROC curve was 0.809, and the accuracy, sensitivity and specificity were 70.61%, 88.46% and 63.04% respectively (Table 4, Figure1).
Table 4.
Discriminatory Outcomes of Multiple Logistics Regression Model
| Predict Result of | Training Set |
Testing Set |
||
|---|---|---|---|---|
| Logistic Regression | Good | Poor | Good | Poor |
| Good | 69 | 68 | 39 | 61 |
| Poor | 9 | 116 | 12 | 61 |
| Total | 78 | 184 | 51 | 122 |
According to training set, the area under the ROC curve was 0.809, the cutoff value was 0.787, more than 0.787 considered as poor outcome, and less than 0.787 considered as good outcome. Retrospective evaluation model by the training set, the accuracy, sensitivity and specificity were 70.61%, 88.46% and 63.04% respectively. Evaluation model by the testing set, the accuracy, sensitivity and specificity were 57.80%, 76.47% and 50.00% respectively.
Figure 1.
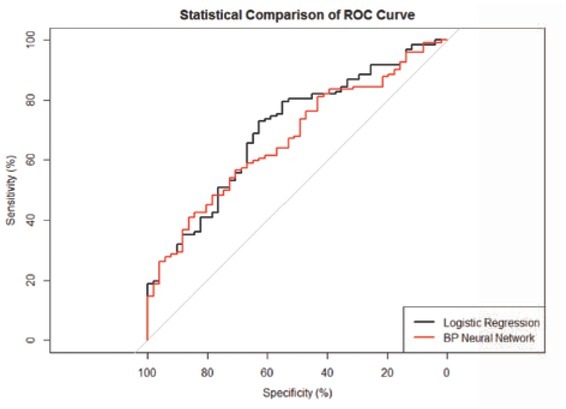
ROC curve of BP ANNs model and logistic regression model (p<.05)
Similarly, according to the ROC curve, the cutoff value of BP ANNs model for predictive of poor outcome was 0.607, more than 0.607 considered as poor outcome, and less than 0.607 considered as good outcome. The area under the ROC curve was 0.881, and the accuracy, sensitivity and specificity was 80.15%, 75.64% and 82.07% respectively. (Table 5, Figure 1)
Table 5.
Discriminatory Outcomes of BP ANNs
| Predict Result | Training Set |
Testing Set |
||
|---|---|---|---|---|
| of BP ANNs | Good | Poor | Good | Poor |
| Good | 59 | 33 | 25 | 38 |
| Poor | 19 | 151 | 26 | 84 |
| Total | 78 | 184 | 51 | 122 |
According to training set, the area under the ROC curve was 0.881, the cutoff value was 0.607, more than 0.607 considered as poor outcome, and less than 0.607 considered as good outcome. Retrospective evaluation model by the training set, the accuracy, sensitivity and specificity were 80.15%, 75.64% and 82.07% respectively. Evaluation model by the testing set, the accuracy, sensitivity and specificity were 63.01%, 49.02% and 68.85% respectively.
4. Discussion
AIS is a type of ischemic stroke arising from a blockade of the blood vessels supplying blood to the brain. It places a huge burden on health resources in China. Thus, a better model for the prognostic evaluation is a worthwhile pursuit. The model would make for better resource allocation and guide preventive strategies. Our study had compared different models – BP ANNs and LR– in accomplishing this goal.
In 1996, the US Food and Drug Administration approved the intravenous application of recombinant tissue-type plasminogen activator (r-tPA) for patients with acute ischemic stroke. In our study, the intravenous thrombolysis rate did not significantly differ between good prognosis and poor prognosis patients. There are many factors associated with the result, including the clinician’s lack of understanding of the importance of intravenous thrombolysis and patients’ refusal of thrombolysis based on the risk for hemorrhage. However, the most important reason may be that intravenous thrombolysis has rigorous indications and contraindications, and most patients do not meet these criteria. We found that the increase of age, FFA, Hcy and ALP were correlated with the poor functional outcome at 90 days from AIS onset. It is well known that the prognosis of AIS would be worse, with the increase of age.
FFA is the energy source that acts as the signaling molecule in different cellular processes [13]. The plasma FFA concentration is closely related to lipid metabolism and insulin resistance [14, 15]. Guo et al [16] reported that inflammation and oxidative stress are more obvious in acute stoke patients with insulin resistance which may cause worse stroke severity. Our study showed that high FFA levels were associated with poor functional outcome in AIS patients even after correcting for possible confounding factors. Therefore, we speculated that elevated FFA levels may be related to inflammation and oxidative stress in AIS patients.
Hcy is a thiol-containing amino acid formed during methionine metabolism. Previous studies have suggested that high Hcy is considered as a risk factor for acute cardio-cerebrovascular disease [16]. Our results showed that elevated plasma Hcy was correlated with the poor functional outcome of AIS. Hcy was accepted as a risk factor for stroke, the possible mechanisms include: endothelial toxicity, coagulation promotion, inhibition of membrane metabolism in neuronal cells, induction of neuronal excito-toxicity, and Hcy may affect genes which are involved in the regulation of neuronal responses to ischemia stroke [17].
ALP is a routine marker for evaluating hepatic and bony disease. Recently, several studies have reported that higher levels of ALP were related to increased risk of future small cerebral vascular disease and stroke events [18, 19]. In this study, we found that the serum level of ALP was significantly higher in patients with poor prognosis than in those with better prognosis. The result is in accordance with findings from a previous study [20]. The findings suggested that elevated ALP levels were related to poor functional outcome and showed that higher level ALP may play an important part in the pathogenesis of AIS. Elevated ALP levels may form a risk for poor functional outcome and mortality after AIS because of progressive atherosclerosis.
The above three biomarkers are the useful tools to predict poor outcome 90-day after AIS in Chinese population and have the potential to assist clinicians in identifying high-risk patients. Moreover, in the clinical research, defined biomarkers might also serve as the substitutable outcome measurement to facilitate clinical trials. Therefore, blood FFA, Hcy and ALP levels, due to their strong correlation with the poor prognosis of AIS. Their easy and early availability, show to be good prognosis biomarkers for AIS.
ANNs have the advantage of using information from incomplete data records over traditional LR model. Considering the fact that incomplete data are common in clinical practice, ANNs could more accurately represent the clinical scenario under investigation [21]. Thus, another part of this study was to compare the diagnostic performance between BP ANNs and LR models in predicting the prognosis.
The area under the Receiver Operating Characteristic (ROC) used to compare ANNs with LR curve to evaluate the predictive performance of two models in medical applications. The higher ROC area indicated a better performance of the model. In our study, based on the ROC curve, we found that the area under the ROC curve of BP ANNs was greater than Logistic regression models (0.881 vs 0.809, P<.05), moreover, the accuracy and specificity was higher than Logistic regression models (80.15% vs 70.61%, and 82.07% vs 63.04% respectively, P<.05). Therefore, we considered that BP ANNs model showed better performance than Logistic regression model in predicting the poor prognosis in AIS patients. Similar results have also been reported in the previous study, where ANNs have been used for the diagnosis and the prognosis of prediction in some diseases. Previous research reported that ANNs model to diagnose acute myocardial infarction and dyslipidemia showed better performance than logistic regression models [22, 23]. Wise et al also described that improved performance of ANNs over logistic regression in predicting the outcome of ruptured abdominal aortic aneurysm repair [24].
Several limitations of our study must be considered. First, the patients included in the present study were from one center only. Second, the relatively small sample size may restrict the generalization of the study results. Before the widespread implementation, further studies are needed for external validation. Third, Modified Rankin Scale is not a sensitive outcome measure, which means that some subtle differences in outcome may have been missed. Finally, none of the three biomarkers are specific in AIS and they may be elevated in the setting of medical comorbidities. Therefore, biomarkers would likely serve as an auxiliary rather than a substitute for initial radiographic tests. For example, head computed tomography (CT), which is rapid, must be performed in order to rule out space-occupying lesion, hemorrhage, cerebral infarction volume and so on.
5. Conclusion
In conclusion, BP ANNs model showed better performance than LR model by combining age, FFA, Hcy and ALP in predicting the poor prognosis of AIS patients.
Acknowledgment
We are grateful to the department of neurology; the physicians, nurses, and patients who participated in our study.
Footnotes
Conflict of interest The authors declare that there is no conflict of interest.
References
- [1].Krishnamurthi RV, Moran AE, Feigin VL. Stroke Prevalence, Mortality and Disability-Adjusted Life Years in Adults Aged 20-64 Years in 1990-2013: Data from the Global Burden of Disease 2013 Study. Neuroepidemiology. 2015;45(3):190. doi: 10.1159/000441098. et al. –. [DOI] [PubMed] [Google Scholar]
- [2].Sun H, Zou X, Liu L. Epidemiological Factors of Stroke: A Survey of the Current Status in China. Journal of Stroke. 2013;15(2):109. doi: 10.5853/jos.2013.15.2.109. –. [DOI] [PMC free article] [PubMed] [Google Scholar]
- [3].Slot KB, Berge E, Dorman P, Lewis S, Dennis M, Sandercock P. Impact of functional status at six months on long term survival in patients with ischaemic stroke: prospective cohort studies. BMJ. 2008;336(7640):376. doi: 10.1136/bmj.39456.688333.BE. –. [DOI] [PMC free article] [PubMed] [Google Scholar]
- [4].Liew PL, Lee YC, Lin YC. Comparison of artificial neural networks with logistic regression in prediction of gallbladder disease among obese patients. Digestive and Liver Disease. 2007;39(4):356. doi: 10.1016/j.dld.2007.01.003. et al. –. [DOI] [PubMed] [Google Scholar]
- [5].Li H, Luo M, Zheng J. An artificial neural network prediction model of congenital heart disease based on risk factors. Medicine. 2017;96(6):e6090. doi: 10.1097/MD.0000000000006090. et al. [DOI] [PMC free article] [PubMed] [Google Scholar]
- [6].Zheng MH, Shi KQ, Lin XF. A model to predict 3-month mortality risk of acute-on-chronic hepatitis B liver failure using artificial neural network. Journal of Viral Hepatitis. 2013;20(4):248. doi: 10.1111/j.1365-2893.2012.01647.x. et al. –. [DOI] [PubMed] [Google Scholar]
- [7].Amiri Z, Mohammad K, Mahmoudi M, Parsaeian M, Zeraati H. Assessing the Effect of Quantitative and Qualitative Predictors on Gastric Cancer Individuals Survival Using Hierarchical Artificial Neural Network Models. Iranian Red Crescent Medical Journal. 2013;15(1):42. doi: 10.5812/ircmj.4122. –. [DOI] [PMC free article] [PubMed] [Google Scholar]
- [8].Yamamura S, Kawada K, Takehira R. Artificial neural network modeling to predict the plasma concentration of aminoglycosides in burn patients. Biomedicine & Pharmaco-therapy. 2004;58(4):239. doi: 10.1016/j.biopha.2003.12.012. et al. –. [DOI] [PubMed] [Google Scholar]
- [9].Chiu HC, Ho TW, Lee KT, Chen HY, Ho WH. Mortality Predicted Accuracy for Hepatocellular Carcinoma Patients with Hepatic Resection Using Artificial Neural Network. The Scientific World Journal. 2013;2013:1. doi: 10.1155/2013/201976. –. [DOI] [PMC free article] [PubMed] [Google Scholar]
- [10].Ambalavanan N, Carlo WA. Comparison of the prediction of extremely low birth weight neonatal mortality by regression analysis and by neural networks. Early Hum Dev. 2001;65:123. doi: 10.1016/s0378-3782(01)00228-6. –. [DOI] [PubMed] [Google Scholar]
- [11].Meyer BC, Lyden PD. The Modified National Institutes of Health Stroke Scale: its Time has Come. International Journal of Stroke. 2009;4(4):267. doi: 10.1111/j.1747-4949.2009.00294.x. –. [DOI] [PMC free article] [PubMed] [Google Scholar]
- [12].Wang J, Ning R, Wang Y. Plasma D-dimer Level, the Promising Prognostic Biomarker for the Acute Cerebral Infarction Patients. Journal of Stroke and Cerebrovascular Diseases. 2016;25(8):2011. doi: 10.1016/j.jstrokecerebrovasdis.2015.12.031. –. [DOI] [PubMed] [Google Scholar]
- [13].Hara T, Kashihara D, Ichimura A, Kimura I, Tsujimoto G, Hirasawa A. Role of free fatty acid receptors in the regulation of energy metabolism. Biochimica et Biophysica Acta (BBA) - Molecular and Cell Biology of Lipids. 2014;1841(9):1292. doi: 10.1016/j.bbalip.2014.06.002. –. [DOI] [PubMed] [Google Scholar]
- [14].Jump DB. Fatty acid regulation of hepatic lipid metabolism. Current Opinion in Clinical Nutrition and Metabolic Care. 2011;14(2):115. doi: 10.1097/MCO.0b013e328342991c. –. [DOI] [PMC free article] [PubMed] [Google Scholar]
- [15].Guo SX, Yan YZ, Mu LT. Association of Serum Free Fatty Acids with Hypertension and Insulin Resistance among Rural Uyghur Adults in Far Western China. International Journal of Environmental Research and Public Health. 2015;12(6):6582. doi: 10.3390/ijerph120606582. et al. –. [DOI] [PMC free article] [PubMed] [Google Scholar]
- [16].Scheet P, Williams SR, Yang Q. Genome-Wide Meta-Analysis of Homocysteine and Methionine Metabolism Identifies Five One Carbon Metabolism Loci and a Novel Association of ALDH1L1 with Ischemic Stroke. PLoS Genetics. 2014;10(3):e1004214. doi: 10.1371/journal.pgen.1004214. et al. [DOI] [PMC free article] [PubMed] [Google Scholar]
- [17].Manolescu BN, Oprea E, Farcasanu IC, Berteanu M, Cercasov C. Homocysteine and vitamin therapy in stroke prevention and treatment: a review. Acta biochimica polonica. 2010;57(4):467. –. [PubMed] [Google Scholar]
- [18].Shimosawa T, Lee HB, Kim J. Association between Serum Alkaline Phosphatase Level and Cerebral Small Vessel Disease. PLoS ONE. 2015;10(11):e0143355. doi: 10.1371/journal.pone.0143355. et al. [DOI] [PMC free article] [PubMed] [Google Scholar]
- [19].Shimizu Y, Imano H, Ohira T. Alkaline Phosphatase and Risk of Stroke Among Japanese: The Circulatory Risk in Communities Study (CIRCS) Journal of Stroke and Cerebrovascular Diseases. 2013;22(7):1046. doi: 10.1016/j.jstrokecerebrovasdis.2012.06.009. et al. –. [DOI] [PubMed] [Google Scholar]
- [20].Kim J, Song TJ, Song D. Serum Alkaline Phosphatase and Phosphate in Cerebral Atherosclerosis and Functional Outcomes After Cerebral Infarction. Stroke. 2013;44(12):3547. doi: 10.1161/STROKEAHA.113.002959. et al. –. [DOI] [PubMed] [Google Scholar]
- [21].Faradmal J, Soltanian AR, Roshanaei G, Khodabakhshi R, Kasaeian A. Comparison of the Performance of Log-logistic Regression and Artificial Neural Networks for Predicting Breast Cancer Relapse. Asian Pacific Journal of Cancer Prevention. 2014;15(14):5883. doi: 10.7314/apjcp.2014.15.14.5883. –. [DOI] [PubMed] [Google Scholar]
- [22].Baxt WG, Shofer FS, Frank D, Hollander JE. A neural computational aid to the diagnosis of acute myocardial infarction. Annals of Emergency Medicine. 2002;39(4):366. doi: 10.1067/mem.2002.122705. –. [DOI] [PubMed] [Google Scholar]
- [23].Malaga G, Wang CJ, Li YQ. Development and Evaluation of a Simple and Effective Prediction Approach for Identifying Those at High Risk of Dyslipidemia in Rural Adult Residents. PLoS ONE. 2012;7(8):e43834. doi: 10.1371/journal.pone.0043834. et al. [DOI] [PMC free article] [PubMed] [Google Scholar] [Retracted]
- [24].Wise ES, Hocking KM, Brophy CM. Prediction of in-hospital mortality after ruptured abdominal aortic aneurysm repair using an artificial neural network. Journal of Vascular Surgery. 2015;62(1):8. doi: 10.1016/j.jvs.2015.02.038. –. [DOI] [PMC free article] [PubMed] [Google Scholar]