

Abstract
Background and Objective
Hepcidin is the key regulator of iron metabolism and is a significant biomarker for systemic inflammatory states. Vitamin D is a powerful immunomodulator and plays a significant role in the inflammatory responses and fibrosis occurring due to hepatitis C virus (HCV) infection. This study assessed the level of vitamin D and serum hepcidin and its expression in peripheral blood of children with chronic hepatitis C (CHC) and correlated them with other serum markers to reflect iron metabolism and liver disease severity.
Methods
A total of 100 children were included in this study: 50 with HCV infection and 50 healthy controls. Biochemical parameters together with vitamin D, hepcidin, and its expression were all measured.
Results
The level of hepcidin and its expression together with vitamin D and hepcidin-to-ferritin (H/F) ratios were significantly reduced in patients, but the iron and ferritin levels were higher (P<0.001). Serum hepcidin level showed significant positive correlation with hepcidin expression, HCV titer, iron, ferritin, and H/F ratio (r = 0.43, 0.31, 0.34, 0.28, and 0.91, respectively) but significant negative correlation with vitamin D (r = −0.37). Both hepcidin and ferritin were higher in patients with Child Pugh scores B and C than those with score A (P<0.001).
Conclusion
Measuring serum hepcidin and its expression together with vitamin D levels in patients may have a prognostic value and is promising in the follow-up of the severity of liver disease.
Key words: hepatitis C, hepcidin, hepcidin-to-ferritin ratio, vitamin D
Introduction
Iron homeostasis is one of the main functions of the liver, being the main place for its storage. The liver controls the iron flow into and around the body via the synthesis of major proteins for iron metabolism such as transferrin and the production of the peptide hepcidin. [1] Hepcidin, a 25-amino acid peptide present in human serum and urine, is considered the main regulator of iron metabolism through binding to iron carriers, resulting in internalization and lysosomal degradation. [2, 3] Inflammation, endoplasmic stress, and iron stores upregulate hepcidin expression, while anemia, hypoxia, and oxidative stress downregulate it.[4, 5] Hepcidin is recognized as a biomarker for systemic inflammatory states because of upregulation by inflammatory cytokines.[3, 4, 5, 6] Patients with chronic liver disease (CLD) usually have iron overload, especially hepatitis C virus (HCV), steatosis, and cirrhotic liver; this iron produces free oxygen radicals with harmful effects on various organs. This consensus pay attention to studying the overall iron homeostasis and the regulatory mechanisms; also more consideration is paid to ferritin, transferrin, and transferrin receptors, and the hormone hepcidin.[7, 8] It is well known that the hepcidin synthesis may elevate, irrespective of iron metabolism and erythropoiesis activity, by the action of bacterial lipopolysaccharides and proinflammatory cytokines, creating condition for iron stores redistribution. [9, 10] Despite that the physiological and pathophysiological role of hepcidin is well studied in some experimental conditions, data on serum hepcidin, both in healthy subjects and patients with various diseases are still deficient and contradictory. Vitamin D plays a significant role in the inflammatory responses and fibrosis in HCV infection. [11] It is a powerful immunomodulator, suppressing proinflammatory cytokines, increasing anti-inflammatory cytokines, and improving CD4 T-cell responsiveness. Vitamin D status is influenced by exposure to sunlight so it differs across different environmental and geographical locations, and consequently, its effect on disease pathogenesis varies from one place to the other. [12] This study was carried out on Egyptian children living in the same geographical location and exposed to the same environmental and geographical conditions. Thus it could be considered as inclusion criteria that the study was carried on children living in Africa and not receiving any treatment. Although the exposure to the sun differs according to the geographical locations, the overall exposure to the sun worldwide is fair with the exception of extremities.
The objective of this study was to identify and assess hepcidin level in serum and its expression in peripheral blood of children with chronic hepatitis C (CHC) and correlate them with other serum markers reflecting iron metabolism and severity of liver disease. Also, the association of hepcidin levels with vitamin D level was evaluated.
Materials and methods
Patients
This case–control multicenter study was conducted at the Pediatrics and Clinical and Chemical Pathology departments, Benha University Hospital; and Pediatric and Pediatric Intensive Care, Department of Pediatrics, Cairo University School of medicine. The study was approved by the Ethical Committee of the Pediatric Department at Benha University and conducted according to the principles of the Declaration of Helsinki. An informed consent was obtained from the children’s parents before enrollment of the patients.
The study included 100 children, subdivided into 2 groups
-
(a)
Patient Group It included 50 children with CHC who did not receive any treatment; there were 24 male patients and 26 female patients. Their ages ranges between 5 and 16 years with a mean age of 10 years.
-
(b)
Control Group It included 50 healthy children; there were 23 male subjects and 27 female subjects; and their age ranges between 5 and 16 years with a mean age of 9.5 years. The criteria for controls were normal biochemical tests, CBC, and liver function tests and negative results for HCV infection by enzyme-linked immunosorbent assay (ELISA). The patients with one or more of the following criteria were excluded from the study: co-infection with hepatitis B or schistosomiasis, acute liver failure, hepatocellular carcinoma (HCC), or renal dysfunction. All patients were subjected to clinical evaluation, including medical history and physical examination (to detect hepatic encephalopathy and ascites, which is confirmed by ultrasound) and biochemical markers analysis, including serum aspartate aminotransferase (AST), alanine transaminase (ALT), serum bilirubin concentration, albumin, INR, hepcidin, and body iron content markers, including iron and ferritin concentrations. Patients were classified based on Child Pugh score: 31 patients with score A and 19 patients with score B and C. The biochemical serum tests were performed using Biosystem A15 autoanalyzer (Biosystems S.A., Barcelona) using appropriate kits. Serum hepcidin was measured using DRG Hepcidin 25 (bioactive) HS ELISA kits, a competitive-binding solid-phase ELISA. (DRG International, Inc., Springfield, USA). Serum total 25-OH vitamin D was measured using DRG® 25-OH Vitamin D (total) ELISA, (DRG International, Inc., Springfield, USA).
Methods
HCV infection was diagnosed using (INNOTEST™ HCV Ab) fourth-generation enzyme immunoassay (Fujirebio Diagnostics AB, Göteborg, Sweden) and hepatitis B virus (HBV) infection was diagnosed using GB HBsAg ELISA Kit (SURASE B-ELISA) (General Biological Corporation, Hsinchu Science Park, Taiwan, R.O.C). Viral RNA was extracted using QIAamp viral RNA extraction kit (QIAGEN GmbH, Hilden, Germany), and HCV infection was confirmed by polymerase chain reaction (PCR) quantitative assays using ARTUS Qiagen kit (Qiagen, Hilden, Germany). The RNA concentration was evaluated using Nanodrop 2000 (Wilmington, DE 19810 USA). For hepcidin (HAMP) mRNA expression, Preparation of PBMCs obtained from peripheral blood of all patients and controls were isolated using Ficoll density centrifugation and sedimentation. RNA was extracted from PBMCs cells using QIAamp viral RNA extraction kit (QIAGEN GmbH, Hilden, Germany). Complementary DNA (cDNA) was synthesized using High-Capacity cDNA Reverse Transcription Kits (Applied Biosystems, CA, USA). Quantification of hepcidin (HAMP) gene was performed using a commercial ready-to-use kit Cat. # 4331182 with TaqMan® Universal Master Mix II and TaqMan_ Gene Expression assays (Applied Biosystems Inc, Foster City, CA, USA). B-actin was used as housekeeping gene (endogenous reference cDNA). Threshold cycles (CT) represents the initial concentration of hepcidin mRNA expression. Relative mRNA quantification was calculated using the arithmetic formula 2 − ΔCT, where ΔCT is the difference between the CT of a hepcidin mRNA expression and an endogenous reference. Thus, this value yields the amount of the target normalized to B-actin.
Statistical analysis
The collected data were summarized in terms of mean ± standard deviation (SD) and range for quantitative data and frequency and percentage for qualitative data. Comparisons between the different study groups were carried out using the chi-square test (χ2) to compare proportions. The student’s T-test (t) and the Mann– Whitney (Z) test were used to test differences between two groups regarding parametric and non-parametric data, respectively. The Pearson correlation coefficient (r) and the Spearman correlation coefficient (rho; ϱ) were used to examine the correlation of serum hepcidin and ferritin levels estimated parameters. Statistical significance was accepted at P value <0.05 (S). A P value <0.001 was considered highly significant (HS), while a P value >0.05 was considered non-significant. All statistical analyses were carried out in STATA/SE version 11.2 for Windows (STATA Corporation, College Station, Texas).
Results
Patients’ group included 26 female patients and 24 male patients with a mean age of 10.34 ± 2.82 years, and their mean body mass index (BMI) was 22.64 ± 4.69 kg/m2; no statistically significant difference was found between patients and controls regarding age, sex, and BMI with p values <0.18, 0.84, and 0.81, respectively. Within the patient group, only 20% had moderate and severe ascites (total 10 patients) and only 6 patients (12%) had encephalopathy.
Laboratory parameters of patients and control are given in Table 1; significant differences were found between patients and control in terms of liver function tests (AST, ALT), bilirubin (total and direct), glucose, albumin, alpha fetoprotein (AFP), gamma-glutamyl transferase (GGT), alkaline phosphatase, prothrombin time (PT), hemoglobin (Hb), platelet count, and white blood cell (WBC) count. Serum iron and serum ferritin were significantly higher in patients than in control. Both serum level and peripheral blood expression of hepcidin were significantly lower in patients than in controls; also, H/F ratio decreases significantly in patients than in control. As regard to serum level of vitamin D, it was significantly lower in patients than in control.
Table 1.
Comparison between patients and control regarding laboratory parameters
| Variables | Patients (n = 50) | Controls (n = 50) | Test | P | ||
|---|---|---|---|---|---|---|
| Mean ± SD | Range | Mean ±SD | Range | |||
| ALT (IU/L) | 57.34 ± 16.51 | 25–90 | 30.08 ± 5.92 | 20–41 | t = 10.99 | <0.001 (HS) |
| AST (IU/L) | 61.22 ± 36.27 | 25–210 | 32.74 ± 8.68 | 18–58 | Z = 6.38 | <0.001 (HS) |
| T. Bilirubin (mg/dL) | 1.31 ± 0.69 | 0.5–3.2 | 0.74 ± 0.2 | 0.4–1.0 | Z = 4.47 | <0.001 (HS) |
| D. Bilirubin (mg/dL) | 0.3 ± 0.2 | 0.1–0.8 | 0.15 ± 0.06 | 0.1–0.3 | Z = 4.67 | <0.001 (HS) |
| Glucose (mg/dL) | 167.88 ± 35.84 | 100–230 | 101.5 ± 12.78 | 85–142 | t = 12.34 | <0.001 (HS) |
| Albumin (g/dL) | 3.54 ± 0.51 | 2.1–4.2 | 3.84 ± 0.22 | 3.5–4.2 | Z = 3.17 | 0.001 (S) |
| AFP (ng/mL) | 35.94 ± 30.15 | 5–125 | 5.96 ± 2.02 | 2.9–10.0 | Z = 6.46 | <0.001 (HS) |
| HCV PCR | 632,998 ± 1,040,269 | 2,300–3,900,000 | Negative | Negative | - | - |
| Alkaline phosphatase (IU/L) | 251.76 ± 118.65 | 160–622 | 193.52 ± 42.3 | 125–320 | Z = 2.97 | 0.003 (S) |
| Hepcidin (ng/mL) | 26.24 ± 11.41 | 5–55 | 57.73 ± 41.31 | 2.9–150.0 | t = 5.20 | <0.001 (HS) |
| INR | 1.04 ± 0.19 | 0.7–1.5 | 1.00 ± 0.07 | 0.9–1.2 | t = 1.54 | 0.13 |
| GGT (IU/L) | 49.52 ± 21.84 | 15–105 | 34.04 ± 9.21 | 24–59 | t = 4.62 | <0.001 (HS) |
| Vitamin D (ng/mL) | 13.72 ± 4.28 | 6.8–20.6 | 27.49 ± 6.26 | 9.3–34.0 | t = 12.84 | <0.001 (HS) |
| Iron (μg/dL) | 189.56 ± 44.71 | 100–265 | 140.68 ± 29.18 | 100–199 | t = 6.47 | <0.001 (HS) |
| Ferritin (ng/mL) | 215.72 ± 32.96 | 145–306 | 96.8 ± 31.14 | 27–180 | t = 18.54 | <0.001 (HS) |
| H/F | 0.12 ± 0.06 | 0.02–0.25 | 0.68 ± 0.69 | 0.03–4.00 | Z = 5.04 | <0.001 (HS) |
| Platelet count (cells/μL) | 182.94 ± 53.88 | 102–300 | 448,320 ± 656,562.1 | 180,000–3,000,000 | Z = 8.63 | <0.001 (HS) |
| Hb (g/dL) | 11.14 ± 1.06 | 9–13 | 11.88 ± 1.7 | 9–15 | t = 2.60 | 0.01 (S) |
| WBC count (cells/μL) | 5,204.56 ± 1,684.55 | 2,300–8,900 | 7,196 ± 2,282.4 | 2500–12,000 | t = 4.96 | <0.001 (HS) |
| Hepcidin expression | 4.72 ± 3.14 | 1–11 | 10.34 ± 3.47 | 4–18 | t = 8.49 | <0.001 (HS) |
ALT: alanine transaminase; AST: aspartate aminotransferase; T. Bilirubin: total bilirubin; D. Bilirubin: direct bilirubin; AFP: alpha fetoprotein; PCR: polymerase chain reaction; INR: international normalized ratio; GGT: gamma-glutamyl transferase test; H/F: hepcidin/ferritin; Hb: hemoglobin; WBC: white blood cell.
Hepcidin expression showed significant positive correlations with HCV PCR titre (r = 0.31, P < 0.03) as shown in Figure 1.
Figure 1.
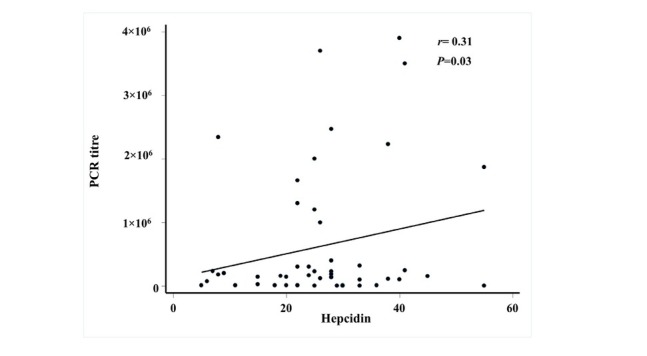
Correlation between hepatitis C virus titre and level of hepcidin expression HCV titre was measured by polymerase chain reaction (PCR) quantitative assays using ARTUS Qiagen kit (Qiagen, Hilden, Germany) in copy numbers. Quantification of hepcidin (HAMP) gene was performed on RNA extracted from peripheral blood of all patients using TaqMan_ GeneExpression assay (Applied Biosystems Inc, Foster City, CA, USA). Relative mRNA quantification was calculated using the arithmetic formula 2 − ΔC T, where ΔCT is the difference between the CT of a hepcidin mRNA expression and B-actin. The results show that there is positive significant fair correlation between hepcidin expression and HCV PCR titre with correlation coefficient (r) = 0.31 and P-value = 0.03
Also, correlation with some biochemical parameters revealed that there were significant positive correlations between serum hepcidin level and hepcidin expression with each of serum iron (r = 0.32 with hepcidin, 0.34 with hepcidin expression), ferritin (r = 0.28, r = 0.48), and H/F ratio (r = 0.91, r = 0.53). There were significant negative correlations with serum level of vitamin D (r = −0.37,
r = −0.29) and serum bilirubin (total and direct) (r = −0.44, r = −0.41) as shown in Table 2.
Table 2.
Correlations of hepcidin, hepcidin expression, and vitamin D with all laboratory parameters in patients group:
| Variables | Hepcidin | Hepcidin expression | Vitamin D | |||
|---|---|---|---|---|---|---|
| (n = 50) | Correlation coefficient (r) | P-value | Correlation coefficient (r) | P-value | Correlation coefficient (r) | P-value |
| Hepcidin (ng/mL) | 1.00 | |||||
| Hepcidin expression | 0.43 | 0.002 | 1.00 | |||
| Vitamin D(ng/mL) | −0.37 | 0.007 | −0.29 | 0.04 | 1.00 | |
| ALT (IU/L) | 0.08 | 0.57 | 0.12 | 0.39 | −0.04 | 0.80 |
| AST (IU/L) | −0.03 | 0.84 | 0.06 | 0.69 | −0.05 | 0.74 |
| T. Bilirubin(mg/dL) | −0.44 | 0.001 | −0.41 | 0.003 | 0.21 | 0.14 |
| D. Bilirubin(mg/dL) | −0.45 | 0.001 | −0.37 | 0.008 | 0.09 | 0.52 |
| Glucose (mg/dL) | 0.07 | 0.61 | 0.09 | 0.52 | −0.31 | 0.03 |
| Albumin (g/dL) | 0.07 | 0.61 | 0.12 | 0.42 | 0.13 | 0.37 |
| AFP (IU/L) | −0.09 | 0.52 | −0.03 | 0.81 | −0.26 | 0.07 |
| HCV PCR | 0.31 | 0.03 | 0.31 | 0.03 | −0.31 | 0.03 |
| Alkaline phosphatase (IU/L) | −0.28 | 0.049 | −0.24 | 0.10 | −0.03 | 0.84 |
| INR | −0.11 | 0.45 | 0.03 | 0.84 | −0.30 | 0.03 |
| GGT (IU/L) | −0.04 | 0.76 | 0.02 | 0.87 | −0.28 | 0.047 |
| Iron (µg/dL) | 0.34 | 0.01 | 0.32 | 0.02 | −0.22 | 0.12 |
| Ferritin (ng/mL) | 0.28 | 0.049 | 0.48 | <0.001 | −0.12 | 0.41 |
| H/F | 0.91 | <0.001 (HS) | 0.53 | <0.001 | −0.45 | 0.001 |
| Platelets(cells/µL) | 0.08 | 0.57 | 0.03 | 0.85 | 0.21 | 0.14 |
| Hb (g/dL) | 0.13 | 0.36 | 0.33 | 0.02 | −0.09 | 0.53 |
| WBC count (cells/µL) | −0.002 | 0.99 | 0.14 | 0.32 | 0.04 | 0.78 |
| Child Pugh | 0.11 | 0.44 | −0.04 | 0.75 | 0.01 | 0.91 |
ALT: alanine transaminase; AST: aspartate aminotransferase; T. Bilirubin: total bilirubin: D. Bilirubin: direct bilirubin; AFP: alpha fetoprotein; PCR: polymerase chain reaction; GGT: gamma-glutamyl transferase test; H/F: hepcidin/ferritin; Hb: hemoglobin; WBC: white blood cell; r: Pearson correlation coefficient; ϱ: Spearman correlation coefficient.
Studying the correlation between the child Pugh score in the children with CHC with each of serum hepcidin, ferritin, hepcidin expression, and vitamin D showed that they were significantly higher (P< 0.001) in patients with Child Pugh scores B and C than in those with score A. While vitamin D was nonsignificantly higher (P< 0.23) in patients with Child Pugh score A than in those with scores B and C (Table 3).
Table 3.
Comparison of hepcidin, ferritin, hepcidin expression, and vitamin D levels according to the Child Pugh score in patients with HCV infection.
| Variables | Child Pugh A (n = 31) | Child Pugh B/C (n = 19) | t | P | ||
|---|---|---|---|---|---|---|
| Mean ± SD | Range | Mean ± SD | Range | |||
| Hepcidin (ng/mL) | 21.77 ± 9.97 | 5–40 | 33.53 ± 9.92 | 22–55 | 4.05 | <0.001 |
| Ferritin (ng/mL) | 207.77 ± 29.1 | 167–306 | 228.05 ± 36.44 | 145–300 | 3.16 | 0.003 |
| Hepcidin expression | 3.71 ± 2.54 | 1–11 | 6.37 ± 3.39 | 1–11 | 1.97 | 0.003 |
| Vitamin D (ng/mL) | 14.3 ± 3.9 | 7.8–20 | 12.79 ± 4.79 | 6.8–20.6 | 1.21 | 0.23 |
Discussion
Hepcidin is an iron homoeostasis regulator peptide responsible for the dietary iron absorption and cellular iron release.[12] It is produced by the liver and is present in human serum, and after subsequent N-terminal processing, smaller peptides with reduced activity are produced and accumulated in the urine.[13] Hepcidin is named from the site of its synthesis in hepatocytes (hep) together with its antimicrobial activity (cidin).[14] Hepcidin deploys the iron regulatory function by hampering the role of ferroportin that is responsible for exporting iron to macrophages and hepatocytes.[15] Hepcidin persuades the entrance and degradation of ferroportin, subsequently increasing iron levels inside the cells, reducing the dietary iron uptake, and reducing the concentration of circulating iron. Synthesis of hepatic hepcidin diminishes in cases of iron deficiency, hypoxia, anemia, and erythropoiesis because of the increased demand for circulating iron. While in cases of inflammation and infection, hepcidin synthesis is persuaded especially by inflammatory cytokines, such as IL-6, IL-1, and tumor necrosis factor (TNF)-α. Although the liver is the main site of hepcidin production, data concerning hepcidin levels in CLD especially in children are very limited.[16] In this study, serum hepcidin together with its expression in peripheral blood in children with CHC were measured; also, the associations of hepcidin levels with several laboratory parameters including vitamin D level were evaluated.
Children with CHC showed decreased serum hepcidin concentration, hepcidin expression, H/F ratio and higher serum ferritin than healthy controls; this is explained by the state of chronic inflammation and elevated iron stores in chronic liver infection, which leads to the reduction of hepcidin concentrations in relation to ferritin, resulting in a decreased H/F ratio. These results agree with previous studies in animal and cellular models that predict a direct
effect of HCV infection on liver hepcidin expression and so its serum concentration. Studies conducted in adult patients by Girelli et al[17] and Tsochatzis et al [18] found that serum hepcidin was significantly lower in patients with CHC than in controls. Some authors confirmed that obese children showed lower iron and transferrin saturation and higher hepcidin levels compared with controls.[19] Sikorska et al. studied 31 Polish patients with CHC (genotype 1) and found decreased hepcidin mRNA expression and more frequently iron deposits in hepatocytes than patients with chronic hepatitis B.[20] Reduction in hepcidin gene expression has been suggested to be the main etiology for iron overload in CHC.[21] In contrast to the above results, Terrence et al stated that there was no significant difference in serum hepcidin levels between patients with CLD and healthy control; this may be attributed to the nature of their patients, who were adult patients of different etiologies as HBV infection and alcoholic liver disease.[22]
In this study, serum hepcidin concentration was significantly positively correlated with hepcidin expression, HCV PCR titer, iron, ferritin, and H/F ratio but negatively correlated with concentrations of vitamin D and bilirubin (total and direct). These results agree with Girelli et al[17] and Terrence et al[22] and disagree with del Giudice et al[19] who observed inverse correlations between hepcidin and iron, transferrin saturation, and iron absorption in obese children considering obesity a low-grade inflammatory disease. On the other hand, Tsochatzis et al didn’t find correlation between serum hepcidin levels and liver hepcidin, serum iron, or ferritin saturation levels in patients with CHC.[18] This variability could be attributed to differences in patients’ demographics, disease characteristics, and ethnicity. Also, concentration of both hepcidin and ferritin in our study were higher in patients with Child Pugh scores B and C than in those with score A (P<0.001) as hepcidin expression in liver is controlled not only by liver functions but also by local reactive oxygen species and local cytokine expression that may impact the serum hepcidin level oppositely.
Abd Elmonem et al also found that the expression of hepcidin was significantly positively correlated with serum albumin and prothrombin levels and Hb and was negatively correlated with serum ferritin and hepatic iron index.[23] Concluding that hepcidin mRNA is more suppressed in the liver tissues of patients with HCC than in patients with CHC, suggesting that hepcidin expression appears to be appropriately responsive to iron status and disease progression in liver cirrhosis and carcinogenesis. Thus the assessment of hepcidin mRNA is a good prognostic element for the evaluation of liver disease and its progression. Children with CHC in this study had vitamin D deficiency (13.72 ± 4.28 ng/mL) compared to controls (27.49 ± 6.26 ng/dL), and there was statistically significant negative correlation between vitamin D level with serum hepcidin (r = −0.37), hepcidin expression (r = −0.29), and HCV load (r = −0.31) in those patients as shown in Table 2. This comes in agreement with Abu Shady et al who found that half of their patients with confirmed diagnosis of HCV infection-related CLD had vitamin D deficiency (<30 ng/mL) and they also found a significant inverse association between stages of liver fibrosis and serum 25-hydroxyl vitamin D level.[24] Another study conducted by Arteh et al also stated that vitamin D was deficient in 92% of 118 patients with CLD, among whom 43 were patients with cirrhotic HCV infection.[25, 26] On the contrary, Khedr et al found that vitamin D was higher in children with CHC than normal controls with borderline significance; this difference may be due to milder state of liver infection in their patients’ group than our groups.[27]
Vitamin D suppresses proinflammatory cytokines, increasing anti-inflammatory cytokines and improving CD4 T-cell responsiveness. Vitamin D plays a significant role in the inflammatory responses against HCV through the inhibition of TNF-α, which regulates the immune response and constrains the fibrosis process by inhibiting tumor growth factor (TGF)-β, influencing fibrosis progression.[28] Worth mentioning that Nimer et al found that adding with vitamin D (1,000–4,000 IU/day) to the previous standard of care treatment for HCV infection gave a higher significant sustained virological response (SVR) in HCV genotype 2 and 3 patients than those without vitamin D treatment in patients with CHC.[26] Other in vitro studies supported the significance of vitamin D in CHC infection, they concluded that 25-OH vitamin D act as a suppressive factor of HCV replication.[29, 30] Vitamin D ameliorates the necroinflammatory process and inhibits liver fibrosis, and so, its deficiency leads to the progression of chronic hepatitis.[31, 32]Also a study conducted in Italian patients who were treated for recurrent HCV infection after transplantation found that concomitant treatment with vitamin D led to significantly higher SVR rates because of its synergistic effect against HCV infection.[33] Thus vitamin D deficiency is a risk factor in patients infected with HCV and that its supplementation may protect against the progression of liver disease.
This work represents an advance in biomedical science because it shows that assessing hepcidin and vitamin D levels in children with CHC infection may have a prognostic value and is promising in the follow-up of the severity of liver disease.
Conclusion
According to our illustrated results, it is clearly found that hepcidin, ferritin, and hepcidin expression are significantly correlated with the prediction of liver disease progression. Thus monitoring hepcidin and also detecting vitamin D levels could be crucial in the follow-up of CHC in children to warrant their prognostic values.
Footnotes
Conflict of Interest The authors report no conflict of interests
References
- 1.Anderson G, Frazer D. Hepatic iron metabolism. Semin Liver Dis. 2005;25:420–32. doi: 10.1055/s-2005-923314. [DOI] [PubMed] [Google Scholar]
- 2.Nemeth E. Hepcidin biology and therapeutic applications. Expert Rev Hematol. 2010;3:153–5. doi: 10.1586/ehm.10.1. [DOI] [PubMed] [Google Scholar]
- 3.Nemeth E, Valore EV, Territo M, Schiller G, Lichtenstein A, Ganz T. Hepcidin, a putative mediator of anemia of inflammation, is a type II acute-phase protein. Blood. 2003;101:2461–3. doi: 10.1182/blood-2002-10-3235. [DOI] [PubMed] [Google Scholar]
- 4.Viatte L, Vaulont S. Hepcidin, the iron watcher. Biochimie. 2009;91:1223–8. doi: 10.1016/j.biochi.2009.06.012. [DOI] [PubMed] [Google Scholar]
- 5.Miura K, Taura K, Kodama Y, Schnabl B, Brenner DA. Hepatitis C virus-induced oxidative stress suppresses hepcidin expression through increased histone deacetylase activity. Hepatology. 2008;48:1420–9. doi: 10.1002/hep.22486. [DOI] [PubMed] [Google Scholar]
- 6.Zhang X, Rovin BH. Hepcidin expression by human monocytes in response to adhesion and pro-inflammatory cytokines. Biochim Biophys Acta. 2010;1800:1262–1267. doi: 10.1016/j.bbagen.2010.08.005. [DOI] [PMC free article] [PubMed] [Google Scholar]
- 7.Shan Y, Lambrecht RW, Bonkovsky HL. Association of Hepatitis C Virus Infection with Serum Iron Status: Analysis of Data from the Third National Health and Nutrition Examination Survey[J] Clin Infect Dis2005; 40:834–41. doi: 10.1086/428062. [DOI] [PubMed] [Google Scholar]
- 8.Ganz T, Nemeth E. Hepcidin and iron homeostasis. Biochim Biophys Acta. 2012;1823:1434–43. doi: 10.1016/j.bbamcr.2012.01.014. [DOI] [PMC free article] [PubMed] [Google Scholar]
- 9.Kuntsevich NV. Hepcidin hormone and exchange of iron metabolism. Laboratory2010; 3:8–10. [Google Scholar]
- 10.Sandeep Poddar. Hepatitis C and iron over load. Malays J Med Res. 2017;1:25–30. [Google Scholar]
- 11.Cholongitas E, Papatheodoridis GV, Vangeli M, Terreni N, Patch D, Burroughs AK. Systematic review: The model for end-stage liver disease-should it replace Child-Pugh’s classification for assessing prognosis in cirrhosis? Aliment Pharmacol Ther. 2005;22:1079–89. doi: 10.1111/j.1365-2036.2005.02691.x. [DOI] [PubMed] [Google Scholar]
- 12.Papandreou D, Malindretos P, Karabouta Z, Rousso I. Possible Health Implications and Low Vitamin D Status during Childhood and Adolescence: An Updated Mini Review. Int J Endocrinol. 2010;2010:1–7. doi: 10.1155/2010/472173. [DOI] [PMC free article] [PubMed] [Google Scholar]
- 13.Park CH, Valore EV, Waring AJ, Ganz T. Hepcidin, a urinary antimicrobial peptide synthesized in the liver. J Biol Chem. 2001;276:7806–10. doi: 10.1074/jbc.M008922200. [DOI] [PubMed] [Google Scholar]
- 14.Politou M, Papanikolaou G. Hepcidin: A key iron regulator involved in the pathogenesis of anaemia of chronic disease. Haema. 2004;7:165‐74. [Google Scholar]
- 15.Nemeth E, Tuttle MS, Powelson J, Vaughn MB, Donovan A, Ward DM. Hepcidin regulates cellular iron efflux by binding to ferroportin and inducing its internalization. Science. 2004;306:2090–3. doi: 10.1126/science.1104742. [DOI] [PubMed] [Google Scholar]
- 16.Tan TCH, Crawford DHG, Franklin ME, Jaskowski LA, Macdonald GA, Jonsson JR. The serum hepcidin:ferritin ratio is a potential biomarker for cirrhosis. Liver Int. 2012;32:1391–9. doi: 10.1111/j.1478-3231.2012.02828.x. [DOI] [PubMed] [Google Scholar]
- 17.Girelli D, Pasino M, Goodnough JB. Reduced serum hepcidin levels in patients with chronic hepatitis C. J Hepatol. 2009;51:845. doi: 10.1016/j.jhep.2009.06.027. [DOI] [PMC free article] [PubMed] [Google Scholar]
- 18.Tsochatzis E, Papatheodoridis GV, Koliaraki V, Hadziyannis E, Kafiri G, Manesis EK. Serum hepcidin levels are related to the severity of liver histological lesions in chronic hepatitis C. J Viral Hepatitis. 2010;17:800–6. doi: 10.1111/j.1365-2893.2009.01244.x. [DOI] [PubMed] [Google Scholar]
- 19.Del Giudice EM, Santoro N, Amato A, Brienza C, Calabrò P, Wiegerinck ET. Hepcidin in obese children as a potential mediator of the association between obesity and iron deficiency. J Clin Endocrinol Metab. 2009;94:5102–7. doi: 10.1210/jc.2009-1361. [DOI] [PubMed] [Google Scholar]
- 20.Sikorska K, Romanowski T, Stalke P, Izycka Swieszewska E, Bielawski KP. Association of hepcidin mRNA expression with hepatocyte iron accumulation and effects of antiviral therapy in chronic hepatitis C infection. Hepat Mon. 2014;14:e21184. doi: 10.5812/hepatmon.21184. [DOI] [PMC free article] [PubMed] [Google Scholar]
- 21.Stechschulte SA, Kirsner RS, Federman DG. Vitamin D: bone and beyond, rationale and recommendations for supplementation. Am J Med. 2009;122:793–802. doi: 10.1016/j.amjmed.2009.02.029. [DOI] [PubMed] [Google Scholar]
- 22.Terrence CH, Darrel HG, Crawford G. The serum hepcidin:ferritin ratio is a potential biomarker for cirrhosis. Liver Int. 2012;10:1391. doi: 10.1111/j.1478-3231.2012.02828.x. [DOI] [PubMed] [Google Scholar]
- 23.Abd Elmonem E, Tharwat el-S, Farag MA, Fawzy A, Fawzy A, El Shinnawy SF, Suliman S. Hepcidin mRNA level as a parameter of disease progression in chronic hepatitis C and hepatocellular carcinoma. J Egypt Natl Canc Inst. 2009;21:333–42. [PubMed] [Google Scholar]
- 24.Abu Shady MM, Yasser E, Nassef YE, Mansour M, Galal EM, Hamed MAE. Evaluation of the role of vitamin D levels in predicting chronic liver disease development in a group of Egyptian children infected with the hepatitis C virus. Med Res J 2013. 12:69–75. [Google Scholar]
- 25.Arteh J, Narra S, Nair S. Prevalence of vitamin D deficiency in chronic liver disease. Dig Dis Sci. 2010;55:2624–8. doi: 10.1007/s10620-009-1069-9. [DOI] [PubMed] [Google Scholar]
- 26.Nimer A, Mouch A. Vitamin D improves viral response in hepatitis C genotype 2–3 naïve patients. World J Gastroenterol. 2012;18:800–5. doi: 10.3748/wjg.v18.i8.800. [DOI] [PMC free article] [PubMed] [Google Scholar]
- 27.Khedr MA, Sira AM, Saber MA, Raia GY. Serum Adiponectin, Vitamin D, and Alpha-Fetoprotein in Children with Chronic Hepatitis C: Can They Predict Treatment Response? Int J Hepatol. 2015;2015:617623. doi: 10.1155/2015/617623. [DOI] [PMC free article] [PubMed] [Google Scholar]
- 28.Tan X, Li Y, Liu Y. Therapeutic role and potential mechanisms of active Vitamin D in renal interstitial fibrosis. J Steroid Biochem Mol Biol. 2007;103:491–96. doi: 10.1016/j.jsbmb.2006.11.011. [DOI] [PMC free article] [PubMed] [Google Scholar]
- 29.Gal-Tanamy M1, Bachmetov L, Ravid A, Koren R, Erman A, Tur-Kaspa R. Vitamin D: an innate antiviral agent suppressing hepatitis C virus in human hepatocytes. Hepatology. 2011;54:1570–79. doi: 10.1002/hep.24575. [DOI] [PubMed] [Google Scholar]
- 30.Matsumura T, Kato T, Sugiyama N, Tasaka-Fujita M, Murayama A, Masaki T. 25-Hydroxyvitamin D3 suppresses hepatitis C virus production. Hepatology. 2012;56:1231–39. doi: 10.1002/hep.25763. [DOI] [PubMed] [Google Scholar]
- 31.Petta S, Cammà C, Scazzone C, Tripodo C, Di Marco V, Bono A. Low vitamin D serum level is related to severe fibrosis and low responsiveness to interferon based therapy in genotype 1 chronic hepatitis C. Hepatology. 2010;51:1158–67. doi: 10.1002/hep.23489. [DOI] [PubMed] [Google Scholar]
- 32.Lange CM, Bojunga J, Ramos-Lopez E, von Wagner M, Hassler A, Vermehren J. Vitamin D deficiency and a CYP27B1-1260 promoter polymorphism are associated with chronic hepatitis C and poor response to interferon-alfa based therapy. J Hepatol2011. 54:887–93. doi: 10.1016/j.jhep.2010.08.036. [DOI] [PubMed] [Google Scholar]
- 33.Bitetto D, Fabris C, Fornasiere E, Pipan C, Fumolo E, Cussigh A. Vitamin D supplementation improves response to antiviral treatment for recurrent hepatitis C. Transpl Int. 2011;24:43–50. doi: 10.1111/j.1432-2277.2010.01141.x. [DOI] [PubMed] [Google Scholar]