

Abstract
Background
Non‐invasive ventilation may be a means to temporarily reverse or slow the progression of respiratory failure in cystic fibrosis by providing ventilatory support and avoiding tracheal intubation. Using non‐invasive ventilation, in the appropriate situation or individuals, can improve lung mechanics through increasing airflow and gas exchange and decreasing the work of breathing. Non‐invasive ventilation thus acts as an external respiratory muscle. This is an update of a previously published review.
Objectives
To compare the effect of non‐invasive ventilation versus no non‐invasive ventilation in people with cystic fibrosis for airway clearance, during sleep and during exercise.
Search methods
We searched the Cochrane Cystic Fibrosis and Genetic Disorders Group Trials Register comprising references identified from comprehensive electronic database searches, handsearching relevant journals and abstract books of conference proceedings. We searched the reference lists of each trial for additional publications possibly containing other trials.
Most recent search: 08 August 2016.
Selection criteria
Randomised controlled trials comparing a form of pressure preset or volume preset non‐invasive ventilation to no non‐invasive ventilation used for airway clearance or during sleep or exercise in people with acute or chronic respiratory failure in cystic fibrosis.
Data collection and analysis
Three reviewers independently assessed trials for inclusion criteria and methodological quality, and extracted data.
Main results
Ten trials met the inclusion criteria with a total of 191 participants. Seven trials evaluated single treatment sessions, one evaluated a two‐week intervention, one evaluated a six‐week intervention and one a three‐month intervention. It is only possible to blind trials of airway clearance and overnight ventilatory support to the outcome assessors. In most of the trials we judged there was an unclear risk of bias with regards to blinding due to inadequate descriptions. The six‐week trial was the only one judged to have a low risk of bias for all other domains. One single intervention trial had a low risk of bias for the randomisation procedure with the remaining trials judged to have an unclear risk of bias. Most trials had a low risk of bias with regard to incomplete outcome data and selective reporting.
Six trials (151 participants) evaluated non‐invasive ventilation for airway clearance compared with an alternative chest physiotherapy method such as the active cycle of breathing techniques or positive expiratory pressure. Three trials used nasal masks, one used a nasal mask or mouthpiece and one trial used a face mask and in one trial it is unclear. Three of the trials reported on one of the review's primary outcome measures (quality of life). Results for the reviews secondary outcomes showed that airway clearance may be easier with non‐invasive ventilation and people with cystic fibrosis may prefer it. We were unable to find any evidence that non‐invasive ventilation increases sputum expectoration, but it did improve some lung function parameters.
Three trials (27 participants) evaluated non‐invasive ventilation for overnight ventilatory support compared to oxygen or room air using nasal masks (two trials) and nasal masks or full face masks (one trial). Trials reported on two of the review's primary outcomes (quality of life and symptoms of sleep‐disordered breathing). Results for the reviews secondary outcome measures showed that they measured lung function, gas exchange, adherence to treatment and preference, and nocturnal transcutaneous carbon dioxide. Due to the small numbers of participants and statistical issues, there were discrepancies in the results between the RevMan and the original trial analyses. No clear differences were found between non‐invasive ventilation compared with oxygen or room air except for exercise performance, which significantly improved with non‐invasive ventilation compared to room air over six weeks.
One trial (13 participants) evaluated non‐invasive ventilation on exercise capacity (interface used was unclear) and did not reported on any of the review's primary outcomes. The trial found no clear differences between non‐invasive ventilation compared to no non‐invasive ventilation for any of our outcomes.
Three trials reported on adverse effects. One trial, evaluating non‐invasive ventilation for airway clearance, reported that a participant withdrew at the start of the trial due to pain on respiratory muscle testing. One trial evaluating non‐invasive ventilation for overnight support reported that one participant could not tolerate an increase in inspiratory positive airway pressure. A second trial evaluating non‐invasive ventilation in this setting reported that one participant did not tolerate the non‐invasive ventilation mask, one participant developed a pneumothorax when breathing room air and two participants experienced aerophagia which resolved when inspiratory positive airway pressure was decreased.
Authors' conclusions
Non‐invasive ventilation may be a useful adjunct to other airway clearance techniques, particularly in people with cystic fibrosis who have difficulty expectorating sputum. Non‐invasive ventilation, used in addition to oxygen, may improve gas exchange during sleep to a greater extent than oxygen therapy alone in moderate to severe disease. The effect of NIV on exercise is unclear. These benefits of non‐invasive ventilation have largely been demonstrated in single treatment sessions with small numbers of participants. The impact of this therapy on pulmonary exacerbations and disease progression remain unclear. There is a need for long‐term randomised controlled trials which are adequately powered to determine the clinical effects of non‐invasive ventilation in cystic fibrosis airway clearance and exercise.
Keywords: Humans, Sputum, Cystic Fibrosis, Cystic Fibrosis/therapy, Masks, Noninvasive Ventilation, Noninvasive Ventilation/methods, Randomized Controlled Trials as Topic, Respiratory Insufficiency, Respiratory Insufficiency/prevention & control
Plain language summary
A machine pushes air into the lungs helping people with cystic fibrosis breathe, clear mucus, reduce respiratory failure, improve exercise tolerance
Review question
We reviewed the evidence that mechanically pushing air into the lungs through a mask helps clear mucus, improves breathing overnight, reduces respiratory failure and improves exercise tolerance.
Background
As cystic fibrosis worsens, breathing becomes difficult, indicating the start of respiratory failure (too much carbon dioxide and not enough oxygen in the blood). As respiratory failure progresses, people may become breathless and have problems clearing mucus. Respiratory failure eventually results in death.
Non‐invasive ventilation administers room air or oxygen through a mask and has been used to help people with more severe cystic fibrosis to clear their airways of mucus and improve breathing during sleep; it may also help with exercise. It is not certain exactly how this works, but it might reduce fatigue in the respiratory muscles, stop the airways from closing during prolonged exhalation and reduce the effort needed to maintain ventilation and oxygen levels. Treatment has been recommended when breathing muscles are weak, when a person has difficulty clearing mucus using other airway clearance techniques or when there are high levels of carbon dioxide in the blood during sleep or during exercise.
This is an update of a previously published review.
Search date
Evidence is current to 08 August 2016.
Study characteristics
This review includes 10 trials (191 people with cystic fibrosis) ‐ seven single‐treatment sessions and a two‐week trial, a six‐week trial and a three‐month trial. Six single‐treatment trials, the two‐week trial and the three‐month trial compared non‐invasive ventilation with other airway clearance techniques. Two single‐treatment trials and the six‐week trial looked at non‐invasive ventilation for overnight breathing support compared to oxygen or normal room air. One single‐treatment trial compared non‐invasive ventilation with no additional treatment during an exercise test.
Key results
Single‐treatment trials of non‐invasive ventilation for airway clearance showed that this may be easier with non‐invasive ventilation and people with cystic fibrosis may prefer it to other methods. We could not find evidence that non‐invasive ventilation increased the amount of mucus coughed up, but it did improve some measures of lung function, at least in the short term. The two‐week trial did not demonstrate clear benefits between groups. The original three‐month trial report stated an improvement in lung clearance index. One person in one of these trials reported pain on respiratory muscle testing.
The three trials comparing overnight support from non‐invasive ventilation measured lung function, quality of life and carbon dioxide levels; they showed it is effective, safe and acceptable. We found no clear differences between non‐invasive ventilation and oxygen or room air, except for exercise performance which improved with non‐invasive ventilation compared to room air after six weeks. Two trials reported side effects. In the first trial, one person found the mask uncomfortable. In the second trial, one person in the room air group had collapsed lungs and two people could not tolerate increased pressure when breathing in.
The trial comparing the effects of non‐invasive ventilation to no treatment on exercise capacity found no clear differences between groups.
Non‐invasive ventilation may help alongside other airway clearance techniques, particularly when people with cystic fibrosis have difficulty coughing up mucus and during sleep. Long‐term trials are needed with enough people to show the clinical effects of non‐invasive ventilation on airway clearance, during sleep and exercise training in severe disease.
Quality of the evidence
The benefits of non‐invasive ventilation have largely been demonstrated in single‐treatment sessions with only small numbers of people. There is limited evidence of some longer‐term improvement in lung function in one trial. Our results from the trials of overnight breathing support differed from those in the original analyses, this is likely due to the small numbers of participants and some statistical issues. We judged only the six‐week trial to be free from any bias. In the remaining trials, we thought there were low or unclear chances of the results being affected because data were either reported only partially or not at all. We were not sure if the way in which participants were put into the different treatment groups would affect the results of the trials.
Background
Description of the condition
Cystic fibrosis (CF) is the most common life‐limiting autosomal recessively genetically inherited disease in Caucasian populations, with a carrier rate of 1 in 25 and an incidence of 1 in 2,500 live births (UK CF Trust 2011). Although this is a multisystem disease, the primary cause of death in CF is respiratory failure. Respiratory failure can be defined as the inability of the respiratory pump and lungs to maintain adequate gas exchange and is characterised by abnormalities of arterial blood gas tensions (Davidson 2016).
In CF, severe airway obstruction and inflammatory bronchiectatic processes results in sputum retention, an increase in breathlessness, hyperinflation, ventilation perfusion mismatch, a decrease in respiratory muscle strength, and an inability to maintain arterial oxygenation within normal limits. When this occurs, reflex hypoxic vasoconstriction results in elevation of the blood pressure within the pulmonary circulation, right ventricular strain and, eventually, cor pulmonale.
Description of the intervention
With non‐invasive mask ventilation, positive pressure ventilatory assistance can be delivered in the form of inspiratory pressure support (pressure pre‐set) systems which deliver a variable volume according to a pre‐set inspiratory pressure. Alternatively, a set tidal volume (volume pre‐set) system may be used which delivers a fixed tidal volume irrespective of the airway pressure required to generate this volume. The earliest trials of non‐invasive ventilation (NIV) employed volume pre‐set equipment. However, later trials have used pressure pre‐set devices, primarily due to simplicity and the comfort of the individual. The NIV machines entrain room air and additional oxygen may be entrained into the ventilatory tubing, or directly into the mask.
How the intervention might work
Non‐invasive ventilation may be beneficial in acute respiratory failure in CF and could have a role to play in the management of chronic respiratory failure by acting as a bridge to transplantation as it may reverse or stabilise hypercapnia and hypoxaemia by improving alveolar ventilation, reducing respiratory muscle fatigue, or both (Hodson 1991; Piper 1992; Yankaskas 1999). The exact mechanisms by which NIV induces these changes may be different in acute and chronic disease and consequently different outcome measures may be necessary to reflect adequately the efficacy of NIV in acute and chronic respiratory failure in CF.
Clinically, NIV has been used as an adjunct to airway clearance techniques in people with CF and moderate to severe disease. The exact mechanisms by which NIV may assist airway clearance are unclear, but it is postulated that decreased respiratory muscle fatigue and prevention of airway closure during prolonged expirations may ultimately lead to an increase in effective alveolar ventilation, better compliance with airway clearance and increased sputum clearance (Holland 2003). Furthermore, recent guidelines state that NIV should be used for airway clearance in people with CF if there is respiratory muscle weakness or fatigue; where desaturation is present during airway clearance techniques; or when an individual has difficulty clearing secretions with other airway clearance techniques (Bott 2009).
In people with CF, NIV has also been used during sleep when decreases in respiratory neuromuscular output exaggerate these changes and lead to nocturnal hypoventilation before daytime respiratory failure becomes evident (Ballard 1996). While the addition of nocturnal oxygen improves hypoxaemia and may have favourable effects on cor pulmonale, it has not been shown to affect the progression of disease in CF (Zinman 1989). There is also some evidence that the use of oxygen therapy may be at the expense of worsening hypercapnia (Gozal 1997; Milross 2001). The use of NIV has been proposed as a means to temporarily reverse this process by assisting nocturnal ventilation, thereby slowing the progression of respiratory failure. The aim of NIV is to reduce hypoventilation and improve gas exchange by increasing minute ventilation and reducing the work of breathing without the associated complication of endotracheal intubation.
Finally, NIV has also been used during exercise in people with CF. There is a reasoned argument for using NIV during exercise to decrease dyspnoea and increase oxygenation resulting in an improvement in exercise tolerance; however there is no objective evidence to support this at present (Bott 2009).
Why it is important to do this review
It has been proposed that NIV may have a role in airway clearance, during sleep and during exercise in people with CF. In order to establish an evidence base for the use of NIV, this review will aim to determine the effect of NIV in the management of acute and chronic respiratory failure in CF.
This is an update of previous versions of this review (Moran 2003; Moran 2007; Moran 2011; Moran 2013).
Objectives
The aim of this review is to compare the effect of pressure pre‐set or volume pre‐set NIV (that aims to increase minute ventilation) to no NIV in people with CF for airway clearance, during sleep and during exercise.
Methods
Criteria for considering studies for this review
Types of studies
Randomised controlled clinical trials.
Types of participants
People with CF, of any age, diagnosed on the basis of clinical criteria and sweat testing or genotype analysis with any type of acute and chronic respiratory failure.
Types of interventions
Any type of prescribed pressure preset or volume preset method of NIV will be considered and compared to any other management strategy for acute and chronic respiratory failure.
Types of outcome measures
Primary outcomes
Mortality
Quality of life (QoL)
Symptoms of sleep‐disordered breathing
Secondary outcomes
Lung function
Gas exchange
Respiratory symptom scores and sputum production
Exercise tolerance
Impact on health resources
Nocturnal polysomnography
Nutrition and weight
Right‐sided cardiac function
Cost
Adherence to treatment and preference
Adverse events
Search methods for identification of studies
Electronic searches
Relevant trials were identified from the Group's Cystic Fibrosis Trials Register using the terms: ventilatory support AND non‐invasive.
The Cystic Fibrosis Trials Register is compiled from electronic searches of the Cochrane Central Register of Controlled Trials (CENTRAL) (updated each new issue of the Cochrane Library), weekly searches of MEDLINE, a search of Embase to 1995 and the prospective handsearching of two journals ‐ Pediatric Pulmonology and theJournal of Cystic Fibrosis. Unpublished work is identified by searching through the abstract books of three major cystic fibrosis conferences: the International Cystic Fibrosis Conference; the European Cystic Fibrosis Conference and the North American Cystic Fibrosis Conference. For full details of all searching activities for the register, please see the relevant sections of the Cystic Fibrosis and Genetic Disorders Group's website.
Date of the most recent search of the Group's CF Trials Register: 08 August 2016.
Searching other resources
The bibliographic references of all retrieved trials were assessed for additional reports of trials.
Data collection and analysis
Selection of studies
Three authors (JB, AP, FM) independently selected the trials to be included in the review using a pro forma to capture the main inclusion criteria listed above. Disagreement did not arise on the suitability of a trial for inclusion in the review. However if this occurs for future updates of this review, the authors plan to reach a consensus by discussion.
Data extraction and management
Two authors independently extracted data using standard data acquisition forms: FM and JB extracted data from seven trials (Dwyer 2015; Gozal 1997; Kofler 1998; Fauroux 1999; Milross 2001; Holland 2003; Young 2008); FM and AP extracted data from three trials (Placidi 2006; Lima 2014; Rodriguez Hortal 2016). Disagreement did not arise on the quality of a trial included in the review. However, if this occurs for future updates of this review, the authors plan to reach a consensus by discussion.
In a post hoc change short‐term trials were defined as those with a duration less than three months. The authors decided to analyse single‐night interventions separately from other short‐term trials as they did not feel it appropriate to combine them with other longer trials. They planned to group outcome data from longer‐term trials into those measured at three, six, twelve months and annually thereafter. In future, the authors will also consider examining any outcome data recorded at other time periods.
Assessment of risk of bias in included studies
In order to assess the risk of bias in the included trials (yes, no or unclear), the authors (as identified above) then assessed the methodological quality of each included trial based on a method described by Jüni (Jüni 2001). In particular, the authors examined details of the method of randomisation used, the method used to conceal allocation, whether the trial was blinded, whether assessors were independent or involved in the delivery of the interventions and if the number of participants lost to follow up or subsequently excluded from the trial were recorded. The authors assessed whether the primary investigators had made any statement regarding intention‐to‐treat analyses.
Measures of treatment effect
The authors combined data from all trials using the RevMan software (RevMan 2014). For continuous variables they calculated the mean difference (MD) and their 95% confidence intervals (CI). For count data from cross‐over trials, they used Poisson regression to analyse the data and they have presented the results as a relative rate. The authors carried out these analyses in Stata (Stata 2001) and present the results in RevMan (RevMan 2014).
There were no binary data in any of the trials included in this review. If the authors include binary data in future updates of this review, they will aim to calculate a pooled estimate of the treatment effect for each outcome across trials (the odds of an outcome among treatment allocated participants to the corresponding odds among controls).
Unit of analysis issues
Eight of the 10 trials included in this review were cross‐over in design. When conducting a meta‐analysis combining results from cross‐over trials the authors would have liked to have used the methods recommended by Elbourne (Elbourne 2002) and also by Curtin (Curtin 2002). However, due to restrictions on the data that were available, the authors treated the cross‐over trials as if they were parallel trials, except for the Milross trial where further individual participant data was provided by the trial authors (Milross 2001). Elbourne states that this approach will produce conservative results, as it does not take into account within‐patient correlation (Elbourne 2002). Also each participant will appear in both the treatment and control group, so the two groups will not be independent. This may explain discrepancies found between original trial analyses and data presented in the review (Data and analyses). Where the authors have found discrepancies, both data from the original analyses and the statistical analysis for the review are detailed in the results. Another possible reason for discrepancies is that the methods used to analyse data were not always identical between the original trial report and the review. The authors note where this is the case in the text of the Effects of interventions section.
Although three trials evaluated NIV as a method of overnight ventilation involving overnight sleep trials in groups of participants which were similar in terms of age, lung function, body mass index and resting arterial blood gases, the authors did not pool the results as the control group interventions were sufficiently different in the three trials (Gozal 1997; Milross 2001; Young 2008) and also one of these was six weeks in duration as compared to a single intervention (Young 2008).
Dealing with missing data
The review authors contacted several of the original Investigators for further information (Fauroux 1999; Gozal 1997; Holland 2003; Kofler 1998; Milross 2001; Placidi 2006). Holland and Milross provided further data for analysis (Holland 2003; Milross 2001) and Young clarified the study design (Young 2008). The review authors will contact authors of potentially eligible studies (currently reported in abstract form and only with very limited data) for future updates.
Assessment of heterogeneity
The review authors tested for heterogeneity between trial results using the I² statistic (Higgins 2003). This measure describes the percentage of total variation across trials that are due to heterogeneity rather than chance (Higgins 2003). The values of I² lie between 0% and 100%, and a simplified categorization of heterogeneity that we used is of low (I² value of 25%), moderate (I² value of 50%), and high (I² value of 75%) (Higgins 2003).
Assessment of reporting biases
The review authors identified potential reporting bias by comparing the 'Methods' section with the 'Results' section in the published papers to see if all stated outcome measures are reported in the results of the full publication. One trial is published in abstract format only, so in this case the comparison was not possible (Kofler 1998). In future updates, if the review authors include a sufficient number of trials, they plan to investigate potential publication bias using a funnel plot.
Data synthesis
The review authors have analysed the data using a fixed‐effect analysis. If in future, they establish heterogeneity between included trials, they will analyse the data using a random‐effects analysis.
Subgroup analysis and investigation of heterogeneity
Although the review authors planned to do so, at present it is not possible to investigate heterogeneity by age or disease severity or mode of ventilation. Some trials include adults and children with mixed disease severities, with insufficient data in each subsection for analysis. There is also insufficient data to facilitate subgroup analysis by mode of ventilation.
Sensitivity analysis
The review authors also planned to further investigate any heterogeneity by performing a sensitivity analysis based on the methodological quality of the included trials and will do so once there are sufficient trials to allow this.
A sensitivity analysis was performed entering the Placidi data separately so that participants were not counted twice i.e. either chest physiotherapy including directed cough or chest physiotherapy including PEP and both data were reported.
Results
Description of studies
A full list of abbreviations can be found in the additional tables section (Table 1).
1. List of abbreviations.
| Abbreviation | Definition | Explanation |
| 6MWT | six minute walk test | |
| ABG | analysis of arterial blood gases | |
| ACBT | active cycle of breathing technique | |
| AHI | apnoea/hypopnoea Index | |
| CF | cystic fibrosis | |
| COPD | chronic obstructive pulmonary disease | |
| CPAP | continuous positive airway pressure | a system that maintains a positive pressure in the circuitry and airways throughout inspiration and expiration |
| CPT | chest physiotherapy | |
| CSS | chest symptom score | a validated CF quality of life measurement on a scale of 0 (worst) to 100 (best) |
| ESS | Epworth sleepiness scale | a scale measuring sleepiness ranging from 0 (best) to 24 (worst) |
| FEF25‐75 | flow rate between 25% and 75% of maximal expiration | |
| FEV₁ | forced expiratory volume in 1 second | |
| FRC | functional residual capacity | resting volume of the lungs |
| FVC | forced vital capacity | total volume of air expired during a forced expiration following a full inspiration |
| Global PSQI | Global score Pittsburgh sleep quality index | sleep quality scale ranging from 0 (best) to 21 (worst) |
| LCI | lung clearance index | measured by multiple breath washouts; a sensitive measure of ventilation inhomogeneity |
| MEF50 | maximal expiratory flow with 50% of vital capacity remaining in the lung | |
| mmHg | millimetres of mercury | |
| mSpO2 | mean oxygen saturation | |
| MSWT | modified shuttle walk test | incremental exercise tolerance test with minimum clinically important difference = 40 m |
| nadirSpO₂ | the largest fall expressed in the absolute value of SpO₂ | |
| NIPPV | non‐invasive positive pressure ventilation | |
| NIV | non‐invasive ventilation | |
| NREM | non‐rapid eye movement | a phase during sleep |
| ODI | oxygen desaturation index | |
| OEP | optoelectronic plethysmography | |
| PaCO₂ | partial pressure of carbon dioxide in arterial blood | |
| PaO₂ | partial pressure of oxygen in arterial blood | |
| PEP | positive expiratory pressure | an airway clearance technique |
| PSV | pressure support ventilation | |
| QoL | quality of life | |
| RCT | randomised controlled trial | |
| RDI | respiratory disturbance index | |
| RE | respiratory exacerbations | |
| REM | rapid eye movement | a phase during sleep |
| RR | respiratory rate | |
| SaO₂ | saturation of haemoglobin with oxygen in arterial blood | |
| SD | standard deviation | |
| SOB | shortness of breath | |
| SpO2 | saturation of haemoglobin with oxygen using pulse oximetry | |
| *SpO2 max | the largest fall expressed as the difference with the SpO2 just before the manoeuvre | |
| *SpO₂ mean | the mean of *SpO₂ max during the whole chest physiotherapy period | |
| SWT | shuttle walk test | |
| TcCO₂ | transcutaneous carbon dioxide | |
| TDI | transitional dyspnoea index | a measurement of CF quality of life, scores ranging from ‐9 (worst) to +9 (best); the minimal clinically important difference is 1 unit |
| TLC | total lung capacity | total volume of air in lungs following a maximum inspiration |
| TST | total sleep time | |
| TWT | treadmill walking test | |
| VI | minute ventilation | |
| VT | tidal volume | volume air inspired or expired during normal breathing |
| IPAP | inspiratory positive airway pressure | |
| PImax | inspiratory respiratory muscle strength | |
| PEmax | expiratory respiratory muscle strength | |
| Vab | abdominal volume of the chest wall | variable calculated from OEP |
| Vrca | abdominal rib cage volume | variable calculated from OEP |
| Vrcp | pulmonary rib cage volume | variable calculated from OEP |
Results of the search
The searches identified 24 trials; 10 of these fulfilled the inclusion criteria and included a total of 191 participants (Dwyer 2015; Fauroux 1999; Gozal 1997; Holland 2003; Kofler 1998; Lima 2014; Milross 2001; Placidi 2006; Rodriguez Hortal 2016; Young 2008). A total of 13 trials were excluded (Elkins 2004; Falk 2006; Fauroux 2000a; Fauroux 2000b; Fauroux 2001; Fauroux 2004; Greenough 2004;Parreira 2008; Piper 1992; Regnis 1994; Serra 2000; Serra 2002; Riethmueller 2006). One trial is listed as 'Awaiting classification' until further details are published (Petrone 2009).
Included studies
Data from one of the included trials are reported in abstract form only (Kofler 1998). In one of the trials, NIV was compared to more than one intervention within the same trial (Placidi 2006). For this trial, independent analyses for NIV versus directed coughing and NIV versus positive expiratory pressure (PEP) are reported (Placidi 2006). Therefore, 10 trials contributing 11 randomised data sets have been included in this review.
Trial design
Eight of the included trials were cross‐over in design (Fauroux 1999; Gozal 1997; Holland 2003; Kofler 1998; Lima 2014; Milross 2001; Placidi 2006; Young 2008) and two employed a parallel design (Dwyer 2015; Rodriguez Hortal 2016). Due to the way data have been reported in the original papers, we have chosen to ignore the cross‐over design and treat the data from these trials as if it originated from parallel trials, except for the Milross trial for which individual patient data were obtained (see Data collection and analysis and the table Characteristics of included studies).
The trials in this review were all short‐ to medium‐term trials. Six trials compared a single session of NIV to a single session of another type of intervention (Fauroux 1999; Gozal 1997; Holland 2003; Kofler 1998; Milross 2001; Placidi 2006) and one compared a single session of NIV to no treatment (Lima 2014); one trial compared NIV to another type of airway clearance during a two‐week exacerbation period (Dwyer 2015); one trial reported a six‐week intervention of nocturnal NIV compared to oxygen and air (Young 2008); and one compared NIV to another type of airway clearance over a three‐month period (Rodriguez Hortal 2016).
Inclusion criteria were stated in eight trials (Dwyer 2015; Gozal 1997; Holland 2003; Lima 2014; Milross 2001; Placidi 2006; Young 2008; Rodriguez Hortal 2016) and exclusion criteria were explicitly stated in six trials (Dwyer 2015; Holland 2003; Lima 2014; Placidi 2006; Young 2008; Rodriguez Hortal 2016).
In eight trials the participants were studied in a hospital setting (Dwyer 2015; Fauroux 1999; Gozal 1997; Holland 2003; Kofler 1998; Lima 2014; Milross 2001; Placidi 2006) and participants were at home in two trials (Young 2008;Rodriguez Hortal 2016 ).
Participants
Two trials included children only (Fauroux 1999; Lima 2014); two trials included both adults and children (Gozal 1997; Kofler 1998); and six trials included adults only (Dwyer 2015; Holland 2003; Milross 2001; Placidi 2006; Young 2008; Rodriguez Hortal 2016). Of the 191 participants, 114 were male (59.7%) and 72 (40.3%) were female. The number of participants in the trials ranged from 6(Gozal 1997) to 40(Dwyer 2015).
In six of the trials it is stated that participants were stable at the time of the trial (Fauroux 1999; Gozal 1997; Lima 2014; Milross 2001; Young 2008 ; Rodriguez Hortal 2016); in three trials participants had an acute exacerbation (Dwyer 2015; Holland 2003; Placidi 2006); and in one trial disease status is not clear (Kofler 1998).
The trials included people with a range of disease severity. One trial recruited participants with mild (not defined) disease (Kofler 1998), while five trials recruited participants with moderate to severe (defined) disease (Dwyer 2015; Holland 2003; Milross 2001; Young 2008; Rodriguez Hortal 2016). Two trials had participants in all disease categories (Fauroux 1999; Lima 2014). Participants in the remaining two trials had severe disease (Gozal 1997; Placidi 2006). For further details, please see the table (Characteristics of included studies).
Interventions
All machines used were positive pressure ventilators with a capacity for bilevel pressure ventilatory support (see Characteristics of included studies).
NIV as a method of airway clearance
Six trials, with a total of 151 participants, evaluated NIV as a method of airway clearance (Dwyer 2015; Fauroux 1999; Holland 2003; Kofler 1998; Placidi 2006; Rodriguez Hortal 2016). Four trials compared a single treatment session of NIV to another airway clearance technique: PEP (Kofler 1998; Placidi 2006) or chest physiotherapy (Fauroux 1999; Holland 2003; Placidi 2006). Three trials used a nasal mask (Fauroux 1999; Holland 2003; Placidi 2006), one trial used nasal mask or mouthpiece (Dwyer 2015), one trial used a face mask (Rodriguez Hortal 2016) and in one trial it is unclear how NIV was administered (Kofler 1998). One trial compared NIV to PEP over three months (Rodriguez Hortal 2016). Only one trial compared NIV to more than one active intervention (Placidi 2006). One trial compared NIV with or without an additional airway clearance technique to no NIV i.e. another type of airway clearance during a two‐week course of treatment for an acute exacerbation (Dwyer 2015).
NIV in overnight ventilation
Three trials, with a total of 27 participants, evaluated NIV as a method of overnight ventilation (Gozal 1997; Milross 2001; Young 2008). Two trials were single‐night trials (Gozal 1997; Milross 2001) and the remaining trial lasted six weeks (Young 2008); the results are later presented separately. Two of these studies used a nasal mask (Gozal 1997; Milross 2001), one used either a nasal mask or a full face mask (Young 2008). In one single‐night trial, participants received room air on the first trial night (Gozal 1997). If they exhibited significant hypoxaemia or hypercapnia or both on the room air night, the results were compared to a single overnight session of NIV and oxygen and to a single overnight session of oxygen (Gozal 1997). In the second single‐night trial an overnight session of NIV (with or without oxygen) was compared to an overnight session of low level continuous positive airway pressure (CPAP) and oxygen and a single overnight session of low level CPAP and room air (Milross 2001). In a domiciliary six‐week trial, CF participants with daytime hypercapnia received six weeks of room air or oxygen or NIV (Young 2008).
NIV and exercise
One single‐treatment trial, with a total of 13 participants, evaluated NIV compared to no NIV during exercise (Lima 2014). The interface used is unclear.
Outcomes
Three of the six trials assessing NIV as a method of airway clearance reported on one primary outcome measure (QoL) (Dwyer 2015; Fauroux 1999; Placidi 2006). The other outcome measures for the trials in this comparison focused on lung function, respiratory muscle strength, gas exchange, sputum weight or volume, ease of expectoration, breathlessness, fatigue, modified shuttle walk test, bacterial density of Pseudomonas aeruginosa, length of hospital stay and time to next admission, as well as participant and physiotherapist preference (Dwyer 2015; Fauroux 1999; Holland 2003; Kofler 1998; Placidi 2006; Rodriguez Hortal 2016).
The outcomes comparing NIV as a method of overnight ventilation during sleep focused on CF‐specific QoL questionnaires (a primary outcome for this review), daytime sleepiness scores, lung function, gas exchange, nocturnal polysomnography, modified shuttle walk test, adherence to treatment and preference (Gozal 1997; Milross 2001; Young 2008).
The trial comparing NIV to no treatment during exercise did not report on any of the review's primary outcomes and reported distance walked (Lima 2014).
No adverse effects of treatment were described in any trial. Five trials did not make any comments on negative effects (Fauroux 1999; Gozal 1997; Lima 2014; Placidi 2006; Rodriguez Hortal 2016). Two trials reported that there were no untoward effects in any participant (Dwyer 2015; Kofler 1998). Three trials provided information about negative effects (Holland 2003; Milross 2001; Young 2008).
Excluded studies
Two trials were excluded because they were not randomised controlled trials (Piper 1992; Regnis 1994) and seven were excluded as they did not compare NIV with other management for acute or chronic respiratory failure (Elkins 2004; Fauroux 2000a; Fauroux 2000b; Fauroux 2001; Fauroux 2004; Serra 2000; Serra 2002). Four trials were excluded as they did not include NIV (Falk 2006;Greenough 2004; Parreira 2008; Riethmueller 2006).
Studies awaiting classification
One study is in abstract form and has limited data regarding recruitment and randomisation and will be assessed when published as a full trial (Petrone 2009).
Risk of bias in included studies
The quality of all the included trials was originally assessed based on the criteria described by Jüni (Jüni 2001). However, one of the included trials has only been published in abstract form (Kofler 1998) and there is limited information in the abstract to assess quality using the quality assessment criteria we have employed. We have since used the Cochrane risk of bias tool to assess the risks of bias associated with the included studies and these are reported below
Allocation
Generation of randomisation sequence
The methods for the randomisation of treatment order were reported in four trials, therefore there is a low risk of bias for these trials (Dwyer 2015; Lima 2014; Placidi 2006; Young 2008). Dwyer and Lima both used computer‐generated block randomisation (Dwyer 2015; Lima 2014) and both Young and Placidi employed the Latin square design to randomise treatment order (Placidi 2006; Young 2008). We judged the remaining six trials to have an unclear risk of bias due to a lack of description of the methods, despite being described as randomised trials (Fauroux 1999; Gozal 1997; Holland 2003; Kofler 1998; Milross 2001; Rodriguez Hortal 2016).
Concealment of allocation
Three trials were judged to have a low risk of bias for allocation concealment as they all stated that opaque envelopes were used to contain the order of randomisation (Dwyer 2015; Rodriguez Hortal 2016; Young 2008). Additionally, Dwyer reported that the sealed sequentially numbered opaque envelopes were opened after consent was signed (Dwyer 2015); and in the Young trial, the sequentially numbered envelopes were sealed by a person not involved in the trial and opened as each participant was enrolled (Young 2008). There were no details of allocation concealment given in seven trials, therefore these have an unclear risk of bias (Fauroux 1999; Gozal 1997; Holland 2003; Kofler 1998; Lima 2014; Milross 2001; Placidi 2006).
Blinding
When assessing the risk of bias of the included trials from blinding, it should be noted that it is difficult to blind physiotherapy trials. In fact, for this intervention it would not have been possible to blind either the participants or the clinicians administering treatment to the intervention. It would only have been possible to blind the outcome assessors.
We judged two trials to have a low risk of bias (Holland 2003; Rodriguez Hortal 2016). The Holland trial employed an independent data collector who was blinded to the treatment order to obtain all measurements (Holland 2003). There is evidence of blinding in the Rodriguez Hortal trial as pulmonary laboratory technicians (who measured the lung function tests) were blinded to physiotherapy treatment; furthermore, research nurses, who took vital signs, were blinded to treatment. A physiotherapist supervised and conducted all monthly treatment sessions and weekly phone calls; it is unclear if the 6MWT was assessed by the research physiotherapist, however we still judge this trial to have a low risk of bias (Rodriguez Hortal 2016).
We judged there to be an unclear risk of bias in five trials (Fauroux 1999; Gozal 1997; Kofler 1998; Placidi 2006; Young 2008). Fauroux stated that participants' subjective impressions were evaluated by individuals who were not involved in the trial and were unaware of the treatment regimen; but it was not reported who was responsible for collecting and weighing secretions or performing lung function testing, therefore the trial is still judged to have an unclear risk of bias (Fauroux 1999). Gozal stated that while participants were aware of the intervention being administered; all were reportedly unaware of the purpose of the trial with participants and sleep technicians blinded to the results until completion of the third night (Gozal 1997). Data collection was not described at all by one trial as it was only reported as an abstract (Kofler 1998). One trial reported that physiotherapists collected sputum and the technician was blinded to physiotherapy treatment, but it is not reported who was responsible for weighing sputum or collating cough information induced by the treatment (Placidi 2006). There is evidence of blinding in the Young trial only for participants receiving either oxygen or room air, so we judge the risk of bias for this to be unclear (Young 2008).
We judged there to be a high risk from a lack of blinding in three trials (Dwyer 2015; Lima 2014; Milross 2001). Dwyer states that the assessors where not blinded to treatment group allocation (Dwyer 2015). There was no evidence of blinding of assessors, investigators or participants in the published report of two trials (Lima 2014; Milross 2001).
Incomplete outcome data
We judged there to be a low risk of bias for nine trials (Dwyer 2015; Fauroux 1999; Holland 2003; Kofler 1998; Lima 2014; Milross 2001; Placidi 2006; Rodriguez Hortal 2016; Young 2008). Two trials provided information on drop outs: Holland reported one participant dropped out at the start of the trial because of pain on respiratory muscle testing (Holland 2003); and Young reported two participants dropped out (one withdrew consent due to a pneumothorax on air and one from the NIV group withdrew due to not tolerating the mask) (Young 2008). All participants were accounted for in seven trials (Dwyer 2015; Fauroux 1999; Kofler 1998; Lima 2014; Milross 2001; Placidi 2006 ; Rodriguez Hortal 2016). There were treatment deviations reported in two trials (Milross 2001; Young 2008). In the Milross trial this was because one participant could not tolerate the increases in IPAP (Milross 2001); in the Young trial, two participants experienced aerophagia which resolved when the IPAP was reduced by 2 cm H₂0 (Young 2008).
One trial was judged as having an unclear risk of bias (Gozal 1997). Gozal did not explicitly state that intention‐to‐treat was not used, but results are based on the six participants who completed the trial (Gozal 1997).
Selective reporting
We judged there to be a low risk of bias for nine trials since we were not able to identify any selective outcome reporting when we compared the 'Methods' section to the 'Results' section for each trial published in full (Fauroux 1999; Gozal 1997; Holland 2003; Lima 2014; Milross 2001; Placidi 2006; Rodriguez Hortal 2016; Young 2008).
As Kofler is published in abstract form only and we have been unable to compare the trial protocol to the results presented, it is unclear whether all outcome measures have been reported and the risk of bias is unclear (Kofler 1998).
Other potential sources of bias
The methods of statistical analysis were described in nine trials, therefore we judged these trials to have a low risk for other potential sources of bias (Dwyer 2015; Fauroux 1999; Gozal 1997; Holland 2003; Lima 2014; Milross 2001; Placidi 2006; Rodriguez Hortal 2016; Young 2008). The analysis methods were not described in the Kofler trial abstract, leading to an unclear risk of bias (Kofler 1998).
Effects of interventions
Due to variations in the type and duration of trials, times at which outcomes were measured, different methods of reporting outcomes, omission of data relating to either mean change from baseline for each group and the standard deviation (SD) or standard error (SE) it was not possible to pool data for many of the outcomes.
There are discrepancies in some of the results reported between the original trial analyses and our analyses in the Data and analyses section. These discrepancies may be due to some or all of the following reasons. As already mentioned, due to restrictions on the data that were available, the method that we used for some of the analysis was to treat the cross‐over trials as if they were parallel trials (see Unit of analysis issues). In two of the trials, non‐parametric tests were used to analyse the original data (Gozal 1997; Milross 2001), but the methods used for the analysis within this review assume normality of the data, which may not have been an appropriate assumption. We have been unable to confirm which statistical method was used in one trial (Kofler 1998). Where discrepancies have been found, the results from both the original analysis and Data and analyses are detailed in the text. Some trials reported statistical or non‐statistical differences between groups, but did not provide adequate data (means and SDs) that could be analysed in the RevMan software (RevMan 2014). When this has occurred the information from the original trial has been included in the text.
A full list of abbreviations can be found in the additional tables section (Table 1).
The role of NIV as a method of airway clearance
There are six trials included under this intervention (Dwyer 2015; Fauroux 1999; Holland 2003; Kofler 1998; Placidi 2006; Rodriguez Hortal 2016). In trials comparing NIV to other methods of airway clearance techniques, the authors tested for heterogeneity between results for lung function using the I² statistic but given the insufficient number of trials included in this review and the lack of meta‐analysis the value of I² is 0%. A sensitivity analysis was performed entering the Placidi data separately so that participants were not counted twice i.e. either chest physiotherapy including directed cough or chest physiotherapy including PEP and both data were reported.
Primary outcomes
1. Mortality
No trials looked at mortality.
2. QoL
Three trials (n = 73) reported on this outcome (Dwyer 2015; Fauroux 1999; Placidi 2006). Only one trial (n = 40) used a CF‐specific questionnaire and reported the data in a form we were able to analyse (Dwyer 2015). There was no difference between groups reported in the physical domain, MD ‐4.00 (95% CI ‐20.05 to 12.05) or the health domain, MD 3.00 (95% CI ‐12.52 to 18.52), but there was a difference in the respiratory domain favouring NIV, MD 11.00 (95% CI 0.58 to 21.42) (Analysis 1.1).
1.1. Analysis.
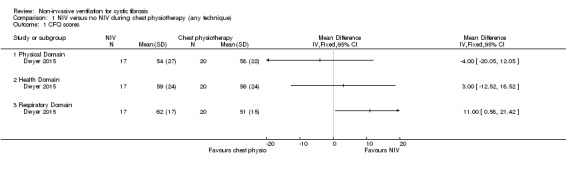
Comparison 1 NIV versus no NIV during chest physiotherapy (any technique), Outcome 1 CFQ scores.
All three trials reported fatigue (Dwyer 2015; Fauroux 1999; Placidi 2006), but only one trial reported data we could analyse (Dwyer 2015). This trial used the Schwartz fatigue scale and our analysis showed no difference in fatigue, MD ‐6.00 (95% CI ‐13.27 to 1.27) (Analysis 1.2). However, the publication reports significantly less fatigue in the NIV group, MD –6 (95% CI –11 to –1) when adjusted for admission values (Dwyer 2015). The remaining two trials reported narratively. In the Fauroux trial, 15 out of 16 participants felt less tired after the NIV session compared to the chest physiotherapy session (Fauroux 1999). In the Placidi trial participants reported feeling less tired after NIV than after PEP (Placidi 2006).
1.2. Analysis.
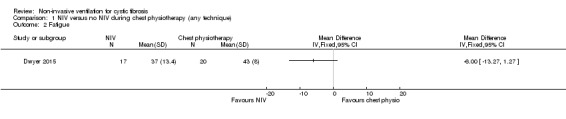
Comparison 1 NIV versus no NIV during chest physiotherapy (any technique), Outcome 2 Fatigue.
3. Symptoms of sleep‐disordered breathing
No trials looked at symptoms of sleep‐disordered breathing.
Secondary outcomes
1. Lung function
Forced expiratory volume at one second (FEV₁), forced vital capacity (FVC) and forced mid‐expiratory flow rate (FEF25‐75) were reported in six trials (Dwyer 2015; Fauroux 1999; Holland 2003; Kofler 1998; Placidi 2006; Rodriguez Hortal 2016). There were no primary data available for one trial, which was published as a abstract only (Kofler 1998). This trial reported that there was no significant difference in post‐intervention lung function between the groups (Kofler 1998).
a. FEV₁
A total of five trials reported on FEV₁; two of these reported FEV₁ in litres (L) post‐treatment (Holland 2003; Placidi 2006) and three trials reported FEV₁ % predicted post‐treatment (Dwyer 2015; Fauroux 1999; Rodriguez Hortal 2016).
After one week there was no difference between groups either when NIV was compared to directed cough (n = 43), MD ‐0.03 L (95% CI ‐0.17 to 0.12) or to PEP (n = 17) MD ‐0.05 L (95% CI ‐0.22 to 0.12) (Analysis 1.3).
1.3. Analysis.
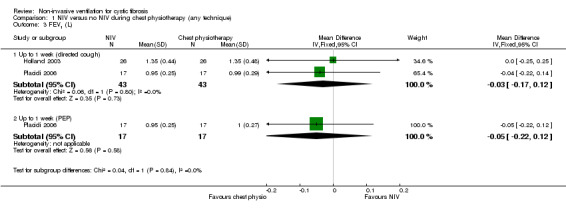
Comparison 1 NIV versus no NIV during chest physiotherapy (any technique), Outcome 3 FEV1 (L).
One trial (n = 16) reported NIV compared to directed cough at up to one week (Fauroux 1999) and found no difference between treatment groups, MD ‐0.90% (95% CI ‐17.41 to 15.61). A further trial (n = 40) presented results for FEV₁ % predicted in a comparison of NIV to all ACTs combined at up to two weeks (Dwyer 2015); there was no difference between the groups, MD 1.30% (95% CI ‐7.32 to 9.92) (Analysis 1.4). The trial paper also reported there was no difference between the NIV and the chest physiotherapy groups in the daily rate of improvement in FEV₁ % predicted, MD 0.13% per day (95% CI –0.03 to 0.28) (Dwyer 2015). One longer‐term trial (n = 32) compared NIV to PEP over three months and reported FEV₁ % predicted post‐treatment (Rodriguez Hortal 2016). Our analysis showed a significant difference in absolute post‐treatment values, MD ‐13.00% (95% CI ‐21.32 to ‐4.68) (Analysis 1.4), but the original publication reported no difference.
1.4. Analysis.
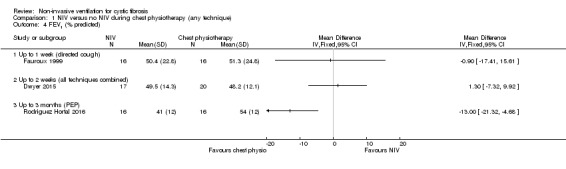
Comparison 1 NIV versus no NIV during chest physiotherapy (any technique), Outcome 4 FEV1 (% predicted).
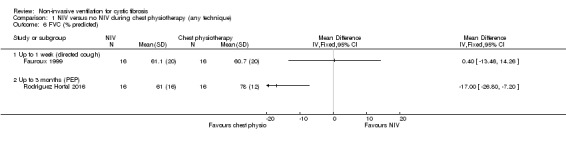
b. FVC
Four trials reported FVC post‐treatment; two (n = 43) reported FVC L (Holland 2003; Placidi 2006) and two (n = 32) reported FVC % predicted (Fauroux 1999; Rodriguez Hortal 2016). When data were analysed, there was no statistical difference in FVC L at up to one week for the comparison of NIV to directed cough MD 0.00 L (95% CI ‐0.30 to 0.30) or for the comparison of NIV to PEP MD ‐0.07 L (95% CI ‐0.47 to 0.33) (Analysis 1.5). For FVC % predicted, there was no difference at one week between NIV and directed cough, MD 0.40% (95% CI ‐13.46 to 14.26). At the up to three‐month time point PEP was significantly better than NIV, MD ‐17.00% (95% CI ‐26.80 to ‐7.20) (Analysis 1.6), but the original publication reported no difference (Rodriguez Hortal 2016).
1.5. Analysis.

Comparison 1 NIV versus no NIV during chest physiotherapy (any technique), Outcome 5 FVC (L).
1.6. Analysis.
Comparison 1 NIV versus no NIV during chest physiotherapy (any technique), Outcome 6 FVC (% predicted).
c. FEF25‐75
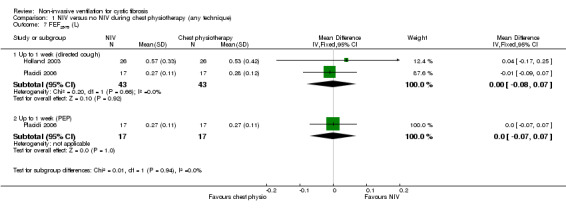
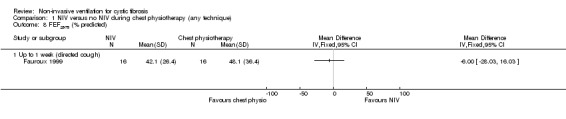
Three trials (n = 59) reported on FEF25‐75 post‐treatment; two reported L (Holland 2003; Placidi 2006) and one % predicted (Fauroux 1999). Comparing NIV to directed cough, there was no statistical difference in FEF25‐75 L found between groups post‐treatment at up to one week, MD ‐0.00 L (‐0.08 to 0.07); this was also true for the comparison of NIV to PEP at the same time point, MD 0.00 L (95% CI ‐0.07 to 0.07) (Analysis 1.7). The study comparing NIV to directed cough and reporting FEF25‐75 % predicted again showed no statistical difference in post‐treatment at up to one week between groups, MD ‐6.00% (95% ‐28.03 to 16.03) (Analysis 1.8).
1.7. Analysis.
Comparison 1 NIV versus no NIV during chest physiotherapy (any technique), Outcome 7 FEF25‐75 (L).
1.8. Analysis.
Comparison 1 NIV versus no NIV during chest physiotherapy (any technique), Outcome 8 FEF25‐75 (% predicted).
d. Maximal inspiratory mouth pressure (PImax)
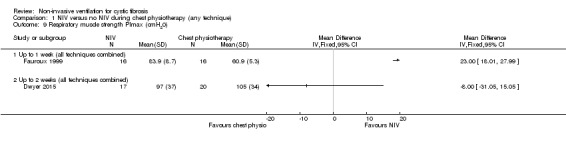
This outcome was reported in three trials (n = 82) (Dwyer 2015; Fauroux 1999; Holland 2003); two of which (n = 56) provided data we were able to analyse (Dwyer 2015; Fauroux 1999). Fauroux reported that PImax decreased significantly after the chest physiotherapy (all techniques combined) session, but increased significantly after the NIV session (Fauroux 1999). Our analysis showed that post‐treatment values for PImax at up to one week were significantly greater after NIV than chest physiotherapy, MD 23.00 cm H₂O (95% CI 18.01 to 27.99) (Analysis 1.9). In the Dwyer trial at up to two weeks (at discharge), our analysis showed no difference between the NIV and the chest physiotherapy (all techniques combined) groups when measured after the physio session, MD ‐8.00 cm H₂O (95% CI ‐31.05 to 15.05) (Analysis 1.9). The original publication reported that on Day 2 of the admission, PImax worsened following standard chest physiotherapy and improved following NIV‐assisted chest physiotherapy giving a MD 8 cm H₂O (95% CI 2 to 14) (Dwyer 2015).
1.9. Analysis.
Comparison 1 NIV versus no NIV during chest physiotherapy (any technique), Outcome 9 Respiratory muscle strength PImax (cmH20).
In the original paper, Holland reported that there was a significant reduction in PImax following standard treatment (P = 0.04), but PImax was maintained following NIV treatment, which resulted in a significant difference compared with standard treatment PImax, MD 9.04 cm H₂O (95% CI 4.25 to 13.83) (Holland 2003).
e. Maximal expiratory mouth pressure (PEmax)
This outcome was reported in three trials (n = 82) (Dwyer 2015; Fauroux 1999; Holland 2003); two of which (n = 56) provided data we were able to analyse (Dwyer 2015; Fauroux 1999) (Analysis 1.10). Fauroux reported that at up to one week PEmax decreased significantly after the chest physiotherapy (all techniques combined) session, but after the NIV session there was a non‐significant increase in PEmax (Fauroux 1999). Post‐treatment values for PEmax were significantly greater after NIV than chest physiotherapy, MD 10.50 cm H₂O (95% CI 6.18 to 14.82) (Analysis 1.10). The Dwyer trial reported that at up to two weeks there was no difference in PEmax between the NIV and the chest physiotherapy (all techniques combined) groups, MD ‐20.00 cm H₂O (95% CI ‐47.42 to 7.42) (Analysis 1.10); the original publication reported the difference in PEmax between groups following chest physiotherapy on Day 2 of admission was MD 6 cm H₂O (95% CI ‐3 to 15) and when measured again before and after chest physiotherapy one week into the admission and on discharge from hospital, there was no difference in change in PEmax between groups (Dwyer 2015).
1.10. Analysis.
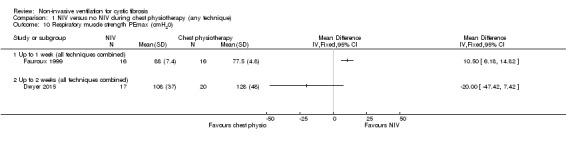
Comparison 1 NIV versus no NIV during chest physiotherapy (any technique), Outcome 10 Respiratory muscle strength PEmax (cmH20).
Holland reported that PEmax did not change significantly following standard treatment, but did increase following NIV, MD 8.04 cm H₂O (95% CI 0.61 to 15.46) (Holland 2003).
f. Tidal volume
One trial (n = 16) reported that tidal volume increased from mean (SD) 0.42 (0.01) L to 1.0 (0.02) L after the NIV physiotherapy session, but there were no data provided for the control session so we were unable to enter these data in the analysis (Fauroux 1999).
g. Respiratory rate
One trial (n = 16) reported that respiratory rate was significantly lower during NIV than during chest physiotherapy (no data available) (Fauroux 1999).
h. Airway resistance
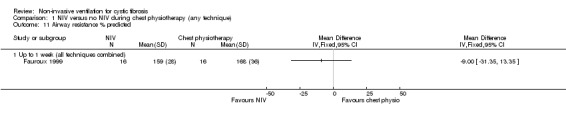
One trial (n = 16) reported that when comparing chest physiotherapy with NIV, there was no statistical difference in airway resistance (% predicted) between groups post‐treatment, MD ‐9.00 (95% CI ‐31.35 to 13.35) (Fauroux 1999) (Analysis 1.11).
1.11. Analysis.
Comparison 1 NIV versus no NIV during chest physiotherapy (any technique), Outcome 11 Airway resistance % predicted.
i. Lung clearance index (LCI)
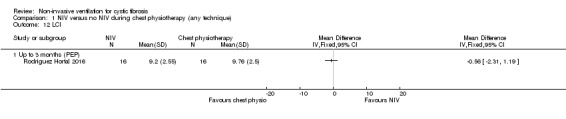
One trial reported on LCI after three months (Rodriguez Hortal 2016). Our analysis of absolute post‐treatment values showed there was no difference between the NIV and PEP, MD ‐0.56 cm H₂O (95% CI ‐2.31 to 1.19) (Analysis 1.12); however, the original publication reported a significant decrease in LCI in the NIV group compared to the PEP group (change data not available for our analysis) (Rodriguez Hortal 2016).
1.12. Analysis.
Comparison 1 NIV versus no NIV during chest physiotherapy (any technique), Outcome 12 LCI.
2. Measures of gas exchange
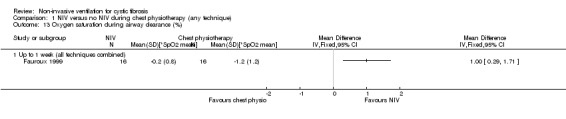
This outcome was reported in five trials (n = 111) during airway clearance sessions (Fauroux 1999; Holland 2003; Kofler 1998; Placidi 2006; Rodriguez Hortal 2016). In the Fauroux trial (n = 16), the saturation of haemoglobin with oxygen in arterial blood (SpO₂) was measured and recorded in numerous ways: mean oxygen saturation (mSpO₂); the largest fall expressed in the absolute value of SpO₂ (nadirSpO₂); the largest fall expressed as the difference with the SpO₂ just before the manoeuvre (*SpO₂ max); the mean of *SpO₂ max during the whole chest physiotherapy (*SpO₂ mean) (Fauroux 1999). We have chosen to report on one of these from this trial i.e. *SpO₂ mean. Indices of oxygenation were significantly lower during chest physiotherapy than during NIV, *SpO₂ mean MD 1.00 (95% CI 0.29 to 1.71) (Analysis 1.13).
1.13. Analysis.
Comparison 1 NIV versus no NIV during chest physiotherapy (any technique), Outcome 13 Oxygen saturation during airway clearance (%).
Kofler (n = 20) reported the change in SpO₂ during treatment (Kofler 1998). There was a significantly greater improvement in SpO₂ following NIV versus chest physiotherapy including PEP, MD 1.16% (95% CI 0.08 to 2.24) (Analysis 1.14).
1.14. Analysis.
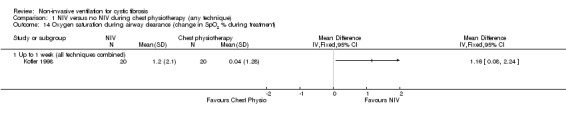
Comparison 1 NIV versus no NIV during chest physiotherapy (any technique), Outcome 14 Oxygen saturation during airway clearance (change in SpO2 % during treatment).
The analysis of the data from the Placidi trial (n = 17) showed there was no significant difference in SpO₂ after airway clearance when comparing NIV to chest physiotherapy including directed cough, MD 0.20% (95% CI ‐0.74 to 1.14), or when comparing NIV to chest physiotherapy including PEP, MD ‐0.10% (95% CI ‐0.98 to 0.78) (Placidi 2006) (Analysis 1.15).
1.15. Analysis.
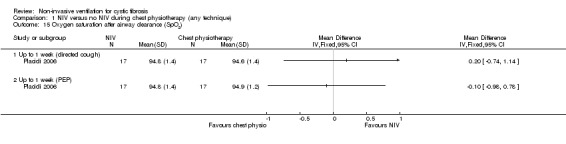
Comparison 1 NIV versus no NIV during chest physiotherapy (any technique), Outcome 15 Oxygen saturation after airway clearance (SpO2).
The Holland trial (n = 26) did not report data that we were able to present in our analysis. It reported that the mean SpO₂ (P < 0.001) and the minimum SpO₂ (P = 0.007) were significantly lower during standard treatment than during NIV treatment. The addition of NIV resulted in a significant reduction in the proportion of treatment time when SpO₂ was below 90% (P = 0.001) (Holland 2003).
One trial (n = 32) reported on the partial pressure of carbon dioxide (PaCO₂) (Rodriguez Hortal 2016). Our analysis showed no difference between NIV and PEP in PaCO₂, MD 0.02 (95% CI ‐0.39 to 0.43) (Analysis 1.16).
1.16. Analysis.
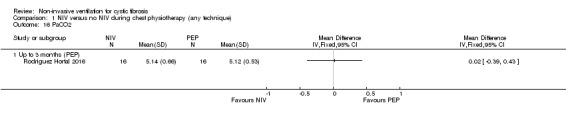
Comparison 1 NIV versus no NIV during chest physiotherapy (any technique), Outcome 16 PaCO2.
3. Respiratory symptom scores and sputum production
The Borg breathlessness score was reported in one trial (n = 26) (Holland 2003); there was no statistical difference between groups post‐treatment, MD ‐0.43 (95% CI ‐1.46 to 0.60) (Analysis 1.17). A second trial (n = 40) reported breathlessness using a visual analogue scale (VAS) measured in cm (Dwyer 2015), but found no difference between the NIV or the chest physiotherapy groups at up to two weeks, MD ‐0.11 (95% CI ‐0.76 to 0.53) (Analysis 1.17).
1.17. Analysis.
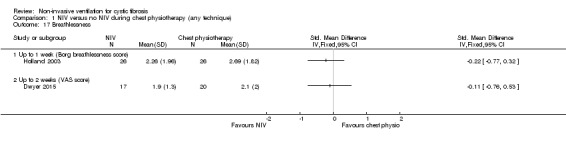
Comparison 1 NIV versus no NIV during chest physiotherapy (any technique), Outcome 17 Breathlessness.
Sputum production was reported in four trials (n = 99) (Dwyer 2015; Fauroux 1999; Holland 2003; Placidi 2006). Three trials (n = 59) reported on the amount of wet weight sputum expectorated (Fauroux 1999; Holland 2003; Placidi 2006). When the data from the comparison of NIV with chest physiotherapy including directed coughing were analysed there was no statistical difference between the groups, MD ‐0.69 g (95% CI ‐3.06 to 1.67); likewise for the comparison of NIV to chest physiotherapy including PEP, MD ‐2.58 g (95% CI ‐6.11 to 0.95) (Analysis 1.18). Furthermore, Fauroux reported that 10 out of 16 participants considered expectoration was easier with NIV, four out of 16 participants did not perceive any difference and two participants did not expectorate (Fauroux 1999).
1.18. Analysis.
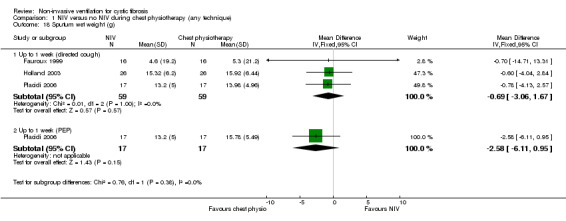
Comparison 1 NIV versus no NIV during chest physiotherapy (any technique), Outcome 18 Sputum wet weight (g).
Placidi (n = 17) reported dry weight sputum (Placidi 2006). The trial found no significant difference between the NIV and the chest physiotherapy including directed cough groups, MD ‐0.09 g (95% CI ‐0.56 to 0.38), nor between NIV and chest physiotherapy including PEP, MD ‐0.06 g (95% CI ‐0.46 to 0.34) (Analysis 1.19).
1.19. Analysis.
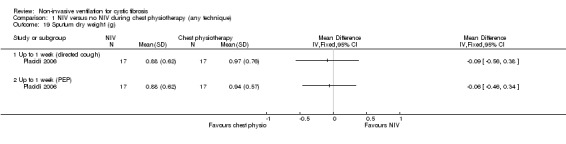
Comparison 1 NIV versus no NIV during chest physiotherapy (any technique), Outcome 19 Sputum dry weight (g).
One trial (n = 40) reported the daily perceived sputum volume using a VAS (cm) (Dwyer 2015). The trial found no difference between the NIV and chest physiotherapy groups, MD ‐0.50 (95% CI ‐1.67 to 0.67) (Analysis 1.20).
1.20. Analysis.
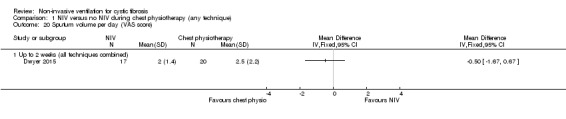
Comparison 1 NIV versus no NIV during chest physiotherapy (any technique), Outcome 20 Sputum volume per day (VAS score).
The Dwyer trial also reported on Pseudomonas aeruginosa bacterial density (Dwyer 2015) and showed a non‐significant difference between the NIV and the chest physiotherapy at up to two weeks, MD ‐0.94 (95% CI ‐1.90 to 0.02) (Analysis 1.21).
1.21. Analysis.

Comparison 1 NIV versus no NIV during chest physiotherapy (any technique), Outcome 21 Pseudomonas density (log CFU/g).
4. Exercise tolerance
One trial (n = 40) reported on exercise tolerance using the 25‐level modified shuttle test (Dwyer 2015). Analysis of data showed no difference between the NIV and chest physiotherapy groups at up to two weeks, MD ‐15.00 m (95% CI ‐260.00 to 230.00) (Analysis 1.22). The same trial also used a VAS to report on perceived energy levels (Dwyer 2015); there was no difference found between the groups, MD 0.00 (95% CI ‐1.22 to 1.22) (Analysis 1.23).
1.22. Analysis.
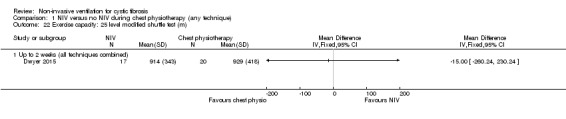
Comparison 1 NIV versus no NIV during chest physiotherapy (any technique), Outcome 22 Exercise capacity: 25 level modified shuttle test (m).
1.23. Analysis.
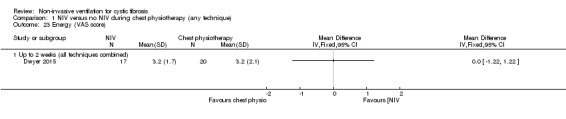
Comparison 1 NIV versus no NIV during chest physiotherapy (any technique), Outcome 23 Energy (VAS score).
One trial (n = 32) reported the 6MWT (Rodriguez Hortal 2016); our analysis of the data showed no difference between NIV and PEP groups, MD 6.00 (95% CI ‐53.92 to 65.92) (Analysis 1.24).
1.24. Analysis.
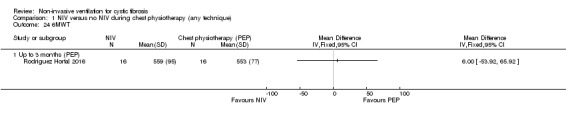
Comparison 1 NIV versus no NIV during chest physiotherapy (any technique), Outcome 24 6MWT.
5. Impact on health resources
One trial (n = 40) reported on the number of days spent in hospital and the time to the next admission (Dwyer 2015). There was no difference between the NIV and chest physiotherapy groups in the length of hospital stay, MD ‐0.05 days (95% CI ‐3.06 to 2.06) (Analysis 1.25) or in the time to the next admission, MD 26 days (95% ‐85.61 to 137.61) (Analysis 1.26).
1.25. Analysis.

Comparison 1 NIV versus no NIV during chest physiotherapy (any technique), Outcome 25 Length of hospital stay (days).
1.26. Analysis.
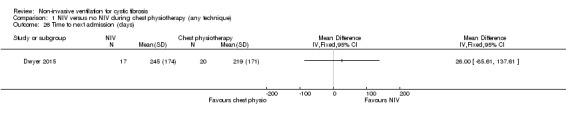
Comparison 1 NIV versus no NIV during chest physiotherapy (any technique), Outcome 26 Time to next admission (days).
6. Measures of nocturnal polysomnography
No trials looked at nocturnal polysomnography.
7. Effect on nutrition and weight
No trials looked at nutrition and weight.
8. Measures of right‐sided cardiac function
No trials looked at right‐sided cardiac function.
9. Cost
No trials looked at cost.
10. Adherence to treatment and preference
Four of the six trials comparing NIV to other airway clearance techniques included information about subjective response to NIV (Fauroux 1999; Holland 2003; Kofler 1998; Placidi 2006). In three trials (n = 62) more participants stated that they preferred NIV to another method of airway clearance (Fauroux 1999; Holland 2003; Kofler 1998). In one trial, 14 out of 16 participants stated that they preferred NIV to chest physiotherapy and two participants had no preference (Fauroux 1999). In a further trial, 15 out of 26 participants preferred treatment with NIV, eight out of 26 stated that they preferred standard treatment and three had no preference (Holland 2003). Kofler reported that 12 out of 20 participants preferred NIV, five out of 20 participants preferred PEP and three out of 20 participants had no preferences (Kofler 1998). These results are summarised as follows:
| Trial | Prefers NIV | Prefers alternative ACT | No preference | Total participants |
| Fauroux 1999 | 14 | 2 | 16 | |
| Holland 2003 | 15 | 8 | 3 | 26 |
| Kofler 1998 | 12 | 5 | 3 | 20 |
| Total | 41 | 13 | 8 | 62 |
In the Placidi trial (n = 17), no statistical difference was seen in subjective effectiveness scores between chest physiotherapy (including PEP) and NIV (Placidi 2006).
Although not formally measured in the Dwyer trial (n = 40), the addition of NIV to chest physiotherapy was well‐tolerated; only one out of 19 participants in the NIV group refused NIV treatment due to poor tolerance (Dwyer 2015).
Furthermore, Fauroux (n = 16) also reported that the physiotherapists found it easier to perform chest physiotherapy while the person was on NIV in 14 out of 16 participants, but did not perceive any difference in two participants (Fauroux 1999).
11. Adverse events
Three trials did not make any comments on negative or adverse effects (Fauroux 1999; Placidi 2006; Rodriguez Hortal 2016). Two trials reported that there were no untoward effects in any participant (Kofler 1998; Dwyer 2015). Holland reported that one participant withdrew at the beginning of the trial because of pain on respiratory muscle testing (Holland 2003).
The role of NIV in overnight ventilation
There are three trials (n = 27) included under this intervention: two single‐night trials (n = 19) (Gozal 1997; Milross 2001) and one short‐term trial lasting six weeks (n = 8) (Young 2008).
Primary outcomes
1. Mortality
No trials reported on mortality.
2. QoL
One short‐term trial (n = 8) assessed QoL using a CF‐specific QoL questionnaire (Young 2008). There was no significant difference in the chest symptom score between NIV and oxygen, MD 3.0 (95% CI ‐15.73 to 21.73) (Analysis 2.1) or the transitional dyspnoea index score, MD 1.4 (95% CI ‐0.29 to 3.09) (Analysis 2.2). There was no significant difference in the chest symptom score between NIV and room air, MD 7.00 (95% CI ‐11.73 to 25.73) (Analysis 3.1); however, in the original trial this was reported as significant P < 0.002. There was a significant difference in the transitional dyspnoea index score between NIV and room air, MD 2.90 (95% CI 0.71 to 5.09) (Analysis 3.2).
2.1. Analysis.

Comparison 2 NIV in overnight ventilation compared to oxygen, Outcome 1 CFQoL chest symptom score.
2.2. Analysis.
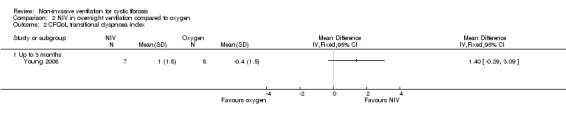
Comparison 2 NIV in overnight ventilation compared to oxygen, Outcome 2 CFQoL transitional dyspnoea index.
3.1. Analysis.
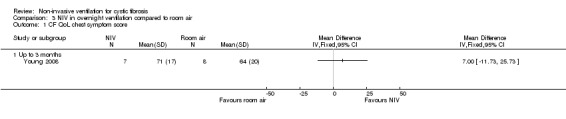
Comparison 3 NIV in overnight ventilation compared to room air, Outcome 1 CF QoL chest symptom score.
3.2. Analysis.
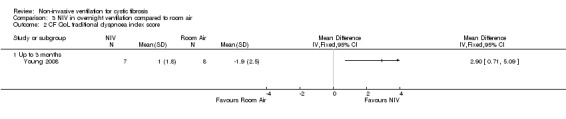
Comparison 3 NIV in overnight ventilation compared to room air, Outcome 2 CF QoL traditional dyspnoea index score.
3. Symptoms of sleep‐disordered breathing
In the short‐term trial (n = 8), daytime sleepiness was measured as a primary outcome (Young 2008). For the comparison between NIV and oxygen, there was no significant difference between groups for either the daytime Epworth sleepiness score, MD 00.0 (95% CI ‐5.57 to 5.57) or the daytime sleepiness global Pittsburg sleep quality index (PSQI) score, MD 00.0 (95% CI ‐ 2.62 to 2.62) (Analysis 2.3). Likewise, for the comparison between NIV and room air, there were no significant differences between groups for either the daytime Epworth sleepiness score, MD 00.0 (95% CI ‐5.07 to 5.07) or the PSQI score, MD ‐1.0% (95% CI ‐4.04 to 2.04) (Analysis 3.3).
2.3. Analysis.
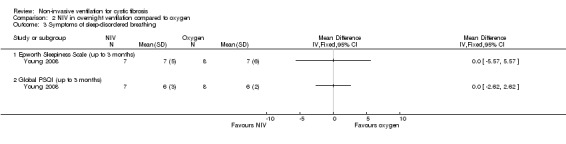
Comparison 2 NIV in overnight ventilation compared to oxygen, Outcome 3 Symptoms of sleep‐disordered breathing.
3.3. Analysis.
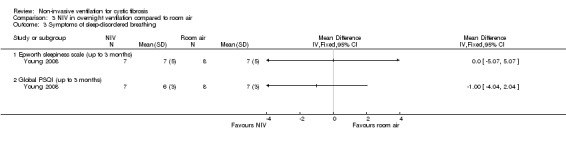
Comparison 3 NIV in overnight ventilation compared to room air, Outcome 3 Symptoms of sleep‐disordered breathing.
Secondary outcomes
1. Lung function
a. Lung function during sleep
One single‐night trial (n = 13) reported on lung function during sleep (Milross 2001). The data have been entered into the analysis using GIV and as can be seen from the graphs, several results were non‐significant and these have not been reported in the text (Analysis 2.4; Analysis 3.4).
2.4. Analysis.
Comparison 2 NIV in overnight ventilation compared to oxygen, Outcome 4 Lung function during sleep.
3.4. Analysis.
Comparison 3 NIV in overnight ventilation compared to room air, Outcome 4 Lung function during sleep.
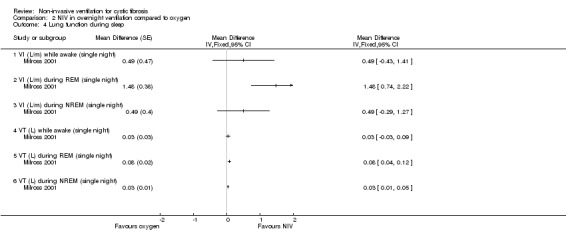
When comparing NIV and oxygen, our analysis showed a significant difference in minute ventilation (VI) in favour of NIV during REM sleep, MD 1.48 L/m (95% CI 0.74 to 2.22); but in the original report this did not reach statistical significance. The difference between groups during NREM sleep was not significant. A significant difference in tidal volume (VT) was seen between groups during both REM sleep, MD 0.08 L (95% CI 0.04 to 0.12) and NREM sleep, MD 0.03 L (95% CI 0.01 to 0.05) (Analysis 2.4).
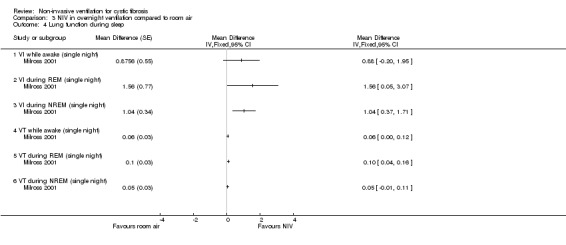
When comparing NIV and room air, there was a significant difference in VI in favour of NIV during REM sleep, MD 1.56 L/m (95% CI 0.05 to 3.07); as for the comparison of NIV and oxygen, in the original report this did not reach statistical significance. There was also a significant difference in VI between NIV and room air during NREM sleep, MD 1.04 L/m (95% CI 0.37 to 1.17). A significant difference in VT between groups was seen during REM sleep, MD 0.10 L (95% CI 0.04 to 0.16), but not during NREM sleep (Analysis 3.4).
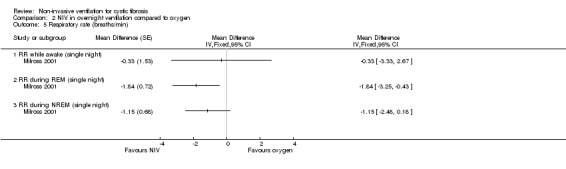
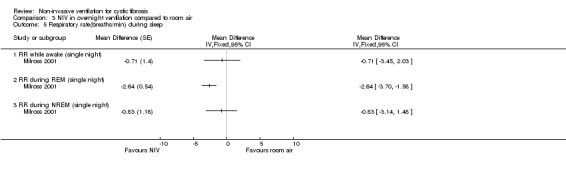
Milross also measured respiratory rate during sleep in the single‐night trial (Milross 2001). In the comparison of NIV and oxygen, there was a significant difference between groups in respiratory rate during REM sleep, MD ‐1.84 breaths per minute (bpm) (95% CI ‐3.25 to ‐0.43), but not during NREM sleep (Analysis 2.5). This was also true for the comparison of NIV to room air, where there was a significant difference between groups during REM sleep, MD ‐2.64 bpm (95% CI ‐3.70 to ‐1.58), but not during NREM sleep (Analysis 3.5). There was no significant difference in mean respiratory rate during slow wave sleep between NIV and oxygen, MD ‐6.00 bpm (95% CI ‐22.7 to 10.7) (Analysis 2.5) and NIV and room air, MD 0.00 bpm (95% CI ‐5.07 to 5.07) (Analysis 3.6).
2.5. Analysis.
Comparison 2 NIV in overnight ventilation compared to oxygen, Outcome 5 Respiratory rate (breaths/min).
3.5. Analysis.
Comparison 3 NIV in overnight ventilation compared to room air, Outcome 5 Respiratory rate(breaths/min) during sleep.
3.6. Analysis.
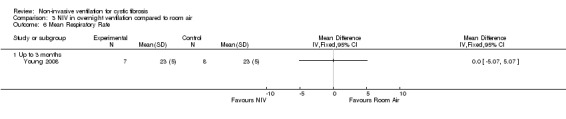
Comparison 3 NIV in overnight ventilation compared to room air, Outcome 6 Mean Respiratory Rate.
b. Lung function while awake
One short‐term trial (n = 8) reported a number of different measures of lung function for the comparisons between NIV and oxygen and between NIV and room air (Young 2008). When comparing NIV to oxygen, there were no significant differences in FEV₁ % predicted, MD 1.00% (95% CI ‐8.13 to 10.13) or in FVC % predicted, MD 4.00% (95% CI ‐11.22 to 19.22) (Analysis 2.6). When comparing NIV to room air, there were likewise no significant differences in FEV₁ % predicted, MD 1.00% (95% CI ‐8.62 to 10.62) or in FVC % predicted, MD 4.00% (95% CI ‐10.32 to 18.30) (Analysis 3.8).
2.6. Analysis.
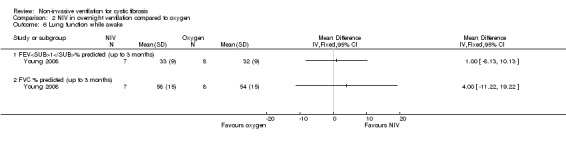
Comparison 2 NIV in overnight ventilation compared to oxygen, Outcome 6 Lung function while awake.
3.8. Analysis.
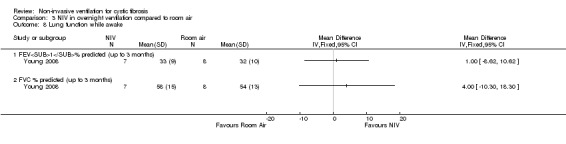
Comparison 3 NIV in overnight ventilation compared to room air, Outcome 8 Lung function while awake.
2. Measures of gas exchange
See also 'Measures of nocturnal polysomnography'.
The short‐term trial (n = 8) looked at awake arterial blood gases (Young 2008).
When comparing NIV to oxygen there were no significant differences between groups for: pH, MD 0.00 (95% CI ‐0.03 to 0.03) (Analysis 2.7); PaO₂, MD ‐4.00 mmHg (95% CI ‐13.43 to 5.43) (Analysis 2.8); PaCO₂, MD ‐1.00 mmHg (95% CI ‐7.10 to 5.10) (Analysis 2.9); HCO₃, MD 0.00 mmol/L (95% CI ‐3.14 to 3.14) (Analysis 2.10); and SaO₂ %, MD ‐2.00 % (95% CI ‐6.06 to 2.06) (Analysis 2.11). Similarly, in the comparison of NIV and room air there were no significant differences between groups for: pH, MD 0.01 (95% CI ‐0.02 to 0.04) (Analysis 3.9); PaO₂, MD ‐2.00 mmHg (95% CI ‐8.58 to 4.58) (Analysis 3.10); PaCO₂, MD ‐2.00 mmHg (95% CI ‐8.10 to 4.10) (Analysis 3.11); HCO₃ , MD 0.00 mmol/L (95% CI ‐2.55 to 2.55) (Analysis 3.12); and SaO₂ %, MD ‐1.00 % (95% CI ‐4.62 to 2.62) (Analysis 3.13).
2.7. Analysis.
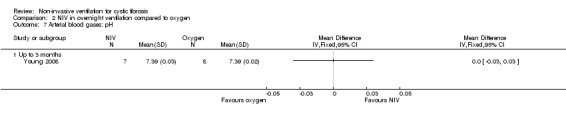
Comparison 2 NIV in overnight ventilation compared to oxygen, Outcome 7 Arterial blood gases: pH.
2.8. Analysis.
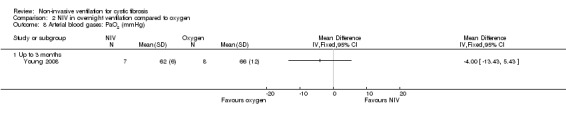
Comparison 2 NIV in overnight ventilation compared to oxygen, Outcome 8 Arterial blood gases: PaO2 (mmHg).
2.9. Analysis.
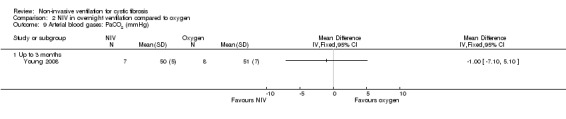
Comparison 2 NIV in overnight ventilation compared to oxygen, Outcome 9 Arterial blood gases: PaCO2 (mmHg).
2.10. Analysis.
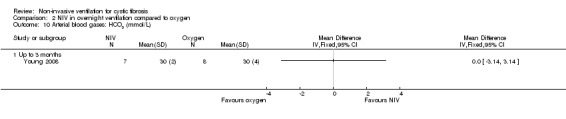
Comparison 2 NIV in overnight ventilation compared to oxygen, Outcome 10 Arterial blood gases: HCO3 (mmol/L).
2.11. Analysis.
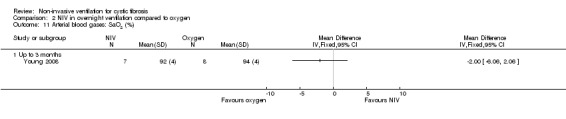
Comparison 2 NIV in overnight ventilation compared to oxygen, Outcome 11 Arterial blood gases: SaO2 (%).
3.9. Analysis.
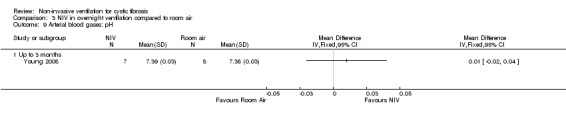
Comparison 3 NIV in overnight ventilation compared to room air, Outcome 9 Arterial blood gases: pH.
3.10. Analysis.
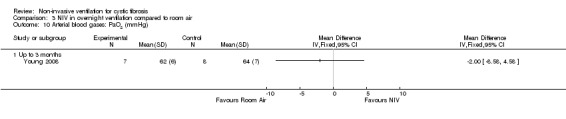
Comparison 3 NIV in overnight ventilation compared to room air, Outcome 10 Arterial blood gases: PaO2 (mmHg).
3.11. Analysis.
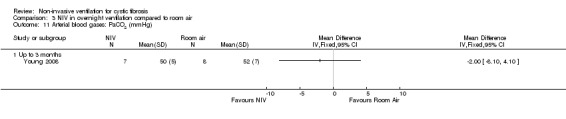
Comparison 3 NIV in overnight ventilation compared to room air, Outcome 11 Arterial blood gases: PaCO2 (mmHg).
3.12. Analysis.

Comparison 3 NIV in overnight ventilation compared to room air, Outcome 12 Arterial blood gases: HCO3 (mmol/L).
3.13. Analysis.
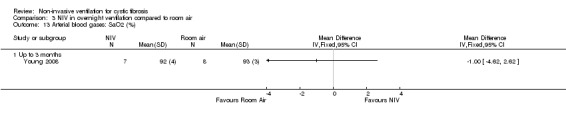
Comparison 3 NIV in overnight ventilation compared to room air, Outcome 13 Arterial blood gases: SaO2 (%).
The short‐term trial (n = 8) looked at awake arterial blood gases (Young 2008) but found no significant difference for any outcome measure in either comparison as summarised in the table below:
| Comparison | Outcome | Result | Analysis |
| NIV compared to oxygen | pH | MD 0.00 (95% CI ‐0.03 to 0.03) | Analysis 2.7 |
| PaO₂ | MD ‐4.00 mmHg (95% CI ‐13.43 to 5.43) | Analysis 2.8 | |
| PaCO₂ | MD ‐1.00 mmHg (95% CI ‐7.10 to 5.10) | Analysis 2.9 | |
| HCO₃ | MD 0.00 mmol/L (95% CI ‐3.14 to 3.14) | Analysis 2.10 | |
| SaO₂ % | MD ‐2.00 % (95% CI ‐6.06 to 2.06) | Analysis 2.11 | |
| NIV compared to room air | pH | MD 0.01 (95% CI ‐0.02 to 0.04) | Analysis 3.9 |
| PaO₂ | MD ‐2.00 mmHg (95% CI ‐8.58 to 4.58) | Analysis 3.10 | |
| PaCO₂ | MD ‐2.00 mmHg (95% CI ‐8.10 to 4.10) | Analysis 3.11 | |
| HCO₃ | MD 0.00 mmol/L (95% CI ‐2.55 to 2.55) | Analysis 3.12 | |
| SaO₂ % | MD ‐1.00 % (95% CI ‐4.62 to 2.6) | Analysis 3.13 |
3. Sputum production
No trials looked at sputum production.
4. Exercise tolerance
One short‐term trial (n = 8) looked at exercise tolerance (Young 2008). There was no significant difference in the modified shuttle walk test (MSWT) between NIV and oxygen, MD 56.00 m (95% CI ‐76.74 to 188.74) (Analysis 2.12). For the comparison between NIV and room air, the analysis in RevMan shows no significant difference in the MSWT, MD 78.00 m (95% CI ‐62.52 to 218.52) (Analysis 3.14). However, the original paper reported a significant difference in the MSWT between the NIV and room air intervention, MD 83.00 m (95% CI 21 to 144) (Young 2008).
2.12. Analysis.

Comparison 2 NIV in overnight ventilation compared to oxygen, Outcome 12 Exercise performance (MSWT) (metres).
3.14. Analysis.

Comparison 3 NIV in overnight ventilation compared to room air, Outcome 14 Exercise performance (metres).
5. Impact on health resources
No trials looked at the impact on health resources.
6. Measures of nocturnal polysomnography
Two single‐night trials (n = 19) (Gozal 1997; Milross 2001) and the six‐week trial (n = 8) (Young 2008) looked at measures of sleep polysomnography.
a. Total sleep time (TST)
This outcome was reported in one single‐night trial (n = 6) (Gozal 1997) and the six‐week trial (n = 8) (Young 2008).
In the single‐night trial there was no statistical difference in TST when NIV was compared to supplemental oxygen (Gozal 1997), MD 4.00 min (95% CI ‐29.39 to 37.39) (Analysis 2.13) or when it was compared to room air, MD 12.00 min (95% CI ‐33.56 to 57.56) (Analysis 3.15).
2.13. Analysis.
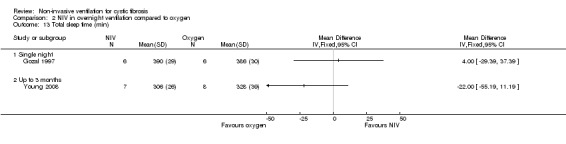
Comparison 2 NIV in overnight ventilation compared to oxygen, Outcome 13 Total sleep time (min).
3.15. Analysis.
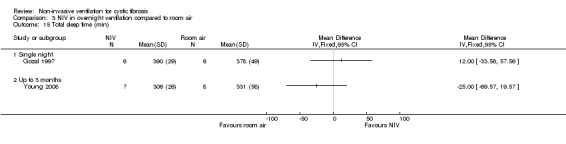
Comparison 3 NIV in overnight ventilation compared to room air, Outcome 15 Total sleep time (min).
The six‐week trial also reported no statistical difference in TST when comparing NIV to supplemental oxygen (Young 2008), MD ‐22.00 min (95% CI ‐55.19 to 11.19) (Analysis 2.13) or when comparing it to room air, MD ‐25.00 min (95% CI ‐69.57 to 19.57) (Analysis 3.15).
b. REM sleep architecture
Gozal (n = 6) reported no statistical difference in the absolute amount of time spent in REM sleep, MD ‐13.00 min (95% CI ‐43.25 to 17.25) or the % of TST spent in REM sleep, MD ‐3.00 (95% CI ‐9.88 to 3.88) when NIV was compared with supplemental oxygen (Analysis 2.14). Young (n = 8) also showed no statistical difference in the time in REM sleep expressed as a % TST at six weeks, MD 2.00 min (95% CI ‐5.10 to 9.10) when NIV was compared with supplemental oxygen (Analysis 2.14).
2.14. Analysis.
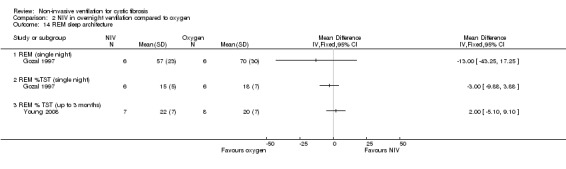
Comparison 2 NIV in overnight ventilation compared to oxygen, Outcome 14 REM sleep architecture.
In our analysis of NIV compared to room air, there was no statistical difference in the absolute time spent in REM sleep, MD 10.00 min (95% CI ‐13.37 to 33.37) or the % TST spent in REM sleep, MD 3.00 min (95% CI ‐1.67 to 7.67) (Analysis 3.16). However, in the original trial both the amount of REM sleep and the % TST spent in REM sleep were significantly greater in the NIV night than in the room air night (Gozal 1997). At six weeks, Young reported no statistical difference in time in REM sleep expressed as a % TST, MD 2.00 (95% CI ‐5.59 to 9.59) when NIV was compared with room air (Analysis 3.16).
3.16. Analysis.
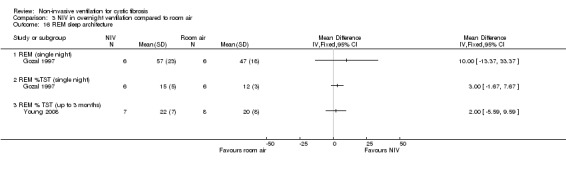
Comparison 3 NIV in overnight ventilation compared to room air, Outcome 16 REM sleep architecture.
c. Sleep latency
Sleep onset latency is the length of time that it takes to accomplish the transition from full wakefulness to sleep, normally to the lightest of the non‐REM sleep stages. Sleep latency was reported in two single‐night trials (n = 19) (Gozal 1997; Milross 2001) and one six‐week trial (n = 8) (Young 2008). After one night, there was no statistical difference in sleep latency with NIV compared to supplemental oxygen, MD 2.93 min (95% CI ‐0.32 to 6.19); this was also true after six weeks, MD ‐5.00 min (95% CI ‐19.17 to 9.17) (Analysis 2.15).
2.15. Analysis.
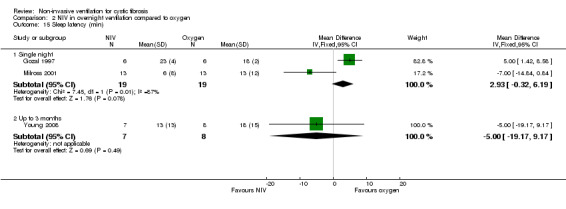
Comparison 2 NIV in overnight ventilation compared to oxygen, Outcome 15 Sleep latency (min).
When comparing NIV to room air, the two single‐night trials showed no statistical difference in sleep latency between the groups, MD ‐2.63 min (95% CI ‐7.37 to 2.11); again, this was also not significant at six weeks, MD ‐3.00 min (95% CI ‐19.88 to 13.88) (Analysis 3.17).
3.17. Analysis.
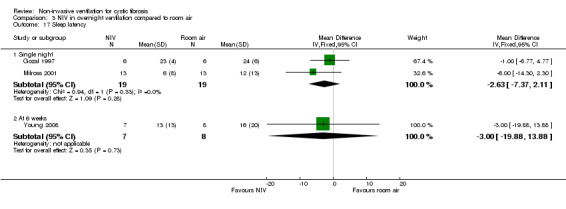
Comparison 3 NIV in overnight ventilation compared to room air, Outcome 17 Sleep latency.
d. Nocturnal oxygen levels
The Gozal and Young trials (n = 14) reported mean SpO₂ (Gozal 1997; Young 2008). Our analysis of the Gozal data showed no statistically significant difference in mean SpO₂ between NIV and supplemental oxygen during either REM sleep, MD ‐2.00% (95% CI ‐4.88 to 0.88) or NREM sleep, MD ‐1.00% (95% CI ‐2.79 to 0.79) (Analysis 2.16); although the original trial reported SpO₂ to be significantly lower during REM and NREM sleep on the NIV night (Gozal 1997). When Young (n = 8) compared NIV to oxygen for six weeks, the mean SpO₂ for TST was not statistically significant between groups, MD ‐1.00 % (95% CI ‐3.62 to 1.62) (Analysis 2.16). Young also reported nocturnal hypoxia, defined as SpO₂ below 90% (Young 2008) and showed no significant difference between NIV and oxygen for TST with SpO₂ below 90%, MD 13.00 % (95% CI ‐12.95 to 38.95) (Analysis 2.16). Milross (n = 13) reported the proportion of time spent with SpO₂ over 90% during TST, REM and NREM (Milross 2001). Analysing these data using GIV, there were no statistically significant differences between NIV and supplemental oxygen either during TST, MD ‐2.54 min (95% CI ‐9.59 to 4.50); in REM sleep, MD 0.65 min (95% CI ‐8.94 to 10.25); or in NREM sleep, MD ‐0.84 min (95% CI ‐7.95 to 6.26) (Analysis 2.17).
2.16. Analysis.
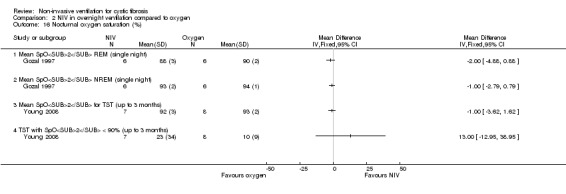
Comparison 2 NIV in overnight ventilation compared to oxygen, Outcome 16 Nocturnal oxygen saturation (%).
2.17. Analysis.
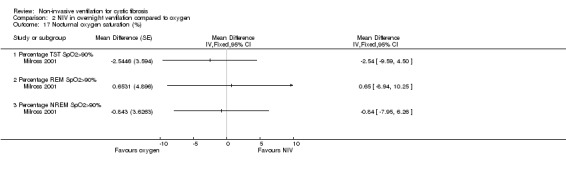
Comparison 2 NIV in overnight ventilation compared to oxygen, Outcome 17 Nocturnal oxygen saturation (%).
Comparing NIV versus room air, our analysis of data from the Gozal trial showed mean SpO₂ to be significantly greater in the NIV group during both REM sleep, MD 9.00% (95% CI 2.91 to 15.09) and NREM sleep, MD 5.00% (95% CI 0.69 to 9.31) (Analysis 3.18); although this difference was not significant in the primary trial analysis (Gozal 1997). In contrast to this, the Young trial showed no significant difference in mean SpO₂ for TST between NIV and room air at six weeks, MD 3.00 (95% CI ‐1.04 to 7.04) (Analysis 3.18). When analysing data from the Milross trial for the comparison of NIV to room air, we found that SpO₂ was greater than 90% for significantly more time in the NIV group during TST, MD 27.58 min (95% CI 7.83 to 47.33); during REM sleep, MD 34.53 min (95% CI 15.00 to 54.06); and during NREM sleep, MD 26.21 min (95% CI 6.24 to 46.18) (Analysis 3.19). The original trial reported that SpO₂ was over 90% for significantly less time during TST and REM sleep on the room air night versus the oxygen or NIV night and that there was no significant difference in percentage of time spent with SpO₂ over 90% in NREM during the NIV night or the oxygen night and the room air night (Milross 2001). Analysis of the data from the Young trial for nocturnal hypoxia when comparing NIV with room air showed no significant difference between treatment groups, MD ‐25.00 (95% CI ‐66.90 to 16.90) (Analysis 3.18)
3.18. Analysis.
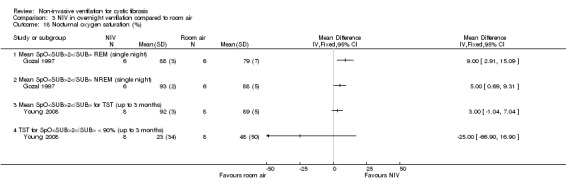
Comparison 3 NIV in overnight ventilation compared to room air, Outcome 18 Nocturnal oxygen saturation (%).
3.19. Analysis.
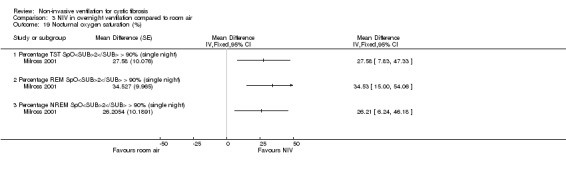
Comparison 3 NIV in overnight ventilation compared to room air, Outcome 19 Nocturnal oxygen saturation (%).
e. Nocturnal carbon dioxide levels
In the Gozal trial (n = 6) transcutaneous carbon dioxide (TcCO₂) on the NIV night was significantly lower than in the oxygen night during REM sleep, MD ‐1.90 mmHg (95% CI ‐2.55 to ‐1.25) and during NREM sleep, MD ‐1.40 mmHg (95% CI ‐2.19 to ‐0.61) (Analysis 2.18). The Milross trial reported TcCO₂ during sleep in terms of change during different phases of sleep (Milross 2001). The change in TcCO₂ from NREM to REM in the NIV night was significantly less than in the oxygen night, MD ‐2.60 mmHg (95% CI ‐4.05 to ‐1.16) (Analysis 3.21); the original report stated that NIV with oxygen "significantly attenuated the rise in TcCO₂ seen with REM sleep compared with both supplemental oxygen and room air" (Milross 2001). Milross and Young also compared the maximum TcCO₂ for NIV and supplemental oxygen groups (Milross 2001; Young 2008). In the shorter trial, Milross reported no significant difference between the two nights, MD ‐2.08 mmHg (95% CI ‐10.64 to 6.48) (Analysis 2.19). In the longer trial, Young reported a significantly lower maximum pressure of transcutaneous carbon dioxide (PtCO₂) during TST with NIV compared to oxygen, MD ‐14.00 mmHg (95% CI ‐23.22 to ‐4.78) (Analysis 2.20). Young also reported a significant result for NIV compared to oxygen for both the mean change in PtCO₂ , MD ‐2.80 mmHg (95% CI ‐5.53 to ‐0.77) and the mean change in partial pressure of carbon dioxide (PaCO₂), MD ‐7.30 mmHg (95% CI ‐11.51 to ‐3.09) (Analysis 2.18).
2.18. Analysis.
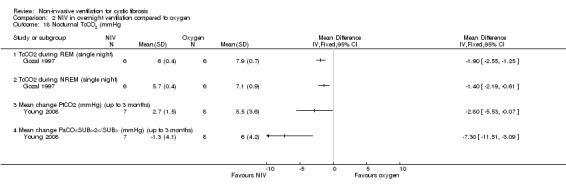
Comparison 2 NIV in overnight ventilation compared to oxygen, Outcome 18 Nocturnal TcCO2 (mmHg.
3.21. Analysis.
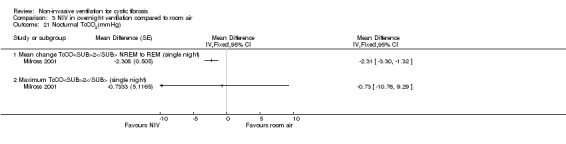
Comparison 3 NIV in overnight ventilation compared to room air, Outcome 21 Nocturnal TcCO2(mmHg).
2.19. Analysis.
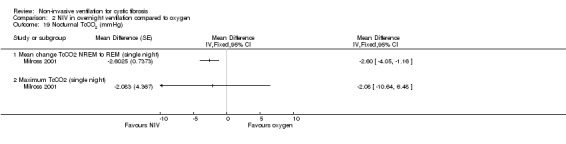
Comparison 2 NIV in overnight ventilation compared to oxygen, Outcome 19 Nocturnal TcCO2 (mmHg).
2.20. Analysis.
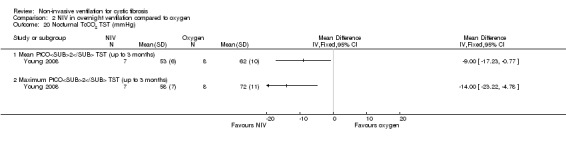
Comparison 2 NIV in overnight ventilation compared to oxygen, Outcome 20 Nocturnal TcCO2 TST (mmHg).
When comparing NIV to room air, Gozal reported that TcCO₂ in the NIV night was significantly lower during both REM, MD ‐0.90 mmHg (95% CI ‐1.62 to ‐0.18) and during NREM, MD ‐0.70 mmHg (95% CI ‐1.15 to ‐0.25) (Analysis 3.20). Milross reported that the change in TcCO₂ from NREM to REM in the NIV night was significantly less than in the room air night, MD ‐2.31 mmHg (95% CI ‐3.30 to ‐1.32) (Analysis 3.21); the original report stated that NIV with oxygen "significantly attenuated the rise in TcCO₂ seen with REM sleep compared with both supplemental oxygen and room air" (Milross 2001). Milross and Young compared the maximum TcCO₂ for NIV and room air groups (Milross 2001; Young 2008). Milross reported a no difference between the NIV and room air groups, MD ‐0.73 mmHg (95% CI ‐10.76 to 9.29) (Analysis 3.21). Young reported a significantly lower maximum PtCO₂ during TST for the NIV group compared to the room air group, MD ‐16.00 mmHg (95% CI ‐30.15 to ‐1.85), but no significance difference between the two groups for mean PtCO₂ during TST, MD ‐9.0 mmHg (95% CI ‐19.05 to 1.05) (Analysis 3.22). In the same trial there was a significant difference in mean change PtCO₂ for NIV compared to room air, MD ‐2.20 mmHg (95% CI ‐4.32 to ‐0.8), but no significant difference for mean change PaCO₂ for NIV compared to room air, MD ‐3.30 mmHg (95% CI ‐6.73 to 0.13) (Analysis 3.20)
3.20. Analysis.
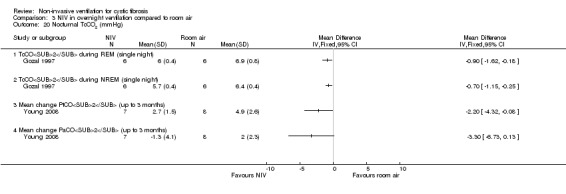
Comparison 3 NIV in overnight ventilation compared to room air, Outcome 20 Nocturnal TcCO2 (mmHg).
3.22. Analysis.
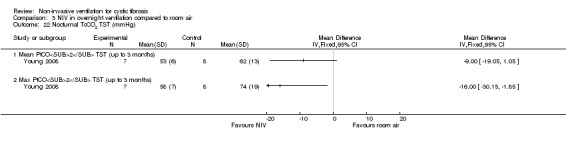
Comparison 3 NIV in overnight ventilation compared to room air, Outcome 22 Nocturnal TcCO2 TST (mmHg).
f. Episodes of hypopnoea
One single‐night trial (n = 13) reported on this outcome (Milross 2001). The trial reports that in the NIV night the number of episodes of hypopnoeas per hour were significantly lower than in the oxygen night, relative rate (RR) 0.02 (95% CI 0.01 to 0.06) (Analysis 2.21); likewise, these were significantly lower in the NIV night than the room air night, RR 0.02 (95% CI 0.01 to 0.05) (Analysis 3.23).
2.21. Analysis.

Comparison 2 NIV in overnight ventilation compared to oxygen, Outcome 21 Hypopneas.
3.23. Analysis.
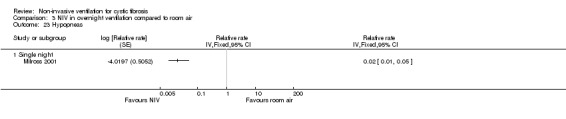
Comparison 3 NIV in overnight ventilation compared to room air, Outcome 23 Hypopneas.
g. Heart rate
There was no significant difference in mean heart rate when NIV was compared to oxygen, MD ‐6.00 bpm (95% CI ‐22.7 to 10.7); NIV compared to room air, MD ‐9.00 bpm (95% CI ‐21.89 to 3.89), whereas in the original paper a significant difference was reported (P = 0.05) (Young 2008) (Analysis 2.22) .
2.22. Analysis.
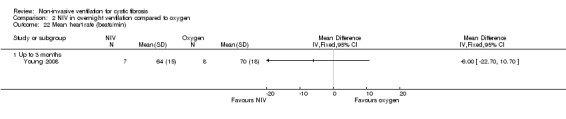
Comparison 2 NIV in overnight ventilation compared to oxygen, Outcome 22 Mean heart rate (beats/min).
h. Respiratory rate
Only one trial (n = 8) reported on this outcome (Young 2008). There was no significant difference in mean respiratory rate when NIV was compared to oxygen, MD 1.00 bpm (95% CI ‐3.04 to 5.04) (Analysis 2.23).
2.23. Analysis.
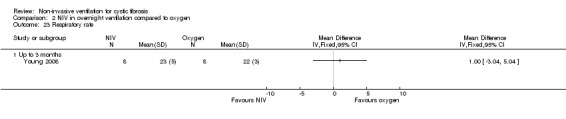
Comparison 2 NIV in overnight ventilation compared to oxygen, Outcome 23 Respiratory rate.
7. Effect on nutrition and weight
No trials looked at nutrition and weight.
8. Measures of right‐sided cardiac function
No trials looked at right‐sided cardiac function.
9. Cost
No trials looked at cost.
10. Adherence to treatment and preference
Two trials (n = 14) looked at treatment preference (Gozal 1997; Young 2008). Gozal reported that four out of six participants preferred oxygen to NIV, despite morning headache being present in two participants following the oxygen night (Gozal 1997). The Young trial reported that four out of eight participants rated oxygen as the most comfortable, whilst two rated oxygen and air equally comfortable (Young 2008). Four out of eight participants preferred oxygen as long‐term therapy whilst three preferred NIV; no participants selected air as their preferred treatment (Young 2008).
11. Adverse events
One trial did not make any comments on negative or adverse effects (Gozal 1997). Two trials provided information about negative effects (Milross 2001 ; Young 2008). Milross reported consequential deviations in treatment in one participant who was unable to tolerate increases in IPAP (Milross 2001). Young reported that four participants withdrew in total: one participant withdrew from the NIV arm of the trial as they did not tolerate NIV due to mask discomfort; one participant withdrew following consent due to developing a pneumothorax whilst on air, which was considered as coincidental; and two participants experienced aerophagia which resolved when the IPAP was reduced by 2 cm H₂0. (Young 2008).
The role of NIV during exercise
One cross‐over trial (n = 13) explored the effect of NIV versus no NIV during exercise (Lima 2014).
Primary outcomes
1. Mortality
This trial did not look at mortality (Lima 2014).
2. QoL
This trial did not look at health‐related QoL (Lima 2014).
3. Symptoms of sleep‐disordered breathing
This trial did not look at sleep (Lima 2014).
Secondary outcomes
1. Lung function
Lung function data (FEV₁, FVC, FEF25‐75, VT, VI and respiratory rate) and indices of ventilation (total time, inspiratory time, expiratory time) were reported in the paper as median (interquartile range (IQR)) values and so could not be analysed in RevMan. The original paper reported that there were no between group differences in lung function or these indices of ventilation (Lima 2014).
2. Gas exchange
These data were not reported in a way that could be analysed in RevMan, but the original paper reports no significant difference in SpO₂ between groups after the treadmill walk test (TWT) (Lima 2014).
3. Respiratory symptom scores and sputum production
Lima reported perceived exertion using the Borg scale, but these data were not presented in a way that could be analysed in RevMan. The original paper reported no significant difference between the groups immediately after the TWTs with or without NIV (Lima 2014).
4. Exercise tolerance
Lima reported a statistical difference in the distance walked when exercising with NIV compared to exercising without NIV (P = 0.039); however, this difference was not significant when the data were analysed in RevMan, MD 28.46 m (95% CI ‐34.04 to 90.95) (Analysis 4.1).
4.1. Analysis.
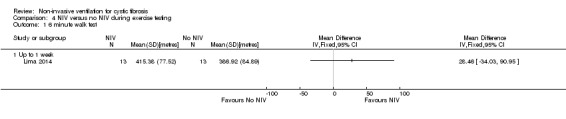
Comparison 4 NIV versus no NIV during exercise testing, Outcome 1 6 minute walk test.
5. Impact on health resources
This trial did consider the impact on health resources (Lima 2014).
6. Nocturnal polysomnography
This trial did not look at nocturnal polysomnography (Lima 2014).
7. Nutrition and weight
This trial did not look at nutrition or weight (Lima 2014).
8. Right‐sided cardiac function
This trial did not look at cardiac function (Lima 2014).
9. Cost
This trial did not look at cost (Lima 2014).
10. Adherence to treatment and preference
This trial did not look at adherence to treatment or preference (Lima 2014).
11. Adverse events
This trial did not report any adverse events (Lima 2014).
Discussion
Summary of main results
A total of 10 trials are included in the review. Six trials focused on the role of non‐invasive ventilation (NIV) as a method of airway clearance (Dwyer 2015; Fauroux 1999; Holland 2003; Kofler 1998; Placidi 2006; Rodriguez Hortal 2016); four of these were single sessions (Fauroux 1999; Holland 2003; Kofler 1998; Placidi 2006), one took place during a two‐week exacerbation period (Dwyer 2015) and one over a three‐month period (Rodriguez Hortal 2016). Three trials looked at the role of NIV in overnight ventilation; two were single‐night trials (Gozal 1997; Milross 2001) and one lasted six weeks (Young 2008). The final trial focused on the role of NIV on exercise capacity for a single intervention (Lima 2014). The review authors recognise that short‐term studies may not allow the participants in the studies sufficient time to familiarise themselves with NIV and this is an important consideration for future trials.
In a single physiotherapy session the use of NIV led to easier airway clearance in participants with stable moderate to severe disease and most participants preferred to use NIV for airway clearance treatment. We were unable to find any evidence that NIV increases sputum expectoration or improves lung function. There is some evidence that the introduction of NIV to airway clearance preserved muscle strength and improved expiratory muscle strength. No deleterious effects on small airway function were observed. In terms of airway clearance over a longer period of time, e.g. among people hospitalised for an acute exacerbation of cystic fibrosis (CF), the use of NIV as an adjunct to the airway clearance regimen offers no clear benefit compared to no NIV. A more recent trial has used the lung clearance index (LCI) to explore the effect of NIV on ventilation inhomogeneity and this may be a potentially useful outcome to explore the effect of airway clearance and also improve understanding of mechanisms of action.
In terms of overnight ventilatory support in a single nocturnal treatment session, NIV offers benefits over oxygen or room air. Nocturnal hypoventilation is an early marker of respiratory deterioration in advanced CF and can lead to the development of daytime hypercapnia. By attenuating the decrease in ventricular tachycardia and improving ventilation during sleep NIV decreases hypoventilation in people with moderate to severe lung disease. Nocturnal oxygen saturation (SpO₂) may be increased by NIV and oxygen or oxygen alone, but the increase in SpO₂ with NIV and oxygen is likely to occur without a concomitant increase in transcutaneous carbon dioxide (TcCO₂), as seen when people receive oxygen alone. The respiratory rate on the NIV night was significantly lower in rapid eye movement (REM) sleep than on the room air or oxygen nights. In the trial by Gozal, four out of six participants reported that they preferred oxygen therapy overnight to NIV and oxygen (Gozal 1997). Milross found only one participant in the group of 13 who was unable to tolerate sufficiently high pressures to improve nocturnal ventilation (Milross 2001).
In terms of a longer period of overnight ventilation (six weeks), NIV further demonstrated an improvement in nocturnal hypercapnic levels as well as a meaningful clinically important difference in peak exercise capacity and exertional dyspnoea when compared to room air. Young identified the improvement of peak exercise capacity as important since it is a predictor of survival in adults and children with CF (Young 2008). However, this six‐week intervention did not lead to a change in sleep architecture, lung function or awake hypercapnic levels. With regard to preference, four participants preferred oxygen as a long‐term therapy, three preferred NIV and none selected air as their preferred long‐term therapy (Young 2008).
In terms of exercise capacity, one study reported that the distance walked increased significantly with NIV during a single session comparing NIV to no NIV while walking (Lima 2014).
Overall, the results from included studies demonstrate that NIV improves the physiological markers of early respiratory failure following a single nocturnal treatment session, with improvements in exercise tolerance, selected aspects of quality of life and nocturnal carbon dioxide levels when used over a longer period. Nocturnal respiratory support with NIV has important implications for the people with CF and advanced lung disease and may attenuate the early effects and progression of respiratory failure. Further investigations over longer time periods are warranted to determine if these changes will be sustained or have any influence on clinical outcomes. Which subgroups benefit most from NIV intervention also needs to be established.
Overall completeness and applicability of evidence
The included trials covered all ranges of disease severity and status and also all ages, so the results are likely applicable to the CF population in general. It is notable that there was limited use of important primary outcomes such as mortality, but this was likely due to the length of studies in this review. Longer‐term studies are required to fully determine the effect on the review's primary outcomes. It is important to note that in the longest included trial, Young did not address the issue of NIV in combination with oxygen as opposed to NIV alone. The combination of NIV and oxygen is more commonly considered in clinical practice in people with CF and severe lung disease (Young 2008).
Quality of the evidence
One of the trials is in abstract form only and hence the data available from this trial are limited (Kofler 1998).
Nine of the trials were randomised cross‐over trials and although the existence of a carry‐over effect was only investigated in one trial (Holland 2003), each trial included a washout period between the interventions.
All of the trials used random allocation. Four trials provided details on the specific procedures used (Dwyer 2015; Lima 2014; Placidi 2006; Young 2008). The remaining six trials were described as randomised, although details of how this was done are lacking (Fauroux 1999 ; Gozal 1997 ; Holland 2003 ; Kofler 1998 ; Milross 2001 ; Rodriguez Hortal 2016).
None of the trials were double‐blinded. However, this quality issue must be considered in the context of the difficulty of blinding NIV trials. It was clear in one trial that the outcome measurements were performed by an independent assessor, who was not involved in the delivery of the interventions (Holland 2003). In a further trial it was clear that the majority of outcomes were measured by an independent assessor (Rodriguez Hortal 2016).
These quality issues affect the internal validity of the trials. The external validity of these trials is limited by the fact that six of the trials in the review only assess the efficacy of a single‐treatment session of NIV and do not study the longer‐term efficacy or safety of NIV.
Potential biases in the review process
These have been minimised by a comprehensive search strategy and by multiple authors independently assessing trials for inclusion and for risk of bias.
Agreements and disagreements with other studies or reviews
These findings are in agreement with the British Thoracic Society (BTS) and Intensive Care Society (ICS) Guideline for the ventilatory management of acute hypercapnic respiratory failure in adults (Davidson 2016).
Authors' conclusions
Implications for practice.
We have found some limited evidence to support the use of NIV as a clinical treatment in people with CF. NIV may be a useful adjunct to other airway clearance techniques, particularly in people with CF who have difficulty expectorating sputum or where fatigue or respiratory muscle weakness is an issue. The trials in this review demonstrate that when used together with overnight oxygen, NIV improves gas exchange during sleep to a greater extent than oxygen therapy alone in people with moderate to severe CF. Use of NIV over a six‐week period provided benefits over oxygen and room air for those people with CF who experience daytime hypercapnia in terms of exercise tolerance, dyspnoea and nocturnal gas exchange; this effect of NIV has been demonstrated in only one clinical trial. In children with stable disease, one trial of a single session of NIV increased functional capacity.
Implications for research.
There is a need for long‐term multicentre randomised controlled trials which are adequately powered to assess the impact of NIV on quality of life and clinical disease progression when used as an adjunct to airway clearance or as a method of overnight ventilation or to increase functional exercise capacity. At the protocol stage and when conducting short‐term trials the power of the trial should be considered. There is also a need to further establish the role of NIV in exercise in CF and which subgroups would benefit most from NIV intervention. Although it is impossible to double blind any future trials, it is important to undertake blind assessment of the participants to ensure good quality trials. Future trials should use outcome measures which are considered important by people with CF such as health‐related quality of life and dyspnoea. Future trials must also assess the impact of NIV use on both people with CF and their carers in terms of practical difficulties, such as inconvenience, noise, intrusiveness and travel restrictions.
In the Young trial despite the benefits outlined above, nocturnal hypoxaemia persisted in the NIV group and in the oxygen group. Therfore further research is needed to establish if a combination of NIV and oxygen is more effective in the long term.
What's new
| Date | Event | Description |
|---|---|---|
| 13 February 2017 | New search has been performed | A search of the Cystic Fibrosis and Genetic Disorders Review Group's Cystic Fibrosis Trials Register and additional searches by the authors identified a total of 11 new references to eight trials which were potentially eligible for inclusion. Two were additional references to two already included trials (Fauroux 1999; Holland 2003). Three new trials (five references) have been included in the updated review (Dwyer 2015; Lima 2014; Rodriguez Hortal 2016). One trial (single reference) has been excluded (Fauroux 2000b). The remaining trial is still only reported in abstract form and, due to having very limited data, is listed as 'Awaiting Classification' until further data are available (Petrone 2009). |
| 13 February 2017 | New citation required but conclusions have not changed | As we have only been able to include a limited amount of new information in this version of the review, our conclusions remain the same. |
History
Protocol first published: Issue 4, 2000 Review first published: Issue 2, 2003
| Date | Event | Description |
|---|---|---|
| 24 March 2014 | Amended | Contact details updated. |
| 14 March 2013 | New search has been performed | A search of the Cochrane Cystic Fibrosis & Genetic Disorders Group's Cystic Fibrosis register did not identify any new references eligible for inclusion in this review. |
| 14 March 2013 | New citation required but conclusions have not changed | No new references were included in this update of the review, hence the conclusions remain the same. |
| 22 May 2012 | Amended | Contact details updated. |
| 29 March 2011 | New search has been performed | A search of the Group's Cystic Fibrosis Trials Register identified three new references which were potentially eligible for this review. One of these was an additional reference to an already included study (Young 2008). Two references were excluded (Fauroux 2000a; Riethmueller 2006). |
| 26 April 2010 | Amended | Contact details updated. |
| 30 September 2008 | New citation required but conclusions have not changed | Ashley Jones has stepped down as co‐author. |
| 12 June 2008 | New search has been performed | A search of the Group's Cystic Fibrosis Trials Register identified that the previously included 2006 abstract has now been published as a full paper (Young 2008). |
| 12 June 2008 | Amended | Converted to new review format. |
| 18 February 2008 | Amended | There have been some corrections to the graph labels in the following graphs: 01 01, 01 02, 01 09, 01 10, 01 11, 01 12, 02 04, 03 07. |
| 22 August 2007 | New search has been performed | The sleep data from the Milross trial, which appeared in the graphs removed in the previous update of the review, have now been more appropriately analysed using GIV methodology and are presented in this update. A new search identified seven new references to six studies. One of these references was to an already included study (Holland 2003). Of the remaining six references to five studies, three have not been included as they were not randomised controlled trials in which a form of pressure preset or volume preset NIV versus no NIV was used in people with acute or chronic respiratory failure in CF and they have been added to the excluded studies section (Falk 2006; Fauroux 2004; Greenough 2004). Two studies were included as they fulfilled inclusion criteria (Placidi 2006; Young 2006). |
| 22 August 2007 | New citation required and conclusions have changed | Substantive amendment |
| 23 May 2004 | New search has been performed | Amanda Piper and joined the review team as a second co‐author. A new search identified four new references. One trial (Holland 2003) has been included and three trials have been excluded (Fauroux 2001; Serra 2000; Serra 2002). |
Acknowledgements
The authors thank Dr Peter Wark and Professor Rosalind Smyth for editorial advice. The authors would also like to thank Ashley Jones who has advised on the statistics in previous updated versions of the review. Thanks to Nikki Jahnke for help with reformatting text.
Data and analyses
Comparison 1. NIV versus no NIV during chest physiotherapy (any technique).
| Outcome or subgroup title | No. of studies | No. of participants | Statistical method | Effect size |
|---|---|---|---|---|
| 1 CFQ scores | 1 | Mean Difference (IV, Fixed, 95% CI) | Totals not selected | |
| 1.1 Physical Domain | 1 | Mean Difference (IV, Fixed, 95% CI) | 0.0 [0.0, 0.0] | |
| 1.2 Health Domain | 1 | Mean Difference (IV, Fixed, 95% CI) | 0.0 [0.0, 0.0] | |
| 1.3 Respiratory Domain | 1 | Mean Difference (IV, Fixed, 95% CI) | 0.0 [0.0, 0.0] | |
| 2 Fatigue | 1 | Mean Difference (IV, Fixed, 95% CI) | Totals not selected | |
| 3 FEV1 (L) | 2 | Mean Difference (IV, Fixed, 95% CI) | Subtotals only | |
| 3.1 Up to 1 week (directed cough) | 2 | 86 | Mean Difference (IV, Fixed, 95% CI) | ‐0.03 [‐0.17, 0.12] |
| 3.2 Up to 1 week (PEP) | 1 | 34 | Mean Difference (IV, Fixed, 95% CI) | ‐0.05 [‐0.22, 0.12] |
| 4 FEV1 (% predicted) | 3 | Mean Difference (IV, Fixed, 95% CI) | Totals not selected | |
| 4.1 Up to 1 week (directed cough) | 1 | Mean Difference (IV, Fixed, 95% CI) | 0.0 [0.0, 0.0] | |
| 4.2 Up to 2 weeks (all techniques combined) | 1 | Mean Difference (IV, Fixed, 95% CI) | 0.0 [0.0, 0.0] | |
| 4.3 Up to 3 months (PEP) | 1 | Mean Difference (IV, Fixed, 95% CI) | 0.0 [0.0, 0.0] | |
| 5 FVC (L) | 2 | Mean Difference (IV, Fixed, 95% CI) | Subtotals only | |
| 5.1 Up to 1 week (directed cough) | 2 | 86 | Mean Difference (IV, Fixed, 95% CI) | 0.00 [‐0.30, 0.30] |
| 5.2 Up to 1 week (PEP) | 1 | 34 | Mean Difference (IV, Fixed, 95% CI) | ‐0.07 [‐0.47, 0.33] |
| 6 FVC (% predicted) | 2 | Mean Difference (IV, Fixed, 95% CI) | Totals not selected | |
| 6.1 Up to 1 week (directed cough) | 1 | Mean Difference (IV, Fixed, 95% CI) | 0.0 [0.0, 0.0] | |
| 6.2 Up to 3 months (PEP) | 1 | Mean Difference (IV, Fixed, 95% CI) | 0.0 [0.0, 0.0] | |
| 7 FEF25‐75 (L) | 2 | Mean Difference (IV, Fixed, 95% CI) | Subtotals only | |
| 7.1 Up to 1 week (directed cough) | 2 | 86 | Mean Difference (IV, Fixed, 95% CI) | ‐0.00 [‐0.08, 0.07] |
| 7.2 Up to 1 week (PEP) | 1 | 34 | Mean Difference (IV, Fixed, 95% CI) | 0.0 [‐0.07, 0.07] |
| 8 FEF25‐75 (% predicted) | 1 | Mean Difference (IV, Fixed, 95% CI) | Totals not selected | |
| 8.1 Up to 1 week (directed cough) | 1 | Mean Difference (IV, Fixed, 95% CI) | 0.0 [0.0, 0.0] | |
| 9 Respiratory muscle strength PImax (cmH20) | 2 | Mean Difference (IV, Fixed, 95% CI) | Totals not selected | |
| 9.1 Up to 1 week (all techniques combined) | 1 | Mean Difference (IV, Fixed, 95% CI) | 0.0 [0.0, 0.0] | |
| 9.2 Up to 2 weeks (all techniques combined) | 1 | Mean Difference (IV, Fixed, 95% CI) | 0.0 [0.0, 0.0] | |
| 10 Respiratory muscle strength PEmax (cmH20) | 2 | Mean Difference (IV, Fixed, 95% CI) | Totals not selected | |
| 10.1 Up to 1 week (all techniques combined) | 1 | Mean Difference (IV, Fixed, 95% CI) | 0.0 [0.0, 0.0] | |
| 10.2 Up to 2 weeks (all techniques combined) | 1 | Mean Difference (IV, Fixed, 95% CI) | 0.0 [0.0, 0.0] | |
| 11 Airway resistance % predicted | 1 | Mean Difference (IV, Fixed, 95% CI) | Totals not selected | |
| 11.1 Up to 1 week (all techniques combined) | 1 | Mean Difference (IV, Fixed, 95% CI) | 0.0 [0.0, 0.0] | |
| 12 LCI | 1 | Mean Difference (IV, Fixed, 95% CI) | Totals not selected | |
| 12.1 Up to 3 months (PEP) | 1 | Mean Difference (IV, Fixed, 95% CI) | 0.0 [0.0, 0.0] | |
| 13 Oxygen saturation during airway clearance (%) | 1 | Mean Difference (IV, Fixed, 95% CI) | Totals not selected | |
| 13.1 Up to 1 week (all techniques combined) | 1 | Mean Difference (IV, Fixed, 95% CI) | 0.0 [0.0, 0.0] | |
| 14 Oxygen saturation during airway clearance (change in SpO2 % during treatment) | 1 | Mean Difference (IV, Fixed, 95% CI) | Totals not selected | |
| 14.1 Up to 1 week (all techniques combined) | 1 | Mean Difference (IV, Fixed, 95% CI) | 0.0 [0.0, 0.0] | |
| 15 Oxygen saturation after airway clearance (SpO2) | 1 | Mean Difference (IV, Fixed, 95% CI) | Totals not selected | |
| 15.1 Up to 1 week (directed cough) | 1 | Mean Difference (IV, Fixed, 95% CI) | 0.0 [0.0, 0.0] | |
| 15.2 Up to 1 week (PEP) | 1 | Mean Difference (IV, Fixed, 95% CI) | 0.0 [0.0, 0.0] | |
| 16 PaCO2 | 1 | Mean Difference (IV, Fixed, 95% CI) | Totals not selected | |
| 16.1 Up to 3 months (PEP) | 1 | Mean Difference (IV, Fixed, 95% CI) | 0.0 [0.0, 0.0] | |
| 17 Breathlessness | 2 | Std. Mean Difference (IV, Fixed, 95% CI) | Totals not selected | |
| 17.1 Up to 1 week (Borg breathlessness score) | 1 | Std. Mean Difference (IV, Fixed, 95% CI) | 0.0 [0.0, 0.0] | |
| 17.2 Up to 2 weeks (VAS score) | 1 | Std. Mean Difference (IV, Fixed, 95% CI) | 0.0 [0.0, 0.0] | |
| 18 Sputum wet weight (g) | 3 | Mean Difference (IV, Fixed, 95% CI) | Subtotals only | |
| 18.1 Up to 1 week (directed cough) | 3 | 118 | Mean Difference (IV, Fixed, 95% CI) | ‐0.69 [‐3.06, 1.67] |
| 18.2 Up to 1 week (PEP) | 1 | 34 | Mean Difference (IV, Fixed, 95% CI) | ‐2.58 [‐6.11, 0.95] |
| 19 Sputum dry weight (g) | 1 | Mean Difference (IV, Fixed, 95% CI) | Totals not selected | |
| 19.1 Up to 1 week (directed cough) | 1 | Mean Difference (IV, Fixed, 95% CI) | 0.0 [0.0, 0.0] | |
| 19.2 Up to 1 week (PEP) | 1 | Mean Difference (IV, Fixed, 95% CI) | 0.0 [0.0, 0.0] | |
| 20 Sputum volume per day (VAS score) | 1 | Mean Difference (IV, Fixed, 95% CI) | Totals not selected | |
| 20.1 Up to 2 weeks (all techniques combined) | 1 | Mean Difference (IV, Fixed, 95% CI) | 0.0 [0.0, 0.0] | |
| 21 Pseudomonas density (log CFU/g) | 1 | Mean Difference (IV, Fixed, 95% CI) | Totals not selected | |
| 21.1 Up to 2 weeks (all techniques combined) | 1 | Mean Difference (IV, Fixed, 95% CI) | 0.0 [0.0, 0.0] | |
| 22 Exercise capacity: 25 level modified shuttle test (m) | 1 | Mean Difference (IV, Fixed, 95% CI) | Totals not selected | |
| 22.1 Up to 2 weeks (all techniques combined) | 1 | Mean Difference (IV, Fixed, 95% CI) | 0.0 [0.0, 0.0] | |
| 23 Energy (VAS score) | 1 | Mean Difference (IV, Fixed, 95% CI) | Totals not selected | |
| 23.1 Up to 2 weeks (all techniques combined) | 1 | Mean Difference (IV, Fixed, 95% CI) | 0.0 [0.0, 0.0] | |
| 24 6MWT | 1 | Mean Difference (IV, Fixed, 95% CI) | Totals not selected | |
| 24.1 Up to 3 months (PEP) | 1 | Mean Difference (IV, Fixed, 95% CI) | 0.0 [0.0, 0.0] | |
| 25 Length of hospital stay (days) | 1 | Mean Difference (IV, Fixed, 95% CI) | Totals not selected | |
| 25.1 Up to 2 weeks (all techniques combined) | 1 | Mean Difference (IV, Fixed, 95% CI) | 0.0 [0.0, 0.0] | |
| 26 Time to next admission (days) | 1 | Mean Difference (IV, Fixed, 95% CI) | Totals not selected |
Comparison 2. NIV in overnight ventilation compared to oxygen.
| Outcome or subgroup title | No. of studies | No. of participants | Statistical method | Effect size |
|---|---|---|---|---|
| 1 CFQoL chest symptom score | 1 | Mean Difference (IV, Fixed, 95% CI) | Totals not selected | |
| 1.1 Up to 3 months | 1 | Mean Difference (IV, Fixed, 95% CI) | 0.0 [0.0, 0.0] | |
| 2 CFQoL transitional dyspnoea index | 1 | Mean Difference (IV, Fixed, 95% CI) | Totals not selected | |
| 2.1 Up to 3 months | 1 | Mean Difference (IV, Fixed, 95% CI) | 0.0 [0.0, 0.0] | |
| 3 Symptoms of sleep‐disordered breathing | 1 | Mean Difference (IV, Fixed, 95% CI) | Totals not selected | |
| 3.1 Epworth Sleepiness Scale (up to 3 months) | 1 | Mean Difference (IV, Fixed, 95% CI) | 0.0 [0.0, 0.0] | |
| 3.2 Global PSQI (up to 3 months) | 1 | Mean Difference (IV, Fixed, 95% CI) | 0.0 [0.0, 0.0] | |
| 4 Lung function during sleep | 1 | Mean Difference (Fixed, 95% CI) | Totals not selected | |
| 4.1 VI (L/m) while awake (single night) | 1 | Mean Difference (Fixed, 95% CI) | 0.0 [0.0, 0.0] | |
| 4.2 VI (L/m) during REM (single night) | 1 | Mean Difference (Fixed, 95% CI) | 0.0 [0.0, 0.0] | |
| 4.3 VI (L/m) during NREM (single night) | 1 | Mean Difference (Fixed, 95% CI) | 0.0 [0.0, 0.0] | |
| 4.4 VT (L) while awake (single night) | 1 | Mean Difference (Fixed, 95% CI) | 0.0 [0.0, 0.0] | |
| 4.5 VT (L) during REM (single night) | 1 | Mean Difference (Fixed, 95% CI) | 0.0 [0.0, 0.0] | |
| 4.6 VT (L) during NREM (single night) | 1 | Mean Difference (Fixed, 95% CI) | 0.0 [0.0, 0.0] | |
| 5 Respiratory rate (breaths/min) | 1 | Mean Difference (Fixed, 95% CI) | Totals not selected | |
| 5.1 RR while awake (single night) | 1 | Mean Difference (Fixed, 95% CI) | 0.0 [0.0, 0.0] | |
| 5.2 RR during REM (single night) | 1 | Mean Difference (Fixed, 95% CI) | 0.0 [0.0, 0.0] | |
| 5.3 RR during NREM (single night) | 1 | Mean Difference (Fixed, 95% CI) | 0.0 [0.0, 0.0] | |
| 6 Lung function while awake | 1 | Mean Difference (IV, Fixed, 95% CI) | Totals not selected | |
| 6.1 FEV1% predicted (up to 3 months) | 1 | Mean Difference (IV, Fixed, 95% CI) | 0.0 [0.0, 0.0] | |
| 6.2 FVC % predicted (up to 3 months) | 1 | Mean Difference (IV, Fixed, 95% CI) | 0.0 [0.0, 0.0] | |
| 7 Arterial blood gases: pH | 1 | Mean Difference (IV, Fixed, 95% CI) | Totals not selected | |
| 7.1 Up to 3 months | 1 | Mean Difference (IV, Fixed, 95% CI) | 0.0 [0.0, 0.0] | |
| 8 Arterial blood gases: PaO2 (mmHg) | 1 | Mean Difference (IV, Fixed, 95% CI) | Totals not selected | |
| 8.1 Up to 3 months | 1 | Mean Difference (IV, Fixed, 95% CI) | 0.0 [0.0, 0.0] | |
| 9 Arterial blood gases: PaCO2 (mmHg) | 1 | Mean Difference (IV, Fixed, 95% CI) | Totals not selected | |
| 9.1 Up to 3 months | 1 | Mean Difference (IV, Fixed, 95% CI) | 0.0 [0.0, 0.0] | |
| 10 Arterial blood gases: HCO3 (mmol/L) | 1 | Mean Difference (IV, Fixed, 95% CI) | Totals not selected | |
| 10.1 Up to 3 months | 1 | Mean Difference (IV, Fixed, 95% CI) | 0.0 [0.0, 0.0] | |
| 11 Arterial blood gases: SaO2 (%) | 1 | Mean Difference (IV, Fixed, 95% CI) | Totals not selected | |
| 11.1 Up to 3 months | 1 | Mean Difference (IV, Fixed, 95% CI) | 0.0 [0.0, 0.0] | |
| 12 Exercise performance (MSWT) (metres) | 1 | Mean Difference (IV, Fixed, 95% CI) | Totals not selected | |
| 12.1 Up to 3 months | 1 | Mean Difference (IV, Fixed, 95% CI) | 0.0 [0.0, 0.0] | |
| 13 Total sleep time (min) | 2 | Mean Difference (IV, Fixed, 95% CI) | Totals not selected | |
| 13.1 Single night | 1 | Mean Difference (IV, Fixed, 95% CI) | 0.0 [0.0, 0.0] | |
| 13.2 Up to 3 months | 1 | Mean Difference (IV, Fixed, 95% CI) | 0.0 [0.0, 0.0] | |
| 14 REM sleep architecture | 2 | Mean Difference (IV, Fixed, 95% CI) | Totals not selected | |
| 14.1 REM (single night) | 1 | Mean Difference (IV, Fixed, 95% CI) | 0.0 [0.0, 0.0] | |
| 14.2 REM %TST (single night) | 1 | Mean Difference (IV, Fixed, 95% CI) | 0.0 [0.0, 0.0] | |
| 14.3 REM % TST (up to 3 months) | 1 | Mean Difference (IV, Fixed, 95% CI) | 0.0 [0.0, 0.0] | |
| 15 Sleep latency (min) | 3 | Mean Difference (IV, Fixed, 95% CI) | Subtotals only | |
| 15.1 Single night | 2 | 38 | Mean Difference (IV, Fixed, 95% CI) | 2.93 [‐0.32, 6.19] |
| 15.2 Up to 3 months | 1 | 15 | Mean Difference (IV, Fixed, 95% CI) | ‐5.0 [‐19.17, 9.17] |
| 16 Nocturnal oxygen saturation (%) | 2 | Mean Difference (IV, Fixed, 95% CI) | Totals not selected | |
| 16.1 Mean SpO2 REM (single night) | 1 | Mean Difference (IV, Fixed, 95% CI) | 0.0 [0.0, 0.0] | |
| 16.2 Mean SpO2 NREM (single night) | 1 | Mean Difference (IV, Fixed, 95% CI) | 0.0 [0.0, 0.0] | |
| 16.3 Mean SpO2 for TST (up to 3 months) | 1 | Mean Difference (IV, Fixed, 95% CI) | 0.0 [0.0, 0.0] | |
| 16.4 TST with SpO2 < 90% (up to 3 months) | 1 | Mean Difference (IV, Fixed, 95% CI) | 0.0 [0.0, 0.0] | |
| 17 Nocturnal oxygen saturation (%) | 1 | Mean Difference (Fixed, 95% CI) | Totals not selected | |
| 17.1 Percentage TST SpO2>90% | 1 | Mean Difference (Fixed, 95% CI) | 0.0 [0.0, 0.0] | |
| 17.2 Percentage REM SpO2>90% | 1 | Mean Difference (Fixed, 95% CI) | 0.0 [0.0, 0.0] | |
| 17.3 Percentage NREM SpO2>90% | 1 | Mean Difference (Fixed, 95% CI) | 0.0 [0.0, 0.0] | |
| 18 Nocturnal TcCO2 (mmHg | 2 | Mean Difference (IV, Fixed, 95% CI) | Totals not selected | |
| 18.1 TcCO2 during REM (single night) | 1 | Mean Difference (IV, Fixed, 95% CI) | 0.0 [0.0, 0.0] | |
| 18.2 TcCO2 during NREM (single night) | 1 | Mean Difference (IV, Fixed, 95% CI) | 0.0 [0.0, 0.0] | |
| 18.3 Mean change PtCO2 (mmHg) (up to 3 months) | 1 | Mean Difference (IV, Fixed, 95% CI) | 0.0 [0.0, 0.0] | |
| 18.4 Mean change PaCO2 (mmHg) (up to 3 months) | 1 | Mean Difference (IV, Fixed, 95% CI) | 0.0 [0.0, 0.0] | |
| 19 Nocturnal TcCO2 (mmHg) | 1 | Mean Difference (Fixed, 95% CI) | Totals not selected | |
| 19.1 Mean change TcCO2 NREM to REM (single night) | 1 | Mean Difference (Fixed, 95% CI) | 0.0 [0.0, 0.0] | |
| 19.2 Maximum TcCO2 (single night) | 1 | Mean Difference (Fixed, 95% CI) | 0.0 [0.0, 0.0] | |
| 20 Nocturnal TcCO2 TST (mmHg) | 1 | Mean Difference (IV, Fixed, 95% CI) | Totals not selected | |
| 20.1 Mean PtCO2 TST (up to 3 months) | 1 | Mean Difference (IV, Fixed, 95% CI) | 0.0 [0.0, 0.0] | |
| 20.2 Maximum PtCO2 TST (up to 3 months) | 1 | Mean Difference (IV, Fixed, 95% CI) | 0.0 [0.0, 0.0] | |
| 21 Hypopneas | 1 | Relative rate (Fixed, 95% CI) | Totals not selected | |
| 21.1 Single night | 1 | Relative rate (Fixed, 95% CI) | 0.0 [0.0, 0.0] | |
| 22 Mean heart rate (beats/min) | 1 | Mean Difference (IV, Fixed, 95% CI) | Totals not selected | |
| 22.1 Up to 3 months | 1 | Mean Difference (IV, Fixed, 95% CI) | 0.0 [0.0, 0.0] | |
| 23 Respiratory rate | 1 | Mean Difference (IV, Fixed, 95% CI) | Totals not selected | |
| 23.1 Up to 3 months | 1 | Mean Difference (IV, Fixed, 95% CI) | 0.0 [0.0, 0.0] |
Comparison 3. NIV in overnight ventilation compared to room air.
| Outcome or subgroup title | No. of studies | No. of participants | Statistical method | Effect size |
|---|---|---|---|---|
| 1 CF QoL chest symptom score | 1 | Mean Difference (IV, Fixed, 95% CI) | Totals not selected | |
| 1.1 Up to 3 months | 1 | Mean Difference (IV, Fixed, 95% CI) | 0.0 [0.0, 0.0] | |
| 2 CF QoL traditional dyspnoea index score | 1 | Mean Difference (IV, Fixed, 95% CI) | Totals not selected | |
| 2.1 Up to 3 months | 1 | Mean Difference (IV, Fixed, 95% CI) | 0.0 [0.0, 0.0] | |
| 3 Symptoms of sleep‐disordered breathing | 1 | Mean Difference (IV, Fixed, 95% CI) | Totals not selected | |
| 3.1 Epworth sleepiness scale (up to 3 months) | 1 | Mean Difference (IV, Fixed, 95% CI) | 0.0 [0.0, 0.0] | |
| 3.2 Global PSQI (up to 3 months) | 1 | Mean Difference (IV, Fixed, 95% CI) | 0.0 [0.0, 0.0] | |
| 4 Lung function during sleep | 1 | Mean Difference (Fixed, 95% CI) | Totals not selected | |
| 4.1 VI while awake (single night) | 1 | Mean Difference (Fixed, 95% CI) | 0.0 [0.0, 0.0] | |
| 4.2 VI during REM (single night) | 1 | Mean Difference (Fixed, 95% CI) | 0.0 [0.0, 0.0] | |
| 4.3 VI during NREM (single night) | 1 | Mean Difference (Fixed, 95% CI) | 0.0 [0.0, 0.0] | |
| 4.4 VT while awake (single night) | 1 | Mean Difference (Fixed, 95% CI) | 0.0 [0.0, 0.0] | |
| 4.5 VT during REM (single night) | 1 | Mean Difference (Fixed, 95% CI) | 0.0 [0.0, 0.0] | |
| 4.6 VT during NREM (single night) | 1 | Mean Difference (Fixed, 95% CI) | 0.0 [0.0, 0.0] | |
| 5 Respiratory rate(breaths/min) during sleep | 1 | Mean Difference (Fixed, 95% CI) | Totals not selected | |
| 5.1 RR while awake (single night) | 1 | Mean Difference (Fixed, 95% CI) | 0.0 [0.0, 0.0] | |
| 5.2 RR during REM (single night) | 1 | Mean Difference (Fixed, 95% CI) | 0.0 [0.0, 0.0] | |
| 5.3 RR during NREM (single night) | 1 | Mean Difference (Fixed, 95% CI) | 0.0 [0.0, 0.0] | |
| 6 Mean Respiratory Rate | 1 | Mean Difference (IV, Fixed, 95% CI) | Totals not selected | |
| 6.1 Up to 3 months | 1 | Mean Difference (IV, Fixed, 95% CI) | 0.0 [0.0, 0.0] | |
| 7 Mean Heart Rate (beats/min) | 1 | Mean Difference (IV, Fixed, 95% CI) | Totals not selected | |
| 7.1 Up to 3 months | 1 | Mean Difference (IV, Fixed, 95% CI) | 0.0 [0.0, 0.0] | |
| 8 Lung function while awake | 1 | Mean Difference (IV, Fixed, 95% CI) | Totals not selected | |
| 8.1 FEV1% predicted (up to 3 months) | 1 | Mean Difference (IV, Fixed, 95% CI) | 0.0 [0.0, 0.0] | |
| 8.2 FVC % predicted (up to 3 months) | 1 | Mean Difference (IV, Fixed, 95% CI) | 0.0 [0.0, 0.0] | |
| 9 Arterial blood gases: pH | 1 | Mean Difference (IV, Fixed, 95% CI) | Totals not selected | |
| 9.1 Up to 3 months | 1 | Mean Difference (IV, Fixed, 95% CI) | 0.0 [0.0, 0.0] | |
| 10 Arterial blood gases: PaO2 (mmHg) | 1 | Mean Difference (IV, Fixed, 95% CI) | Totals not selected | |
| 10.1 Up to 3 months | 1 | Mean Difference (IV, Fixed, 95% CI) | 0.0 [0.0, 0.0] | |
| 11 Arterial blood gases: PaCO2 (mmHg) | 1 | Mean Difference (IV, Fixed, 95% CI) | Totals not selected | |
| 11.1 Up to 3 months | 1 | Mean Difference (IV, Fixed, 95% CI) | 0.0 [0.0, 0.0] | |
| 12 Arterial blood gases: HCO3 (mmol/L) | 1 | Mean Difference (IV, Fixed, 95% CI) | Totals not selected | |
| 12.1 Up to 3 months | 1 | Mean Difference (IV, Fixed, 95% CI) | 0.0 [0.0, 0.0] | |
| 13 Arterial blood gases: SaO2 (%) | 1 | Mean Difference (IV, Fixed, 95% CI) | Totals not selected | |
| 13.1 Up to 3 months | 1 | Mean Difference (IV, Fixed, 95% CI) | 0.0 [0.0, 0.0] | |
| 14 Exercise performance (metres) | 1 | Mean Difference (IV, Fixed, 95% CI) | Totals not selected | |
| 14.1 Up to 3 months | 1 | Mean Difference (IV, Fixed, 95% CI) | 0.0 [0.0, 0.0] | |
| 15 Total sleep time (min) | 2 | Mean Difference (IV, Fixed, 95% CI) | Totals not selected | |
| 15.1 Single night | 1 | Mean Difference (IV, Fixed, 95% CI) | 0.0 [0.0, 0.0] | |
| 15.2 Up to 3 months | 1 | Mean Difference (IV, Fixed, 95% CI) | 0.0 [0.0, 0.0] | |
| 16 REM sleep architecture | 2 | Mean Difference (IV, Fixed, 95% CI) | Totals not selected | |
| 16.1 REM (single night) | 1 | Mean Difference (IV, Fixed, 95% CI) | 0.0 [0.0, 0.0] | |
| 16.2 REM %TST (single night) | 1 | Mean Difference (IV, Fixed, 95% CI) | 0.0 [0.0, 0.0] | |
| 16.3 REM % TST (up to 3 months) | 1 | Mean Difference (IV, Fixed, 95% CI) | 0.0 [0.0, 0.0] | |
| 17 Sleep latency | 3 | Mean Difference (IV, Fixed, 95% CI) | Subtotals only | |
| 17.1 Single night | 2 | 38 | Mean Difference (IV, Fixed, 95% CI) | ‐2.63 [‐7.37, 2.11] |
| 17.2 At 6 weeks | 1 | 15 | Mean Difference (IV, Fixed, 95% CI) | ‐3.00 [‐19.88, 13.88] |
| 18 Nocturnal oxygen saturation (%) | 2 | Mean Difference (IV, Fixed, 95% CI) | Totals not selected | |
| 18.1 Mean SpO2 REM (single night) | 1 | Mean Difference (IV, Fixed, 95% CI) | 0.0 [0.0, 0.0] | |
| 18.2 Mean SpO2 NREM (single night) | 1 | Mean Difference (IV, Fixed, 95% CI) | 0.0 [0.0, 0.0] | |
| 18.3 Mean SpO2 for TST (up to 3 months) | 1 | Mean Difference (IV, Fixed, 95% CI) | 0.0 [0.0, 0.0] | |
| 18.4 TST for SpO2 < 90% (up to 3 months) | 1 | Mean Difference (IV, Fixed, 95% CI) | 0.0 [0.0, 0.0] | |
| 19 Nocturnal oxygen saturation (%) | 1 | Mean Difference (Fixed, 95% CI) | Totals not selected | |
| 19.1 Percentage TST SpO2 > 90% (single night) | 1 | Mean Difference (Fixed, 95% CI) | 0.0 [0.0, 0.0] | |
| 19.2 Percentage REM SpO2 > 90% (single night) | 1 | Mean Difference (Fixed, 95% CI) | 0.0 [0.0, 0.0] | |
| 19.3 Percentage NREM SpO2 > 90% (single night) | 1 | Mean Difference (Fixed, 95% CI) | 0.0 [0.0, 0.0] | |
| 20 Nocturnal TcCO2 (mmHg) | 2 | Mean Difference (IV, Fixed, 95% CI) | Totals not selected | |
| 20.1 TcCO2 during REM (single night) | 1 | Mean Difference (IV, Fixed, 95% CI) | 0.0 [0.0, 0.0] | |
| 20.2 TcCO2 during NREM (single night) | 1 | Mean Difference (IV, Fixed, 95% CI) | 0.0 [0.0, 0.0] | |
| 20.3 Mean change PtCO2 (up to 3 months) | 1 | Mean Difference (IV, Fixed, 95% CI) | 0.0 [0.0, 0.0] | |
| 20.4 Mean change PaCO2 (up to 3 months) | 1 | Mean Difference (IV, Fixed, 95% CI) | 0.0 [0.0, 0.0] | |
| 21 Nocturnal TcCO2(mmHg) | 1 | Mean Difference (Fixed, 95% CI) | Totals not selected | |
| 21.1 Mean change TcCO2 NREM to REM (single night) | 1 | Mean Difference (Fixed, 95% CI) | 0.0 [0.0, 0.0] | |
| 21.2 Maximum TcCO2 (single night) | 1 | Mean Difference (Fixed, 95% CI) | 0.0 [0.0, 0.0] | |
| 22 Nocturnal TcCO2 TST (mmHg) | 1 | Mean Difference (IV, Fixed, 95% CI) | Totals not selected | |
| 22.1 Mean PtCO2 TST (up to 3 months) | 1 | Mean Difference (IV, Fixed, 95% CI) | 0.0 [0.0, 0.0] | |
| 22.2 Max PtCO2 TST (up to 3 months) | 1 | Mean Difference (IV, Fixed, 95% CI) | 0.0 [0.0, 0.0] | |
| 23 Hypopneas | 1 | Relative rate (Fixed, 95% CI) | Totals not selected | |
| 23.1 Single night | 1 | Relative rate (Fixed, 95% CI) | 0.0 [0.0, 0.0] |
3.7. Analysis.
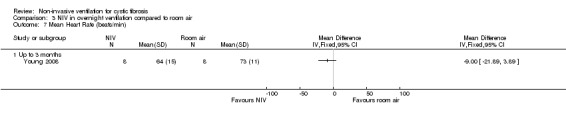
Comparison 3 NIV in overnight ventilation compared to room air, Outcome 7 Mean Heart Rate (beats/min).
Comparison 4. NIV versus no NIV during exercise testing.
| Outcome or subgroup title | No. of studies | No. of participants | Statistical method | Effect size |
|---|---|---|---|---|
| 1 6 minute walk test | 1 | Mean Difference (IV, Fixed, 95% CI) | Totals not selected | |
| 1.1 Up to 1 week | 1 | Mean Difference (IV, Fixed, 95% CI) | 0.0 [0.0, 0.0] |
Characteristics of studies
Characteristics of included studies [ordered by study ID]
Dwyer 2015.
| Methods | RCT. Parallel design. Duration: up to 2 weeks (during hospitalisation for an exacerbation). Location: 2 hospital sites. |
|
| Participants | 40 adults with CF and an acute exacerbation (defined as needing intravenous antibiotics and four or more signs or symptoms from criteria by Fuchs (Fuchs 1994). Moderate to severe disease FEV₁ <60% predicted. NIV group Mean (SD) age: 28 (7) years. Gender n (%): 6 (32) females. BMI mean (SD): 21.4 (3.1) kg/m². FVC mean (SD): 61 (15) % predicted. PImax mean (SD): 87 (32) % predicted. PEmax mean (SD): 70 (22) % predicted. Control group Mean (SD) age: 30 (9) years. Gender n (%): 8 (38) females. BMI mean (SD): 20.4 (3.0) kg/m². FVC mean (SD): 63 (15) % predicted. PImax mean (SD): 93 (30) % predicted. PEmax mean (SD): 92 (41) % predicted. |
|
| Interventions |
Intervention (n = 19): versus standard airway clearance + NIV delivered by a nasal mask or mouthpiece. Control: standard airway clearance. NIV: mean (SD) IPAP 13 cm H₂0 (2); mean (SD) EPAP: 5 cm H₂0 (1). Standard airway clearance = ACBT+ percussions; vibrations; postural drainage; some other techniques were also used for some treatments. |
|
| Outcomes |
Primary outcome measure: change in FEV₁ % predicted from admission to discharge. Secondary outcome measures: visual analogue score; modified shuttle walk test; shortness of breath; sputum volume; energy levels; PImax, PEmax; quality of life (CFQ); quantitative sputum microbiology, length of admission; time to next hospital admission. |
|
| Notes | ||
| Risk of bias | ||
| Bias | Authors' judgement | Support for judgement |
| Random sequence generation (selection bias) | Low risk | "Computer‐generated block randomisation". |
| Allocation concealment (selection bias) | Low risk | Randomisation schedule was "... stored in sealed sequentially numbered opaque envelopes opened after consent signed". |
| Blinding (performance bias and detection bias) All outcomes | High risk | It is not possible to blind participants or assessors to the intervention. |
| Incomplete outcome data (attrition bias) All outcomes | Low risk | All participants accounted for. Three participants withdrew from the study and the data from these participants were used, as available and appropriate, in the analyses of daily rate of improvement, length of stay and time to next hospital admission. |
| Selective reporting (reporting bias) | Low risk | All the outcomes listed in the paper's methodology are the same as those presented in the results section of the full paper. |
| Other bias | Low risk | Methods of statistical analysis were described. |
Fauroux 1999.
| Methods | RCT. Cross‐over design. Duration: single session. |
|
| Participants | 16 participants with CF. Stable participants. Mean (SD) age 13 (4) years. | |
| Interventions |
Session 1: CPT (10 to 15 forced expiration manoeuvres separated by rest periods) and inspiratory PSV via nasal mask using pressure support generator.
Session 2: CPT with no PSV. Sessions 20 minutes each but time between sessions unclear ‐ paper states sessions were conducted on 2 different days at the same time of day by same physiotherapist. |
|
| Outcomes | Lung function (FVC; FEV₁; PEF; FEF25%; FEF50%; FEF25‐75%), airway resistance, SpO₂; RR; PImax; PEmax; sputum weight; subjective participants impressions of fatigue, ease sputum clearance; participant preference (1 = worse to 3 = marked preference). | |
| Notes | ||
| Risk of bias | ||
| Bias | Authors' judgement | Support for judgement |
| Random sequence generation (selection bias) | Unclear risk | States order of intervention was randomised, but no details given. |
| Allocation concealment (selection bias) | Unclear risk | Not discussed. |
| Blinding (performance bias and detection bias) All outcomes | Unclear risk | Participants' subjective impressions were evaluated by individuals who were not involved in the trial and were unaware of the treatment regimen; but it was not reported who was responsible for collecting and weighing secretions and lung function testing. |
| Incomplete outcome data (attrition bias) All outcomes | Low risk | All participants were accounted for. |
| Selective reporting (reporting bias) | Low risk | All outcome measures were reported. |
| Other bias | Low risk | Methods of statistical analysis were described. |
Gozal 1997.
| Methods | RCT. Cross‐over design. Duration: 3 nights within a 15‐day period. |
|
| Participants | Six participants with CF and moderate to severe lung disease and significant gas exchange abnormalities during sleep. Stable participants.
Age mean (SD) [range]: 22.3 (4.7) [13 ‐ 28]. FEV₁% predicted mean (SD): 29.4% (3.4). |
|
| Interventions | Session 1: room air. Session 2: night‐time bilevel NIPPV with supplemental oxygen given via nasal mask. | |
| Outcomes | TST; sleep latency; NREM; NREM %TST; REM min; REM %TST; undetermined % TST; total arousals; arousal index; SaO₂; TcCO₂. | |
| Notes | ||
| Risk of bias | ||
| Bias | Authors' judgement | Support for judgement |
| Random sequence generation (selection bias) | Unclear risk | Stated as randomised, methods not discussed. |
| Allocation concealment (selection bias) | Unclear risk | Not discussed. |
| Blinding (performance bias and detection bias) All outcomes | Unclear risk | Participants were obviously aware of the intervention being administered; however, all were reportedly unaware of the purpose of the trial with participants and sleep technicians blinded to the results until completion of the third night. |
| Incomplete outcome data (attrition bias) All outcomes | Unclear risk | 2 participants dropped out due to non‐tolerance of NIV; it was not explicitly stated that intention‐to‐treat was not used, but results are based on the remaining 6 participants who completed the trial. |
| Selective reporting (reporting bias) | Low risk | All outcome measures were reported. |
| Other bias | Unclear risk | Methods of statistical analysis were described. |
Holland 2003.
| Methods | RCT (order of intervention was randomised on days 3 and 4 of hospital admission). Cross‐over design. Duration: single intervention of each. |
|
| Participants | 26 participants with CF and moderate to severe disease. Acute participants. Mean (SD) age 27.04 (6.42) years. Mean (SD) FEV₁ % predicted 33.85 (11.85). | |
| Interventions |
Session 1: CPT by ACBT i.e. (thoracic expansion x6, breathing control) x2, FET and cough as required. Session 2: ACBT as above with NIV via nasal mask with heated humidification entrained. NIV range: IPAP 10 ‐ 12 cm H₂0; EPAP 4 ‐ 5 cm H₂0. |
|
| Outcomes | FVC; FEV₁; FEF25‐75; PImax; PEmax; SpO₂; sputum weight; Borg breathlessness score; participant preference. | |
| Notes | ||
| Risk of bias | ||
| Bias | Authors' judgement | Support for judgement |
| Random sequence generation (selection bias) | Unclear risk | States order of intervention was randomised, but no details given. |
| Allocation concealment (selection bias) | Unclear risk | Not discussed. |
| Blinding (performance bias and detection bias) All outcomes | Low risk | An independent data collector who was blinded to the treatment order obtained all measurements. |
| Incomplete outcome data (attrition bias) All outcomes | Low risk | Information provided about 1 drop out at the start of testing. |
| Selective reporting (reporting bias) | Low risk | All outcome measures were reported. |
| Other bias | Unclear risk | Methods of statistical analysis were described. |
Kofler 1998.
| Methods | RCT. Cross‐over design. Duration: single sessions on 2 successive days, time between 2 sessions is 1 day. |
|
| Participants | 20 participants with CF. No detail on whether participants are in acute or stable state, but participants have mean (SD) Swachman‐Kowalski score of 80.8 (15.3) indicating that they have mild disease. Mean (range) age 15.25 (6 ‐ 23) years. | |
| Interventions | Session 1: PEP treatment (no details of PEP treatment). Session 2: bilevel positive airway pressure (BiPaP) treatment, type of interface unclear. | |
| Outcomes | FEV₁; FVC; SaO₂; FEF25‐75; MEF50; FEF25‐75; participant preference. | |
| Notes | ||
| Risk of bias | ||
| Bias | Authors' judgement | Support for judgement |
| Random sequence generation (selection bias) | Unclear risk | States order of intervention was randomised, but no details given. |
| Allocation concealment (selection bias) | Unclear risk | Not discussed. |
| Blinding (performance bias and detection bias) All outcomes | Unclear risk | Data collection was not described. |
| Incomplete outcome data (attrition bias) All outcomes | Low risk | All participants were accounted for. |
| Selective reporting (reporting bias) | Unclear risk | Not clear whether all outcomes measured were reported in this abstract. |
| Other bias | Unclear risk | Methods of statistical analysis were not described. |
Lima 2014.
| Methods | RCT. Cross‐over design. Duration: single session, each 24 to 48 hrs apart. |
|
| Participants | 13 participants with CF. Mild, moderate and severe lung disease. Stable state with no history of hospitalisation for respiratory failure in previous 3 months.
Mean age: 10.77 years. Mean FEV₁ % predicted: 62%. Mean BMI: 33.78 kg/m². |
|
| Interventions |
Session 1: 6MWT with (type of interface unclear). Session 2: 6MWT with no NIV. 6MWT speed 2.5 km/h and increased every 30 seconds up to a maximum of 7 km/h. NIV: IPAP 12 cm H₂0; EPAP mean (SD) 6 (2) cm H₂0. |
|
| Outcomes | Walking distance, spirometry (FEV₁, FVC, FEF 25‐75), OEP (TV, MV, Vprc, Vab), RR, HR, SpO₂. OEP and spirometry measured before and 5 min after test. RR, HR and SpO₂ measured immediately before, immediately after and 5 min after test. |
|
| Notes | ||
| Risk of bias | ||
| Bias | Authors' judgement | Support for judgement |
| Random sequence generation (selection bias) | Low risk | Computer‐generated random permutated blocks. |
| Allocation concealment (selection bias) | Unclear risk | Not discussed. |
| Blinding (performance bias and detection bias) All outcomes | High risk | Open trial ‐ no evidence so no blinding of assessors, investigators or participants in the published report. |
| Incomplete outcome data (attrition bias) All outcomes | Low risk | All participants accounted for. |
| Selective reporting (reporting bias) | Low risk | Primary outcomes in protocol were reported. Some indices of secondary outcomes regarding rib cage volume P values reported in the abstract, but not reported within the full text i.e. VRCP, VRCA, and VAB. |
| Other bias | Low risk | Methods of statistical analysis were described. |
Milross 2001.
| Methods | RCT. Cross‐over design. Duration: 3 nights within a 1‐week period, time between nights unclear. |
|
| Participants | 13 participants with CF with severe lung disease.
Mean (SD) age: 26 (5.9) years.
Mean (SD) FEV₁ % predicted: 31.7% (10.6). Awake PaO₂ (range): 53 ‐ 77 mmHg. PaCO₂ ≥ 45 mmHg. BMI mean (SD): 20 (3) kg/m². |
|
| Interventions | Session 1: room air and low‐level CPAP (4 ‐ 5 cm H₂O). Session 2: oxygen (1.4 +/‐ 0.9L/min to maintain SaO₂ ≥ 90%) and low‐level CPAP (4 ‐ 5 cm H₂O) via a nasal mask. Session 3: BVS +/‐ oxygen (0.7+/‐0.9 L/min to maintain SaO₂ ≥ 90%). | |
| Outcomes | VI, VT; RR; respiratory disturbance indices; SaO₂ TcCO₂. | |
| Notes | ||
| Risk of bias | ||
| Bias | Authors' judgement | Support for judgement |
| Random sequence generation (selection bias) | Unclear risk | Stated as randomised, methods not discussed. |
| Allocation concealment (selection bias) | Unclear risk | Not discussed. |
| Blinding (performance bias and detection bias) All outcomes | High risk | No evidence of blinding of assessors, investigators or participants. |
| Incomplete outcome data (attrition bias) All outcomes | Low risk | No drop outs. |
| Selective reporting (reporting bias) | Low risk | All outcome measures were reported. |
| Other bias | Unclear risk | Methods of statistical analysis were described. |
Placidi 2006.
| Methods | RCT. Cross‐over design. Duration: treatment 2x daily for 70 min for 2 days per intervention. |
|
| Participants | 17 participants with CF. Severe lung disease. Acute participants.
Mean (SD) age: 27 (7) years. FEV₁ % predicted mean (SD): 25% (6). BMI mean (SD): 18 (3) kg/m². MIP % predicted mean (SD): 87% (17). Wet weight sputum mean (SD): 5 (5) g. |
|
| Interventions | Intervention 1: directed cough; Intervention 2: PEP via nasal mask. Intervention 3: CPAP via nasal mask; Intervention for NIV with IPAP 8 ‐ 12 cm H₂O; EPAP 4 cm H₂O. | |
| Outcomes | Sputum wet and dry weight; number spontaneous coughs; FEV₁; FVC; FEF; mean SpO₂; participants subjective impression of the effectiveness and fatigue induced by each treatment. | |
| Notes | ||
| Risk of bias | ||
| Bias | Authors' judgement | Support for judgement |
| Random sequence generation (selection bias) | Low risk | Randomisation of treatment order was done according to the Latin square design which provided a balanced assignment to each treatment and a balance in the sequence of treatments. |
| Allocation concealment (selection bias) | Unclear risk | Not discussed. |
| Blinding (performance bias and detection bias) All outcomes | Unclear risk | Physiotherapists collected sputum and the technician was blinded to physiotherapy treatment but it is not identified who was responsible for weighing sputum or collating cough information induced by the treatment. |
| Incomplete outcome data (attrition bias) All outcomes | Unclear risk | All participants were accounted for. |
| Selective reporting (reporting bias) | Low risk | All outcome measures were reported. |
| Other bias | Unclear risk | Methods of statistical analysis were described. |
Rodriguez Hortal 2016.
| Methods | RCT. Parallel design. Duration: both interventions given 2x daily for 60 min for 3 months. |
|
| Participants | 32 participants with CF. Mean (SD) age: 31 (10) years. Moderate to severe lung disease. Baseline FEV₁ % predicted mean (SD) (range): 47% (14) (22% to 69%). Baseline FVC % predicted mean (SD): 69% (13).%. |
|
| Interventions |
Intervention 1: treatment including bronchodilators; AD with HTS for 15 min; then NIV with face mask; FET/huffing from mid to low lung volume.
Intervention 2: treatment including bronchodilators; AD with HTS for 15 min; then PEP with mask; FET/huffing from mid to low lung volume. NIV: IPAP 20 cm H₂O minimum; EPAP 10 cm H₂O. PEP: 10 breaths with 10 to 20 cm H₂O resistance. |
|
| Outcomes | Lung function (FEV₁; FVC; LCI), 6MWT, PaCO₂, sputum culture, inflammatory blood markers. | |
| Notes | ||
| Risk of bias | ||
| Bias | Authors' judgement | Support for judgement |
| Random sequence generation (selection bias) | Unclear risk | States randomised but no further details given. |
| Allocation concealment (selection bias) | Low risk | States opaque envelopes were used to assign to 1 of 2 groups. |
| Blinding (performance bias and detection bias) All outcomes | Low risk | Pulmonary lab technicians blinded to physiotherapy treatment took lung function readings; research nurses blinded to treatment took vital signs; 6MWT was performed by the physiotherapist although it is unclear if the physiotherapist conducting the 6MWT is blinded to treatment allocation. |
| Incomplete outcome data (attrition bias) All outcomes | Low risk | All participants were accounted for. |
| Selective reporting (reporting bias) | Low risk | It is stated that inflammatory blood markers, blood gases and sputum analysis monthly was non‐significant compared to baseline (data not reported); FRC did not change in either group (data not reported). All other outcome measures were reported. |
| Other bias | Low risk | Methods of statistical analysis were reported. |
Young 2008.
| Methods | RCT. Cross‐over design. Duration: each intervention for 6 weeks with 2‐week washout period. |
|
| Participants | 8 participants with CF. Moderate and severe lung disease. No details on whether participants are in acute or stable state.
Mean (SD) age: 37 (8) years. Mean (SD) FEV₁ % predicted: 35% (8). Mean (SD) BM:I 21.1 (2.6) kg/m². Mean (SD) PaCO₂: 52 (4) mmHg. |
|
| Interventions |
Intervention 1: nocturnal air (placebo). Intervention 2: oxygen via nasal or full face mask. Intervention 2: NIV via nasal or full face mask. |
|
| Outcomes | CF‐specific QoL questionnaire; daytime sleepiness; exertional dyspnoea; awake and asleep gas exchange; sleep architecture; lung function; peak exercise capacity. Post‐treatment assessments were carried out during a period of clinical stability i.e. no current need for hospitalisation or intravenous antibiotics. |
|
| Notes | Also measured neurocognitive function (PVT :mean; error; lapse); Stroop Color & Word test; trail‐making test; controlled oral word association and digital span test which were reported in the online supplement. They are not reported in this review as they were not relevant to the aims of this review. | |
| Risk of bias | ||
| Bias | Authors' judgement | Support for judgement |
| Random sequence generation (selection bias) | Low risk | Computer‐generated Latin square design. |
| Allocation concealment (selection bias) | Low risk | Sealed in sequentially numbered opaque envelopes by a person not involved in the trial and opened as each participant was enrolled. |
| Blinding (performance bias and detection bias) All outcomes | Unclear risk | Participants remained blinded as to whether they were receiving oxygen or room air only. |
| Incomplete outcome data (attrition bias) All outcomes | Low risk | One withdrawal after randomisation due to a pneumothorax. One withdrawal from NIV group due to mask discomfort (NIV n = 7; O₂ n = 8). |
| Selective reporting (reporting bias) | Low risk | All outcome measures were reported. |
| Other bias | Low risk | Methods of statistical analysis were described. |
Full abbreviations list can be found in "Additional Tables" (Table 1)
Characteristics of excluded studies [ordered by study ID]
| Study | Reason for exclusion |
|---|---|
| Elkins 2004 | This trial did not compare NIV to increase minute ventilation and is not linked to the outcome measures in this review. |
| Falk 2006 | This trial did not use NIV. |
| Fauroux 2000a | This trial did not compare NIV with other management for acute or chronic respiratory failure. |
| Fauroux 2000b | This trial is not comparing NIV with other management strategies for acute or chronic respiratory failure. |
| Fauroux 2001 | This is not a randomised controlled trial of NIV versus no NIV. |
| Fauroux 2004 | This trial did not compare NIV with other management for acute or chronic respiratory failure. |
| Greenough 2004 | This trial did not use NIV. |
| Parreira 2008 | This trial did not use NIV pressure or volume preset mode. |
| Piper 1992 | This is not a randomised controlled trial. |
| Regnis 1994 | This is not a randomised controlled trial. |
| Riethmueller 2006 | This trial did not use NIV. |
| Serra 2000 | This is not a randomised controlled trial of NIV versus no NIV. |
| Serra 2002 | This is not a randomised controlled trial of NIV versus no NIV. |
see Table 1
Characteristics of studies awaiting assessment [ordered by study ID]
Petrone 2009.
| Methods | Participants divided into 3 random groups. Sleep studies performed on respiratory ward supervised by experienced nurses. Duration: 6 months treatment. |
| Participants | 21 participants. Mean (SD) age: 27.3 (3.7) years. Mean (SD) FEV₁ % predicted: 44.1% (3.10). |
| Interventions |
Group 1: ACBT. Group 2: ACBT with oxygen. Group 3: ACBT with NIV. |
| Outcomes | Frequency of respiratory exacerbations; arterial blood gases; spirometry; SWT; sleep parameters: AHI; mean SaO₂%; % of TST; oxygen desaturation index; SpO₂ mean % of TST; TcCO₂ mean of TST. |
| Notes | This is all the detail which is recorded in the abstract. To be completed once full study details are available. |
see Table 1
Differences between protocol and review
In a post hoc change we have defined short‐term trials as those with a duration less than three months. We decided to analyse single‐night interventions separately from other short‐term trials as we did not feel it appropriate to combine them with other longer trials.
Contributions of authors
The title for the protocol was conceived by the Cochrane Cystic Fibrosis and Genetic Disorders Group.
Both F. Moran and J. Bradley designed and assisted in writing the protocol and the review.
A. Piper has reviewed and contributed to the updated versions of the review.
F. Moran acts as guarantor of the review.
Sources of support
Internal sources
No sources of support supplied
External sources
-
National Institute for Health Research, UK.
This systematic review was supported by the National Institute for Health Research, via Cochrane Infrastructure funding to the Cochrane Cystic Fibrosis and Genetic Disorders Group.
Declarations of interest
Amanda Piper was a clinical consultant to ResMed Australia until 2004. She has also been involved in: educational activities sponsored by manufacturers of bilevel devices (Mayo Healthcare, Australia; Weinmann, Germany; Air Liquide, Australia; ResMed, Australia; Philps Respironics, Australia) and transcutaneous carbon dioxide devices (Sentec, Switzwerland; industry‐sponsored research (ResMed, Australia) and has received equipment for research projects from distributors of bilevel equipment (Air Liquide, Australia; Mayo Healthcare, Australia) as well as a competitive research grant from the ResMed Foundation.
Fidelma Moran and Judy Bradley received a NIPPY3 ventilator for a research clinical trial from Respicare.
New search for studies and content updated (no change to conclusions)
References
References to studies included in this review
Dwyer 2015 {published data only}
- Dwyer TJ, Robbins L, Kelly P, Piper AJ, Bell SC, Bye PT. Non‐invasive ventilation used as an adjunct to airway clearance treatments improves lung function during an acute exacerbation of cystic fibrosis: a randomised trial. Journal of Physiotherapy 2015;61(3):142‐7. [CENTRAL: 1104106; CFGD Register: OV22; CRS: 5500135000001431; PUBMED: 26096013] [DOI] [PubMed] [Google Scholar]
Fauroux 1999 {published data only}
- Fauroux B, Boule M, Escurat G, Pouzet C, Harf A, Isabey D. Chest physiotherapy in cystic fibrosis: improvement of tolerance with nasal pressure support ventilation [abstract]. European Respiratory Journal. Supplement. 1997;10 Suppl 25:79S. [CENTRAL: 382789; CFGD Register: PE103b; CRS: 5500050000000431] [Google Scholar]
- Fauroux B, Boule M, Lofaso F, Zerah F, Clement A, Harf A, et al. Chest physiotherapy in cystic fibrosis: improved tolerance with nasal pressure support ventilation. Pediatrics 1999;103(3):E32. [CFGD Register: PE103a] [DOI] [PubMed] [Google Scholar]
Gozal 1997 {published data only}
- Gozal D. Nocturnal ventilatory support in patients with cystic fibrosis: comparison with supplemental oxygen. European Respiratory Journal 1997;10(9):1999‐2003. [CFGD jRegister: OV10] [DOI] [PubMed] [Google Scholar]
Holland 2003 {published data only}
- Holland A, Denehey L, Ntoumenopoulos G, Wilson J. Non‐invasive ventilation prevents inspiratory muscle fatigue and oxygen desaturation during airway clearance in adults with exacerbations of cystic fibrosis [abstract]. Proceedings of the American Thoracic Society 99th International Conference; 2003 May 16‐21; Seattle; USA. 2003:D041. [CFGD Register: PE143b]
- Holland A, Denehy L, Ntoumenopoulos G, McMeeken J, Wilson J. Non‐invasive ventilation prevents inspiratory muscle fatigue and oxygen desaturation during airway clearance in adults with acute exacerbations of cystic fibrosis [abstract]. Proceedings of the Thoracic Society of Australia & New Zealand Annual Scientific Meeting; 2003 April 4‐9; Adelaide, Australia. 2003:Abst #P140. [CFGD Register: PE143d]
- Holland A, Denehy L, Ntoumenopoulos G, Naughton M, Wilson J. Non‐invasive ventilation prevents inspiratory muscle fatigue and oxygen desaturation during airway clearance in adults with acute exacerbations of cystic fibrosis [abstract]. Journal of Cystic Fibrosis 2003;2(Suppl 1):S62. [CFGD Register: PE143a] [Google Scholar]
- Holland A, Denehy L, Ntoumenopoulos G, Naughton M, et al. Non‐invasive ventilation preserves inspiratory muscle strength and prevents oxygen desaturation during airway clearance in adults with exacerbations of cystic fibrosis [abstract]. Australian Journal of Physiotherapy 2004;50(3):A6. [CENTRAL: 547610; CFGD Register: PE143e; CRS: 5500050000000411] [Google Scholar]
- Holland AE, Denehy L, Ntoumenopoulos G, Naughton MT, Wilson JW. Non‐invasive ventilation assists chest physiotherapy in adults with acute exacerbations of cystic fibrosis. Thorax 2003;58(10):880‐4. [CFGD Register: PE143c] [DOI] [PMC free article] [PubMed] [Google Scholar]
Kofler 1998 {published data only}
- Kofler AM, Carlesi A, Cutrera R, Leone P, Lucidi V, Rosati S, et al. BiPAP versus PEP as chest physiotherapy in patients with cystic fibrosis [abstract]. Pediatric Pulmonology 1998;26(Suppl 17):344. [CFGD Register: PE95] [Google Scholar]
Lima 2014 {published data only}
- Lima C, Andrade AD, Rattes C, Campos S, Brandao D, Aliverti A, et al. Effect of noninvasive ventilation on functional exercise capacity, lung function and compartmental chest wall volume in children with cystic fibrosis. European Respiratory Journal 2013;42 Suppl 57:P5065. [CENTRAL: 1099891; CFGD Register: PE216b ; CRS: 5500050000000267; EMBASE: 71843506] [Google Scholar]
- Lima CA, Andrade ADFD, Campos SL, Brandao DC, Fregonezi G, Mourato IP, et al. Effects of noninvasive ventilation on treadmill 6‐min walk distance and regional chest wall volumes in cystic fibrosis: randomized controlled trial. Respiratory Medicine 2014;108(10):1460‐8. [CENTRAL: 1022461; CFGD Register: PE216a; CRS: 5500050000000162; EMBASE: 2014860248] [DOI] [PubMed] [Google Scholar]
Milross 2001 {published and unpublished data}
- Milross MA, Piper AJ, Norman M, Becker HF, Willson GN, Grunstein RR, et al. Low‐flow oxygen and bilevel ventilatory support. American Journal of Respiratory and Critical Care Medicine 2001;163(1):129‐34. [CFGD Register: OV8b] [DOI] [PubMed] [Google Scholar]
- Milross MA, Piper AJ, Norman M, Willson GN, Becker HF, Grunstein RR, et al. The effects of low flow oxygen and bilevel ventilatory support on gas exchange and ventilation during sleep in patients with cystic fibrosis [abstract]. Pediatric Pulmonology 1999;28(Suppl 19):285. [CFGD Register: OV8a] [Google Scholar]
Placidi 2006 {published data only}
- Placidi G, Cornacchia M, Cappelletti LM, Mastella G, Assale BM, Braggion C. Short‐term effects of positive airway pressure on sputum clearance by directed coughing: a cross‐over randomized study [abstract]. Pediatric Pulmonology 2001;32(Suppl 22):313. [CFGD Register: PE128a] [Google Scholar]
- Placidi G, Cornacchia M, Polese G, Zanolla L, Assael B, Braggion C. Chest physiotherapy with positive airway pressure: a pilot study of short‐term effects on sputum clearance in patients with cystic fibrosis and severe airway obstruction. Respiratory Care 2006;51(10):1145‐53. [CFGD Register: PE128b] [PubMed] [Google Scholar]
Rodriguez Hortal 2016 {published data only}
- Rodriguez Hortal MC, Hjelte L. Non invasive ventilation as airway clearance technique compared to PEP in adult patients with cystic fibrosis [abstract]. Journal of Cystic Fibrosis 2013;12 Suppl 1:S18, Abstract no: WS9.4. [CENTRAL: 875000; CFGD Register: PE203a; CRS: 5500100000011654] [Google Scholar]
- Rodriguez Hortal MC, Nygren‐Bonnier M, Hjelte L. Non‐invasive ventilation as airway clearance technique in cystic fibrosis. Physiotherapy Research International 2016 Feb 29 [Epub ahead of print]. [CFGD Register: PE203b; DOI: 10.1002/pri.1667] [DOI] [PubMed]
Young 2008 {published data only}
- Young AC, Wilson JW, Kotsimbos TC, Naughton MT. Online Data Supplement to 'Randomised placebo controlled trial of non‐invasive ventilation for hypercapnia in cystic fibrosis' [online]. Thorax 2008;63(1):72‐7 online. [CFGD Register: OV19c] [DOI] [PubMed] [Google Scholar]
- Young AC, Wilson JW, Kotsimbos TC, Naughton MT. Randomised placebo controlled trial of non‐invasive ventilation for hypercapnia in cystic fibrosis. Thorax 2008;63(1):72‐7. [CFGD Register: OV19b] [DOI] [PubMed] [Google Scholar]
- Young AC, Wilson JW, Kotsimbos TC, Naughton MT. Randomized placebo‐controlled trial of non‐invasive ventilation for hypercapnia in cystic fibrosis [abstract]. Proceedings of the Japanese Society of Sleep Research Conference. 2006:A9‐10. [CFGD Register: OV19a] [DOI] [PubMed]
References to studies excluded from this review
Elkins 2004 {published data only}
- Elkins MR, Eberl S, Alsion J, Bye P. The effect of bi‐level non‐invasive ventilation on mucociliary clearance in subjects with cystic fibrosis [abstract].. Pediatric Pulmonology. 2004; Vol. 38(Suppl 27):315. [CFGD Register: OV20]
Falk 2006 {published data only}
- Falk B, Nini A, Zigel L, Yahav Y, Aviram M, Rivlin J, et al. Effect of low altitude at the Dead Sea on exercise capacity and cardiopulmonary response to exercise in cystic fibrosis patients with moderate to severe lung disease. Pediatric Pulmonology 2006;41(3):234‐41. [CFGD Register: OV13] [DOI] [PubMed] [Google Scholar]
Fauroux 2000a {published data only}
- Fauroux B, Itti E, Pigeot J, Isabey D, Meignan M, Ferry G, et al. Optimization of aerosol deposition by pressure support in children with cystic fibrosis: an experimental and clinical study. American Journal of Respiratory and Critical Care Medicine 2000;162(6):2265‐71. [CFGD Register: DT21] [DOI] [PubMed] [Google Scholar]
Fauroux 2000b {published data only}
- Faurox B, Pigeot J, Isabey D, Harf A, Clèment A, Lofaso F. Two modes of non invasive mechanical ventilation can decrease the work of breathing in cystic fibrosis children with an acute exacerbation. European Respiratory Journal 2000;16(Suppl 31):15s. [CENTRAL: 415631; CFGD Register: OV23; CRS: 5500050000000270] [Google Scholar]
Fauroux 2001 {published data only}
- Fauroux B, Pigeot J, Isabey D, Clement A, Lofaso F. In vivo physiologic comparison of two ventilators used for domiciliary ventilation in children with cystic fibrosis. Critical Care Medicine 2001;29(11):2097‐105. [CFGD Register: PH137] [DOI] [PubMed] [Google Scholar]
Fauroux 2004 {published data only}
- Fauroux B, Louis B, Essouri S, Leroux K, Lofaso F. Back up rate during non invasive mechanical ventilation in cystic fibrosis [abstract]. European Respiratory Journal 2003;22(Suppl 45):262s. [CFGD Register: PH157b] [Google Scholar]
- Fauroux B, Louis B, Hart N, Essouri S, Leroux K, Clement A, et al. The effect of back‐up rate during non‐invasive ventilation in young patients with cystic fibrosis. Intensive Care Medicine 2004;30(4):673‐81. [CFGD Register: PH157a] [DOI] [PubMed] [Google Scholar]
Greenough 2004 {published data only}
- Greenough A, Limb E, Marlow N, Peacock JL, Calvert S. Radiological outcome of very prematurely born infants randomised to high frequency oscillatory or conventional ventilation. European Journal of Pediatrics 2004;163(11):671‐4. [DOI] [PubMed] [Google Scholar]
Parreira 2008 {published data only}
- Parreira V, Pires S, Sulmonett N, Camargos P, Haddad J, Britto R. Positive expiratory pressure and lung function in cystic fibrosis patients [abstract]. Proceedings of the European Respiratory Society Annual Congress; 2008 Oct 4‐8; Berlin, Germany.. 2008:E1779. [CENTRAL: 679902; CFGD Register: PE212; CRS: 5500050000000051]
Piper 1992 {published data only}
- Piper AJ, Parker S, Torzillo PJ, Sullivan CE, Bye PTP. Nocturnal nasal IPPV stabilizes patients with cystic fibrosis and hypercapnic respiratory failure. Chest 1992;102(3):846‐50. [DOI] [PubMed] [Google Scholar]
Regnis 1994 {published data only}
- Regnis JA, Piper AJ, Henke KG, Parker S, Bye PTP, Sullivan CE. Benefits of nocturnal nasal CPAP in patients with cystic fibrosis. Chest 1994;106(6):1717‐24. [DOI] [PubMed] [Google Scholar]
Riethmueller 2006 {published data only}
- Riethmueller J, Borth‐Bruhns T, Kumpf M, Vonthein R, Wiskirchen J, Stern M, et al. Recombinant human deoxyribonuclease shortens ventilation time in young, mechanically ventilated children.. Pediatric Pulmonology 2006;41(1):61‐6. [CFGD Register: BD125] [DOI] [PubMed] [Google Scholar]
Serra 2000 {published data only}
- Serra A, Appendini L, Braggion C, Mastella G, Rossi A, Polese G. Noninvasive proportional assist ventilation (PAV) and pressure support ventilation (PSV) in patients with cystic fibrosis (CF): an overnight study [abstract]. American Journal of Respiratory and Critical Care Medicine 2000;161(Suppl 3):A555. [CFGD Register: OV16] [Google Scholar]
Serra 2002 {published data only}
- Serra A, Polese G, Braggion C, Rossi A. Non‐invasive proportional assist and pressure support ventilation in patients with cystic fibrosis and chronic respiratory failure. Thorax 2002;51(7):50‐4. [CFGD Register: OV15] [DOI] [PMC free article] [PubMed] [Google Scholar]
References to studies awaiting assessment
Petrone 2009 {published data only}
- Petrone A, Quartieri M, Tirone F, Tirone C, Mauro GF. Management of patients with cystic fibrosis: Role of non invasive ventilation (NIV) and chest physiotherapy [abstract]. Proceedings of European Respiratory Society Annual Congress; 2010 Sep 18‐22; Barcelona, Spain. 2010:[E3907]. [CENTRAL: 777469; CFGD Register: PE220b; CRS: 5500050000000268]
- Petrone A, Quartieri M, Tolisano A, Tirone C, Tirone F. Non invasive ventilation (NIV) assists chest physiotherapy for treatment of patients with cystic fibrosis [abstract]. Proceedings of the European Respiratory Society Annual Congress; 2009 Sep 12‐16; Vienna, Austria. 2009:[P1262]. [CENTRAL: 758852; CFGD Register: PE220a ; CRS: 5500050000000269]
Additional references
Ballard 1996
- Ballard RD, Sutarik JM, Clover CW, Suh BY. Effects of non‐REM sleep on ventilation and respiratory mechanics in adults with cystic fibrosis. American Journal of Respiratory and Critical Care Medicine 1996;153(1):266‐71. [DOI] [PubMed] [Google Scholar]
Bott 2009
- Bott J, Blumenthal S, Buxton M, Ellum S, Falconer C, Garrod R, et al. Guidelines for the physiotherapy management of the adult, medical spontaneously breathing patient. Thorax 2009;64(Suppl 1):i1‐i51. [DOI] [PubMed] [Google Scholar]
Curtin 2002
- Curtin F, Altman DG, Elbourne D. Meta‐analysis combining parallel and cross over trials. Statistics in Medicine 2002;21(15):2131‐44. [DOI] [PubMed] [Google Scholar]
Davidson 2016
- Davidson C, Banham S, Elliott M, Kennedy D, Gelder C, Glossop A, et al. Ventilatory Management of Acute Hypercapnic Respiratory Failure Guideline. Thorax 2016;71 Suppl 2:ii1–ii35. [DOI: 10.1136/thoraxjnl-2015-208209] [DOI] [PubMed] [Google Scholar]
Elbourne 2002
- Elbourne DR, Altman DG, Higgins JPT, Curtin F, Worthington HV, Vail A. Meta‐analyses involving cross‐over trials: methodological issues. International Epidemiological Association 2002;31(1):140‐9. [DOI] [PubMed] [Google Scholar]
Fuchs 1994
- Fuchs HJ, Borowitz DS, Christiansen DH, Morris EM, Nash ML, Ramsey BW, et al. Effect of aerosolized recombinant human DNase on exacerbations of respiratory symptoms and on pulmonary function in patients with cystic fibrosis. The Pulmozyme Study Group. New England Journal of Medicine 1994;331(10):637‐42. [DOI] [PubMed] [Google Scholar]
Higgins 2003
- Higgins JPT, Thompson SG, Deeks JJ, Altman DG. Measuring inconsistency in meta‐analyses. BMJ 2003;327(7414):557‐60. [DOI] [PMC free article] [PubMed] [Google Scholar]
Hodson 1991
- Hodson ME, Madden BP, Steven MH, Tsang VT, Yacoub MH. Non‐invasive mechanical ventilation for CF patients ‐ a potential bridge to transplantation. European Respiratory Journal 1991;4(5):524‐7. [PubMed] [Google Scholar]
Jüni 2001
- Jüni P, Altman DG, Egger M. Assessing the quality of controlled clinical trials. BMJ 2001;323(7303):42‐6. [DOI] [PMC free article] [PubMed] [Google Scholar]
RevMan 2014 [Computer program]
- The Nordic Cochrane Centre, The Cochrane Collaboration. Review Manager (RevMan). Version Version 5.3. Copenhagen: The Nordic Cochrane Centre, The Cochrane Collaboration, 2014.
Stata 2001 [Computer program]
- Stata Corporation. Stata. Statistical Software. Version 7.0. College Station, Texas: Stata Corporation, 2001.
UK CF Trust 2011
- UK CF Trust. Standards for the clinical care of children and adults with CF in the UK 2011. www.cysticfibrosis.org.uk/the‐work‐we‐do/clinical‐care/consensus‐documents (accessed 07 July 2016).
Yankaskas 1999
- Yankaskas JR, Egan TM, Mauro MA. Major Complications. In: Yankaskas JR, Knowles MR editor(s). Cystic Fibrosis in Adults. Philadelphia: Lippincott‐Raven, 1999:175‐94. [Google Scholar]
Zinman 1989
- Zinman R, Corey M, Coates AL, Canny GJ, Connolly J, Levison H, et al. Nocturnal home oxygen in the treatment of hypoxaemic cystic fibrosis patients. Journal of Pediatrics 1989;114(3):368‐77. [DOI] [PubMed] [Google Scholar]
References to other published versions of this review
Moran 2003
- Moran F, Bradley J. Non‐invasive ventilation for cystic fibrosis. Cochrane Database of Systematic Reviews 2003, Issue 2. [DOI: 10.1002/14651858.CD002769.pub2] [DOI] [PubMed] [Google Scholar]
Moran 2007
- Moran F, Bradley JM, Jones AP, PiperAJ. Non‐invasive ventilation for cystic fibrosis. Cochrane Database of Systematic Reviews 2007, Issue 10. [DOI: 10.1002/14651858.CD002769.pub2] [DOI] [PubMed] [Google Scholar]
Moran 2011
- Moran F, Bradley J, Piper AJ. Non‐invasive ventilation for cystic fibrosis. Cochrane Database of Systematic Reviews 2011, Issue 5. [DOI: 10.1002/14651858.CD002769.pub3] [DOI] [Google Scholar]
Moran 2013
- Moran F, Bradley JM, Piper AJ. Non‐invasive ventilation for cystic fibrosis. Cochrane Database of Systematic Reviews 2013, Issue 4. [DOI: 10.1002/14651858.CD002769.pub4] [DOI] [PubMed] [Google Scholar]