Abstract
A general trait of living cells is their ability to exert contractile stresses on their surroundings and thus respond to substrate rigidity. At the cellular scale, this response affects cell shape, polarity and ultimately migration. The regulation of cell shape together with rigidity sensing remains largely unknown. In this article, we show that both substrate rigidity and cell shape contribute to drive actin organization and cell polarity. Increasing substrate rigidity affects bulk properties of the actin cytoskeleton by favoring long-lived actin stress fibers with increased nematic interactions whereas cell shape imposes a local alignment of actin fibers at the cell periphery.
Cell polarity, or the asymmetric organization of cellular components, is essential for tissue development and function [1–3]. Notably, polarized cell migration is fundamental in tissue morphogenesis, wound healing, and in pathological states such as cancer [4, 5]. One of the main drivers of front-rear polarity of a migrating cell is the symmetry breaking and polarization of the actin cytoskeleton [6–9]. This process depends on the mechanical properties of the surrounding extracellular matrix (ECM) and the orientation of adhesion complexes and traction forces [7, 10–12]. On stiff substrates, cells adopt polarized shapes and nematic ordering of the actin cytoskeleton with stable stress fibers coupled directly to focal adhesions (FAs) [11, 13, 14]. However on softer substrates, cells are circular in shape and the actin cytoskeleton is highly dynamic as fibers aligned along the cell boundary flow towards the cell center [11, 13]. Previously, we had proposed a coarse-grained description of this change in actin cytoskeleton organization under the framework of active gel theory as a transition from an isotropic to a nematic phase induced by substrate stiffness [13]. However, the coupling to cell shape remains largely unexplored, even though FA dynamics and traction forces, which are critically controlled by ECM stiffness [10, 15, 16], have been suggested to play an important role in defining cell shape [17, 18]. Thus there appears to be interplay between cell shape and actin organization that varies as a function of substrate stiffness. In this article, we analyze the respective role of cell shape and substrate stiffness on actin ordering, and show that they both contribute to drive cell polarity.
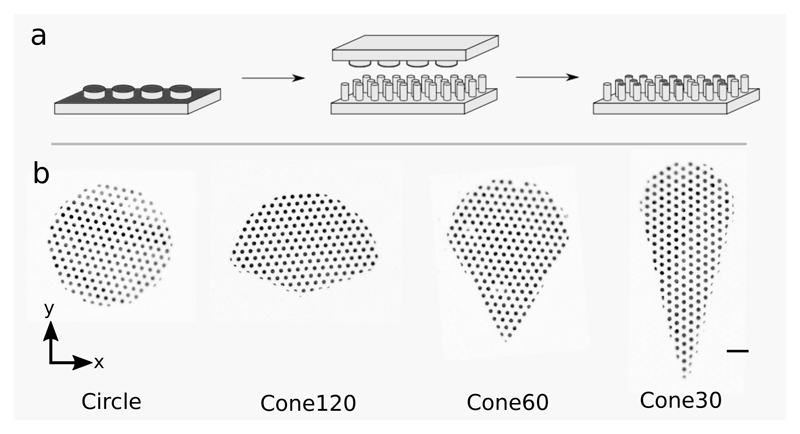
In order to determine if cell shape, actin polarization, and substrate stiffness are related, we used micro-contact printing to confine rat embryonic fibroblast cells (REF52) into fibronectin-coated adhesive regions of defined shapes on micropillar substrates as described previously [19] (Fig. 1(a) and Methods). The use of micropillar substrates enabled us to precisely control the stiffness and measure cellular traction forces; substrates of stiffness 9, 38 and 85 nN μm−1 were used to mimic soft, intermediately stiff, and very stiff ECM, respectively [13]. We used shapes of the same area (≈ 3000 μm2) that appear like ice-cream cones with varying apex angles to mimic front-rear polarized states of the cells [6, 7] (Fig. 1(b) and Methods). The shapes were named circle, cone120, cone60 and cone30, where numbers refer to the apex angle for conical shapes in degrees.
Fig. 1. Patterned printing of cell adhesion protein on micropillars.
(a) Schematic showing micro-contact printing of cell adhesion protein (fibronectin) in patterns. (b) Fluorescence images of micropillar tops with fibronectin patterned in different shapes with area ≈ 3000 μm2. Scale bar, 10 μm.
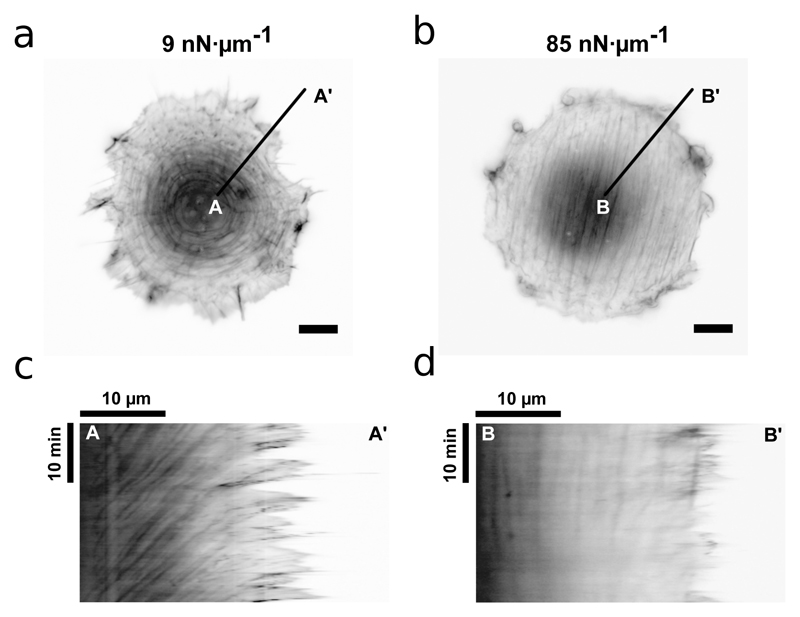
We first examined the dynamics of the actin cytoskeleton. If the actin filaments flow freely within the cell, they would be unable to engage with, and anchor, to the substrate through FAs [20]. This would prevent FA-mediated signaling, as well as prevent stabilization and polarization of the cytoskeleton. Previously, we had observed that the actin cytoskeleton is fluid-like on soft substrates (9 nN μm−1) and solid-like on stiff substrates (85 nN μm−1), which was interpreted as an increase of the characteristic viscoelastic time scale of the actin cytoskeleton with rigidity; however, elongated cells on soft substrates were not fluid-like [13]. Thus, we imaged live cells adhered in the circular pattern on 9 nN μm−1 and 85 nN μm−1 substrates to decouple the effects of substrate stiffness and cell shape on actin cytoskeleton fluidity [21]. Similar to our previous observations, we found that the circular cells on 9 nN μm−1 substrates exhibited an orthoradial organization of actin cytoskeleton, whereby the transverse fibers flowed centripetally from the cell boundary towards cell center (Fig. 2(a and c)). The flow was observed both at the cell boundary and inside the cell bulk. In contrast, circular cells on 85 nN μm−1 substrate had well-aligned stress fibers that showed no flow in the cell bulk (Fig. 2(b and d)) and only short-range flows along the cell boundary due to classical retrograde flow driven by cellular protrusions [22]. These observations show that a soft substrate is necessary for the fluidity of the cytoskeleton for circular cell shapes. Thus, our previously observed transition of actin cytoskeleton from fluid-like to solid-like behavior and the consequent cell polarity would be primarily dependent on the substrate stiffness.
Fig. 2. Actin cytoskeleton fluidity depends on ECM stiffness and not cell shape.
(a and b) Live-cell image of REF52 cell on soft (9 nN μm−1) and stiff (85 nN μm−1) substrates respectively. The cells were transfected with tdTomato-Ftractin to label actin filaments and were cultured on circular shapes. Scale bars, 10 μm. (c and d) Kymographs along lines AA′ and BB′ in (a) and (b) respectively. The cells were imaged every 10 s for 30 min.
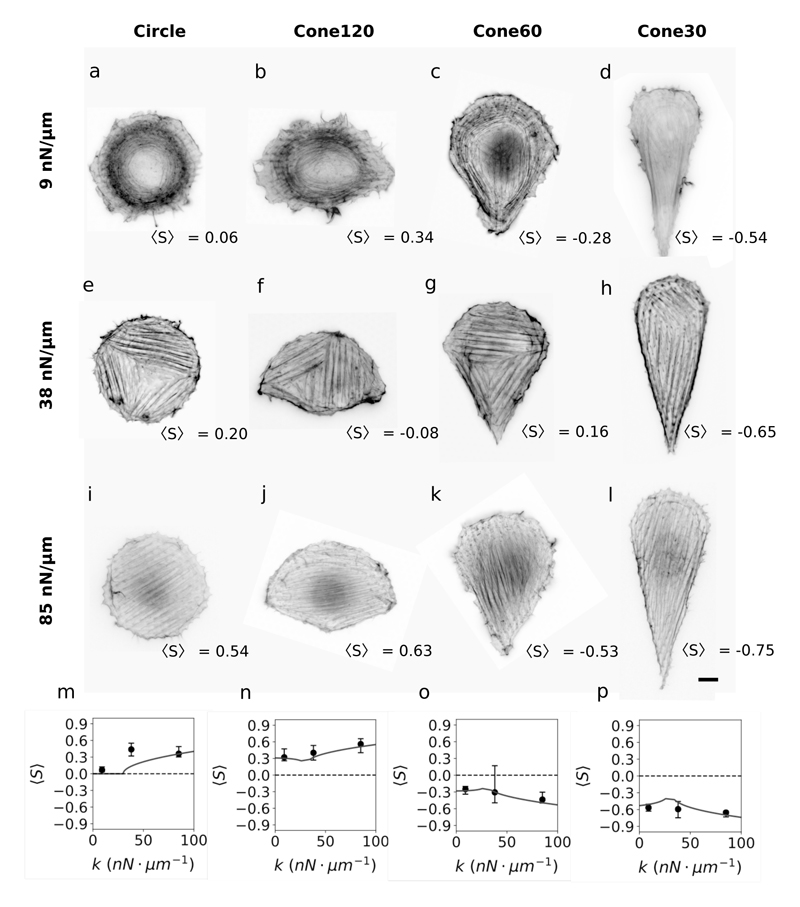
We next stained actin filaments to analyze the organization of the cytoskeleton on different shapes and stiffnesses. We calculated cell-averaged nematic order paramenter 〈S〉 = 〈cos 2θ〉, weighted by filament intensity, where θ is the filament angle from x-axis (x-axis definition in Fig. 1 b). Our definition of 〈S〉 here with fixed reference axis leads to 〈S〉 > 0 for x-axis alignment and 〈S〉 < 0 for y-axis alignment; this differs from the classical definition that leads to 〈S〉 > 0 irrespective of alignment. Note that cells in circle patterns were rotated such that 〈θ〉 = 0. Also, although individual actin filaments are polar in nature, stress fibers, which are bundles of anti-parallel actin filaments, are apolar in nature and thus undergo nematic ordering.
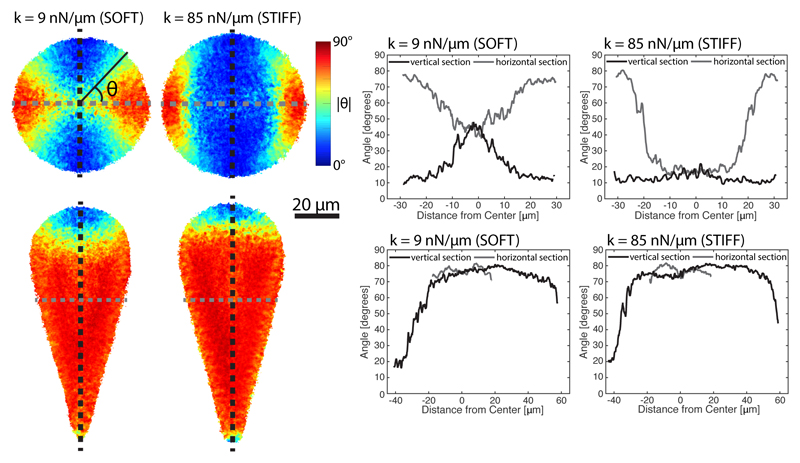
We found that on 9 nN μm−1 substrates there were no thick bundles of actin filaments for all cell shapes (Fig. 3(a-d)). We observed only thin bundles which were excluded from the bulk (center) of the cell body and mostly aligned along the cell boundaries, irrespective of cell shape (Fig. 4). On intermediately stiff 38 nN μm−1 substrates, we observed stress fibers that were aligned in locally well-ordered domains for all cell shapes (Fig. 3(e-h)). The stress fiber micro-domains preferentially aligned with the nearest straight cell boundary; thus actin cytoskeleton was ordered at the sub-cellular scale but not at the cellular scale. This lead to overall larger values of |〈S〉|, however, with important cell-to-cell variability due to fluctuations in numbers and shapes of domains. On 85 nN μm−1 substrates, the stress fibers were mostly aligned in the bulk irrespective of boundary (Fig. 3(i-l) and Fig. 4), leading to larger values of |〈S〉| on all shapes. Generally, for a given cell shape |〈S〉| increased on stiffer substrates, and for a given stiffness |〈S〉| increased on more polarized shapes. Although we had shown previously as well that actin filaments increasingly align in the cell bulk with increasing ECM stiffness [13], our current observations show that this increase in bulk alignment does not depend on the cell shape. Thus, we concluded that the cell boundary acts as an anchor for the filaments close to it, while the ECM stiffness influences the alignment of actin filaments in the bulk of the cell.
Fig. 3. Actin cytoskeleton organization depends on ECM stiffness and cell shape.
(a-l) Representative fluorescence images of actin filaments inside cells of different shapes and adhered on micropillar substrates with stiffness as indicated. Scale bar, 10 μm. (m-p) Order parameter, 〈S〉, of actin cytoskeleton for cells adhered on different substrate stiffness (9, 38 and 85 nN μm−1) and in different shapes (circle, cone120, cone60, and cone30 respectively). Each data point represents median values obtained from 24-86 cells. Error bar ends represent first and third quartiles of the data. Theoretical fits were obtained from Eq. 7 using k* = 30 nN μm−1 [13], m was calculated as 0, 0.17, -0.14 and -0.62 using Eqs. 5 and 6. were the only parameters required to fit all experimental data (R2 = 0.73); was only used to remove divergence at k = k*. The 95% confidence intervals for the degree of influence of stiffness a and for the degree of influence of shape b are 1.66 < a < 2.97 and 0.42 < b < 0.72.
Fig. 4. Median actin distributions on soft and stiff patterns.
Left: maps showing the median angle of actin with respect to the horizontal axis for soft (left) and stiff (right) circles (top) and 30 degree cones (bottom). For circles, the cells are rotated such that the median angle of actin is in the vertical direction, while cells on cones are rotated based on the shape of the pattern. Right: linescans along the corresponding angle maps in the vertical (black) and horizontal (gray) directions (also shown overlayed on angle maps). The median angle of actin is more likely to be aligned with the nearest boundary on soft patterns than on stiff patterns, which results in more orthoradial actin cables on soft circles and more polarized actin in the conical shape. In round regions of the patterns, the influence of the cell boundary decays more quickly on stiff patterns.
In order to quantify the relative roles of ECM stiffness and cell shape on the polarization of actin cytoskeleton, we modeled the cytoskeleton as a 2D anisotropic gel. The orientational ordering of stress fibers comprising the cytoskeleton is measured by the (traceless) nematic order parameter Qij = 2S (ninj – δij/2), where S is the order parameter amplitude and ni is the director. S and ni are local quantities, averaged over a small area that contains many filaments; the measurable order parameter 〈S〉 can then be obtained by averaging over the cell. Following experimental results that suggest a transition from non-polarized to polarized cells as stiffness increases, we assume that, at the cell scale, the cytoskeleton is close to the isotropic-nematic (I-N) transition [13], thus making both S and Q small. Despite the non-equilibrium nature of the problem, we assume that actin ordering can be obtained from the minimization of an effective energy functional, where (i) ECM stiffness affects the bulk contribution, as found in [13] and (ii) cell shape (anisotropy) enters through boundary terms. This approach may be justified since we are interested in steady-states for which the energy minimization reflects balance of torques on the nematic degrees of freedom. Activity might enter phenomenologically in this approach, but understanding how so is beyond the present scope.
More explicitly, in two dimensions the bulk nematic energy is given generically by the Landau-De Gennes expression:
| (1) |
where γ, ω > 0, and λ > 0 are constants, and integration is performed over the cell area. In the isotropic phase, γ > 0, while in the nematic, γ < 0. Previously, we had found that γ decreases with ECM stiffness [13]. By analogy with lyotropic nematics [13, 23], this was argued to be a consequence of the dependence of γ on density and the active, densifying response of the cytoskeleton to substrate stiffness [13]. We next add to this bulk energy the contribution of a boundary term, which can be written on general grounds:
| (2) |
where N is the unit normal to the cell boundary curve and dl is the infinitesimal arclength along the cell contour. The anchoring strength w > 0 favors anchoring of fibers parallel to the boundary (planar anchoring), while w < 0 favors normal anchoring. In the isotropic phase, the boundary term favors a finite value S0 of the order parameter, which decays away from the cell edge over the correlation length [24]. For convenience, in a finite cellular system of typical size L, we introduce ξ = min(ξ0, L).
To study the competition between bulk and boundary energies, we develop a mean field analysis of the model and average S over a thin rectangular region, of width dl and depth L (cell scale). We assume that the boundary value is S0, which for the moment is unspecified, and that S decays to its bulk value Sb inside the cell (with Sb = 0 in the I phase and in the N phase):
| (3) |
where ~ means here lowest order in γ. Then, averaging over the cell contour, we obtain where 〈S0〉 is the contour average of S0. Similarly, we obtain with Q0 the boundary value of the order parameter tensor (the bulk value, of order |γ|1/2 in the N phase, is neglected). As a result, the mean field energy (per unit area) is given by
| (4) |
where
| (5) |
is a purely geometric quantity that describes the cell shape and acts as an aligning field on 〈Q〉. The mean field values of 〈S〉 and 〈Q〉 are then found by minimizing ℱ. We note that the principal axes of 〈Q〉 coincide with those of while also corresponding to the cell symmetry axes. Finally, 〈Q〉 only couples to the traceless part of denoted M. In the diagonal basis x,y (Fig. 1) these tensors can be written as:
| (6) |
With this convention, 〈S〉 > 0 indicates alignment along x, and 〈S〉 < 0 along y. Finally, minimizing ℱ yields
| (7) |
where [13], which explicitly determines 〈S〉. Here, k is the substrate stiffness and k* its critical value at which the I-N occurs. If the cytoskeleton is away from I-N (γ ≠ 0) in the isotropic phase, then
| (8) |
Thus, 〈S〉 increases with increasing cell anisotropy (m) and increasing substrate stiffness (translating into lower γ).
The above analysis qualitatively accounts for our results presented in Fig. 3(a-l). Using Eqs. 5 and 6, the cell anisotropy m was calculated as 0, 0.17, −0.14 and −0.62 for the shapes circle, cone120, cone60 and cone30 respectively; positive values indicate that the major axis of the shape is along the x-axis, while negative values indicate the y-axis. We first note that, as predicted, actin filament alignment follows the major axis of the cell shape imposed by the pattern, as shown in Fig. 3(a-l), which indicates that the cell shape anisotropy pre-determines the direction of actin filament alignment. Second, from Eq. 7, we found that the anchoring strength w is positive, which implies planar anchoring at the cell boundary, as is observed. Third, our theoretical values for 〈S〉, as obtained from Eq. 7, fit well with the experimental data, and reproduce the increase of the order parameter with substrate stiffness and shape anisotropy. Last, we note that the analogy of this theoretical approach with the classical Landau theory of second order phase transitions makes it possible to quantify the relative importance of boundary and bulk contributions to ordering. The response to shape anisotropy can be quantified by the susceptibility which decreases with increasing stiffness in the N phase, as observed experimentally (Fig. 4). Finally, both our experimental data and theoretical results indicate that both cell boundary shape (or, cell anisotropy, m) and ECM stiffness (k) cooperatively regulate actin cytoskeleton alignment and polarity.
Last, we discuss the implications of our results on the force patterns exerted by the cells on their substrate. Tensional homeostasis within cells, or cellular traction forces, is critical for cell migration and has been implicated in maintaining cell polarity [18, 25]. It has been shown that traction forces depend on several factors including cell shape, substrate stiffness, actin cytoskeleton organization, and FA morphology [10, 13, 18, 26]. However, cell shape and substrate stiffness are usually coupled and so far it has been difficult to disentangle their relative effects; our approach allowed to do so.
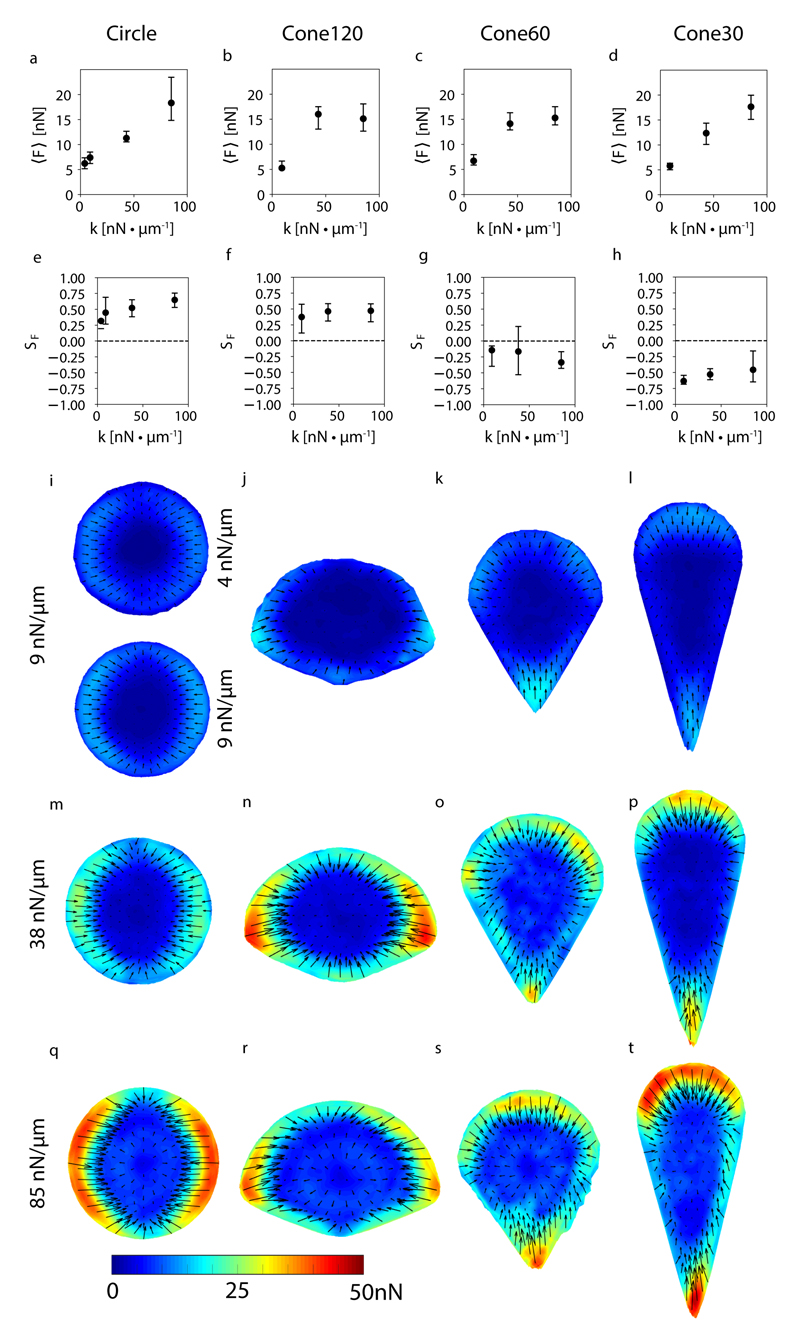
We found that the average force per micropillar was not influenced by the cell shape, rather it depended on the substrate stiffness. The force per pillar increased from around 5 nN to 15-20 nN as the substrate stiffness increased from 9 nN μm−1 to 85 nN μm−1 for all the 4 shapes (Fig. 5(a-d)). This substrate stiffness dependent increase in forces is consistent with the hypothesized dependence of γ, and therefore F-actin density, on stiffness. In turn, the order parameter of the force vectors, SF, showed an increase from the soft to stiff substrates for all shapes except cone30 (Fig. 5(e-h), Methods), which presents a sharp tip and thus may induce strong alignment even on soft substrate (as seen in Fig. 3(d)). The lower SF on stiff cone30 could be due to higher force measurement noise. Overall, our results show a good correlation between the actin filaments organization and the spatial distribution of the traction forces, as confirmed by the average force maps (Fig. 5(i-t)), and indicate that the intensity of traction forces is controlled by substrate stiffness, while both cell shape and substrate stiffness impact spatial force patterns.
Fig. 5. Cellular traction forces depend on substrate stiffness.
(a-d) Average traction forces, 〈F〉, applied by cells with the shapes circle, cone30, cone60 and cone120, and adhered to micropillar substrates of stiffness 4 (circle only), 9, 38 and 85 nN μm−1. (e-h) Order parameter of force vectors SF. (i-t) Average spatial distribution of traction force vectors. Arrows represent force vectors and colors represent force magnitudes in nN. (a-t) Data was obtained from 14 to 73 live cells for each condition. (a-h) Each data point represents median values and error bar ends represent first and third quartiles of the data.
Finally, our analysis shows quantitatively that both substrate rigidity and cell shape contribute to drive actin organization and cell polarity. While increasing substrate rigidity affects bulk properties of the actin cytoskeleton by favoring long-lived actin stress fibers with increased nematic interactions, cell shape imposes a local alignment of actin fibers to cell edges, and yields a purely geometric contribution to actin organization. While both substrate rigidity and cell shape can cooperatively enhance actin ordering for strongly anisotropic shapes, isotropic shapes decrease actin ordering by imposing conflicting constraints on actin fiber alignment along the cell boundary. This behavior is well captured by a phenomenological model of the actin cytoskeleton, where bulk ordering, characterized by an I-N transition controlled by surface stiffness, and planar anchoring at cell edges, which is shown to act as a purely geometric aligning field, both contribute to drive actin organisation at the cell scale.
Methods
Micropillar fabrication and functionalization
The micropillar substrates were prepared as described previously [13, 19]. Briefly, silicon wafers were used to cast polydimethylsiloxane (PDMS; Sylgard 184, Dow Corning) into micropillars of 2 μm diameter, with heights 3–9 m, resulting in substrate stiffnesses of 9 nN μm−1 to 85 nN μm−1. PDMS (1:10 cross-linker to base polymer ratio) was consistently cured at 80°C for 2 h to obtain a Young’s Modulus E = 2 MPa. The dimensions of the micropillars were obtained from scanning electron microscope images. The micropillar tops were coated with fluorescent dye-conjugated fibronectin (ATTO647N, Sigma-Aldrich) using microcontact printing technique—PDMS stamps with extruded shape patterns (Fig. 6) were inked with 50 μg ml−1 fibronectin and 5 μg ml−1 dye-conjugated fibronectin; the stamps were then dried and placed on ultraviolet/ozone-treated micropillar substrates for 5 min. The substrates were then immersed in 0.2% Pluronics-F127 solution for 1 h to prevent cell adhesion to the micropillar sides, and then rinsed with PBS. PBS was then exchanged with cell culture medium to culture the cells.
Fig. 6. Dimensions of the different shapes used.
Cell culture and staining
Rat embryonic fibroblast (REF52) cells, stably expressing YFP-Paxilin, were maintained at 37 °C in a humidified atmosphere of 5% CO2 and 95% air in Dulbecco’s modified Eagle medium (DMEM) containing 10% fetal bovine serum, 100 U/ml penicillin, 100 μg ml−1 streptomycin and 100 μg ml−1 glutamine. For live-cell observations of actin cytoskeleton, the cells were transfected with tdTomato-Ftractin using electroporation (Nucleofactor, Lonza) to label actin filaments. Cells on micropillar substrates were fixed 3–4 h after seeding. Cells were fixed for 10 min at room temperature using 4% formaldehyde (PFA) in PBS, permeabilized using 0.1% Triton-X for 5 min, blocked for 1 h with 1% BSA in PBS and rinsed with PBS. Filamentous actin was stained with 10mg ml−1 Phalloidin-TRITC (Sigma-Aldrich) for 20 min.
Imaging
Fluorescent live-cell and fixed-cell images were obtained using an Olympus IX81 inverted epifluorescence microscope equipped with an Olympus UPLSAPO 60x W/1.2 NA objective, a CoolSNAP EZ CCD camera (Photometrics), an X-Cite ® 120Q fluorescence lamp (Excelitas Technologies), and temperature and CO2 controller (Life Imaging Sciences). Leibovitz’s L-15 cell culture media (Life Technologies) supplemented with 10% fetal bovine serum and 1% penicilin/streptomycin was used for live-cell imaging to minimize background. Live-cell imaging was done in an upside-down configuration as described previously [13, 19]. Live cells were imaged 3-7 hours after seeding.
Order parameter calculation
The order parameter of the actin cytoskeleton is calculated as previously described [13] using a custom-built MATLAB program. Briefly, the local orientation of actin at each pixel is calculated from the local structure tensor of the phalloidin image (Peter Kovesi, https://www.peterkovesi.com/matlabfns/citesite.html). The order parameter for each cell is calculated as 〈S〉 = 〈cos 2θ〉, where θ is angle with the horizontal and averaging is weighted by the fluorescence intensity of the image. Circular patterns are rotated so that 〈θ〉 = 0.
The order parameter of forces was calculated similarly as 〈SF〉 = 〈cos 2θ〉, where θ is angle with the horizontal and averaging is weighted by the magnitude of the force vector.
Traction force measurements
Live-cell imaging was used to obtain images of deflected micropllars. Traction forces are calculated from micropillar deflections as previously described [13, 19] using a custom-built MATLAB program. Briefly, pillar centroids are determined by calculating the center of mass of the pillars following a cross-correlation with the expected point spread function of a pillar. Brightfield images are used to determine the orientation and spacing of the undeformed reference lattice of pillars around the cell, and then this reference lattice is mapped onto fluorescent fibronectin images to determine pillar deflection magnitudes. Forces are calculated by multiplying the pillar deflection with the pillar spring constant. Pillars which are half-stamped by fibronectin or collapsed induce artefacts in and thus are manually removed. The mean force is calculated using all pillars located underneath the cell. The order parameter of the traction force angles is calculated as 〈SF〉 = 〈cos 2θ〉, where averaging of both θ and SF are weighted on pillar deflection magnitude. Force maps are generated by interpolating the forces on each pillar and then averaging over all cells in the dataset. Prior to averaging circular shapes, the cells are rotated such that the average angle of the traction force is aligned in the vertical direction; for conical shapes the cells are rotated such that the shape is the same.
Acknowledgments
The authors would like to thank Jacques Prost, Chwee Teck Lim and Bibhu Sarangi and the group members from Institut Jacques Monod and Mechanobiology Institute for helpful discussions. Also, the authors thank Gianluca Grenci, Felix Margadant and the microfabrication core at Mechanobiology Institute. This work was supported by the European Research Council (Grants No. CoG-617233), LABEX ”Who Am I?”, Agence Nationale de la Recherche (ANR) ”POLCAM” (ANR-17-CE13-0013), USPC-NUS program, and the Mechanobiology Institute.
M.G. and B.L.D. contributed equally to this work.
References
- [1].Campanale JP, Sun TY, Montell DJ. J Cell Sci. 2017;130:1201. doi: 10.1242/jcs.188599. [DOI] [PMC free article] [PubMed] [Google Scholar]
- [2].Grill SW, Gönczy P, Stelzer EHK, Hyman AA. Nature. 2001;409:630. doi: 10.1038/35054572. [DOI] [PubMed] [Google Scholar]
- [3].Heisenberg C-P, Bellaïche Y. Cell. 2013;153:948. doi: 10.1016/j.cell.2013.05.008. [DOI] [PubMed] [Google Scholar]
- [4].Haas P, Gilmour D. Developmental Cell. 2006;10:673. doi: 10.1016/j.devcel.2006.02.019. [DOI] [PubMed] [Google Scholar]
- [5].Franz CM, Jones GE, Ridley AJ. Developmental Cell. 2002;2:153. doi: 10.1016/s1534-5807(02)00120-x. [DOI] [PubMed] [Google Scholar]
- [6].Jiang X, Bruzewicz DA, Wong AP, Piel M, Whitesides GM. PNAS. 2005;102:975. doi: 10.1073/pnas.0408954102. [DOI] [PMC free article] [PubMed] [Google Scholar]
- [7].Théry M, Racine V, Piel M, Pépin A, Dimitrov A, Chen Y, Sibarita J-B, Bornens M. Proc Natl Acad Sci USA. 2006;103:19771. doi: 10.1073/pnas.0609267103. [DOI] [PMC free article] [PubMed] [Google Scholar]
- [8].Tojkander S, Gateva G, Lappalainen P. J Cell Sci. 2012;125:1855. doi: 10.1242/jcs.098087. [DOI] [PubMed] [Google Scholar]
- [9].Ladoux B, Mège R-M, Trepat X. Trends in Cell Biology. 2016 doi: 10.1016/j.tcb.2016.02.002. 0. [DOI] [PMC free article] [PubMed] [Google Scholar]
- [10].Trichet L, Le Digabel J, Hawkins RJ, Vedula SRK, Gupta M, Ribrault C, Hersen P, Voituriez R, Ladoux B. Proc Natl Acad Sci USA. 2012;109:6933. doi: 10.1073/pnas.1117810109. [DOI] [PMC free article] [PubMed] [Google Scholar]
- [11].Prager-Khoutorsky M, Lichtenstein A, Krishnan R, Rajendran K, Mayo A, Kam Z, Geiger B, Bershadsky AD. Nat Cell Biol. 2011;13:1457. doi: 10.1038/ncb2370. [DOI] [PubMed] [Google Scholar]
- [12].Dalby MJ, Riehle MO, Johnstone H, Affrossman S, Curtis ASG. Biomaterials. 2002;23:2945. doi: 10.1016/s0142-9612(01)00424-0. [DOI] [PubMed] [Google Scholar]
- [13].Gupta M, Sarangi BR, Deschamps J, Nemat-bakhsh Y, Callan-Jones A, Margadant F, Mège R-M, Lim T, Voituriez R, Ladoux B. Nat Commun. 2015;6:7525. doi: 10.1038/ncomms8525. [DOI] [PMC free article] [PubMed] [Google Scholar]
- [14].Sarangi BR, Gupta M, Doss BL, Tissot N, Lam F, Mège R-M, Borghi N, Ladoux B. Nano Lett. 2017;17:399. doi: 10.1021/acs.nanolett.6b04364. [DOI] [PMC free article] [PubMed] [Google Scholar]
- [15].Elosegui-Artola A, Oria R, Chen Y, Kosmalska A, Pérez-González C, Castro N, Zhu C, Trepat X, Roca-Cusachs P. Nat Cell Biol. 2016;18:540. doi: 10.1038/ncb3336. [DOI] [PubMed] [Google Scholar]
- [16].Legant WR, Miller JS, Blakely BL, Cohen DM, Genin GM, Chen CS. Nat Meth. 2010;7:969. doi: 10.1038/nmeth.1531. [DOI] [PMC free article] [PubMed] [Google Scholar]
- [17].Han SJ, Bielawski KS, Ting LH, Rodriguez ML, Sniadecki NJ. Biophys J. 2012;103:640. doi: 10.1016/j.bpj.2012.07.023. [DOI] [PMC free article] [PubMed] [Google Scholar]
- [18].Oakes PW, Gardel ML. Current Opinion in Cell Biology Cell adhesion and migration. 2014;30:68. doi: 10.1016/j.ceb.2014.06.003. [DOI] [PMC free article] [PubMed] [Google Scholar]
- [19].Gupta M, Kocgozlu L, Sarangi BR, Margadant F, Ashraf M, Ladoux B. Methods Cell Biol. 2015;125:289. doi: 10.1016/bs.mcb.2014.10.009. [DOI] [PubMed] [Google Scholar]
- [20].Case LB, Waterman CM. Nat Cell Biol. 2015;17:955. doi: 10.1038/ncb3191. [DOI] [PMC free article] [PubMed] [Google Scholar]
- [21].“See supplemental material at [url] for a video showing actin cytoskeleton fluidity.”
- [22].Theriot JA, Mitchison TJ. Nature. 1991;352:126. doi: 10.1038/352126a0. [DOI] [PubMed] [Google Scholar]
- [23].de Gennes PD, Prost J. The Physics of Liquid Crystals. Oxford Univ Press; 1995. [Google Scholar]
- [24].Skačej G, Alexe-Ionescu AL, Barbero G, Žumer S. Phys Rev E. 1998;57:1780. doi: 10.1103/physreve.60.628. [DOI] [PubMed] [Google Scholar]
- [25].Gupton SL, Waterman-Storer CM. Cell. 2006;125:1361. doi: 10.1016/j.cell.2006.05.029. [DOI] [PubMed] [Google Scholar]
- [26].Balaban NQ, Schwarz US, Riveline D, Goichberg P, Tzur G, Sabanay I, Mahalu D, Safran S, Bershadsky A, Addadi L, Geiger B. Nat Cell Biol. 2001;3:466. doi: 10.1038/35074532. [DOI] [PubMed] [Google Scholar]


