

SUMMARY
Lung alveolar type I cells (AT1) and alveolar type II cells (AT2) regulate the structural integrity and function of alveoli. AT1, covering ~95% of the surface area, are responsible for gas exchange, whereas AT2 serve multiple functions, including alveolar repair through proliferation and differentiation into AT1. However, the signaling mechanisms for alveolar repair remain unclear. Here, we demonstrate, in Pseudomonas aeruginosa-induced acute lung injury in mice, that non-canonical Notch ligand Dlk1 (delta-like 1 homolog) is essential for AT2-to-AT1 differentiation. Notch signaling was activated in AT2 at the onset of repair but later suppressed by Dlk1. Deletion of Dlk1 in AT2 induced persistent Notch activation, resulting in stalled transition to AT1 and accumulation of an intermediate cell population that expressed low levels of both AT1 and AT2 markers. Thus, Dlk1 expression leads to precisely timed inhibition of Notch signaling and activates AT2-to-AT1 differentiation, leading to alveolar repair.
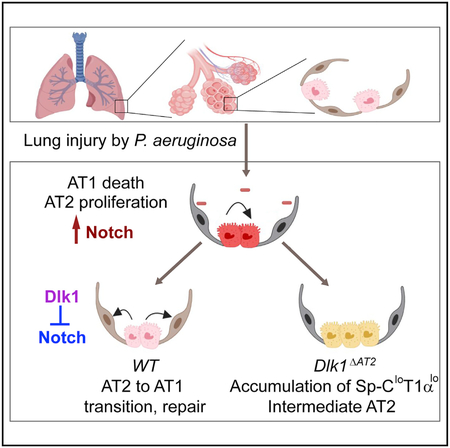
Graphical Abstract
In Brief
Finn et al. show that Notch signaling is activated in type II cells after alveolar injury but that subsequent Dlk1-mediated inhibition of Notch is required for complete type II-to-type I cell transition and alveolar repair. Thus, Dlk1 and Notch are potential therapeutic targets for treatment of lung injury.
INTRODUCTION
Repair of the injured lung alveolar epithelial barrier is essential for restoration of gas exchange in patients with pneumonia-induced acute lung Injury (ALI), acute respiratory distress syndrome (ARDS), and other types of alveolar injury (Matthay et al., 2012); however, the signaling mechanisms of restoration of the epithelial integrity and kinetics of the repair response remain unknown. Lung alveoli are lined with alveolar type I cells (AT1) and alveolar type II cells (AT2). AT1 have a flattened squamous shape, cover ~95% of the alveolar surface area, and are essential for the lung’s gas exchange function (Schneeberger, 1997). Injury of these cells caused by pathogens and release of inflammatory mediators is life-threatening in diseases such as pneumonia (Matthay et al., 2012). AT2 are cuboidal and occupy 5% of the alveolar surface area despite being similar in number to AT1 (Crapo et al., 1982; Mason, 2006). AT2 also have multiple functions, such as production of surfactant and contributing to the lung’s defense against infection (Mason, 2006). In addition, AT2 function as facultative stem cells to repair the damaged epithelium (Barkauskas et al., 2013; Desai et al., 2014; Evans et al., 1975). This function is based on their capacity for self-renewal and differentiation to AT1 (Barkauskas et al., 2013; Desai et al., 2014; Evans et al., 1975).
Notch signaling has a critical role in regulating cell fate determination, proliferation, and differentiation during development and tissue regeneration (Liu et al., 2010). In the embryonic lung, Notch signaling mediates the differentiation of neuroendocrine, secretory, and ciliated cells as well as generation of AT1 and AT2 cells (Guseh et al., 2009; Rock et al., 2011b; Tsao et al., 2016). In the adult, Notch is involved in repair and regeneration of several airway cells types, such as basal cells (Rock et al., 2011b), club cells (Xing et al., 2012), and a population of lineage-negative epithelial progenitor (LNEP) cells (Vaughan et al., 2015). However, the role of Notch in AT2-mediated alveolar epithelial repair has yet to be explored. Notch signaling in mammals occurs through 4 receptor isoforms, Notch 1 through 4 (Kopan and Ilagan, 2009). These single-pass transmembrane receptors are activated by delta-like canonical Notch ligand Dll1, 3, and 4 and Jagged 1 and 2 through interaction with the extracellular epidermal growth factor (EGF)-like repeats (Kopan and Ilagan, 2009). Receptor-ligand binding induces Notch cleavage events, resulting in release of the Notch intracellular domain (NICD) (D’Souza et al., 2010) and its nuclear translocation and association with the DNA binding protein RBP-J (recombination signal binding protein for immunoglobin Jκ, also known as CBF1 and CSL). This is followed by recruitment of Mastermind-like (MAML) and histone acetyltransferase p300, forming the transcriptional co-activator complex (Kopan and Ilagan, 2009). Target genes of Notch signaling include the Hes (hairy and enhancer of split) and Hey (hairy/enhancer-of-split related with YRPW motif) transcription factors (Kopan and Ilagan, 2009).
As AT2 go through sequential proliferative and transition steps to repair alveoli (Liu et al., 2015), we studied the kinetics of alveolar epithelial injury and repair responses induced by Pseudomonas aeruginosa (PA) pneumonia in mice and addressed the role of Notch signaling in regulating AT2-to-AT1 transition. We showed that the non-canonical Notch ligand Dlk1 (delta-like homolog 1, also known as preadipocyte factor 1 and fetal antigen 1; Falix et al., 2012; Smas and Sul, 1993) was upregulated post-injury and induced the inactivation of Notch signaling and that it was, in turn, required for AT2-to-AT1 transition and repair of the alveolar epithelium.
RESULTS
Temporal Relationship of AT2-to-AT1 Transition to Dlk1 Expression and Notch Activation
We investigated the role of Dlk1 in regulating AT2-mediated alveolar repair based on microarray analysis of gene expression upregulation in AT2 during the repair phase after PA-induced lung injury (Liu et al., 2015), which showed that Dlk1 may be a candidate regulator of progenitor cell properties of AT2. Studies were conducted using freshly isolated AT2 (Figures S1A and S1B) cultured on gelatin-coated plates with DMEM supplemented with 10% serum. This culture condition induced AT2 transition into AT1-like cells that took on a squamous cell morphology (Figures 1A and 1B; Dobbs, 1990; Liu et al., 2015; Qiao et al., 2008). In the process, the cells gained expression of the AT1 markers T1α (podoplanin), HopX (HOP homeobox), RAGE (or Ager, for advanced glycosylation end product-specific receptor), and Aqp5 (aquaporin 5) (Jain et al., 2015; Ramirez et al., 2003; Yang et al., 2016) while losing expression of the AT2 marker Sp-C (Liu et al., 2015; Whitsett et al., 2010). Cell lysates collected daily over 7 days were analyzed. We found reduced AT2-specific Sp-C mRNA within a day and expression of the cell proliferation gene CDC25C (Liu et al., 2011) on day 3, whereas Aqp5 mRNA expression steadily increased over 7 days (Figure 1C). We also found, interestingly, that Dlk1 mRNA expression peaked on day 3 and decreased by day 7 (Figure 1C).
Figure 1. Dlk1 Expression and Notch Activation during AT2-to-AT1 Transition in Culture.

(A and B) Freshly isolated AT2 (A) acquire AT1-like morphology within 7 days in culture (B). Scale bar, 50 μm.
(C) mRNA expression of the AT2 marker Sp-C, the AT1 marker Aqp5, the proliferation marker CDC25C, and Dlk1 over the course of 7 days in culture. Data are presented as relative mRNA levels compared with expression of each gene at baseline. Mean ± SE, n = 3–5. **p < 0.01 (3-day CDC25C versus baseline CDC25C), ***p < 0.001 (3-day Dlk1 versus baseline Dlk1), ****p < 0.0001 (7-day Aqp5 versus baseline Aqp5).
(D) Schematic of the Notch reporter mouse. Expression of the fluorescent protein Venus is controlled by cleaved NICD-CBF1 binding to tandem CBF1 binding sites.
(E) AT2 isolated from the Notch reporter mouse were cultured and stained for Sp-C and the AT1 marker T1α. Cells lost Sp-C and gained T1α expression upon converting into AT1-like cells. Notch reporter Venus was expressed at intermediate stages of transition and absent in a cell expressing a high level of T1α and a low level of Sp-C at 96 h of culture. Scale bar, 20 μm.
See also Figure S1.
Because Dlk1 is a non-canonical ligand of Notch receptors (Falix et al., 2012), we investigated whether Notch activity (as Dlk1 expression) was also temporally altered during the AT2-to-AT1 transition. Here we used the transgenic Notch reporter mouse line Notch-Venus (Figure 1D; Nowotschin et al., 2013); these mice expressed the H2B-Venus fluorescent fusion protein under the control of the SV40 promoter, which is preceded by 4 tandem binding sites for the transcriptional repressor CBF1 (Nowotschin et al., 2013). Thus, upon Notch activation, the cleaved intracellular NICD binds CBF1, recruits MAML to form the transcriptional co-activator complex (Kopan and Ilagan, 2009), and induces expression of the nuclearly localized H2B-Venus fusion protein (Figure 1D). In sections of uninjured Notch-Venus lungs, most AT1 and AT2 were negative for Venus (Figures S1C and S1D). However, when AT2 were isolated from Notch-Venus mice and cultured, we observed an increased number of Venus-positive cells at 48 and 72 h in culture compared with baseline (Figure 1E; Figures S1E and S1F). The cells also concurrently lost expression of the AT2 marker Sp-C by 48–72 h, whereas expression of the AT1 marker T1α started to increase (Figures 1C and 1E). By h, some cells had transitioned into AT1-like cells, as evidenced by expression of the AT1 marker T1α, while losing the Venus signal (Figure 1E). By 8–9 days in culture, most cells differentiated into AT1-like cells and showed little Venus signal (data not shown). Thus, the peak Venus intensity, indicative of Notch activity, corresponded to the early transition phase from AT2 to AT1, when the cells expressed both the AT2 marker Sp-C and the AT1 marker T1α (Figure 1E, 48 h). These results indicate that Notch signaling was transiently activated during AT2-to-AT1 transition at 48 h and decreased to baseline upon completing the transition. Thus, we observed a close temporal relationship between increased Dlk1 expression and switch in Notch signaling and the transition from AT2 to AT1.
Coupling of Dlk1 Expression and Notch Signaling in AT2 during the Early Repair Phase after PA-Induced Lung Injury
To study the time course of Dlk1 expression and Notch signaling in AT2 in vivo, studies were performed in mice challenged via intratracheal (i.t.) injection of PA, which is known to induce severe alveolar injury (Figure 2A; Liu et al., 2011; Suresh Kumar et al., 2014). The time course of the injury-repair-resolution phases of this injury model is reflected in the relative cell density (cell numbers versus area of lung sections) at different time points after induction of injury (Figure 2B). Consistent with our previous results (Liu et al., 2011, 2015), PA induced severe alveolar epithelial injury within 24 to 48 h, accompanied by neutrophilic influx, which contributed to the high cellularity at 48–72 h (Figure 2B). The early repair phase beginning at ~72 h is characterized by proliferation of AT2 (Liu et al., 2011, 2015). Resolution of inflammatory injury began 4–5 days post-injury, as indicated by the reduced cell number in the lungs (Figure 2B). Recovery in this model is dependent on the conversion of AT2 to AT1 and is largely completed by 7 days post injury (Liu et al., 2011, 2015).
Figure 2. Activation of Notch Signaling in AT2 at Onset of Alveolar Epithelial Repair after PA-Induced Lung Injury.

(A) Lung injury was induced by intratracheal (i.t.) injection of PA bacteria.
(B) DAPI staining of lung sections prepared at different stages after i.t. injection of PA. Cell density was calculated as the number of DAPI-positive cells versus the area of lung tissue. The relative cell density of each time point compared with the control was plotted. The relative cell density corresponds to different phases (inflammation, early and later repair) during the injury repair process. (C–H) AT2 were isolated from uninjured and 3-day post-injury mice and processed for qRT-PCR for expression of Dlk1 (C), Notch 1 (D), Notch 2 (E), Jagged 1 (F), Hes1 (G), and NRAPP (H).
(I) Tomato+ AT2 were isolated by flow-sorting from SPC-Tomato mice for western blot analysis. The intensities of the western blot bands were quantified using ImageJ. The data show an increased level of NICD in AT2 isolated from 3-day post-injury mice compared with uninjured mice when normalized to the β-actin loading control.
Bar graph data are presented as mean ± SE; n ≥ 3. *p < 0.05, **p < 0.01. See also Figure S2.
To study whether expression of the Dlk1 and Notch signaling genes correlates with AT2-mediated repair, we isolated AT2 from wild-type (WT) C57BL/6 mice during the early repair phase (3 days after PA injection) for qRT-PCR analysis. We found increased expression of Dlk1 as well as the Notch receptors Notch 1 and Notch 2 and the Notch ligand Jagged 1 compared with AT2 isolated from control non-PA-treated mice (Figures 2C–2F). Transcripts of the Notch pathway target genes Hes1 (Kopan and Ilagan, 2009) and NRARP (Lamar et al., 2001) were also increased 72 h post-injury (Figures 2G and 2H). The expression of other Notch receptors and ligands (Notch3, Notch4, Dll1, and Dll4; Kopan and Ilagan, 2009), however, did not increase at this time (Figure S2). The expression of Deltex, which is involved in Notch receptor trafficking and down-regulation of Notch signaling (Kopan and Ilagan, 2009), was decreased 3 days after PA injury (Figure S2). These data strongly suggest that Notch signaling is involved in the AT2-mediated repair process.
To further validate temporal Notch signaling activation in AT2 during repair, we used the AT2 lineage-tracing mouse line SpC-CreER/Rosa-Tomato (SPC-Tomato) (Chen et al., 2017). AT2 were further purified by fluorescence-activated cell sorting (FACS) after the standard AT2 isolation procedure (referred to as Tomato+ AT2) from uninjured control and 72 h post-PA mice and analyzed by western blotting for the cleaved NICD, an indicator of Notch 1 activation (Schroeter et al., 1998). Here we found NICD levels to be significantly increased after PA injury (Figure 2I). Thus, Notch signaling is temporally activated in AT2 at the beginning of the repair phase, 72 h post-PA injury.
Dlk1 Mutation in AT2 Cells Occludes Their Differentiation into AT1
Next, to investigate the causal role of the temporally increased Dlk1 expression in AT2 in mediating AT2-to-AT1 transition, we made an inducible AT2-specific Dlk1 conditional knockout mouse line, Dlk1ΔAT2 (Figure 3A). These mice were generated by crossing mice expressing tamoxifen (Tam)-inducible Cre under the control of the AT2 cell-specific promoter SpC (SpC-CreER) (Rock et al., 2011a) with Dlk1flox, which has loxP sites flanking exons 5 and 6 of Dlk1; exons 5 and 6 account for 77% of full-length Dlk1 protein, including 4 of 6 extracellular EGF repeats and the transmembrane domain. The Dlk1flox line was used to generate the Dlk1null allele (Appelbe et al., 2013). Little functional Dlk1 is expected to be produced in Cre-expressing AT2 cells after treatment of Dlk1ΔAT2 mice with Tam (Liu et al., 2015). To trace the fate of mutant cells, we also introduced the lineage-tracing allele ROSA-Tomato (or ROSA-YFP) (Figure 3A). In these SpC-CreER/Rosa-Tomato/Dlk flox mice, Cre expressed by SpC-CreER disrupts Dlk1 and also deletes the stop codon in the ROSA-tomato locus, allowing the Cre-expressing AT2 and their progeny to be labeled with the fluorescent protein tdTomato (Tomato) (or YFP when this reporter was used in lieu). The gene encoding Dlk1 is located in the imprinted Dlk1-Dio3 gene cluster and expressed paternally because of differential methylation (Schmidt et al., 2000). We used Dlk1flox males to cross with SpC-CreER mice. Analysis of lung sections from these mice showed the Tam dependence of Tomato in AT2, with 80% of the cells labeled (Figure S3); this recombination frequency is consistent with previous reports (Barkauskas et al., 2013; Liu et al., 2015). Furthermore, we analyzed genomic DNA isolated from Tam-treated WT and mutant AT2 and found that the methylation of Dlk1 in the mutant (with the maternal allele only) is significantly reduced compared with the WT (Figure S3F). This result indicates that little Dlk1 will be produced in the mutant AT2 (Schmidt et al., 2000). We used Dlk1ΔAT2 to designate mutant mice with AT2-specific disruption of Dlk1 and Dlk1del to designate mutant AT2 in which Dlk1 expression was disrupted. For the WT control, we used littermates with the genotype SPC-CreER, +/+, ROSA-Tomato (SPC-Tomato).
Figure 3. Inducible AT2-Specific Deletion of Dlk1 Fails to Affect AT2 Proliferation after PA Injury.

(A) Schematic of inducible AT2 cell-specific deletion of Dlk1 combined with Tomato lineage tracing (Dlk1ΔAT2). The Tam-inducible SpC-CreER system was used to generate Dlk1ΔAT2 mice. Cre expressed from the Sp-C promoter also deletes the “stop” sequence to allow mutant cells and their progeny to be labeled by Tomato.
(B) Tomato+ AT2 isolated by flow-sorting from Tam-treated control (WT) and Dlk1ΔAT2 mice (Dlk1del) without PA or at 3 and 7 days post PA were analyzed for Dlk1 expression by western blotting. Glyceraldehyde 3-phosphate dehydrogenase (GAPDH) was used as a loading control. The relative band intensity of Dlk1 versus GAPDH was plotted, *p < 0.05.
(C and D) AT2 were isolated for qRT-PCR analysis. The relative expression of the proliferation markers CDC25C (C) and CLNB1 (D) in 3-day post-injury AT2 were compared with WT controls.
(E) Western blot of the proliferation marker phospho-histone H3 3 days post-injury in Dlk1del and control AT2. Quantification of western blots was performed using ImageJ.
All bar graph data are presented as mean ± SE; n ≥ 3. See also Figures S3 and S4.
Lineage-labeled Tomato+ AT2 were isolated by flow sorting from Tam-treated Dlk1ΔAT2 (mutant [Mut]) mice and WT control mice. We found that the mutant and control cells both expressed low levels of Dlk1 in the absence of injury (Figure 3B). Dlk1 protein was not completely lost in AT2 from Dlk1ΔAT2 mice, likely because of slow turnover of AT2 and stability of the Dlk1 protein (Barkauskas et al., 2013; Desai et al., 2014). However, at 3–5 days post-PA injury, Dlk1 expression in WT AT2 significantly increased, whereas mutant AT2 expression showed little change compared with controls (Figure 3B; Figure S3G). 7 days post-PA injury, Dlk1 expression of both WT and mutant AT2 was similar to basal levels (Figure 3B). These results show temporally increased Dlk1 expression during repair and disruption of Dlk1 protein expression in mutant cells after PA lung injury.
We next explored the effects of Dlk1 disruption on AT2 progenitor function by assessing whether mutant AT2 displayed reduced proliferation at the early repair phase after PA-induced alveolar injury. In AT2 isolated 3 days after PA injury, when WT cells are markedly proliferating (Liu et al., 2015), we found that the mutant cells expressed similar amounts of CDC25C and Cyclin B1 (Figures 3C and 3D), indicators of AT2 proliferation (Liu et al., 2015), compared with WT cells. AT2 were then isolated 3 days post-PA injury for western blot analysis, which showed that mutant cells had similarly phosphorylated histone H3, an indicator of cell division (Figure 3E; Liu et al., 2003). We also stained lung sections from WT and Dlk1ΔAT2 mice 3 days after PA injury with an antibody against the proliferation marker Ki67 (Zhou et al., 2018) and found that ~2% of Tomato+ cells were Ki67+ in both the WT and mutant (Figures S3H and S3I). Thus, disruption of Dlk1 did not interfere with proliferation of AT2 after PA injury.
To determine whether AT2-specific Dlk1 disruption affected cell death after PA injury, we performed a terminal deoxynucleotidyl transferase mediated dUTP nick end labeling (TUNEL) assay on lung sections obtained 3 days after PA injury. Here we did not find significant differences in cell death between WT and mutant mice (Figure S4). Next we determined, by qRT-PCR of whole-lung lysates obtained 3 days after PA injury, whether disrupting Dlk1 in AT2 affected the inflammatory response of mutant lungs. When examining several factors involved in inflammation (i.e., MIP2, MCP, interleukin-6 [IL-6], tumor necrosis factor alpha [TNF-α], and ICAM-1; Chignalia et al., 2015), we found no significant difference between WT and mutant mice (Figure S4).
Because Dlk1 disruption did not cause defects in AT2 proliferation, cell death, or the inflammatory response, we next addressed whether Dlk1 contributed to the mechanism of differentiation of AT2 to AT1. The first step in transition of AT2 to AT1 is loss of AT2 markers; thus, we analyzed whether Dlk1del AT2 showed altered expression of the AT2 marker Sp-C. We found that the mRNA expression of Sp-C decreased in both WT and Dlk1del AT2 3 days after PA-induced injury compared with non-PA controls (Figure 4A); however, AT2 isolated from Dlk1ΔAT2 mice 3 days after PA injury expressed significantly less Sp-C compared with the WT (Figure 4A). These results were confirmed by western blotting using flow-sorted Tomato+ AT2 (Figure 4B). We observed significantly less Sp-C protein expression in mutant cells 3, 5, and 7 days after PA injury compared with WT controls (Figure 4B), indicating defective AT2-to-AT1 transition. We also analyzed lung sections prepared from the lineage-labeled Dlk1ΔAT2 and WT mouse lines 7 days post-PA injury by fluorescent antibody staining of Sp-C and the lineage marker YFP (Figures 4C and 4D). Sections from SpC-CreER/Dlk1flox/ROSA-YFP lines showed numerous YFP+ cuboidal cells lacking Sp-C (Figure 4D). In contrast, more than 90% of the YFP-labeled cuboidal cells in the WT showed Sp-C staining (Figure 4C). Thus, disruption of Dlk1 induced abnormal AT2-to-AT1 transition and unmasked an intermediate population of Sp-Clow AT2.
Figure 4. Appearance of Sp-Clow AT2 in Dlk1ΔAT2 Mice after Lung Injury.

(A) mRNA expression of Sp-C in AT2 of WT and Dlk1ΔAT2 of uninjured and 3-day post-PA injured mice was quantified by qRT-PCR. Data are presented as relative values compared with the uninjured WT. Mean ± SE; *p < 0.05, **p < 0.01.
(B) Flow-sorted Tomato+ AT2 cells of WT and Dlk1ΔAT2 basal and post-injury mice were analyzed by western blotting for Sp-C expression. β-Actin was used as a loading control. Images are representative of three similar observations.
(C and D) Images of lungs in which AT2 were lineage-labeled by YFP. 7 days post-PA injury, most WT AT2 (cuboidal YFP+ cells) expressed Sp-C (C), whereas numerous YFP+ mutant (Mut) AT2 lacked Sp-C expression (arrows in D). Scale bar, 20 μm.
We next studied the possible defect in conversion of Dlk1del AT2 to AT1 during the late repair phase. Studies were first made using lung sections from the lineage-tracing lines (Figure 3A) 10 days after PA injury. We found in WT lungs (SPC-Tomato) that numerous Tomato+ cells acquired AT1 morphology and expressed the AT1 marker T1α (Figures 5A and 5E), whereas lung sections from mutant SpC-CreER/Dlk1flox/ROSA-Tomato (Dlk1ΔAT2) mice showed significantly less Tomato+ AT1-like cells than controls (Figures 5B–5D and 5F). In addition, in Dlk1ΔAT2 sections, numerous Tomato+ cuboidal (AT2-like) cells showed weak expression of the AT1 marker T1α, whereas almost all Tomato+ cuboidal cells in WT sections were negative for T1α (Figures 5E and 5F). We did not observe any abnormal distribution of CC10+ cells in Dlk1ΔAT2 lungs (Figure S5), indicating that mutant cells did not transition into the bronchiolar club cell fate (Stripp, 2008). Thus, Dlk1del AT2 cells were blocked from differentiation at the intermediate Sp-ClowT1α low stage during transition to AT1.
Figure 5. Dlk1del AT2 Show Defective Transition to AT1.

(A and B) Lung sections from 10-day post-PA WT (A) and Dlk1ΔAT2 (B) mice. Tomato lineage tracing lungs were stained for Tomato to mark for AT2 as well as AT1 resulting from transition of AT2. More Tomato+ AT1 were observed in WT than Dlk1ΔAT2 lungs, as marked by white arrows.
(C and D) The area of Tomato+ AT1 (arrows in C) was quantified (D) as pixel number and normalized to the number of Tomato+ AT2 of the same section. (C) represents the Tomato+ lineage-traced AT1-like cells in (A). Scale bar, 20 μm. Data are presented as mean ± SE; *p < 0.05; n = 3 mice per group. For each mouse, more than 10 microscope areas were randomly selected from sections for quantification.
(E and F) Mutant AT2-like cells expressed low levels of T1α 10 days after PA injury. Sections of AT2-lineage-traced WT (E) and Dlk1ΔAT2 (F) lungs were prepared 10 days after PA injury and processed for antibody staining of the AT1 marker T1α (green). Arrows show Tomato+ cuboidal AT2-like cells, and the arrowheads in (E) show Tomato lineage-labeled AT1. Numerous AT2-like cells in the mutant expressed a low level of T1α (arrows in F).
(G) Tomato+ AT2 and AT2-like cells were isolated from WT and Dlk1ΔAT2 lungs 9 days after PA infection and processed for RNA-seq analysis. The cartoon shows the possible types of Tomato+ lineage-traced cells in WT and Dlk1ΔAT2 lungs. Tomato+ cells were sorted by FACS following the standard AT2 isolation procedure and then processed for RNA-seq. A red circle indicates the cells included in the RNA-seq analysis. In the WT, only quiescent AT2 were included; the lineage-traced AT1 were not included in the cell preparation. In the mutant, quiescent AT2 as well as the cuboidal AT2-like intermediate cells were included. The expression levels of ~40 AT1 and AT2 markers each were compared between WT and Dlk1del cells. A modified Z score, calculated based on the log2 scale mean values, was plotted in heatmaps (n = 3 mice in each group). Red to blue coloring represents high to low expression of genes (NCBI GEO: GSE 124259).
(H–J) Tomato+ AT2 were isolated from WT (H) and Dlk1ΔAT2 (I) lungs and cultured for 8 days. WT cells (H) spread to a larger area compared with Dlk1del cells (I). The area of each cell was measured by ImageJ and is presented as a box whisker plot (J). More than 100 cells were measured for each sample group in 2 independent experiments.
(K and L) AT2 isolated from WT and Dlk1ΔAT2 lungs were cultured for 5 days to allow AT2 to AT1 transition and processed for qRT-PCR to examine expression levels of the AT1 markers RAGE (K) and HopX (L). n = 4.
Data are presented as mean ± SE; *p < 0.05, **p < 0.01. See also Figure S5.
To characterize the mutant AT2 that were blocked at the intermediate stage, we carried out an RNA sequencing (RNA-seq) analysis, comparing gene expression profiles between AT2 and AT2-like cells isolated from WT and Dlk1ΔAT2 lungs 9 days after PA injury. After the standard AT2 isolation procedure, Tomato+ cells were further sorted by FACS and processed for RNA-seq. The lineage-traced AT1, which are very fragile because of their thin morphology (Yang et al., 2016), were not included in the cell preparation (Liu et al., 2015; Figure 5G). We expected that, in the mutant, the cell populations processed for RNA-seq included quiescent AT2 (Sp-ChiT1αneg) that were not affected by the injury as well as the cuboidal AT2-like intermediate cells (Figure 5F) (Sp-ClowT1αlow), whereas in the WT, only quiescent AT2 were included because, at this stage, the reparative AT2 should either have converted to AT1 or returned to the quiescent state (Figures 5E and 5G). The expression of ~40 each of the AT1 or AT2 markers (Marconett et al., 2017; Wang et al., 2018) was compared between WT and mutant cells (Figure 5G; Table S2). We found that, in general, the mutant cells expressed higher levels of AT1 markers and lower levels of AT2 markers compared with the WT (Figure 5G; Table S2), consistent with the data in Figures 4 and 5E and 5F. Thus, the RNA-seq analysis confirmed that Dlk1del AT2 were blocked at the Sp-ClowT1αlow intermediate stage at late repair stage.
Next we used in vitro culture to further study Dlk1-mediated transition of AT2 to AT1. Tomato+ lineage-labeled AT2 from WT or Dlk1ΔAT2 mice were isolated by flow cytometry sorting and cultured. We found that, after 8 days of culture, both WT and Dlk1del cells changed their shape to a flattened AT1-like morphology. However, the AT1-like cells generated from WT AT2 spread into a larger area compared with Dlk1del cells (Figures 5H–5J), which is a phenotype indicating more mature AT1 (Yang et al., 2016). We also compared the expression of AT1 markers after AT2 isolated from WT or Dlk1ΔAT2 mice were cultured for 5 days and found that WT cells expressed significantly greater levels of RAGE and HopX (Yang et al., 2016) than Dlk1del cells (Figures 5K and 5L), further supporting defective transition of Dlk1del AT2 to AT1.
Dlk1del AT2 Cells Maintain Elevated Notch Activation
We also determined whether the defective transition of Dlk1del AT2 to AT1 was the result of dysregulated Notch signaling in these cells. Using western blotting to probe for NICD in Tomato+ AT2 isolated by flow cytometry from lineage-labeled WT and Dlk1ΔAT2 mice at different times post-PA injury, we observed that NICD levels were similar in WT and Dlk1del AT2 in non-PA and in 3-day post-PA injury lungs (Figures 6A and 6B). However, Notch signaling decreased in WT AT2 5 and 7 days post-PA injury, whereas the high Notch activation was sustained in Dlk1del AT2 (Figures 6A and 6B; Figure S6A).
Figure 6. Sustained Notch Activation in Dlk1del AT2.

(A) Tomato+ AT2 were sorted from uninjured and 3-, 5-, and 7-day post-injury lineage-traced mice for western blot analysis of cleaved NICD. GAPDH was used as a loading control. The images of 5- and 7-day PA-injured mice are from the same gel.
(B) Intensities of western bands were quantified using ImageJ and normalized to GAPDH levels. Relative NICD levels were calculated by comparison with normalized NICD of non-PA WT samples run at the same time in each experiment. Bar graphs are presented as mean ± SE; n ≥ 3 for each genotype at each time point.
(C and D) Schematic of WT (C) or Dlk1ΔAT2 (D) lines combined with Tomato lineage tracing and the Notch activity reporter allele Notch-Venus.
(E) FACS analysis of Notch-Venus+ cells among Tomato+ AT2 of WT and mutant mice uninjured as well as 3-, 5-, and 7-day post-PA injury.
(F) Percentages of Venus+ cells among Tomato+ AT2 in WT mice non-PA-injured and 3, 5, and 7 days after PA injury were plotted.
(G) Relative ratios of Venus+ AT2 of the mutant compared with the WT non-PA-injured and 3, 5, and 7 days after PA were plotted.
Data were first calculated as percent Venus+Tomato+ cells versus Tomato+ cells, which were then compared with percent in control mice of the same PA challenge experiment. Mean ± SE; n ≥ 3. The p values are indicated. n.s., not significant. See also Figure S6.
To further assess the role of AT2 Notch activation in mediating the transition to AT1, we generated SpC-CreER/+/ROSA-Tomato/Notch-Venus (Figure 6C) and SpC-CreER/Dlk1flox/ROSA-Tomato/Notch-Venus (Figure 6D) mice. In these mice, WT (Figure 6C) or Dlk1del (Figure 6D) AT2 were lineage-labeled by Tomato, and concurrently Notch signaling was monitored by Venus expression (Figures 1D, 6C, and 6D). Analyzing AT2 isolated from these mice by FACS (Figure 6E; Figures S6B–S6G), we observed that, without PA, a small percentage of Venus+ AT2 were present in both WT and mutant mice (Figure 6E). In the WT, however, the percentage of Venus+ cells among Tomato+ AT2 significantly increased 5 days after PA injury and declined 7 days after PA injury (Figures 6E and 6F). In mutant lungs, the ratio of Tomato+Venus+ in Tomato+ AT2 cells was similar as in the WT without PA and 3 and 5 days after PA injury (Figure 6G). However, 7 days after PA injury, the percentage of Venus+ AT2 in mutant mice was significantly greater than in the WT (Figure 6G). These data demonstrate that Notch signaling is activated at an earlier phase of repair (3–5 days post-PA injury) in both WT and Dlk1del AT2, when the cells acquire their progenitor functions, but it is inhibited by Dlk1 in the WT 7 days post-PA injury; specifically, during the transition of AT2 to AT1. Dlk1del AT2 with abnormally high Notch signaling failed to differentiate into AT1. The observed discrepancy in the peak time of Notch activation detected by NICD western blot and Venus reporter assay in the WT (3 days after PA injury for NICD western blot versus 5 days for the Venus reporter) likely reflects the lag between Notch receptor cleavage and activation of downstream transcription targets.
Disrupting Notch Activation in AT2 Prevents Transition to AT1
We next used mice with constitutively active or inhibited Notch signaling in AT2 to address whether aberrant Notch activation leads to disrupted AT2 progenitor cell function. For constitutive Notch activation, we used SpC-CreER/ROSA-ICN (SPC-ICN) mice (Murtaugh et al., 2003), which possess a cassette containing the intracellular domain of Notch 1 (ICN) followed by an internal ribosome entry site (IRES)-activated GFP tag inserted at the Rosa26 locus, preceded by a floxed stop codon (Figure 7A). After Tam treatment, Cre-mediated recombination in these mice led to expression of ICN in AT2, resulting in constitutive Notch signaling (Figure 7A). We isolated and cultured AT2 from SpC-ICN mice and found by antibody staining that, after 8 days of culture, most of the WT cells expressed the AT1 marker RAGE, whereas almost all ICN-expressing cells lacked RAGE staining (Figure 7B). Furthermore, in 5-day-cultured AT2 isolated from WT and SpC-ICN mice, we observed by qRT-PCR that the cells from SpC-ICN mice expressed significantly less of the AT1 markers RAGE and HopX (Figure 7C) than WT controls, indicating defective AT2-to-AT1 transition.
Figure 7. Dysregulated Notch Activation Disrupts AT2-to-AT1 Transition.

(A) Schematic of the mouse line with constitutively active Notch in AT2. The Notch 1 intracellular domain (ICN) was used to achieve constitutive Notch and is expressed through AT2-specific Cre recombination and the ROSA/loxP-stop-loxP locus; GFP was expressed through an IRES site as a lineage-tracing marker.
(B) AT2 from WT or SPC-ICN mice were cultured for 8 days and then stained for the AT1 marker RAGE. Green indicates the SpC-CreER-dependent AT2 lineage marker. Most lineage-labeled cells in the WT show RAGE staining (red, left), whereas almost all ICN-expressing cells (GFP+, right) were absent of RAGE.
(C) AT2 from SPC-ICN mice were cultured for 5 days and processed for qRT-PCR analysis for the appearance of the AT1 markers RAGE and HopX. Data are presented as mean ± SE; n = 3; *p < 0.05.
(D and E) Lineage-labeled AT2 were isolated by flow-sorting from WT or SPC-ICN mouse lungs 8 days after PA injury and processed for qRT-PCR analysis for expression of the AT1 markers HopX, Cav1, and Igfbp2 (D) as well as the AT2 markers Sp-C and Sp-D (E). Mean ± SE; n = 4–5; *p < 0.05, **p < 0.01, ***p < 0.001.
(F) Schematic of mouse lines with disrupted Notch signaling in AT2. Dominant-negative MAML (dnMAML) was expressed through SpC-CreER and the ROSA/loxP-stop-loxP locus, and GFP was expressed through an IRES site as a lineage-tracing marker.
(G) AT2 from WT (left) or SPC-dnMAML (right) mice were cultured for 24 h and processed for TUNEL staining.
(H) Lung sections from WT (left) or SPC-dnMAML (right) mice were prepared 3 days after PA infection and processed for TUNEL staining. Scale bar, 50 μm.
(I) The model. Upon PA injury, Notch signaling is activated in AT2. Notch signaling is later inhibited through Dlk1 before transitioning to AT1. In the absence of Dlk1, Notch signaling persists, and cells are arrested in an intermediate Sp-Clow/T1αlow stage.
See also Figure S7.
We also determined whether ICN+ AT2 exhibited a similar phenotype as Dlk1del AT2 in vivo, using qRT-PCR analysis. AT2 were purified by flow cytometry after the standard AT2 isolation procedure from control (SpC-Tomato) or SpC- ICN mice 8 days after PA injury. qRT-PCR showed that, similar to Dlk1ΔAT2 in which mutant AT2 at this time point expressed higher levels of AT1 markers and lower levels of AT2 markers compared with the WT (Figures 4 and 5G), ICN+ AT2 also expressed significantly higher levels of the AT1 markers HopX, Cav1, and Igfbp2 (Wang et al., 2018; Figure 7D) but lower levels of the AT2 markers Sp-C and Sp-D (Wang et al., 2018; Figure 7E) than controls.
To inhibit Notch signaling, we used the SpC-CreER/ROSA-dnMAML (SPC-dnMAML) mouse line expressing an inducible AT2-specific dominant-negative form of MAML (Maillard et al., 2006). MAML is a necessary co-activator of Notch-mediated target gene transcription (Kopan and Ilagan, 2009). These mutant cells were also lineage-traced by GFP through an IRES site (Maillard et al., 2006; Figure 7F). In cultured AT2 from WT or SPC-dnMAML mice, we observed that dominant-negative MAML (dnMAML)-expressing cells underwent apoptosis starting 24 h after culture, as determined by TUNEL staining (Figure 7G). 72 h after culture, all GFP+ dnMAML-expressing cells had undergone apoptosis (data not shown); thus, AT2 with constitutively low Notch signaling did not survive during the transition to AT1. Consistently, lung sections from SPC-dnMAML mice 3 days after PA injury showed a significantly greater number of TUNEL+ cells than WT controls (Figure 7H).
Because Dlk1del AT2 exhibited abnormally high Notch activation at the late repair phase, we tested, by examining SpC-CreER/Dlk1 flox/ROSA-dnMAML mice, whether reduced Notch activation in Dlk1del AT2 rescued their phenotype. 9 days after PA injury, AT2 were purified by flow-sorting in addition to the standard AT2 isolation procedure from these double-mutant mice and compared with the Dlk1del single mutant by qRT-PCR. We found that double-mutant (Dlk1del;dnMAML) AT2 showed lower expression of the AT1 marker Aqp5 compared with Dlk1del single-mutant AT2 (Figure S7), indicating that dnMAML partially rescued the Dlk1 phenotype.
DISCUSSION
Dlk1 is expressed in many embryonic tissues, and its expression disappears postnatally (Appelbe et al., 2013; Yevtodiyenko and Schmidt, 2006). However, Dlk1 returns in some adult tissues undergoing regeneration (Andersen et al., 2013; Zhu et al., 2012). Dlk1 is expressed in the distal tip of the branching epithelium and surrounding mesenchyme in the embryonic mouse lung (Yevtodiyenko and Schmidt, 2006), where it participates in lung development (da Rocha et al., 2009). Here we addressed the regenerative function of Dlk1 and its relationship to Notch activation in regulating the transition of AT2 to AT1. The present studies were conducted in a clinically relevant model of alveolar injury in which mice are challenged with i.t. PA as described by us previously (Liu et al., 2011). We demonstrated using multiple approaches, including inducible AT2 cell-specific Dlk1 mutant mice, lineage-tracing studies, RNA-seq, Notch reporter- and AT2-specific constitutively active Notch mice, and dnMAML-expressing mice, that Notch signaling is activated in AT2 after alveolar epithelial injury but that later, Notch is downregulated by Dlk1 as AT2 transition to AT1. This high-to-low Notch switch was essential for AT2 differentiation into AT1. These studies identify the critical role of the non-canonical Notch ligand Dlk1 in temporally downregulating Notch signaling and promoting AT2-to-AT1 transition and alveolar epithelial repair (Figure 7I).
We observed in WT lungs that AT2 post-PA injury initiated a hyperproliferative phenotype and subsequently transitioned into AT1. However, in the absence of Dlk1 we found that AT2 still proliferated but failed to transition to AT1. In these mice, we observed accumulation of a population of Sp-ClowT1αlow AT2-like cells that were indicative of a stalled differentiation program. RNA-seq analysis confirmed the presence of this intermediate cell population, which expressed lower levels of AT2 markers and higher levels of AT1 markers than the control, indicating that the mutant cells are gridlocked at an intermediate stage of AT2-to-AT1 transition. These Sp-ClowT1αlow intermediate cells also showed hyperactivation of Notch, consistent with the function of Dlk1 in suppressing Notch signaling (Figure 7I). The key finding that Sp-ClowT1αlow intermediate cells accumulated indicates that the AT2-to-AT1 transition involves sequential steps, including a partial dedifferentiation that precedes acquisition of the AT1 phenotype. We observed in Dlk1ΔAT2 lungs an accumulation of AT2-like cells along with reduced expression of Sp-C post-PA injury, indicating that initiation of the AT1 transition program had occurred. Our results also indicate that Dlk1del AT2 cells undergo partial dedifferentiation to acquire the Sp-ClowT1αlow intermediate cell phenotype but that the subsequent transition was blocked. It is possible that the intermediate AT2 resemble certain primitive fetal-stage cells with the potential to diverge into both AT1 and AT2 (Desai et al., 2014) or that Dlk1 mutation in AT2 may cause arrest of these cells in a different stage during the discrete sequential steps of dedifferentiation and re- or trans-differentiation. We do not know what percentage of AT2 will adopt an intermediate cell state during repair, and we cannot rule out the possibility that in the mutant some AT2 near the intermediate cells will undergo compensatory changes to differentiate toward AT1 cells but were also trapped as intermediate cells. We also observed by in vitro culture that the Dlk1del AT2 cells flattened but failed to spread further and expressed lower levels of AT1 markers compared with WT cells undergoing AT2-to-AT1 transition. This flattened state might correspond to the cuboidal intermediate cells in vivo. The difference in cell shape in vitro and in vivo might reflect the important roles of the extracellular matrix (ECM) or niche environments in the lung.
Unlike studies showing that a specific level of Notch activation determines the fate of several lung cell types (Rock et al., 2011b), our results show that a mechanism involving Dlk1-dependent temporal high Notch-to-low Notch switch plays critical roles in the sequential steps of AT2-mediated alveolar repair. We found that Notch signaling was elevated at the initiation of the repair process. AT2 isolated from SPC-dnMAML mice, which have constitutively low Notch activation, underwent apoptosis shortly after initiation of AT2-to-AT1 transition. Therefore, Notch activation at the early phase of alveolar repair appears to be required for survival of AT2 at the point when these cells enter the intermediate state toward AT1 transition. On the other hand, using Notch reporter mice and assessment of the NICD level, our results show that downregulation of elevated Notch signaling at a specific time is necessary to ensure full transition from AT2 to AT1. Dlk1del AT2 cells with high Notch activation or constitutively active Notch ICN-expressing AT2 cells were gridlocked at the intermediate stage.
The signaling mechanisms responsible for the initiation of Notch activation are unclear. One possibility is that inflammatory pathways activated by PA induce Notch activation in AT2. PA is known to induce activation of nuclear factor κB (NF-κB) signaling (Sadikot et al., 2006), which, in turn, is known to upregulate the expression of Notch ligands such as Jagged1 (Bash et al., 1999). Another possibility is influx of macrophages occurring after PA-induced inflammation could provide ligands needed for activation of Notch receptors in AT2 cells (Foldi et al., 2010). It is also possible that AT2 Notch signaling is activated in a ligand-independent manner (Palmer and Deng, 2015).
We observed that Dlk1 upregulation was required for downregulating Notch signaling and AT2-to-AT1 transition. Dlk1 is a dose-sensitive gene (da Rocha et al., 2009); therefore, a significantly lower level of Dlk1 in the mutant AT2 caused a severe phenotype. Previous studies showed that Dlk1 can modulate Notch activation in a context- and cell-dependent manner. In blood vessels, Dlk1 is known to inhibit Notch during angiogenesis (Rodríguez et al., 2012) and endothelial cell proliferation after injury (Schober et al., 2014). Dlk1 in the developing heart appears to positively regulate Notch1 (Shamis et al., 2015). We cannot be sure whether these effects of Dlk1 are due to involvement of different co-ligands and co-receptors or may reflect different Dlk1 isoforms (Falix et al., 2012; Kopan and Ilagan, 2009). In the present study, using Notch reporter mice and western blotting analysis of the cleaved NICD, we established a key role of Dlk1-dependent inhibition of Notch signaling in mediating AT2-to-AT1 transition. AT2 showed increased expression of Dlk1 as early as 3 days after PA injury; at the same time, abnormal Sp-C expression was observed in the mutant. Also at this time, we observed a slight increase in NICD levels, which was, however, statistically insignificant. This might be due to slight alterations of the NICD not always detected in the western blots. In addition, dnMAML partially rescued the Dlk1 phenotype, further supporting that Dlk1 acts through negative regulation of Notch activation.
Dlk1 is a transmembrane protein considered to be a non-canonical Notch ligand (Falix et al., 2012; Kopan and Ilagan, 2009). Similar to the canonical Notch ligands, Dlk1 possesses 6 EGF-like repeats and a delta and OSM-11 motif (DOS) domain but lacks the delta-serrate-LAG2 (DSL) domain, which is necessary for trans-activation of Notch receptors through the canonical mechanism (Falix et al., 2012; Kopan and Ilagan, 2009). The interaction between Dlk1 and Notch receptors could modulate Notch signaling in multiple ways. It may cooperate with other DOS domain-containing ligands (Falix et al., 2012; Kopan and Ilagan, 2009). Dlk1 can also act in a cis-inhibitory fashion by interacting with Notch receptors in the same cell, blocking a trans-ligand, or through regulating intracellular trafficking of the cleaved Notch (Falix et al., 2012; Kopan and Ilagan, 2009; Palmer and Deng, 2015). In addition to the full-length membrane-bound form of Dlk1, there are also cleaved, soluble forms of Dlk1 (Smas et al., 1994). Targeted expression of Dlk1 isoforms in AT2 may be important in defining details of Notch inhibition induced by Dlk1. Wnt signaling may be a possible mechanism initiating Dlk1 expression during the onset of AT2-to-AT1 transition because the Wnt and β-catenin pathway transcription factor Tcf or LEF binds the Dlk1 promoter (Weng et al., 2009). Wnt and β-catenin is also activated in AT2 after injury (Liu et al., 2015) and regulates AT2 progenitor function (Flozak et al., 2010; Nabhan et al., 2018; Zacharias et al., 2018). Recent studies showed that β-catenin gain-of-function mutation caused an arrest of AT2-to-AT1 transition during steady-state homeostasis (Nabhan et al., 2018). It is intriguing to ask whether different mechanisms apply to AT2-to-AT1 conversion in the context of steady-state homeostasis versus injury repair. Our finding may also lead to the discovery of cross-talk between Wnt and Notch signaling in the regulation of AT2 progenitor function.
In conclusion, we have shown that Dlk1-dependent temporal modulation of the Notch signaling pathway is necessary for AT2-to-AT1 transition and repair of the alveolar epithelium after PA-induced injury. Thus, Dlk1 and Notch signaling components represent potential therapeutic targets for accelerating repair of the alveolar epithelium and resolving acute lung injury.
STAR★METHODS
CONTACT FOR REAGENT AND RESOURCE SHARING
Further information and requests for reagents may be directed to and will be fulfilled by the Lead Contact, Yuru Liu (yuruliu@uic.edu).
EXPERIMENTAL MODEL AND SUBJECT DETAILS
Animal Care and Use
All animal experiments were approved by the Institutional Animal Care Committee of the University of Illinois at Chicago. All mice were maintained in a barrier facility with free access to food and water. Male and female mice aged 6–12 weeks old were used. To induce Cre expression, mice were administered 4 doses of tamoxifen every other day for a total of 1mg/g body weight. Mice were used 1–4 weeks after the last tamoxifen injection. The mouse line with type II cell-specific disruption of Dlk1 (Dlk1ΔAT2) was generated by crossing a mouse line expressing tamoxifen-inducible Cre under control of the type II cell-specific promoter SpC (SpC-CreER, kindly provided by Dr. Brigid Hogan, Duke University) with male Dlk1flox (Dlk1tm1.1Jvs/J, The Jackson Laboratory). WT/SpC-CreER and Dlk1flox/SpC-CreER mice were further crossed with ROSA-Tomato (Rosa-tomato:B6.Cg-Gt(ROSA)26Sortm9(CAG- 81 tdTomato)Hze/J, The Jackson Laboratory) or (ROSA-YFP B6.129X1-Gt(ROSA)26Sortm1(EYFP)Cos/J, The Jackson Laboratory) for lineage tracing studies. Some mice were further crossed with Notch reporter Notch-Venus mice (Tg(Cp-HIST1H2BB/Venus)47Hadj/J, the Jackson Laboratory) for Notch activity assays. ROSA-ICN mice were crossed with SpC-CreER mice to study constitutive Notch activation in type II cells. ROSA-dnMAML mice were crossed with SpC-CreER mice to study dominant negative Notch signaling in type II cells. Littermates (SpC-CreER/+/ROSA-Tomato) were used as control for Dlk1 knock-out mice, C57BL/6 (Jackson lab) or SpC-CreER/ROSA-Tomato mice were used as control for SpC-CreER/ROSA-ICN and SpC-CreER/ROSA-dnMAML (both are in C57BL/6 background).
METHOD DETAILS
Intratracheal injection of PA103
Live PA103 (kindly provided by Dr., Ruxana T Sadikot, Emory University School of Medicine) was titered overnight on blood agar plates and mixed with freeze-killed dead PA103 to administer 2×10⁴ live and 5×10⁶ dead PA in 20 μL of sterile PBS. Mice were anesthetized with ketamine (100mg/kg), xylazine (5 mg/kg) and lidocaine (1 mg/kg). The neck surgical site was shaved and sterilized with 70% ethanol. A 1cm incision was made and the trachea was exposed. 20 μL of bacteria in PBS was slowly injected into the trachea.
Buprenorphine (0.1mg/kg) was administered for post-operative analgesia.
Harvest and fixation of lungs
Mice were anesthetized with ketamine/xylazine. An incision was made in the abdomen and mice were exsanguinated by severing the abdominal aorta. The rib cage was cut open to expose the heart and lungs. 10 mL PBS was used to perfuse the lungs through the pulmonary artery. The trachea was exposed and cannulated. 2 mL of 4% paraformaldehyde was instilled into the lungs and the trachea was tied off with thread. The lungs were removed and fixed in 4% paraformaldehyde overnight before paraffin embedding and sectioning, performed by the Histology core at the University of Illinois at Chicago. For frozen section preparation, the lung was injected with 2 mL OCT (Tissue Tek) through the tracheal. Lung was embedded in OCT then immediately frozen in ethanol-dry ice bath. 5 μm sections were cut using a cryostat.
Isolation and culture of type II cells
Mice were sacrificed and the lungs perfused and cannulated as described above. 2 mL dispase was instilled into the lungs followed by 0.5 mL 1% agarose to seal the upper airway. The lungs were removed and incubated in dispase (Corning) at room temperature for 45 minutes. Dissociated cells were treated with DNase I (100U/ml) in 5mL DMEM with 10% FBS, 25mM HEPES, 1x Penicillin/streptomycin, 1x Gentamicin/Amphotericin and filtered through a 70 μm cell strainer followed by 20 μm nylon membrane. The resulting cell suspension was centrifuged at 150 g for 8 minutes to pellet the type II cells, which were resuspended in 7 mL DMEM/FBS/HEPES and plated on anti-CD16/32 and anti-CD45 coated plates. The cells were incubated at 37°C/5% CO2 for 1 hour, and non-adherent type II cells were collected. Red blood cells were lysed with RBC lysis buffer, followed by washing with DMEM. This protocol yields ≥ 90% type II cell purity, as assessed by modified Papanicolaou stain (Dobbs, 1990; Figure S1). Isolated type II cells were cultured on 0.2% gelatin-coated culture dishes or glass coverslips, in DMEM supplemented with 10% FBS, 1mM HEPES, penicillin/streptomycin, gentamycin, and antibiotic-antimycotic. Media was changed every other day.
Flow cytometry analysis and sorting
Type II cells freshly isolated from mice with SpC-CreER/ROSA-Tomato and/or CBF-Venus loci as described above. Cells were stained for DAPI to eliminate dead cells from analysis. Cells were analyzed as well as sorted using a Beckman Coulter MoFlo high speed cell sorter located in the Flow Cytometry Core at the University of Illinois at Chicago. Non-fluorescent, and single color controls were included in analysis. Control and experimental samples were always run with same voltage and gates in each experiment.
Quantitative real-time PCR
Freshly isolated or cultured type II cells were lysed in TriZol reagent (Life Technologies) and RNA was isolated with the RNeasy kit (QIAGEN). RNA concentration was measured using a NanoDrop (Thermo Scientific) and cDNA synthesized using the High-Capacity cDNA Reverse Transcription Kit (Applied Biosystems). RT-qPCR was performed on a Viia7 Real-Time PCR System (Life Technologies) using SYBR Green (Roche). Data is expressed as fold change, calculated by ΔΔCt method, using Cyclophilin (CLO) as housekeeping reference gene(Liu et al., 2011). Primer sequences are listed in Table S1. For some experiments, the FAM-MGB labeled Taqman assays were used.
Western blotting
Freshly isolated type II cells were lysed in RIPA buffer supplemented with protease inhibitor. Protein concentration was determined by BCA assay (Bio-Rad) and equal amounts of protein were separated on 4%–20% SDS-PAGE gels followed by transfer to polyvinylidene difluoride membrane. Nonspecific binding was blocked by incubation in 5% skim milk in Tris buffered saline with 1% Tween-20. Blots were probed with specific primary antibodies followed by appropriate horseradish peroxidase-conjugated secondary antibody. Blots were developed with chemiluminescent substrate (Pierce) and an ImageQuant LAS imager (GE Healthcare). Blots were analyzed densitometrically using ImageJ (Version 1.47, National Institutes of Health), with values being normalized to β-actin or GAPDH and expressed as percentage of control.
IMMUNOSTAINING, IMAGING AND QUANTIFICATION
Slides were dewaxed and rehydrated. Cryosection slides were thawed at room temperature and fixed in 4% PFA for 30 min. Slides and coverslips with cultured cells were permeablized with 0.2% Triton X-100 in PBS. Samples were blocked with 10% normal donkey serum in PBS-0.1% Triton for 1 hour. Samples were incubated with primary antibody in blocking solution overnight at 4°C. Samples were washed three times with PBS-0.05% Triton (PBS-T) for 30 minutes each wash and incubated in fluorescently labeled secondary antibodies (Jackson Immunoresearch) at 1:200 in blocking solution overnight at 4°C. Samples were washed three times with 0.05% PBS-T for 30 minutes each wash and incubated with DAPI (1:1000) for 10 minutes before mounting coverslips with anti-fade mounting medium. Imaging was performed using a Zeiss LSM880 confocal microscope (Carl Zeiss), Zeiss ApoTome (Carl Zeiss) or EVOS FL (Thermo Fisher). Tomato+ fluorescence area of lineage traced type I cells was determined using Fiji (Schindelin et al., 2012). For scoring Ki67 expression, > 1000 Tomato+ cells were scored for each mouse, n = 2 mice each genotype. Experimental images were always taken with the same exposure parameters as relevant controls. Adjustment of images (brightness or contrast) if applied, were always the same for experimental and control.
RNA sequencing analysis
Tomato+ lineage labeled type II cells from WT or Dlk1ΔAT2 mice were isolated at 9 d after PA injection by flow cytometry sorting. Around 200,000 cells were isolated from each mouse, 3 mice were used for each genotype. Total RNA was isolated using QIAGEN RNeasy mini kit (QIAGEN). RNA concentration and purity was determined before RNA sequencing analysis. TruSeq mRNA-Seq libraries were the prepared for each sample, followed by sequencing using the Illumina NextSeq500 platform at the Genomics Core of Northwestern University. All samples were sequenced together on a flow cell to avoid batch effect. We obtained ~32 million reads for each sample. Raw reads were then processed by trimming adaptors. The raw counts among 23338 genes were normalized using the Bioconductor tools(Gentleman et al., 2004) for the R Statistical Package (R Development Core Team, 2013) (URL http://www.R-project.org/). The raw data were normalized using the DESeq2 (Love et al., 2014) that performs an internal normalization where geometric mean is calculated for each gene across all samples. Hierarchical clustering and Principal Component Analysis (PCA) were performed on the normalized data to assess the sample relationship and variability. Differential gene expression between the different experiments was assessed by DESeq2 (Love et al., 2014) that fits negative binomial generalized linear models for each gene and uses the Wald test for significance testing. The raw and processed data have been deposited in the NCBI Gene Expression Omnibus (GEO) database (Accession Number: GSE 124259). False discovery rate was estimated using the Benjamini-Hochberg procedure (Yoav and Yosef, 1995).
41 type I cell markers and 37 type II markers were selected for further analysis based on previous RNA sequencing or microarray studies (Marconett et al., 2017; Wang et al., 2018). The mean value of these genes of 3 WT samples and 3 Mutant samples were listed in Table S2. A modified z score based on the log2 value was calculated as [ZMut (or WT) = (mean expression in mutant (or WT) - mean expression in all sample) / standard deviation in all sample] and plotted using the heatmap.2 library in the R Statistical Package.
Profiling of methylation patterns
Primers targeting the last exon of Dlk1(Takada et al., 2000) in mouse genomic DNA (ENSMUSE00000932061: 109,459,607 to 109,460,361) were designed using the Bisulfite Primer Seeker (Zymo Research, Orange, CA). Each primer set amplified a region of 350 bp of DNA after bisulfite conversion. Primer sequences for primer set 1 were: PS1F: TAGGTTTYGTATGTTTTTTGTTTGTGTTTTTTTGG and PS1R: AACCCATAACCRCTAAACAAATAAATAACCTACAC; primer sequences for primer set 2 were PS2F: GGGTGTAYGAGTTGTTTGTTTAGTAG and PS2R: AAACRCTACTTAAATCTCCTCATCACCAACCTC. Both primers were synthesized with 5′ linkers called common sequence 1 (CS1) and common sequence 2 (CS2), as described previously (Naqib et al., 2018). Genomic DNA was extracted from mouse alveolar type II cells using the GenElute Mammalian Genomic DNA Miniprep kit (Sigma G1N350–1KT). 500 ng of gDNA was used as input for bisulfite conversion, using the EZ DNA Methylation-Lightning Kit (Zymo Research). Bisulfite converted DNA was PCR amplified using PS1 and PS2. A mastermix for the entire plate was made using the MyTaq HS 2X mastermix. Each well received a separate primer pair with a unique 10-base barcode, obtained from the Access Array Barcode Library for Illumina (Fluidigm, South San Francisco, CA; Item# 100–4876). These AccessArray primers contained the CS1 and CS2 linkers at the 3′ ends of the oligonucleotides. Samples were pooled in equal volume using an EpMotion5075 liquid handling robot (Eppendorf, Hamburg, Germany). The pooled library was purified using an AMPure XP cleanup protocol (0.6X, vol/vol; Agencourt, Beckmann-Coulter) to remove fragments smaller than 300 bp. The pooled libraries, with a 20% phiX spike-in, were loaded onto an Illumina MiniSeq mid-output flow cell. Based on the distribution of reads per barcode, the amplicons (before purification) were re-pooled to generate a more balanced distribution of reads. The re-pooled library was purified using AMPure XP cleanup, as described above. The re-pooled libraries, with a 15% phiX spike-in, were loaded onto a MiSeq V3 flow cell (2×300 base reads) and sequenced to generate final data. Fluidigm sequencing primers, targeting the CS1 and CS2 linker regions, were used to initiate sequencing. De-multiplexing of reads was performed on instrument.
Raw sequence data were analyzed using the software package CLC genomics workbench (V11; QIAGEN, Aarhus, Denmark). Briefly, raw sequence data were trimmed to remove poor quality sequence data (< Q20), and to remove 75 bases from each sequence at the 3′ end. Subsequently, reads were merged (> 98% merge rate). Merged reads were then rarefied to 1,000 sequences per sample and mapped against a bisulfite-converted reference sequence. At each CpG site, counts of C and T were assessed, and percent methylation calculated by percentage of C out of total reads at each position. A comparison of the percent methylation between wild-type and mutant were assessed based on two replicates for each group, and visualized in the software package Origin (2017; OriginLab). Library preparation, pooling, sequencing and basic raw data processing were performed at the University of Illinois at Chicago Sequencing Core (UICSQC).
QUANTIFICATION AND STATISTICAL ANALYSIS
Data are expressed as average ± SE. Student’s t test was used to determine statistical significance, with p < 0.05 being considered significant. Values of p and n are listed in figure legends.
DATA AND SOFTWARE AVAILABILITY
RNA sequencing data have been deposited in the NCBI Gene Expression Omnibus (GEO) database (Accession Number: GSE124259).
Supplementary Material
KEY RESOURCES TABLE
| REAGENT or RESOURCE | SOURCE | IDENTIFIER |
|---|---|---|
| Antibodies | ||
| Monoclonal (clone AC-74) anti-mouse β-Actin (Used at 1:5000) | Sigma Aldrich | RRID AB_476697, Cat# A2228 |
| Polyclonal rabbit anti-mouse Dlk1 (Used at 1:250) | Santa Cruz Biotechnology | RRID AB_2292943, Cat# sc-25437 |
| Monoclonal (D3B8) rabbit anti-mouse cleaved Notch1 (Val1744) (Used at 1:2000) | Cell Signaling Technology | RRID AB_2153348, Cat# 4147 |
| Polyclonal rabbit anti-mouse pro-Sp-C (Used at 1:500) | Millipore | RRID AB_91588, Cat# AB3786 |
| Polyclonal rabbit anti-Histone H3, phosphor (Ser10) (Used at 1:2000) | Millipore | RRID AB_310177, Cat# 06–570 |
| Monoclonal hamster (8.1.1) anti-T1 a (Used at 1:50) | Developmental Studies Hybridoma Bank, University of Iowa | RRID AB_531893 |
| Polyclonal rabbit anti-RFP (Used at 1:200) | Rockland Immunochemicals | RRID AB_11182807, Cat# 600-401-379S |
| Polyclonal chicken anti-GFP (Used at 1:500) | Aves Laboratories | RRID AB_10000240, Cat# GFP-1020 |
| Rat APC anti-mouse EpCAM clone G8.8 (Used at 1:100) | BioLegend | RRID AB_1134102, Cat# 118214 |
| Rat IgG2a, kappa clone RTK2758 (Used at 1:100) | BioLegend | RRID not listed, Cat # 400512 |
| Monoclonal rat anti-mouse CD16/32 clone 93 (used at 0.042mg/ml) | Biolegend | RRID AB_312801, Cat#101302 |
| Monoclonal rat anti-mouse CD45 clone 30-F11 (used at 0.016mg/ml) | BioLegend | RRID AB_312967, Cat# 103102 |
| Rabbit anti CC10 polyclonal antibody, used 1:500 | Fisher | Cat# 07623MI |
| Anti-GAPDH mouse monoclonal antibody, used 1:5000 | Sigma Aldrich | RRID AB_1078991, Cat# G8795 |
| Rabbit anti Ki67 | AbCam | RRID AB_443209, Cat# ab15580 |
| Bacterial and Virus Strains | ||
| Pseudomonas aeruginosa P103 | From Dr. Ruxana Sadikot, Emory University | N/A |
| Chemicals, Peptides, and Recombinant Proteins | ||
| Tamoxifen | Sigma Aldrich | Cat#T5648 |
| Dispase | Corning | Cat#354235 |
| TriZol | Thermo Fisher | Cat#15596018 |
| DNase I | Sigma Aldrich | Cat#D4263 |
| Fetal Bovine Serum | Sigma Aldrich | Cat#12306C |
| HEPES | Life Technology | Cat# 15630080 |
| Penicillin/streptomycin | GIBCO | Cat# 15140122 |
| Gentamicin/Amphotericin | Lonza | Cat# CC-4083 |
| DMEM | Corning Cellgro | Cat#10–013-CV |
| RIPA buffer | Cell Signaling Technology | Cat#9803 |
| cOmplete Protease Inhibitor Cocktail | Roche | Cat#11-836-145-001 |
| Red Blood Cell Lysis Buffer | BioLegend | Cat#420301 |
| Bovine Serum Albumin | MP Biomedicals | Cat#180549 |
| Normal Donkey Serum | Jackson Immunoresearch | Cat# 017-000-12 |
| Paraformaldehyde | Sigma Aldrich | Cat#P6148 |
| SYBR Green | Roche | Cat#04913914001 |
| SuperSignal West Pico Chemiluminescent Substrate | Thermo Scientific | Cat#34080 |
| SuperSignal West Femto Maximum Sensitivity Substrate | Thermo Scientific | Cat#34095 |
| Vectashield Antifade Mounting Medium | Vector Laboratories | Cat# H-1000 |
| Critical Commercial Assays | ||
| RNeasy Kit | QIAGEN | Cat#74104 |
| High-Capacity cDNA Reverse Transcription Kit | Applied Biosystems | Cat#4368814 |
| Micro BCA Protein Assay Kit | Thermo Scientific | Cat#23235 |
| in situ Cell Death Kit TMR | Sigma Aldrich | Cat#12156792910 |
| Deposited Data | ||
| RNA sequencing | NCBI Gene Expression Omnibus (GEO) database | Accession Number: GSE 124259 |
| Experimental Models: Organisms/Strains | ||
| Mouse: SpC-CreER: Sfptctm(cre/ERT2>Blh | Brigid Hogan, Duke University | N/A |
| Mouse: ROSA-ICN | Dr. Ben Stanger, University of Pennsylvania | N/A |
| Mouse: Dlk1flox: Dlk1tm1.1Jvs/J | The Jackson Laboratory | IMSR Cat# JAX:019074 |
| Mouse: Rosa-tomato:B6.Cg-Gt(ROSA)26Sortm9(CAG 81 tdTomato)Hze/J | The Jackson Laboratory | Stock No: 007914 |
| Mouse: Notch-Venus: Tg(Cp-HIST1H2BB/Venus)47Hadj/J | The Jackson Laboratory | IMSR Cat# JAX:020942 |
| Mouse: ROSA-dnMAML: | Dr. Warren Pear, University of Pennsylvania | N/A |
| Mouse: Rosa-YFP: B6.129X1-Gt(ROSA) 26Sortm 1(EYFP)Cos/J | The Jackson Laboratory | IMSR Cat# JAX:006148 |
| Mouse: C57BL/6 | The Jackson Laboratory | Stock No: 0664 |
| Oligonucleotides | ||
| Quantitative real-time PCR Primers | Table S1 | IDT or QIAGEN |
| Software and Algorithms | ||
| ImageJ | NIH | https://imagej.nih.gov/ij/ |
| ZEN v2.3 | Zeiss Microscopy | N/A |
| AxioVision LE | Zeiss Microscopy | N/A |
| QuantStudio v1.3 | Applied Biosystems | N/A |
| Summit (v4.3) | Beckman Coulter | N/A |
| Excel | Microsoft | N/A |
| Other | ||
| Western blot precast gels 4–20% SDS-PAGE gels | BioRad | Cat#456–1094 |
| PVDF | BioRad | Cat# 162–0177 |
| 20 μm nylon mesh | Small Parts | Cat#7050-1220-000-10 |
| Blood agar plates | Medex | Cat#HL-1160 |
Highlights.
Notch signaling is activated in type II cells after Pseudomonas aeruginosa injury
After peak in Notch activation, Dlk1 inhibits Notch signaling
Dlk1 disruption in type II cells impairs type II-to-type I cell transition
Dlk1 inhibition of Notch is necessary for the repair of alveolar injury
ACKNOWLEDGMENTS
We thank Dr. Stefan J. Green and the UIC RRC Genomic Research Division for the DNA methylation assay. We thank Dr. Rachel Zemans for helpful discussions. This work was supported by NIH grant HL105947 (to Y.L.), training grant 7829–23 (to J.F.), NIH grant HL134971(to K.V.P.), and NIH grant HL090152 (to A.B.M.).
Footnotes
SUPPLEMENTAL INFORMATION
Supplemental Information can be found with this article online at https://doi.org/10.1016/j.celrep.2019.02.046.
DECLARATION OF INTERESTS
The authors declare no competing interests.
REFERENCES
- Andersen DC, Laborda J, Baladron V, Kassem M, Sheikh SP, and Jensen CH (2013). Dual role of delta-like 1 homolog (DLK1) in skeletal muscle development and adult muscle regeneration. Development 140, 3743–3753. [DOI] [PubMed] [Google Scholar]
- Appelbe OK, Yevtodiyenko A, Muniz-Talavera H, and Schmidt JV (2013). Conditional deletions refine the embryonic requirement for Dlk1. Mech. Dev 130, 143–159. [DOI] [PMC free article] [PubMed] [Google Scholar]
- Barkauskas CE, Cronce MJ, Rackley CR, Bowie EJ, Keene DR, Stripp BR, Randell SH, Noble PW, and Hogan BL (2013). Type 2 alveolar cells are stem cells in adult lung. J. Clin. Invest 123, 3025–3036. [DOI] [PMC free article] [PubMed] [Google Scholar]
- Bash J, Zong WX, Banga S, Rivera A, Ballard DW, Ron Y, and Gélinas C (1999). Rel/NF-kappaB can trigger the Notch signaling pathway by inducing the expression of Jagged1, a ligand for Notch receptors. EMBO J. 18, 2803–2811. [DOI] [PMC free article] [PubMed] [Google Scholar]
- Chen Q, Suresh Kumar V, Finn J, Jiang D, Liang J, Zhao YY, and Liu Y (2017). CD44high alveolar type II cells show stem cell properties during steady-state alveolar homeostasis. Am. J. Physiol. Lung Cell. Mol. Physiol 313, L41–L51. [DOI] [PMC free article] [PubMed] [Google Scholar]
- Chignalia AZ, Vogel SM, Reynolds AB, Mehta D, Dull RO, Minshall RD, Malik AB, and Liu Y (2015). p120-catenin expressed in alveolar type II cells is essential for the regulation of lung innate immune response. Am. J. Pathol 185, 1251–1263. [DOI] [PMC free article] [PubMed] [Google Scholar]
- Crapo JD, Barry BE, Gehr P, Bachofen M, and Weibel ER (1982). Cell number and cell characteristics of the normal human lung. Am. Rev. Respir. Dis 126, 332–337. [DOI] [PubMed] [Google Scholar]
- D’Souza B, Meloty-Kapella L, and Weinmaster G (2010). Canonical and non-canonical Notch ligands. Curr. Top. Dev. Biol 92, 73–129. [DOI] [PMC free article] [PubMed] [Google Scholar]
- da Rocha ST, Charalambous M, Lin SP, Gutteridge I, Ito Y, Gray D, Dean W, and Ferguson-Smith AC (2009). Gene dosage effects of the imprinted delta-like homologue 1 (dlk1/pref1) in development: implications for the evolution of imprinting. PLoS Genet. 5, e1000392. [DOI] [PMC free article] [PubMed] [Google Scholar]
- Desai TJ, Brownfield DG, and Krasnow MA (2014). Alveolar progenitor and stem cells in lung development, renewal and cancer. Nature 507, 190–194. [DOI] [PMC free article] [PubMed] [Google Scholar]
- Dobbs LG (1990). Isolation and culture of alveolar type II cells. Am. J. Physiol 258, L134–L147. [DOI] [PubMed] [Google Scholar]
- Evans MJ, Cabral LJ, Stephens RJ, and Freeman G (1975). Transformation of alveolar type 2 cells to type 1 cells following exposure to NO2. Exp. Mol. Pathol 22, 142–150. [DOI] [PubMed] [Google Scholar]
- Falix FA, Aronson DC, Lamers WH, and Gaemers IC (2012). Possible roles of DLK1 in the Notch pathway during development and disease. Biochim. Biophys. Acta 1822, 988–995. [DOI] [PubMed] [Google Scholar]
- Flozak AS, Lam AP, Russell S, Jain M, Peled ON, Sheppard KA, Beri R, Mutlu GM, Budinger GR, and Gottardi CJ (2010). Beta-catenin/T-cell factor signaling is activated during lung injury and promotes the survival and migration of alveolar epithelial cells. J. Biol. Chem 285, 3157–3167. [DOI] [PMC free article] [PubMed] [Google Scholar]
- Foldi J, Chung AY, Xu H, Zhu J, Outtz HH, Kitajewski J, Li Y, Hu X, and Ivashkiv LB (2010). Autoamplification of Notch signaling in macrophages by TLR-induced and RBP-J-dependent induction of Jagged1. J. Immunol 185, 5023–5031. [DOI] [PMC free article] [PubMed] [Google Scholar]
- Gentleman RC, Carey VJ, Bates DM, Bolstad B, Dettling M, Dudoit S, Ellis B, Gautier L, Ge Y, Gentry J, et al. (2004). Bioconductor: open software development for computational biology and bioinformatics. Genome Biol 5, R80. [DOI] [PMC free article] [PubMed] [Google Scholar]
- Guseh JS, Bores SA, Stanger BZ, Zhou Q, Anderson WJ, Melton DA, and Rajagopal J (2009). Notch signaling promotes airway mucous metaplasia and inhibits alveolar development. Development 136, 1751–1759. [DOI] [PMC free article] [PubMed] [Google Scholar]
- Jain R, Barkauskas CE, Takeda N, Bowie EJ, Aghajanian H, Wang Q, Padmanabhan A, Manderfield LJ, Gupta M, Li D, et al. (2015). Plasticity of Hopx(+) type I alveolar cells to regenerate type II cells in the lung. Nat. Commun 6, 6727. [DOI] [PMC free article] [PubMed] [Google Scholar]
- Kopan R, and Ilagan MX (2009). The canonical Notch signaling pathway: unfolding the activation mechanism. Cell 137, 216–233. [DOI] [PMC free article] [PubMed] [Google Scholar]
- Lamar E, Deblandre G, Wettstein D, Gawantka V, Pollet N, Niehrs C, and Kintner C (2001). Nrarp is a novel intracellular component of the Notch signaling pathway. Genes Dev. 15, 1885–1899. [DOI] [PMC free article] [PubMed] [Google Scholar]
- Liu Y, Jiang H, Crawford HC, and Hogan BL (2003). Role for ETS domain transcription factors Pea3/Erm in mouse lung development. Dev. Biol 261, 10–24. [DOI] [PubMed] [Google Scholar]
- Liu J, Sato C, Cerletti M, and Wagers A (2010). Notch signaling in the regulation of stem cell self-renewal and differentiation. Curr. Top. Dev. Biol 92, 367–409. [DOI] [PubMed] [Google Scholar]
- Liu Y, Sadikot RT, Adami GR, Kalinichenko VV, Pendyala S, Natarajan V, Zhao YY, and Malik AB (2011). FoxM1 mediates the progenitor function of type II epithelial cells in repairing alveolar injury induced by Pseudomonas aeruginosa. J. Exp. Med 208, 1473–1484. [DOI] [PMC free article] [PubMed] [Google Scholar]
- Liu Y, Kumar VS, Zhang W, Rehman J, and Malik AB (2015). Activation of type II cells into regenerative stem cell antigen-1(+) cells during alveolar repair. Am. J. Respir. Cell Mol. Biol 53, 113–124. [DOI] [PMC free article] [PubMed] [Google Scholar]
- Love MI, Huber W, and Anders S (2014). Moderated estimation of fold change and dispersion for RNA-seq data with DESeq2. Genome Biol. 15, 550. [DOI] [PMC free article] [PubMed] [Google Scholar]
- Maillard I, Tu L, Sambandam A, Yashiro-Ohtani Y, Millholland J, Keeshan K, Shestova O, Xu L, Bhandoola A, and Pear WS (2006). The requirement for Notch signaling at the beta-selection checkpoint in vivo is absolute and independent of the pre-T cell receptor. J. Exp. Med 203, 2239–2245. [DOI] [PMC free article] [PubMed] [Google Scholar]
- Marconett CN, Zhou B, Sunohara M, Pouldar TM, Wang H, Liu Y, Rieger ME, Tran E, Flodby P, Siegmund KD, et al. (2017). Cross-Species Transcriptome Profiling Identifies New Alveolar Epithelial Type I Cell-Specific Genes. Am. J. Respir. Cell Mol. Biol 56, 310–321. [DOI] [PMC free article] [PubMed] [Google Scholar]
- Mason RJ (2006). Biology of alveolar type II cells. Respirology 11 (Suppl), S12–S15. [DOI] [PubMed] [Google Scholar]
- Matthay MA, Ware LB, and Zimmerman GA (2012). The acute respiratory distress syndrome. J. Clin. Invest 122, 2731–2740. [DOI] [PMC free article] [PubMed] [Google Scholar]
- Murtaugh LC, Stanger BZ, Kwan KM, and Melton DA (2003). Notch signaling controls multiple steps of pancreatic differentiation. Proc. Natl. Acad. Sci. USA 100, 14920–14925. [DOI] [PMC free article] [PubMed] [Google Scholar]
- Nabhan AN, Brownfield DG, Harbury PB, Krasnow MA, and Desai TJ (2018). Single-cell Wnt signaling niches maintain stemness of alveolar type 2 cells. Science 359, 1118–1123. [DOI] [PMC free article] [PubMed] [Google Scholar]
- Naqib A, Poggi S, Wang W, Hyde M, Kunstman K, and Green SJ (2018). Making and Sequencing Heavily Multiplexed, High-Throughput 16S Ribosomal RNA Gene Amplicon Libraries Using a Flexible, Two-Stage PCR Protocol. Methods Mol. Biol 1783, 149–169. [DOI] [PubMed] [Google Scholar]
- Nowotschin S, Xenopoulos P, Schrode N, and Hadjantonakis AK (2013). A bright single-cell resolution live imaging reporter of Notch signaling in the mouse. BMC Dev. Biol 13, 15. [DOI] [PMC free article] [PubMed] [Google Scholar]
- Palmer WH, and Deng WM (2015). Ligand-Independent Mechanisms of Notch Activity. Trends Cell Biol. 25, 697–707. [DOI] [PMC free article] [PubMed] [Google Scholar]
- Qiao R, Yan W, Clavijo C, Mehrian-Shai R, Zhong Q, Kim KJ, Ann D, Crandall ED, and Borok Z (2008). Effects of KGF on alveolar epithelial cell transdifferentiation are mediated by JNK signaling. Am. J. Respir. Cell Mol. Biol 38, 239–246. [DOI] [PMC free article] [PubMed] [Google Scholar]
- R Development Core-Team (2013). R: A language and environment for statistical computing (R Foundation for Statistical Computing; ). [Google Scholar]
- Ramirez MI, Millien G, Hinds A, Cao Y, Seldin DC, and Williams MC (2003). T1alpha, a lung type I cell differentiation gene, is required for normal lung cell proliferation and alveolus formation at birth. Dev. Biol 256, 61–72. [DOI] [PubMed] [Google Scholar]
- Rock JR, Barkauskas CE, Cronce MJ, Xue Y, Harris JR, Liang J, Noble PW, and Hogan BL (2011a). Multiple stromal populations contribute to pulmonary fibrosis without evidence for epithelial to mesenchymal transition. Proc. Natl. Acad. Sci. USA 108, E1475–E1483. [DOI] [PMC free article] [PubMed] [Google Scholar]
- Rock JR, Gao X, Xue Y, Randell SH, Kong YY, and Hogan BL (2011b). Notch-dependent differentiation of adult airway basal stem cells. Cell Stem Cell 8, 639–648. [DOI] [PMC free article] [PubMed] [Google Scholar]
- Rodríguez P, Higueras MA, González-Rajal A, Alfranca A, Fierro-Fernández M, García-Fernández RA, Ruiz-Hidalgo MJ, Monsalve M, Rodríguez-Pascual F, Redondo JM, et al. (2012). The non-canonical NOTCH ligand DLK1 exhibits a novel vascular role as a strong inhibitor of angiogenesis. Cardiovasc. Res 93, 232–241. [DOI] [PubMed] [Google Scholar]
- Sadikot RT, Zeng H, Joo M, Everhart MB, Sherrill TP, Li B, Cheng DS, Yull FE, Christman JW, and Blackwell TS (2006). Targeted immuno-modulation of the NF-kappaB pathway in airway epithelium impacts host defense against Pseudomonas aeruginosa. J. Immunol 176, 4923–4930. [DOI] [PubMed] [Google Scholar]
- Schindelin J, Arganda-Carreras I, Frise E, Kaynig V, Longair M, Pietzsch T, Preibisch S, Rueden C, Saalfeld S, Schmid B, et al. (2012). Fiji: an open-source platform for biological-image analysis. Nat. Methods 9, 676–682. [DOI] [PMC free article] [PubMed] [Google Scholar]
- Schmidt JV, Matteson PG, Jones BK, Guan XJ, and Tilghman SM (2000). The Dlk1 and Gtl2 genes are linked and reciprocally imprinted. Genes Dev. 14, 1997–2002. [PMC free article] [PubMed] [Google Scholar]
- Schneeberger EE (1997). Alveolar Type I Cells In The Lung: Scientific foundations, Crystal RG, West JB, Weibel ER, and Barnes PJ, eds. (Lippincott Williams & Wilkins; ), pp. 535–542. [Google Scholar]
- Schober A, Nazari-Jahantigh M, Wei Y, Bidzhekov K, Gremse F, Grommes J, Megens RT, Heyll K, Noels H, Hristov M, et al. (2014). MicroRNA-126–5p promotes endothelial proliferation and limits atherosclerosis by suppressing Dlk1. Nat. Med 20, 368–376. [DOI] [PMC free article] [PubMed] [Google Scholar]
- Schroeter EH, Kisslinger JA, and Kopan R (1998). Notch-1 signalling requires ligand-induced proteolytic release of intracellular domain. Nature 393, 382–386. [DOI] [PubMed] [Google Scholar]
- Shamis Y, Cullen DE, Liu L, Yang G, Ng SF, Xiao L, Bell FT, Ray C, Takikawa S, Moskowitz IP, et al. (2015). Maternal and zygotic Zfp57 modulate NOTCH signaling in cardiac development. Proc. Natl. Acad. Sci. USA 112, E2020–E2029. [DOI] [PMC free article] [PubMed] [Google Scholar]
- Smas CM, and Sul HS (1993). Pref-1, a protein containing EGF-like repeats, inhibits adipocyte differentiation. Cell 73, 725–734. [DOI] [PubMed] [Google Scholar]
- Smas CM, Green D, and Sul HS (1994). Structural characterization and alternate splicing of the gene encoding the preadipocyte EGF-like protein pref-1. Biochemistry 33, 9257–9265. [DOI] [PubMed] [Google Scholar]
- Stripp BR (2008). Hierarchical organization of lung progenitor cells: is there an adult lung tissue stem cell? Proc. Am. Thorac. Soc 5, 695–698. [DOI] [PMC free article] [PubMed] [Google Scholar]
- Suresh Kumar V, Sadikot RT, Purcell JE, Malik AB, and Liu Y (2014). Pseudomonas aeruginosa induced lung injury model. J. Vis. Exp 92, e52044. [DOI] [PMC free article] [PubMed] [Google Scholar]
- Takada S, Tevendale M, Baker J, Georgiades P, Campbell E, Freeman T, Johnson MH, Paulsen M, and Ferguson-Smith AC (2000). Delta-like and gtl2 are reciprocally expressed, differentially methylated linked imprinted genes on mouse chromosome 12. Curr. Biol 10, 1135–1138. [DOI] [PubMed] [Google Scholar]
- Tsao PN, Matsuoka C, Wei SC, Sato A, Sato S, Hasegawa K, Chen HK, Ling TY, Mori M, Cardoso WV, and Morimoto M (2016). Epithelial Notch signaling regulates lung alveolar morphogenesis and airway epithelial integrity. Proc. Natl. Acad. Sci. USA 113, 8242–8247. [DOI] [PMC free article] [PubMed] [Google Scholar]
- Vaughan AE, Brumwell AN, Xi Y, Gotts JE, Brownfield DG, Treutlein B, Tan K, Tan V, Liu FC, Looney MR, et al. (2015). Lineage-negative progenitors mobilize to regenerate lung epithelium after major injury. Nature 517, 621–625. [DOI] [PMC free article] [PubMed] [Google Scholar]
- Wang Y, Tang Z, Huang H, Li J, Wang Z, Yu Y, Zhang C, Li J, Dai H, Wang F, et al. (2018). Pulmonary alveolar type I cell population consists of two distinct subtypes that differ in cell fate. Proc. Natl. Acad. Sci. USA 115, 2407–2412. [DOI] [PMC free article] [PubMed] [Google Scholar]
- Weng T, Gao L, Bhaskaran M, Guo Y, Gou D, Narayanaperumal J, Chintagari NR, Zhang K, and Liu L (2009). Pleiotrophin regulates lung epithelial cell proliferation and differentiation during fetal lung development via beta-catenin and Dlk1. J. Biol. Chem 284, 28021–28032. [DOI] [PMC free article] [PubMed] [Google Scholar]
- Whitsett JA, Wert SE, and Weaver TE (2010). Alveolar surfactant homeostasis and the pathogenesis of pulmonary disease. Annu. Rev. Med 61, 105–119. [DOI] [PMC free article] [PubMed] [Google Scholar]
- Xing Y, Li A, Borok Z, Li C, and Minoo P (2012). NOTCH1 is required for regeneration of Clara cells during repair of airway injury. Stem Cells 30, 946–955. [DOI] [PMC free article] [PubMed] [Google Scholar]
- Yang J, Hernandez BJ, Martinez Alanis D, Narvaez del Pilar O, Vila-Ellis L, Akiyama H, Evans SE, Ostrin EJ, and Chen J (2016). The development and plasticity of alveolar type 1 cells. Development 143, 54–65. [DOI] [PMC free article] [PubMed] [Google Scholar]
- Yevtodiyenko A, and Schmidt JV (2006). Dlk1 expression marks developing endothelium and sites of branching morphogenesis in the mouse embryo and placenta. Dev. Dyn 235, 1115–1123. [DOI] [PubMed] [Google Scholar]
- Yoav B, and Yosef H (1995). Controlling the false discovery rate: a practical and powerful approach to multiple testin. J. R. Stat. Soc. B 57, 289–300. [Google Scholar]
- Zacharias WJ, Frank DB, Zepp JA, Morley MP, Alkhaleel FA, Kong J, Zhou S, Cantu E, and Morrisey EE (2018). Regeneration of the lung alveolus by an evolutionarily conserved epithelial progenitor. Nature 555, 251–255. [DOI] [PMC free article] [PubMed] [Google Scholar]
- Zhou B, Flodby P, Luo J, Castillo DR, Liu Y, Yu FX, McConnell A, Varghese B, Li G, Chimge NO, et al. (2018). Claudin-18-mediated YAP activity regulates lung stem and progenitor cell homeostasis and tumorigenesis. J. Clin. Invest 128, 970–984. [DOI] [PMC free article] [PubMed] [Google Scholar]
- Zhu NL, Asahina K, Wang J, Ueno A, Lazaro R, Miyaoka Y, Miyajima A, and Tsukamoto H (2012). Hepatic stellate cell-derived delta-like homolog 1 (DLK1) protein in liver regeneration. J. Biol. Chem 287, 10355–10367. [DOI] [PMC free article] [PubMed] [Google Scholar]
Associated Data
This section collects any data citations, data availability statements, or supplementary materials included in this article.
Supplementary Materials
Data Availability Statement
RNA sequencing data have been deposited in the NCBI Gene Expression Omnibus (GEO) database (Accession Number: GSE124259).