

Abstract
Background
Early dietary intakes may influence the development of allergic disease. It is important to determine if dietary polyunsaturated fatty acids (PUFAs) given as supplements or added to infant formula prevent the development of allergy.
Objectives
To determine the effect of higher PUFA intake during infancy to prevent allergic disease.
Search methods
We used the standard search strategy of the Cochrane Neonatal Review group to search the Cochrane Central Register of Controlled Trials (CENTRAL 2015, Issue 9), MEDLINE (1966 to 14 September 2015), EMBASE (1980 to 14 September 2015) and CINAHL (1982 to 14 September 2015). We also searched clinical trials databases, conference proceedings, and the reference lists of retrieved articles for randomised controlled trials and quasi‐randomised trials.
Selection criteria
Randomised and quasi‐randomised controlled trials that compared the use of a PUFA with no PUFA in infants for the prevention of allergy.
Data collection and analysis
Two review authors independently selected trials, assessed trial quality and extracted data from the included studies. We used fixed‐effect analyses. The treatment effects were expressed as risk ratio (RR) with 95% confidence intervals (CI). We used the GRADE approach to assess the quality of evidence.
Main results
The search found 17 studies that assessed the effect of higher versus lower intake of PUFAs on allergic outcomes in infants. Only nine studies enrolling 2704 infants reported allergy outcomes that could be used in meta‐analyses. Of these, there were methodological concerns for eight.
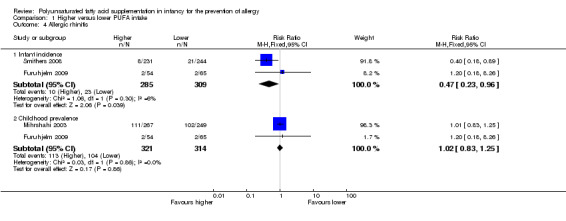
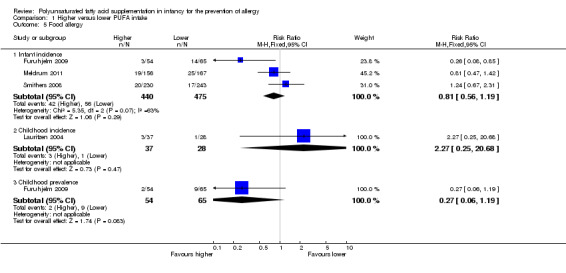
In infants up to two years of age, meta‐analyses found no difference in incidence of all allergy (1 study, 323 infants; RR 0.96, 95% CI 0.73 to 1.26; risk difference (RD) ‐0.02, 95% CI ‐0.12 to 0.09; heterogeneity not applicable), asthma (3 studies, 1162 infants; RR 1.04, 95% CI 0.80 to 1.35, I2 = 0%; RD 0.01, 95% CI ‐0.04 to 0.05, I2 = 0%), dermatitis/eczema (7 studies, 1906 infants; RR 0.93, 95% CI 0.82 to 1.06, I2 = 0%; RD ‐0.02, 95% CI ‐0.06 to 0.02, I2 = 0%) or food allergy (3 studies, 915 infants; RR 0.81, 95% CI 0.56 to 1.19, I2 = 63%; RD ‐0.02, 95% CI ‐0.06 to 0.02, I2 = 74%). There was a reduction in allergic rhinitis (2 studies, 594 infants; RR 0.47, 95% CI 0.23 to 0.96, I2 = 6%; RD ‐0.04, 95% CI ‐0.08 to ‐0.00, I2 = 54%; number needed to treat for an additional beneficial outcome (NNTB) 25, 95% CI 13 to ∞).
In children aged two to five years, meta‐analysis found no difference in incidence of all allergic disease (2 studies, 154 infants; RR 0.69, 95% CI 0.47 to 1.02, I2 = 43%; RD ‐0.16, 95% CI ‐0.31 to ‐0.00, I2 = 63%; NNTB 6, 95% CI 3 to ∞), asthma (1 study, 89 infants; RR 0.45, 95% CI 0.20 to 1.02; RD ‐0.20, 95% CI ‐0.37 to ‐0.02; heterogeneity not applicable; NNTB 5, 95% CI 3 to 50), dermatitis/eczema (2 studies, 154 infants; RR 0.65, 95% CI 0.34 to 1.24, I2 = 0%; RD ‐0.09 95% CI ‐0.22 to 0.04, I2 = 24%) or food allergy (1 study, 65 infants; RR 2.27, 95% CI 0.25 to 20.68; RD 0.05, 95% CI ‐0.07 to 0.16; heterogeneity not applicable).
In children aged two to five years, meta‐analysis found no difference in prevalence of all allergic disease (2 studies, 633 infants; RR 0.98, 95% CI 0.81 to 1.19, I2 = 36%; RD ‐0.01, 95% CI ‐0.08 to 0.07, I2 = 0%), asthma (2 studies, 635 infants; RR 1.12, 95% CI 0.82 to 1.53, I2 = 0%; RD 0.02, 95% CI ‐0.04 to 0.09, I2 = 0%), dermatitis/eczema (2 studies, 635 infants; RR 0.81, 95% CI 0.59 to 1.09, I2 = 0%; RD ‐0.04 95% CI ‐0.11 to 0.02, I2 = 0%), allergic rhinitis (2 studies, 635 infants; RR 1.02, 95% CI 0.83 to 1.25, I2 = 0%; RD 0.01, 95% CI ‐0.06 to 0.08, I2 = 0%) or food allergy (1 study, 119 infants; RR 0.27, 95% CI 0.06 to 1.19; RD ‐0.10, 95% CI ‐0.20 to ‐0.00; heterogeneity not applicable; NNTB 10, 95% CI 5 to ∞).
Authors' conclusions
There is no evidence that PUFA supplementation in infancy has an effect on infant or childhood allergy, asthma, dermatitis/eczema or food allergy. However, the quality of evidence was very low. There was insufficient evidence to determine an effect on allergic rhinitis.
Keywords: Child; Child, Preschool; Humans; Infant; Dietary Supplements; Asthma; Asthma/prevention & control; Dermatitis; Dermatitis/prevention & control; Fatty Acids, Unsaturated; Fatty Acids, Unsaturated/administration & dosage; Food Hypersensitivity; Food Hypersensitivity/prevention & control; Hypersensitivity; Hypersensitivity/epidemiology; Hypersensitivity/prevention & control; Prevalence; Randomized Controlled Trials as Topic; Rhinitis, Allergic; Rhinitis, Allergic/epidemiology; Rhinitis, Allergic/prevention & control
Plain language summary
Polyunsaturated fatty acid supplementation in infancy for the prevention of allergy
Review question
In infants, does supplementation of the diet with oil high in polyunsaturated fatty acids (PUFAs) result in a decreased risk of developing allergies such as asthma, dermatitis/eczema, hay fever (called allergic rhinitis) and food allergy in infancy and childhood?
Background
Allergy is responsible for a substantial health burden in infants, children and adults. Early dietary intakes may influence the development of allergic disease. Dietary PUFAs, such as fish oil, have a role in inflammatory conditions. It is important to determine if dietary PUFAs given as supplements or added to infant formula have the potential to prevent the development of allergy. PUFAs may be given to the breastfeeding mother, to the infant as a supplement (contents of a capsule) or added to infant formula.
Study characteristics
This review found 100 studies that assessed the effect of higher versus lower intake of PUFAs in infants through searches of medical databases up to September 2015. However, only nine of these studies enrolling 2704 infants reported allergy outcomes (measures). Of these nine studies, we considered only one to be high quality. Five studies reported all allergy as an outcome measure; four studies reported asthma; all nine studies reported dermatitis/eczema; two studies reported allergic rhinitis and four studies reported food allergy.
Key results
PUFA supplementation in infancy did not affect the risk of infant (aged up to two years of age) or childhood (aged up to 10 years of age) allergy, asthma, dermatitis/eczema and food allergy. There was a reduction in the risk of allergic rhinitis during infancy, however, there was no effect on the risk of childhood allergic rhinitis. There is insufficient evidence to determine an effect on allergic rhinitis.
Quality of evidence
We graded the evidence for no effect on infant incidence, childhood incidence and childhood prevalence of all allergy as very low; the reduction in infant incidence of allergic rhinitis as very low; and the evidence for no effect on infant incidence, childhood incidence and childhood prevalence of all other allergic outcomes as very low to low. Further high quality studies are needed before we can determine an effect of higher PUFA intake in infants on the risk of allergic disease.
Summary of findings
Summary of findings for the main comparison. Higher versus lower PUFA intake for the prevention of allergy ‐ infant incidence.
| Higher versus lower PUFA intake for the prevention of allergy ‐ infant incidence | ||||||
| Patient or population: infants Settings: hospital or community Intervention: higher versus lower PUFA intake | ||||||
| Outcomes | Illustrative comparative risks* (95% CI) | Relative effect (95% CI) | No of participants (studies) | Quality of the evidence (GRADE) | Comments | |
| Assumed risk | Corresponding risk | |||||
| Lower PUFA intake | Higher PUFA intake | |||||
| All allergic disease ‐ infant incidence Follow‐up: 1 years | Study population | RR 0.96 (0.73 to 1.26) | 323 (1 study) | ⊕⊝⊝⊝ very low1,2,3 | ‐ | |
| 395 per 1000 | 379 per 1000 (289 to 498) | |||||
| Moderate | ||||||
| 395 per 1000 | 379 per 1000 (288 to 498) | |||||
| Asthma ‐ infant incidence Follow‐up: 2 years | Study population | RR 1.04 (0.8 to 1.35) | 1162 (3 studies) | ⊕⊕⊝⊝ low4,5 | ‐ | |
| 160 per 1000 | 167 per 1000 (128 to 217) | |||||
| Moderate | ||||||
| 124 per 1000 | 129 per 1000 (99 to 167) | |||||
| Dermatitis/eczema ‐ infant incidence Follow‐up: 2 years | Study population | RR 0.93 (0.82 to 1.06) | 1906 (7 studies) | ⊕⊝⊝⊝ very low3,4,5 | ‐ | |
| 326 per 1000 | 303 per 1000 (267 to 346) | |||||
| Moderate | ||||||
| 323 per 1000 | 300 per 1000 (265 to 342) | |||||
| Allergic rhinitis ‐ infant incidence Follow‐up: 2 years | Study population | RR 0.47 (0.23 to 0.96) | 594 (2 studies) | ⊕⊝⊝⊝ very low3,4,5,6 | ‐ | |
| 74 per 1000 | 35 per 1000 (17 to 71) | |||||
| Moderate | ||||||
| 58 per 1000 | 27 per 1000 (13 to 56) | |||||
| Food allergy ‐ infant incidence Follow‐up: 2 years | Study population | RR 0.81 (0.56 to 1.19) | 915 (3 studies) | ⊕⊝⊝⊝ very low3,4,5,7 | ‐ | |
| 118 per 1000 | 95 per 1000 (66 to 140) | |||||
| Moderate | ||||||
| 150 per 1000 | 121 per 1000 (84 to 179) | |||||
| *The basis for the assumed risk (e.g. the median control group risk across studies) is provided in footnotes. The corresponding risk (and its 95% confidence interval) is based on the assumed risk in the comparison group and the relative effect of the intervention (and its 95% CI). CI: confidence interval; PUFA: polyunsaturated fatty acid; RR: risk ratio. | ||||||
| GRADE Working Group grades of evidence High quality: Further research is very unlikely to change our confidence in the estimate of effect. Moderate quality: Further research is likely to have an important impact on our confidence in the estimate of effect and may change the estimate. Low quality: Further research is very likely to have an important impact on our confidence in the estimate of effect and is likely to change the estimate. Very low quality: We are very uncertain about the estimate. | ||||||
1 Losses to follow‐up 2 Reported by single study only. 3 Wide confidence intervals. 4 Single high quality study. 5 Reported by a minority of studies. 6 Single study reported an effect. 7 Substantial heterogeneity.
Summary of findings 2. Higher versus lower PUFA intake for the prevention of allergy ‐ childhood incidence.
| Higher versus lower PUFA intake for the prevention of allergy ‐ childhood incidence | ||||||
| Patient or population: infants Settings: hospital or community Intervention: higher versus lower PUFA intake | ||||||
| Outcomes | Illustrative comparative risks* (95% CI) | Relative effect (95% CI) | No of participants (studies) | Quality of the evidence (GRADE) | Comments | |
| Assumed risk | Corresponding risk | |||||
| Lower PUFA intake | Higher PUFA intake | |||||
| All allergic disease ‐ childhood incidence Follow‐up: 3 years | Study population | RR 0.69 (0.47 to 1.02) | 154 (2 studies) | ⊕⊝⊝⊝ very low1,2,3,4 | ‐ | |
| 519 per 1000 | 358 per 1000 (244 to 529) | |||||
| Moderate | ||||||
| 483 per 1000 | 333 per 1000 (227 to 493) | |||||
| Asthma ‐ childhood incidence Follow‐up: 3 years | Study population | RR 0.45 (0.2 to 1.02) | 89 (1 study) | ⊕⊝⊝⊝ very low1,3,5 | ‐ | |
| 353 per 1000 | 159 per 1000 (71 to 360) | |||||
| Moderate | ||||||
| 353 per 1000 | 159 per 1000 (71 to 360) | |||||
| Dermatitis/eczema ‐ childhood incidence Follow‐up: 3 years | Study population | RR 0.65 (0.34 to 1.24) | 154 (2 studies) | ⊕⊝⊝⊝ very low1,3,4 | ‐ | |
| 266 per 1000 | 173 per 1000 (90 to 330) | |||||
| Moderate | ||||||
| 238 per 1000 | 155 per 1000 (81 to 295) | |||||
| Food allergy ‐ childhood incidence Follow‐up: 3 years | Study population | RR 2.27 (0.25 to 20.68) | 65 (1 study) | ⊕⊝⊝⊝ very low1,3,5 | ‐ | |
| 36 per 1000 | 81 per 1000 (9 to 739) | |||||
| Moderate | ||||||
| 36 per 1000 | 82 per 1000 (9 to 744) | |||||
| *The basis for the assumed risk (e.g. the median control group risk across studies) is provided in footnotes. The corresponding risk (and its 95% confidence interval) is based on the assumed risk in the comparison group and the relative effect of the intervention (and its 95% CI). CI: confidence interval; PUFA: polyunsaturated fatty acid; RR: risk ratio. | ||||||
| GRADE Working Group grades of evidence High quality: Further research is very unlikely to change our confidence in the estimate of effect. Moderate quality: Further research is likely to have an important impact on our confidence in the estimate of effect and may change the estimate. Low quality: Further research is very likely to have an important impact on our confidence in the estimate of effect and is likely to change the estimate. Very low quality: We are very uncertain about the estimate. | ||||||
1 Very high losses to follow‐up. 2 Moderate heterogeneity. 3 Wide confidence intervals. 4 Minority of studies reported outcome. 5 Reported by single study.
Summary of findings 3. Higher versus lower PUFA intake for the prevention of allergy ‐ Childhood prevalence.
| Higher versus lower PUFA intake for the prevention of allergy ‐ childhood prevalence | ||||||
| Patient or population: infants Settings: hospital or community Intervention: higher versus lower PUFA intake | ||||||
| Outcomes | Illustrative comparative risks* (95% CI) | Relative effect (95% CI) | No of participants (studies) | Quality of the evidence (GRADE) | Comments | |
| Assumed risk | Corresponding risk | |||||
| Lower PUFA intake | Higher PUFA intake | |||||
| All allergic disease ‐ childhood prevalence Follow‐up: 3 years | Study population | RR 0.98 (0.81 to 1.19) | 633 (2 studies) | ⊕⊝⊝⊝ very low1,2,3 | ‐ | |
| 394 per 1000 | 386 per 1000 (319 to 469) | |||||
| Moderate | ||||||
| 372 per 1000 | 365 per 1000 (301 to 443) | |||||
| Asthma ‐ childhood prevalence Follow‐up: 3 years | Study population | RR 1.12 (0.82 to 1.53) | 635 (2 studies) | ⊕⊝⊝⊝ very low1,3,4,5 | ‐ | |
| 188 per 1000 | 210 per 1000 (154 to 287) | |||||
| Moderate | ||||||
| 164 per 1000 | 184 per 1000 (134 to 251) | |||||
| Dermatitis/eczema ‐ childhood prevalence Follow‐up: 3 years | Study population | RR 0.81 (0.59 to 1.09) | 635 (2 studies) | ⊕⊝⊝⊝ very low1,2,3 | ‐ | |
| 229 per 1000 | 186 per 1000 (135 to 250) | |||||
| Moderate | ||||||
| 219 per 1000 | 177 per 1000 (129 to 239) | |||||
| Allergic rhinitis ‐ childhood prevalence Follow‐up: 3 years | Study population | RR 1.02 (0.83 to 1.25) | 635 (2 studies) | ⊕⊝⊝⊝ very low1,2,3 | ‐ | |
| 331 per 1000 | 338 per 1000 (275 to 414) | |||||
| Moderate | ||||||
| 220 per 1000 | 224 per 1000 (183 to 275) | |||||
| Food allergy ‐ childhood prevalence Follow‐up: 3 years | Study population | RR 0.27 (0.06 to 1.19) | 119 (1 study) | ⊕⊝⊝⊝ very low2,4 | ‐ | |
| 138 per 1000 | 37 per 1000 (8 to 165) | |||||
| Moderate | ||||||
| 139 per 1000 | 38 per 1000 (8 to 165) | |||||
| *The basis for the assumed risk (e.g. the median control group risk across studies) is provided in footnotes. The corresponding risk (and its 95% confidence interval) is based on the assumed risk in the comparison group and the relative effect of the intervention (and its 95% CI). CI: confidence interval; PUFA: polyunsaturated fatty acid; RR: risk ratio. | ||||||
| GRADE Working Group grades of evidence High quality: Further research is very unlikely to change our confidence in the estimate of effect. Moderate quality: Further research is likely to have an important impact on our confidence in the estimate of effect and may change the estimate. Low quality: Further research is very likely to have an important impact on our confidence in the estimate of effect and is likely to change the estimate. Very low quality: We are very uncertain about the estimate. | ||||||
1 Losses to follow‐up > 10%. 2 Wide confidence intervals. 3 Reported by a minority of studies. 4 Reported by single study. 5 Very high losses to follow‐up.
Background
Description of the condition
Allergic conditions such as asthma, eczema and allergic rhinitis are common in many countries. Estimated prevalence rates of asthma, eczema and allergic rhinitis in children vary significantly between countries. Research published by the International Study of Asthma and Allergies Steering Committee (ISAAC) found that the prevalence of asthma symptoms in children aged six to seven years ranged from 2.4% to 37.6% in different countries, eczema symptoms ranged from 0.9% to 22.5% and allergic rhino‐conjunctivitis symptoms ranged from 4.2% to 12.7% (Ait‐Khaled 2009; Lai 2009; Odhiambo 2009). Risk of allergy is affected by heredity, with approximately 10% of children without an allergic first‐degree relative developing allergic disease compared to 20% to 30% with an allergic first‐degree relative (parent or sibling) and 40% to 50% with two affected relatives (Arshad 1993; Kjellman 1977). Although the reported prevalence in adult populations is less than in child populations, atopic disease still remains a significant problem in adulthood (Gupta 2004).
There is heterogeneous evidence linking dietary intake during pregnancy (Notenbloom 2011; Romieu 2007; Willers 2007; Willers 2008), lactation (Hoppu 2000; Nwaru 2011), and infancy (Hesselmar 2010; Kull 2006; Nagel 2010; Nurmatov 2011; Suarez‐Varela 2010; Tromp 2011; Virtanen 2010; Willers 2011), with the development of allergy including asthma (Kull 2006; Nagel 2010; Nurmatov 2011; Romieu 2007; Virtanen 2010; Willers 2007; Willers 2008; Willers 2011), eczema (Hesselmar 2010; Kull 2006; Notenbloom 2011; Romieu 2007; Suarez‐Varela 2010; Willers 2007), and allergic rhinitis (Kull 2006; Virtanen 2010). Specifically, it has been reported that a high exposure to fish oil during pregnancy and infancy may reduce sensitisation to common food allergens and reduce the prevalence of allergy (Kremmyda 2011). This includes reductions in prevalence in asthma (Kull 2006; Romieu 2007), eczema (Hesselmar 2010; Kull 2006; Notenbloom 2011; Romieu 2007), and allergic rhinitis (Kull 2006; Virtanen 2010).
Description of the intervention
Interventions that have been investigated for prevention of atopic disease have included environmental allergen reduction (Chan‐Yeung 2000), dietary interventions such as removal of allergenic foods from the maternal (Falth‐Magnussen 1992; Lilja 1989) or infant diet (Osborn 2006a; Osborn 2006b), breastfeeding (Gdalevich 2001a; Gdalevich 2001b; Mimouni Bloch 2002), and the use of prebiotics (Osborn 2007a) and probiotics (Osborn 2007b).
Polyunsaturated fatty acid (PUFAs) are classified by the location of the first double bond in relation to the carbon at the methyl end of the fatty acid (the omega carbon). Linoleic acid and α‐linolenic acid are the only essential fatty acids, meaning they cannot be produced endogenously and must be ingested. A proportion of these essential fatty acids are metabolised to produce omega‐3 long‐chain PUFAs (e.g. docosahexaenoic acid) and omega‐6 long‐chain PUFAs (e.g. arachidonic acid). Alternatively, long‐chain PUFAs can be ingested directly in the diet by eating foods such as oily fish and fish oil. Directly ingesting PUFAs in long‐chain form avoids the dilution effect of the metabolic pathway (Yaqoob 2007). Maternal dietary intake of long‐chain PUFAs and lifestyle influence the long‐chain PUFA levels available for transfer to the foetus. Human milk provides linoleic acid, α‐linolenic acid, docosahexaenoic acid, arachidonic acid and other long‐chain PUFAs to breastfed infants.
There are substantial reported variations in infant dietary PUFA intakes in the first year of life including the ratios of omega‐6 to omega‐3 PUFAs. One study assessing intakes at three months reported actual mean intakes were: linoleic acid 3602 mg/day, α‐linolenic acid 414 mg/day, arachidonic acid 103 mg/day, docosahexaenoic acid 57 mg/day with ratios of linoleic acid:α‐linolenic acid of 8.7 and omega‐6:omega‐3 fatty acid of 7.9. At nine months, reported actual mean intakes were: linoleic acid 5544 mg/day, α‐linolenic acid 653 mg/day, arachidonic acid 24 mg/day and docosahexaenoic acid 28 mg/day with ratios of linoleic acid:α‐linolenic acid of 8.5 and omega‐6:omega‐3 fatty acid of 8.0 (Schwartz 2010).
The Food and Nutrition Board: Institute of Medicine (FNB:IOM) and the National Health and Medical Research Council (NHMRC) have published nutrient reference values for American/Canadian and Australian/New Zealand populations, respectively with guidelines for adequate intake of PUFAs based on a range of studies measuring PUFA concentration in the breast milk of healthy mothers (FNB:IOM 2005; NHMRC 2006). The guidelines set adequate intakes by multiplying mean daily breast milk intake by the mean PUFA concentration in breast milk. They then added the median intake of PUFAs from complementary foods to the calculated breast milk intake in the seven‐ to 12‐month age group. Both groups published guideline intakes of omega‐6 fatty acids of 4.4 g/day and omega‐3 fatty acids of 0.5 g/day at zero to six months of age and guideline intakes of omega‐6 fatty acids of 4.6 g/day and omega‐3 fatty acids 0.5 g/day at seven to 12 months of age (FNB:IOM 2005; NHMRC 2006).
Essential fatty acids including long‐chain PUFAs may be consumed as part of the diet through breast milk, formula and food, or as supplements at any stage in the life cycle. For the purpose of this review, we considered supplementation to achieve PUFA intake and ratios of omega‐6:omega‐3 PUFAs similar to the above guidelines as 'intermediate', supplementation less than 50% of the recommended intake as 'low', and supplementation greater than 50% above guidelines as 'high' (FNB:IOM 2005; NHMRC 2006).
PUFA supplements are generally well tolerated with no associated serious adverse effects. There is a theoretical risk of prolonged bleeding time and immune suppression associated with excessive long‐chain omega‐3 fatty acid intake; however, clinical trial evidence has not supported this (NHMRC 2006). Omega‐3 fatty acid preparations may be prone to undergoing oxidation, which may contribute to a person's intolerance and potential toxicity. If the PUFA supplement is derived from fish oil, there is a theoretical potential for food allergy reaction although there are few data to support this. If PUFA supplements are derived from large amounts of fish oil in unpurified preparations this may result in adverse experiences owing to the potential presence of environmental toxins such as mercury, polychlorinated biphenyls, dioxins and other contaminants (Bays 2007). Omega‐3 fatty acid supplementation for adults or children is thought to have an acceptable safety profile (Schachter 2004), although studies investigating the influence of omega‐3 fatty acids on child and maternal health reveal the absence of data for a safety profile (Lewin 2005).
How the intervention might work
Arachidonic acid is a pro‐inflammatory omega‐6 PUFA. Increased dietary intake of this or other omega‐6 PUFAs, such as linoleic acid, a precursor to arachidonic acid, can increase the production of inflammatory eicosanoids such as prostaglandin E2 and leukotriene B4 (Calder 2006). Arachidonic acid‐derived eicosanoids are involved in the production of inflammation in allergic diseases such as asthma, eczema and allergic rhinitis. Specifically, prostaglandin E2 is involved in regulating the development of the T helper type 2 cell populations that are involved in the development of allergic disease (Calder 2006). Increased dietary intake of omega‐3 PUFAs such as eicosapentaenoic acid and docosahexaenoic acid have been found to decrease the production of inflammatory mediators by inflammatory cells by acting as a competitive substrate with arachidonic acid, producing mediators that are less inflammatory than those made from arachidonic acid (Calder 2006). There is also evidence that eicosapentaenoic acid is a substrate for production of mediators that have an anti‐inflammatory effect (Calder 2006), and that omega‐3 PUFAs may influence expression of genes involved in the inflammatory cascade (Deckelbaum 2006).
Populations that have diets that are naturally high in omega‐3 PUFAs have a lower incidence of inflammatory conditions (Kromann 1980), which has prompted the investigation of supplementation to prevent and treat disease. With respect to treatment, increasing dietary intake of omega‐3 PUFAs has been shown to be efficacious in decreasing inflammation in conditions such as rheumatoid arthritis (Goldberg 2007). However, this effect has not been observed in the treatment of allergy, with one Cochrane review of omega‐3 in the treatment of established asthma in adults and children over the age of two years showing no evidence of benefit (Thien 2002). The aim of this review was to look at the evidence for use of dietary PUFA supplements in infancy for the prevention of allergic disease.
Why it is important to do this review
Allergy is responsible for a substantial health burden in infants, children and adults (ASCIA 2007). Early dietary intakes may influence the development of allergic disease. Knowledge of the effectiveness of these interventions provides scope to avert the development of allergic disease. It is important to determine if dietary PUFAs given as supplements or added to infant formula have the potential to prevent the development of allergy.
Objectives
Primary objective:
to determine the effect of higher PUFA intake during infancy to prevent allergic disease.
Secondary objectives:
to determine the effect of specific PUFA supplements;
to determine the effect of PUFA supplements in 1) predominantly human milk fed infants, 2) predominantly cow or soy formula fed infants, 3) predominantly hydrolysed formula fed infants, and 4) infants who have commenced complementary feeding (solids);
to determine the effect of PUFAs in 1) infants not selected for risk of allergy, 2) infants at low risk, and 3) infants at high risk of allergy (at least one first‐degree relative with allergic disease);
to determine the effect of PUFAs in 1) low birth weight or preterm infants and 2) term infants.
Methods
Criteria for considering studies for this review
Types of studies
Randomised and quasi‐randomised controlled trials or cluster randomised trials.
Types of participants
Infants enrolled in their first year of life without clinical evidence of allergic disease at time of enrolment.
Types of interventions
Separate comparisons included the following:
supplementation of the infant diet in the first year with PUFA versus placebo or no treatment;
supplementation of lactating mothers who were breastfeeding in the first year with PUFA versus placebo or no treatment;
supplementation with higher omega‐3:omega‐6 ratio PUFA compared to supplement with lower omega‐3:omega‐6 ratio PUFA in the first year;
supplementation of lactating mothers who were breastfeeding in the first year with higher omega‐3:omega‐6 ratio PUFA compared to supplement with lower omega‐3:omega‐6 ratio PUFA.
For the purposes of this review, we considered supplementation to achieve PUFA intake and ratios of omega‐6:omega‐3 PUFA similar to infant guidelines as intermediate intake, supplementation less than 50% of the recommended intake considered as low intake and supplementation greater than 50% above guidelines considered as high intake (FNB:IOM 2005; NHMRC 2006).
Studies that supplemented the infant diet for less than one month were not eligible for inclusion.
Studies that used other differential co‐interventions that differed between treatment and control groups were not be eligible for inclusion unless there was convincing data that the intervention/outcome of interest was not affected by the co‐intervention.
Studies that supplemented pregnant women without providing postnatal supplementation to lactating mothers or their infants were not eligible for inclusion.
Types of outcome measures
Primary outcomes
All allergic disease including asthma, dermatitis/eczema, rhinitis or food allergy (analysis restricted to studies reporting composite manifestations of all allergic disease).
Secondary outcomes
Asthma.
Dermatitis/eczema.
Allergic rhinitis.
Cow's milk protein allergy.
Soy protein allergy.
Food allergy.
Urticaria.
Anaphylaxis.
We listed food hypersensitivity as a secondary outcome in the protocol. We decided to omit this as the review focused on clinical allergic outcomes. The term 'hypersensitivity' includes clinical reactions that are not related to allergy.
Definitions of allergic disease were consistent with the Revised nomenclature for allergy for global use: report of the Nomenclature Review Committee of the World Allergy Organization, October 2003 (Johansson 2004).
A specific allergic disease was diagnosed on the basis of:
a history of recurrent and persistent symptoms typical of the allergic disease;
a clinician diagnosis of allergic disease based on clinical findings supported by the above history;
clinical allergic disease confirmed by testing including detection of allergen sensitisation by either skin prick testing or serological testing for specific immunoglobulin (Ig)E (e.g. radioallergosorbent test (RAST), enzyme allergosorbent test (EAST) or CAP system), asthma confirmed by respiratory function testing for presence of bronchial hyper‐responsiveness.
We assessed primary and secondary outcomes using the following definitions of age:
infant allergic disease incidence: allergic disease occurring up to two years of age;
childhood allergic disease incidence: allergic disease occurring up to 10 years of age;
childhood allergic disease prevalence: allergic disease reported that is present between two and 10 years of age;
adolescent allergic disease: allergic disease present from 10 to 18 years of age;
adult allergic disease: allergic disease present after 18 years of age.
In relation to the above definitions of primary and secondary outcomes:
prevalence reflects the number of cases in the population at each given time point;
incidence reflects the number of new cases diagnosed during the defined time period
Search methods for identification of studies
See: Collaborative Review Group search strategy.
Electronic searches
We used the criteria and standard methods of the Cochrane and the Cochrane Neonatal Review Group (see the Cochrane Neonatal Group search strategy for specialized register).
We conducted a comprehensive search including: the Cochrane Central Register of Controlled Trials (CENTRAL 2015, Issue 9); MEDLINE (1996 to 14 September 2015); EMBASE (1980 to 14 September 2015) and CINAHL (1982 to 14 September 2015) using the following search terms: (allergies OR hypersensitivity OR asthma OR eczema OR rash OR hayfever OR rhinitis OR urticaria OR atopy OR atopic) AND (Dietary Fats, Unsaturated.Me OR Omega‐3 OR Omega‐6 OR Linolenic OR Docosahexaenoic OR Eicosapentaenoic OR Linoleic OR polyunsaturate* OR PUFA), plus database‐specific limiters for RCTs and neonates (see Appendix 1, Appendix 2, and Appendix 3 for the full search strategies). We applied no language restrictions.
We searched clinical trials registries for ongoing or recently completed trials (clinicaltrials.gov; anzctr.org.au; the World Health Organization's International Trials Registry and Platform www.whoint/ictrp/search/en/, and the ISRCTN Registry).
Searching other resources
In addition, we supplemented the search by searches of previous reviews including cross references (all articles referenced) and abstracts of conferences (Pediatric Academic Societies 1998 to latest issue; Perinatal Society of Australia and New Zealand 1998 to latest issue; American College of Allergy, Asthma and Immunology (ACAAI); American Academy of Allergy, Asthma, and Immunology (AAAAI); European Academy of Allergy and Clinical Immunology (EAACI) and World Allergy Organization Congresses).
Data collection and analysis
We used standard methods of Cochrane and its Neonatal Review Group.
Selection of studies
Two review authors (TS, DAO) independently assessed study eligibility for inclusion in this review according to prespecified selection criteria.
Data extraction and management
Two review authors (TS, DAO) independently extracted data from the full‐text articles of potentially relevant trials using a specifically designed spreadsheet to manage information. We used these forms to decide trial inclusion/exclusion, extract data from eligible trials and for requesting additional unpublished information from authors of the original reports. We entered and cross‐checked data using Review Manager 5 software (RevMan 2014). We compared the extracted data for any differences. We resolved differences by mutual discussion and consensus.
Assessment of risk of bias in included studies
Two review authors (TS, DAO) independently assessed the risk of bias (low, high or unclear) of all included trials using the Cochrane 'Risk of bias' tool (Higgins 2011) for the following domains:
selection bias;
performance bias;
attrition bias;
reporting bias;
detection bias;
or any other bias.
We resolved any disagreements by discussion or by a third review author. See Appendix 4 for a more detailed description of risk of bias for each domain.
Measures of treatment effect
We analysed treatment effects in the individual trials using Review Manager 5 (RevMan 2014).
Dichotomous data
We reported dichotomous data using risk ratio (RR) and risk difference (RD) with respective 95% confidence intervals (CI). We determined statistical differences between groups primarily using the RR. For statistically significant RDs, we calculated the number needed to treat for an additional beneficial outcome (NNTB) or number needed to treat for an additional harmful outcome (NNTH) and associated 95% CIs.
Unit of analysis issues
The unit of randomisation was the intended unit of analysis (individual infant).
Cluster‐randomised trials
We planned to include cluster randomised trials in the analyses along with individually randomised trials. We intended to analyse them using the methods described in the Cochrane Handbook for Systematic Reviews of Interventions (Higgins 2011) using an estimate of the intra‐cluster correlation coefficient (ICC) derived from the trial (if possible), or from another source. If ICCs from other sources are used, we intended to report this and conduct sensitivity analyses to investigate the effect of variation in the ICC. If we identified both cluster randomised trials and individually randomised trials, we planned to synthesise the relevant information. We planned to combine the results from both if there was little heterogeneity between the study designs and if we considered interaction between the effect of intervention and the choice of randomisation unit to be unlikely. We identified no cluster‐randomised trials.
Dealing with missing data
We requested missing data from the authors of each trial where outcome data were incomplete or unclear. Analysis was by intention to treat. If the data were available, we used the last observation carried forward to the final assessment (LOCF) method. Where data were still missing, we included the reported infants and examined the effect of losses in a sensitivity analysis according to study quality.
Assessment of heterogeneity
We used Review Manager 5 software to assess heterogeneity of treatment effects between trials (RevMan 2014). We used the following two formal statistics.
The Chi2 test, to assess whether observed variability in effect sizes between studies was greater than would be expected by chance. Since this test has low power when the number of studies included in the meta‐analysis is small, we set the probability at the 10% level of significance.
The I2 statistic to ensure that pooling of data was valid. We graded the degree of heterogeneity as: less than 25% = none; 25% to 49% = low; 50% to 74% = moderate and 75% or greater = high heterogeneity.
Where there was evidence of apparent or statistical heterogeneity, we assessed the source of the heterogeneity using sensitivity and subgroup analysis looking for evidence of bias or methodological differences between trials.
Assessment of reporting biases
We assessed reporting and publication bias by evaluating individual studies.
Data synthesis
We performed statistical analyses according to the recommendations of the Cochrane Neonatal Review Group (neonatal.cochrane.org/en/index.html). We analysed all infants randomised on an intention‐to‐treat basis. We analysed treatment effects in the individual trials. We used a fixed‐effect model for meta‐analysis in the first instance to combine the data. Where moderate heterogeneity existed, we examined the potential cause of heterogeneity in subgroup and sensitivity analyses. When we judged meta‐analysis to be inappropriate, we analysed and interpreted individual trials separately. For estimates of typical RR and RD, we used the Mantel‐Haenszel method.
Quality of evidence
We used the GRADE approach, as outlined in the GRADE Handbook (Schünemann 2013), to assess the quality of evidence for the following (clinically relevant) outcomes:
-
All allergic disease:
infant incidence,
childhood incidence,
childhood prevalence;
-
Asthma:
infant incidence,
childhood incidence,
childhood prevalence;
-
Dermatitis/eczema:
infant incidence,
childhood incidence,
childhood prevalence;
-
Allergic rhinitis:
infant incidence,
childhood prevalence;
-
Food allergy:
infant incidence,
childhood incidence,
childhood prevalence.
Two review authors (TS, DAO) independently assessed the quality of the evidence for each of the outcomes above. We considered evidence from randomised controlled trials as high quality but downgraded the evidence one level for serious (or two levels for very serious) limitations based upon the following: design (risk of bias), consistency across studies, directness of the evidence, precision of estimates and presence of publication bias. We used the GRADEpro 2008 Guideline Development Tool to create 'Summary of findings' tables to report the quality of the evidence.
The GRADE approach results in an assessment of the quality of a body of evidence in one of four grades.
High: we are very confident that the true effect lies close to that of the estimate of the effect.
Moderate: we are moderately confident in the effect estimate: the true effect is likely to be close to the estimate of the effect, but there is a possibility that it is substantially different.
Low: our confidence in the effect estimate is limited: the true effect may be substantially different from the estimate of the effect.
Very low: we have very little confidence in the effect estimate: the true effect is likely to be substantially different from the estimate of effect
Subgroup analysis and investigation of heterogeneity
We prespecified the following subgroup analyses.
According to specific PUFA supplements:
supplements high in omega‐3 PUFA;
supplements high in omega‐6 PUFA.
According to method of infant feeding:
predominantly human milk fed infants;
predominantly cow's milk or soy formula fed infants;
predominantly hydrolysed formula fed infants;
infants who had commenced complementary feeding (solids).
According to infant heredity for allergy:
infants not selected for risk of allergy;
infants at low risk of allergy;
infants at high risk of allergy (at least one first‐degree relative with allergic disease).
According to gestational age at birth or birth weight:
infants born at or near term with birth weight appropriate for gestation;
infants born prematurely (less than 37 weeks) or low birth weight (less than 2500 g).
Sensitivity analysis
We performed a sensitivity analysis to determine if the findings were affected by including only studies of adequate methodology, defined as adequate randomisation and allocation concealment, blinding of intervention and measurement, and less than 10% losses to follow‐up.
Results
Description of studies
Results of the search
The CENTRAL search strategy found 1079 records, the MEDLINE search strategy 875 records and the EMBASE search strategy 336 records. Of these, we assessed 122 full studies for eligibility resulting in 17 included studies and 105 excluded studies.
We assessed five studies as ongoing (Caplan 2013; Collins 2012; Gianni 2012; Liu 2013; Millett 2010).
Of these:
Caplan 2013; Collins 2012; and Millett 2010 enrolled preterm infants not selected for allergy risk and have not reported allergy outcomes to date.
Gianni 2012 enrolled healthy, term, formula fed infants not selected for risk of allergy and have not reported allergy outcomes to date.
Liu 2013 enrolled healthy, term, human milk fed infants at high risk of allergy (maternal supplementation) and have not reported allergy outcomes to date.
Included studies
We assessed 17 studies that investigated PUFA supplementation in infancy as eligible for inclusion (see Characteristics of included studies table for details of studies).
Nine studies reported allergy outcome data that we were able to extract for use in this review (Birch 2005; Furuhjelm 2009; Kitz 2006; Lauritzen 2004; Linnamaa 2010; Meldrum 2011; Mihrshahi 2003; Smithers 2008; van Gool 2003).
-
For eight included studies, we could not extract allergy data (Damsgaard 2006; Fewtrell 2004; Hayes 1992; Hoffman 2008; Lucas 1999; Makrides 2002; Morris 2000; O'Connor 2001). None of these studies enrolled mothers and infants considered at high risk of allergy. Of these:
six studies measured allergy outcomes but did not report allergy data able to be included in the review. Fewtrell 2004 recorded prevalence of asthma and eczema but did not report data; Hayes 1992 reported using a parental diary recording formula acceptance and tolerance but did not report allergy; Hoffman 2008 reported atopic dermatitis severity but not incidence; Lucas 1999 reported allergy outcomes as odds ratios only we were unable to use the data; Morris 2000 reported allergic symptoms measured but did not report allergy; O'Connor 2001 reported serious adverse events including asthma and wheezing but did not report allergy separately.
Damsgaard 2006 reported allergy at baseline only.
Makrides 2002 reported plasma indices of atopy (egg yolk and egg white RAST) but did not report allergy.
The following description of studies is restricted to the nine studies reporting allergy outcomes used in the review.
Types of participants (studies that reported allergy)
-
Risk of allergy:
five studies enrolled infants at high risk of allergy (Furuhjelm 2009; Kitz 2006; Meldrum 2011; Mihrshahi 2003; van Gool 2003);
four studies enrolled infants not selected for risk of allergy (Birch 2005; Lauritzen 2004; Linnamaa 2010; Smithers 2008).
-
Infant feeding:
six studies enrolled infants that were predominantly human milk fed (Furuhjelm 2009; Lauritzen 2004; Linnamaa 2010; Meldrum 2011; Mihrshahi 2003; Smithers 2008);
two studies enrolled infants that were predominantly cow's milk formula fed (Birch 2005; van Gool 2003);
Kitz 2006 enrolled infants that were either exclusively human milk fed or cow's milk formula fed.
-
Gestational age at birth or birth weight:
Smithers 2008 enrolled preterm infants;
all other studies enrolled infants born at or near term with birth weight appropriate for gestation.
Types of interventions (studies that reported allergy)
See Characteristics of included studies table for specific dietary intakes of women and infants in intervention and control groups.
Seven studies supplemented with higher omega‐3:omega‐6 ratio PUFA compared to lower omega‐3:omega‐6 ratio PUFA (Birch 2005; Furuhjelm 2009; Lauritzen 2004; Linnamaa 2010; Meldrum 2011; Mihrshahi 2003; Smithers 2008). Five studies used fish oil as their source of PUFA (Furuhjelm 2009; Lauritzen 2004; Meldrum 2011; Mihrshahi 2003; Smithers 2008). Linnamaa 2010 used blackcurrant seed oil and Birch 2005 supplemented with arachidonic acid and docosahexaenoic acid. Two studies supplemented infants with high omega‐6 PUFA (Kitz 2006; van Gool 2003). Kitz 2006 supplemented with gamma‐linolenic acid and van Gool 2003 used borage oil as their source of PUFA.
Five studies supplemented the infant diet with PUFA (Birch 2005; Linnamaa 2010; Meldrum 2011; Mihrshahi 2003; van Gool 2003). Three studies supplemented the maternal diet of lactating mothers of human milk fed infants (Furuhjelm 2009; Lauritzen 2004; Smithers 2008). Kitz 2006 included exclusively breastfed infants (maternal supplementation) and formula fed infants (infant supplementation), which were reported separately (groups were combined in the overall comparison, but reported separately in subgroup analysis according to method of infant feeding).
In the intervention groups, there was high PUFA intake in eight studies (Birch 2005; Furuhjelm 2009; Kitz 2006; Lauritzen 2004; Linnamaa 2010; Meldrum 2011; Mihrshahi 2003; Smithers 2008) and intermediate intake in one study (van Gool 2003). In the control groups, there was high PUFA intake in one study (Kitz 2006), intermediate‐high intake in two studies (Birch 2005; Furuhjelm 2009) and intermediate intake in six studies (Lauritzen 2004; Linnamaa 2010; Meldrum 2011; Mihrshahi 2003; Smithers 2008; van Gool 2003).
Outcomes (studies that reported allergy)
Five studies reported all allergy as an outcome measure (Birch 2005; Furuhjelm 2009; Lauritzen 2004; Meldrum 2011; Mihrshahi 2003). Four studies reported asthma (Birch 2005; Furuhjelm 2009; Mihrshahi 2003; Smithers 2008). All nine studies reported dermatitis/eczema (Birch 2005; Furuhjelm 2009; Kitz 2006; Lauritzen 2004; Linnamaa 2010; Meldrum 2011; Mihrshahi 2003; Smithers 2008; van Gool 2003). Two studies reported allergic rhinitis (Furuhjelm 2009; Mihrshahi 2003). No studies reported cow's milk protein allergy or soy protein allergy. Four studies reported food allergy (Furuhjelm 2009; Lauritzen 2004; Meldrum 2011; Smithers 2008). No studies reported urticaria or anaphylaxis.
Timing and method of allergy assessment included: Birch 2005: blinded study nurses reviewed medical charts for first three years of life ‐ no standardised definitions; Furuhjelm 2009: paediatric allergy research nurses examined children and, in the case of eczema or a food reaction, a paediatrician to two years of age ‐ standardised definitions used; Kitz 2006: examined infants during first 12 months of life ‐ standardised definitions used; Lauritzen 2004: examined infants at 2.5 years ‐ validated questionnaire used (diagnoses confirmed by doctor); Linnamaa 2010: examined by dermatologist in first 12 months of life ‐ standardised definitions used; Meldrum 2011: examined to five years of age ‐ standardised definitions used; Mihrshahi 2003: examination and questionnaires used to five years of age ‐ standardised definitions used; Smithers 2008: used questionnaires to 18 months of age ‐ doctor diagnosed allergy; van Gool 2003: dermatologist examined to 12 month of age ‐ standardised definitions used.
Excluded studies
We excluded 105 studies that investigated PUFA supplementation in infancy from the review (see Characteristics of excluded studies table for details of studies). Assessment of the excluded studies found:
Eighty‐three studies did not report allergy as an outcome (Agostoni 1994; Agostoni 2009; Alam 2010; Andersen 2011; Auestad 1997; Auestad 2001; Ben 2004; Benito Fernandez 2002; Bergmann 2008; Billeaud 1996; Birch 1992; Birch 1998; Birch 2002; Birch 2010; Boehm 1996; Bondia‐Martinez 1998; Bougle 1999; Bouwstra 2003; Carlson 1987; Carlson 1991a; Carlson 1991b; Carlson 1996a; Carlson 1996b; Carlson 1998; Carnielli 1998; Clandinin 1992; Clandinin 1997; Clandinin 2005; Clark 1992; Decsi 1995; Decsi 1997; Demmelmair 2001; Faldella 1996; Fang 2005; Fewtrell 2002; Field 2000; Field 2008; Foreman‐van Drongelen 1995; Ghebremeskel 1995; Granot 2011; Groh‐Wargo 2005; Hauner 2012; Hawkes 2001; Helland 2001; Henriksen 2008; Hoffman 2003; Hoffman 2004; Hoffman 2006; Horby Jorgensen 1998; Innis 1996; Innis 2002; Jensen 1996; Jensen 2000; Kaempf‐Rotzoll 2003; Kohn 1994; Koletzko 2003; Lapillonne 2000a; Lapillonne 2000b; Llorente 2003; Lucia Bergmann 2007; Makrides 1995; Makrides 1999; Makrides 2000; Martinez 2002; Maurage 1998; Mize 1995; Ponder 1992; Ramirez 2001; Ryan 1999; Sauerwald 2012; Schwartz 2009; Siahanidou 2007; Smit 2000a; Uauy 1990; Unay 2004; Van Biervliet 1986; Van Biervliet 1992; Vanderhoof 1999; van der Merwe 2013; van Goor 2009; van Wezel‐Meijler 2002; Weizman 1998; Yang 2013). None of these studies enrolled infants at high risk of allergy.
Seven studies had co‐interventions that differed between treatment and control groups (Amesz 2010; Berseth 2014; Dotterud 2013; Fleddermann 2014; Gibson 1997; Gibson 2009; Moltu 2013).
Fourteen studies had a supplementation period less than one month (Boehm 1997; Fidler 2000; Helland 1998; Koletzko 1989; Koletzko 1995; Leite 2013; Liu 1987; Lopez‐Alarcon 2006; Morgan 1998a; Morgan 1998b; Moya 2001; Rodriguez 2003; Smit 2000b; Stier 1997).
One study enrolled only infants with cholestasis (Socha 2002).
Only one excluded study that also had differential co‐interventions reported an allergy outcome (Dotterud 2013).
No excluded study enrolled infants at high risk of allergy.
Risk of bias in included studies
Of the nine studies that reported allergy, we assessed only one study as high quality with low risk of bias from allocation concealment, randomisation, blinding of treatment and less than 10% loss to follow‐up (Smithers 2008). The other studies all had methodological concerns documented below. See 'Risk of bias' summary (Figure 1).
1.
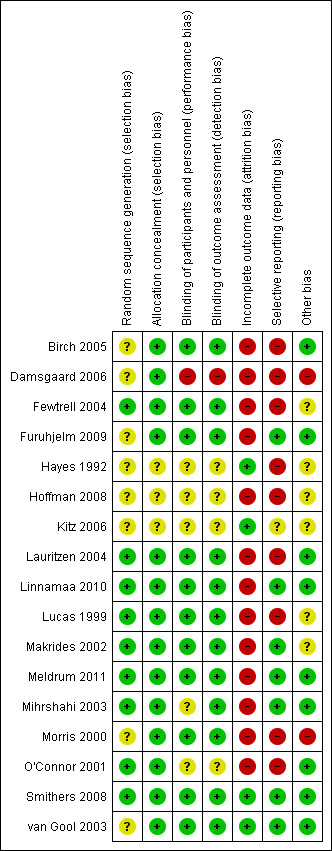
Risk of bias summary: review authors' judgements about each risk of bias item for each included study.
Allocation
Random sequence generation was unclear for four studies due to incomplete reporting (Birch 2005; Furuhjelm 2009; Kitz 2006; van Gool 2003). It was at low risk in the other studies (Lauritzen 2004; Linnamaa 2010; Meldrum 2011; Mihrshahi 2003; Smithers 2008). Allocation concealment was unclear for one study due to incomplete reporting (Kitz 2006), and was assessed at low risk for the other eight studies.
Overall, we assessed selection bias as unclear in four studies (Birch 2005; Furuhjelm 2009; Kitz 2006; van Gool 2003), and low risk for the other studies.
Blinding
Seven studies were at low risk of performance and detection bias by reporting blinding of participants, personal and outcome assessment (Birch 2005; Furuhjelm 2009; Lauritzen 2004; Linnamaa 2010; Meldrum 2011; Smithers 2008; van Gool 2003). Performance bias was unclear in two studies (Kitz 2006; Mihrshahi 2003). No study had a high risk of performance and detection bias.
Incomplete outcome data
Four studies were at low risk of attrition bias reporting less than 10% loss to follow‐up (Kitz 2006; Smithers 2008; van Gool 2003). Studies reporting more than 10% post randomisation losses were Birch 2005 (50%), Furuhjelm 2009 (20%), Lauritzen 2004 (56%), Linnamaa 2010 (45%), Meldrum 2011 (23%) and Mihrshahi 2003 (10% to 16%).
Selective reporting
Six studies were at low risk of reporting bias with prespecified definitions and time points for reporting allergy outcomes (Furuhjelm 2009; Linnamaa 2010; Meldrum 2011; Mihrshahi 2003; Smithers 2008; van Gool 2003). Reporting bias was unclear in one study due to incomplete reporting (Kitz 2006). It was at high risk in two studies as allergy was not prespecified but reported (Birch 2005; Lauritzen 2004).
Other potential sources of bias
All studies reported analyses according to the group of assignment and groups appeared well balanced after randomisation. We identified no other potential biases.
Six studies reported commercial sponsorship or affiliation (Birch 2005; Furuhjelm 2009; Meldrum 2011; Mihrshahi 2003; Smithers 2008; van Gool 2003).
Three studies did not report commercial sponsorship (Kitz 2006; Lauritzen 2004; Linnamaa 2010).
Effects of interventions
See: Table 1; Table 2; Table 3
Primary comparison: higher versus lower PUFA intake (Comparison 1)
Primary outcomes
All allergic disease (Outcome 1.1)
See Analysis 1.1.
1.1. Analysis.
Comparison 1 Higher versus lower PUFA intake, Outcome 1 All allergic disease.
Infant incidence (Outcome 1.1.1)
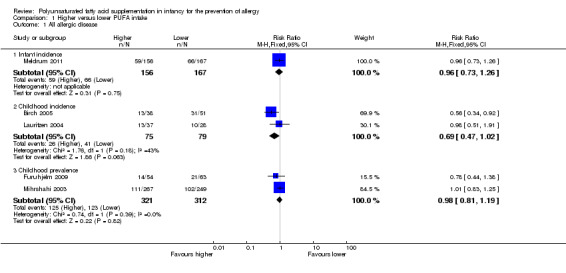
One study reported no difference in infant incidence of all allergic disease (323 infants; RR 0.96, 95% CI 0.73 to 1.26; RD ‐0.02, 95% CI ‐0.12 to 0.09; heterogeneity not applicable) (Meldrum 2011).
Childhood incidence (Outcome 1.1.2)
Meta‐analysis of two studies found no difference in childhood incidence of all allergic disease (154 infants; RR 0.69, 95% CI 0.47 to 1.02, I2 = 43%; RD ‐0.16, 95% CI ‐0.31 to ‐0.00, I2 = 63%; NNTB 6, 95% CI 3 to ∞) (Birch 2005; Lauritzen 2004).
Childhood prevalence (Outcome 1.1.3)
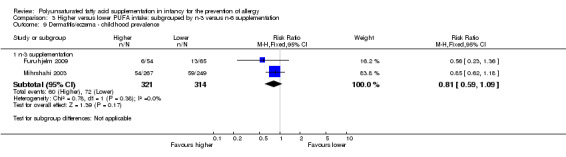
Meta‐analysis of two studies found no difference in childhood prevalence of all allergic disease (633 infants; RR 0.98, 95% CI 0.81 to 1.19, I2 = 36%; RD ‐0.01, 95% CI ‐0.08 to 0.07, I2 = 0%) (Furuhjelm 2009; Mihrshahi 2003).
Secondary outcomes
Asthma (Outcome 1.2)
See Analysis 1.2.
1.2. Analysis.
Comparison 1 Higher versus lower PUFA intake, Outcome 2 Asthma.
Infant incidence (Outcome 1.2.1)
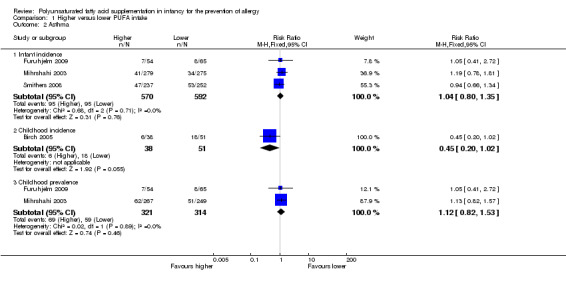
Meta‐analysis of three studies found no difference in infant incidence of asthma (1162 infants; RR 1.04, 95% CI 0.80 to 1.35, I2 = 0%; RD 0.01, 95% CI ‐0.04 to 0.05, I2 = 0%) (Furuhjelm 2009; Mihrshahi 2003; Smithers 2008).
Childhood incidence (Outcome 1.2.2)
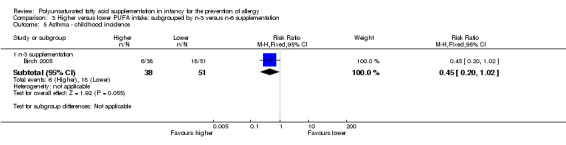
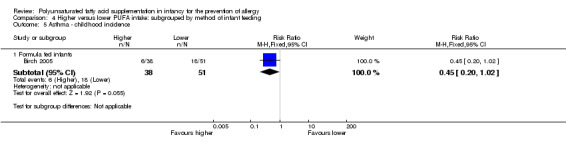
One study reported no difference in childhood incidence of asthma (89 infants; RR 0.45, 95% CI 0.20 to 1.02; RD ‐0.20, 95% CI ‐0.37 to ‐0.02; heterogeneity not applicable; NNTB 5, 95% CI 3 to 50) (Birch 2005).
Childhood prevalence (Outcome 1.2.3)
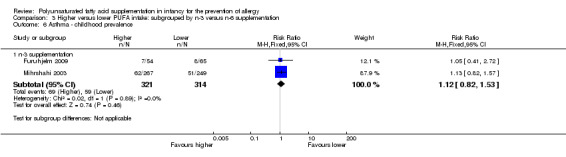
Meta‐analysis of two studies found no difference in childhood prevalence of asthma (635 infants; RR 1.12, 95% CI 0.82 to 1.53, I2 = 0%; RD 0.02, 95% CI ‐0.04 to 0.09, I2 = 0%) (Furuhjelm 2009; Mihrshahi 2003).
Dermatitis/eczema (Outcome 1.3)
See Analysis 1.3.
1.3. Analysis.
Comparison 1 Higher versus lower PUFA intake, Outcome 3 Dermatitis/eczema.
Infant incidence (Outcome 1.3.1)
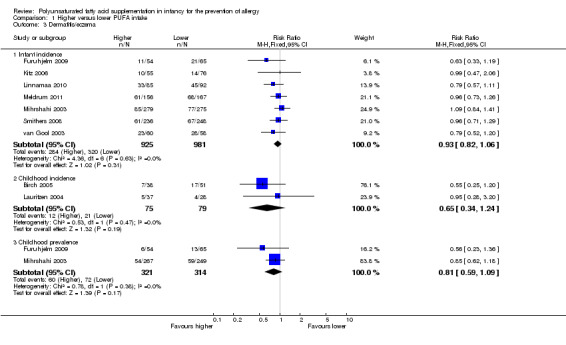
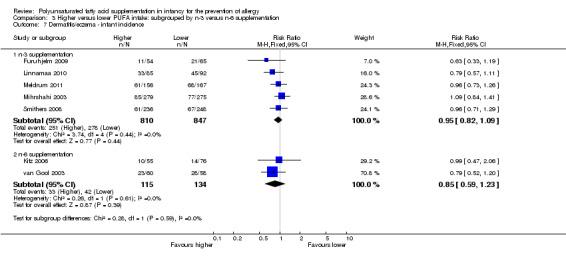
Meta‐analysis of seven studies found no difference in infant incidence of dermatitis/eczema (1906 infants; RR 0.93, 95% CI 0.82 to 1.06, I2 = 0%; RD ‐0.02, 95% CI ‐0.06 to 0.02, I2 = 0%) (Furuhjelm 2009; Kitz 2006; Linnamaa 2010; Meldrum 2011; Mihrshahi 2003; Smithers 2008; van Gool 2003).
Childhood incidence (Outcome 1.3.2)
Meta‐analysis of two studies found no difference in childhood incidence of dermatitis/eczema (154 infants; RR 0.65, 95% CI 0.34 to 1.24, I2 = 0%; RD ‐0.09 95% CI ‐0.22 to 0.04, I2 = 24%) (Birch 2005; Lauritzen 2004).
Childhood prevalence (Outcome 1.3.3)
Meta‐analysis of two studies found no difference in childhood prevalence of dermatitis/eczema (635 infants; RR 0.81, 95% CI 0.59 to 1.09, I2 = 0%; RD ‐0.04 95% CI ‐0.11 to 0.02, I2 = 0%) (Furuhjelm 2009; Mihrshahi 2003).
Allergic rhinitis (Outcome 1.4)
See Analysis 1.4.
1.4. Analysis.
Comparison 1 Higher versus lower PUFA intake, Outcome 4 Allergic rhinitis.
Infant incidence (Outcome 1.4.1)
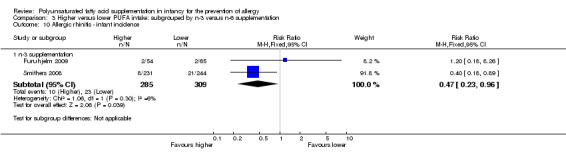
Meta‐analysis of two studies found a significant reduction in infant incidence of allergic rhinitis (594 infants; RR 0.47, 95% CI 0.23 to 0.96, I2 = 6%; RD ‐0.04, 95% CI ‐0.08 to ‐0.00, I2 = 54%; NNTB 25, 95% CI 13 to ∞) (Furuhjelm 2009; Smithers 2008).
Childhood incidence
No study reported childhood incidence of allergic rhinitis.
Childhood prevalence (Outcome 1.4.2)
Meta‐analysis of two studies found no difference in childhood prevalence of allergic rhinitis (635 infants; RR 1.02, 95% CI 0.83 to 1.25, I2 = 0%; RD 0.01, 95% CI ‐0.06 to 0.08, I2 = 0%) (Furuhjelm 2009; Mihrshahi 2003).
Cow's milk protein allergy
No study reported cow's milk protein allergy.
Soy protein allergy
No study reported soy protein allergy.
Food allergy (Outcome 1.5)
See Analysis 1.5.
1.5. Analysis.
Comparison 1 Higher versus lower PUFA intake, Outcome 5 Food allergy.
Infant incidence (Outcome 1.5.1)
Meta‐analysis of three studies found no difference in infant incidence of food allergy with moderate heterogeneity between studies (915 infants; RR 0.81, 95% CI 0.56 to 1.19, I2 = 63%; RD ‐0.02, 95% CI ‐0.06 to 0.02, I2 = 74%) (Furuhjelm 2009; Meldrum 2011; Smithers 2008).
Childhood incidence (Outcome 1.5.2)
One study reported no difference in childhood incidence of food allergy (65 infants; RR 2.27, 95% CI 0.25 to 20.68; RD 0.05, 95% CI ‐0.07 to 0.16; heterogeneity not applicable) (Lauritzen 2004).
Childhood prevalence (Outcome 1.5.3)
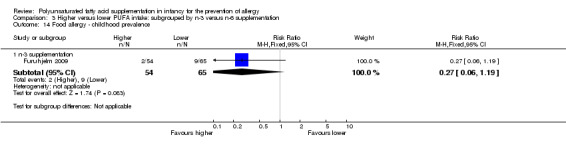
One study reported no difference in childhood prevalence of food allergy (119 infants; RR 0.27, 95% CI 0.06 to 1.19; RD ‐0.10, 95% CI ‐0.20 to ‐0.00; heterogeneity not applicable; NNTB 10, 95% CI 5 to ∞) (Furuhjelm 2009).
Urticaria
No study reported urticaria.
Anaphylaxis
No study reported anaphylaxis.
Subgroup analysis: higher versus lower PUFA intake: supplementation of infant versus supplementation of mother (Comparison 2)
Primary outcomes
All allergic disease
Infant incidence (Outcome 2.1)
See Analysis 2.1.
2.1. Analysis.
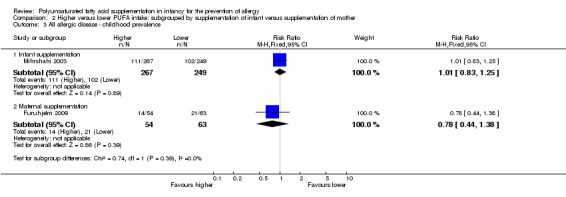
Comparison 2 Higher versus lower PUFA intake: subgrouped by supplementation of infant versus supplementation of mother, Outcome 1 All allergic disease ‐ infant incidence.
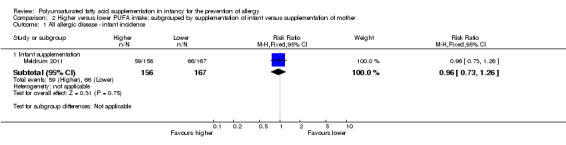
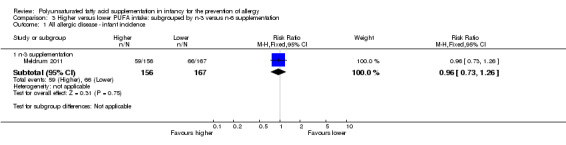
Infant supplementation (Outcome 2.1.1): one study reported no difference in infant incidence of all allergic disease (323 infants; RR 0.96, 95% CI 0.73 to 1.26; RD ‐0.02, 95% CI ‐0.12 to 0.09; heterogeneity not applicable) (Meldrum 2011).
Childhood incidence (Outcome 2.2)
See Analysis 2.2.
2.2. Analysis.
Comparison 2 Higher versus lower PUFA intake: subgrouped by supplementation of infant versus supplementation of mother, Outcome 2 All allergic disease ‐ childhood incidence.
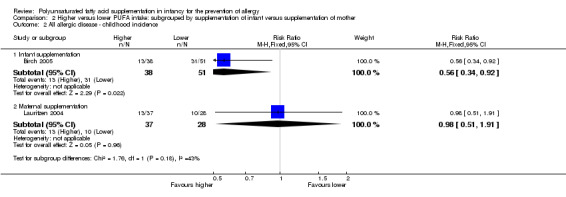
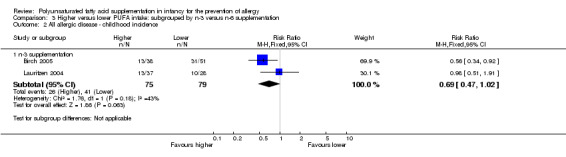
Infant supplementation (Outcome 2.2.1): one study reported a significant reduction in childhood incidence of all allergic disease (89 infants; RR 0.56, 95% CI 0.34 to 0.92; RD ‐0.27, 95% CI ‐0.47 to ‐0.06; heterogeneity not applicable; NNTB 4, 95% CI 2 to 17) (Birch 2005).
Maternal supplementation (Outcome 2.2.2): one study reported no difference in childhood incidence of all allergic disease (65 infants; RR 0.98, 95% CI 0.51 to 1.91; RD ‐0.01, 95% CI ‐0.24 to 0.23; heterogeneity not applicable) (Lauritzen 2004).
Childhood prevalence (Outcome 2.3)
See Analysis 2.3.
2.3. Analysis.
Comparison 2 Higher versus lower PUFA intake: subgrouped by supplementation of infant versus supplementation of mother, Outcome 3 All allergic disease ‐ childhood prevalence.
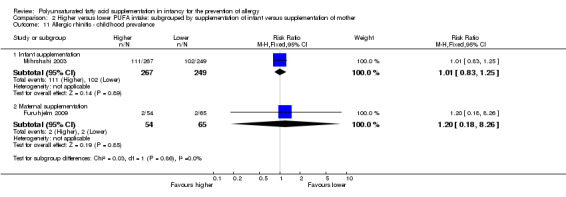
Infant supplementation (Outcome 2.3.1): one study reported no difference in childhood prevalence of all allergic disease (516 infants; RR 1.01, 95% CI 0.83 to 1.25; RD 0.01, 95% CI ‐0.08 to 0.09; heterogeneity not applicable) (Mihrshahi 2003).
Maternal supplementation (Outcome 2.3.2): one study reported no difference in childhood prevalence of all allergic disease (117 infants; RR 0.78, 95% CI 0.44 to 1.38; RD ‐0.07, 95% CI ‐0.24 to 0.09; heterogeneity not applicable) (Furuhjelm 2009).
The subgroups were not significantly different with respect to childhood incidence (I2 = 43.1%, P = 0.18) and childhood prevalence (I2 = 0%, P = 0.39).
Secondary outcomes
Asthma
Infant incidence (Outcome 2.4)
See Analysis 2.4.
2.4. Analysis.
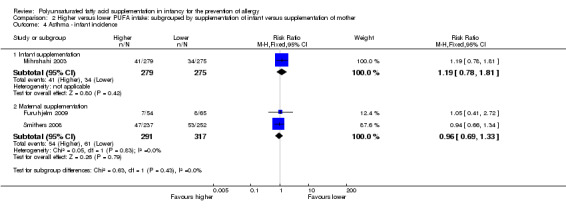
Comparison 2 Higher versus lower PUFA intake: subgrouped by supplementation of infant versus supplementation of mother, Outcome 4 Asthma ‐ infant incidence.
Infant supplementation (Outcome 2.4.1): one study reported no difference in infant incidence of asthma (554 infants; RR 1.19, 95% CI 0.78 to 1.81; RD 0.02, 95% CI ‐0.03 to 0.08; heterogeneity not applicable) (Mihrshahi 2003).
Maternal supplementation (Outcome 2.4.2): meta‐analysis of two studies found no difference in infant incidence of asthma (608 infants; RR 0.96, 95% CI 0.69 to 1.33, I2 = 0%; RD ‐0.01, 95% CI ‐0.07 to 0.05, I2 = 0%) (Furuhjelm 2009; Smithers 2008).
Childhood incidence (Outcome 2.5)
See Analysis 2.5.
2.5. Analysis.
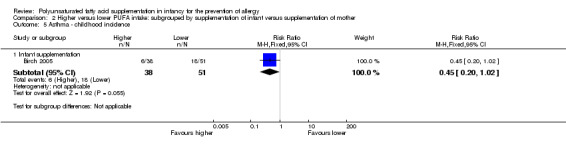
Comparison 2 Higher versus lower PUFA intake: subgrouped by supplementation of infant versus supplementation of mother, Outcome 5 Asthma ‐ childhood incidence.
Infant supplementation (Outcome 2.5.1): one study reported no difference in childhood incidence of asthma (89 infants; RR 0.45, 95% CI 0.20 to 1.02; RD ‐0.20, 95% CI ‐0.37 to ‐0.02; heterogeneity not applicable; NNTB 5, 95% CI 3 to 50) (Birch 2005).
Childhood prevalence (Outcome 2.6)
See Analysis 2.6.
2.6. Analysis.
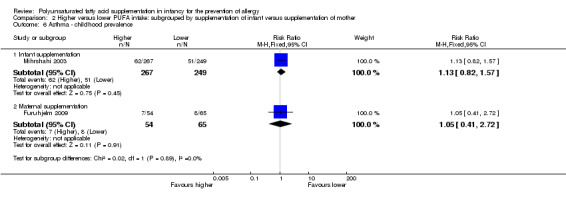
Comparison 2 Higher versus lower PUFA intake: subgrouped by supplementation of infant versus supplementation of mother, Outcome 6 Asthma ‐ childhood prevalence.
Infant supplementation (Outcome 2.6.1): one study reported no difference in childhood prevalence of asthma (516 infants; RR 1.13, 95% CI 0.82 to 1.57; RD 0.03, 95% CI ‐0.04 to 0.10; heterogeneity not applicable) (Mihrshahi 2003).
Maternal supplementation (Outcome 2.6.2): one study reported no difference in childhood prevalence of asthma (119 infants; RR 1.05, 95% CI 0.41 to 2.72; RD 0.01, 95% CI ‐0.11 to 0.13; heterogeneity not applicable) (Furuhjelm 2009).
The subgroups were not significantly different with respect to infant incidence (I2 = 0%, P = 0.43) and childhood prevalence (I2 = 0%, P = 0.89).
Dermatitis/eczema
Infant incidence (Outcome 2.7)
See Analysis 2.7.
2.7. Analysis.
Comparison 2 Higher versus lower PUFA intake: subgrouped by supplementation of infant versus supplementation of mother, Outcome 7 Dermatitis/eczema ‐ infant incidence.
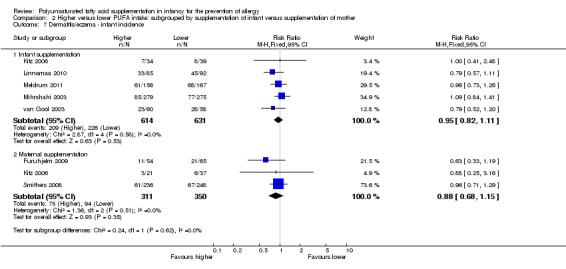
Infant supplementation (Outcome 2.7.1): meta‐analysis of five studies found no difference in infant incidence of dermatitis/eczema (1245 infants; RR 0.95, 95% CI 0.82 to 1.11, I2 = 0%; RD ‐0.02, 95% CI ‐0.07 to 0.04, I2 = 0%) (Kitz 2006; Linnamaa 2010; Meldrum 2011; Mihrshahi 2003; van Gool 2003).
Maternal supplementation (Outcome 2.7.2): meta‐analysis of three studies found no difference in infant incidence of dermatitis/eczema (661 infants; RR 0.88, 95% CI 0.68 to 1.15, I2 = 0%; RD ‐0.03, 95% CI ‐0.10 to 0.03, I2 = 0%) (Furuhjelm 2009; Kitz 2006; Smithers 2008).
Childhood incidence (Outcome 2.8)
See Analysis 2.8.
2.8. Analysis.
Comparison 2 Higher versus lower PUFA intake: subgrouped by supplementation of infant versus supplementation of mother, Outcome 8 Dermatitis/eczema ‐ childhood incidence.
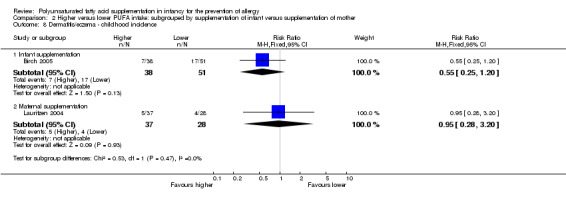
Infant supplementation (Outcome 2.8.1): one study reported no difference in childhood incidence of dermatitis/eczema (89 infants; RR 0.55, 95% CI 0.25 to 1.20; RD ‐0.15, 95% CI ‐0.33 to 0.03; heterogeneity not applicable) (Birch 2005).
Maternal supplementation (Outcome 2.8.2): one study reported no difference in childhood incidence of dermatitis/eczema (65 infants; RR 0.95, 95% CI 0.28 to 3.20; RD ‐0.01, 95% CI ‐0.18 to 0.16; heterogeneity not applicable) (Lauritzen 2004).
Childhood prevalence (Outcome 2.9)
See Analysis 2.9.
2.9. Analysis.
Comparison 2 Higher versus lower PUFA intake: subgrouped by supplementation of infant versus supplementation of mother, Outcome 9 Dermatitis/eczema ‐ childhood prevalence.
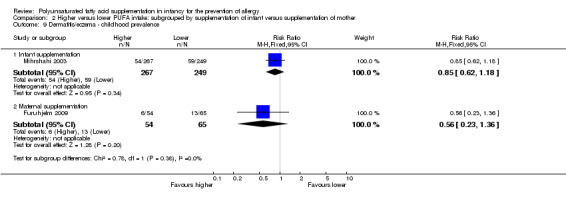
Infant supplementation (Outcome 2.9.1): one study reported no difference in childhood prevalence of dermatitis/eczema (516 infants; RR 0.85, 95% CI 0.62 to 1.18; RD ‐0.03, 95% CI ‐0.11 to 0.04; heterogeneity not applicable) (Mihrshahi 2003).
Maternal supplementation (Outcome 2.9.2): one study reported no difference in childhood prevalence of dermatitis/eczema (119 infants; RR 0.56, 95% CI 0.23 to 1.36; RD ‐0.09, 95% CI ‐0.22 to 0.04; heterogeneity not applicable) (Furuhjelm 2009).
The subgroups were not significantly different with respect to infant incidence (I2 = 0%, P = 0.62), childhood incidence (I2 = 0%, P = 0.47) and childhood prevalence (I2 = 0%, P = 0.38).
Allergic rhinitis
Infant incidence (Outcome 2.10)
See Analysis 2.10.
2.10. Analysis.
Comparison 2 Higher versus lower PUFA intake: subgrouped by supplementation of infant versus supplementation of mother, Outcome 10 Allergic rhinitis ‐ infant incidence.
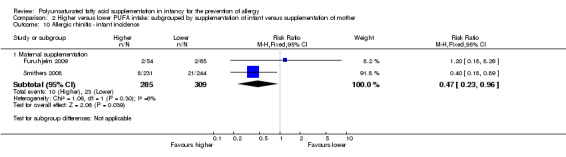
Maternal supplementation (Outcome 2.10.1): meta‐analysis of two studies found a significant reduction in infant incidence of allergic rhinitis (594 infants; RR 0.47, 95% CI 0.23 to 0.96, I2 = 6%; RD ‐0.04, 95% CI ‐0.08 to ‐0.00, I2 = 54%; NNTB 25, 95% CI 13 to ∞) (Furuhjelm 2009; Smithers 2008).
Childhood prevalence (Outcome 2.11)
See Analysis 2.11.
2.11. Analysis.
Comparison 2 Higher versus lower PUFA intake: subgrouped by supplementation of infant versus supplementation of mother, Outcome 11 Allergic rhinitis ‐ childhood prevalence.
Infant supplementation (Outcome 2.11.1): one study reported no difference in childhood prevalence of allergic rhinitis (516 infants; RR 1.01, 95% CI 0.83 to 1.25; RD 0.01, 95% CI ‐0.08 to 0.09; heterogeneity not applicable) (Mihrshahi 2003).
Maternal supplementation (Outcome 2.11.2): one study reported no difference in childhood prevalence of allergic rhinitis (119 infants; RR 1.20, 95% CI 0.18 to 8.26; RD 0.01, 95% CI ‐0.06 to 0.07; heterogeneity not applicable) (Furuhjelm 2009).
The subgroups were not significantly different with respect to childhood prevalence (I2 = 0%, P = 0.86).
Food allergy
Infant incidence (Outcome 2.12)
See Analysis 2.12.
2.12. Analysis.
Comparison 2 Higher versus lower PUFA intake: subgrouped by supplementation of infant versus supplementation of mother, Outcome 12 Food allergy ‐ infant incidence.
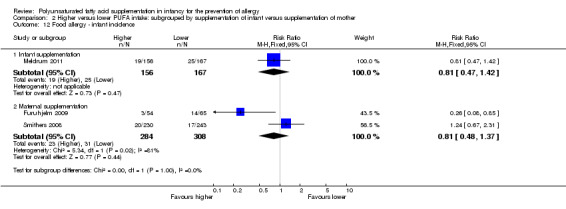
Infant supplementation (Outcome 2.12.1): one study reported no difference in infant incidence of food allergy (323 infants; RR 0.81, 95% CI 0.47 to 1.42; RD ‐0.03, 95% CI ‐0.10 to 0.05; heterogeneity not applicable) (Meldrum 2011).
Maternal supplementation (Outcome 2.12.2): meta‐analysis of two studies found no difference in infant incidence of food allergy with high heterogeneity between studies (592 infants; RR 0.81, 95% CI 0.48 to 1.37, I2 = 81%; RD ‐0.02, 95% CI ‐0.06 to 0.03, I2 = 87%) (Furuhjelm 2009; Smithers 2008).
Childhood incidence (Outcome 2.13)
See Analysis 2.13.
2.13. Analysis.
Comparison 2 Higher versus lower PUFA intake: subgrouped by supplementation of infant versus supplementation of mother, Outcome 13 Food allergy ‐ childhood incidence.
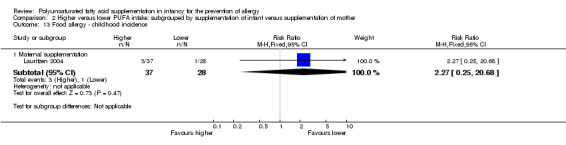
Maternal supplementation (Outcome 2.13.1): one study reported no difference in childhood incidence of food allergy (65 infants; RR 2.27, 95% CI 0.25 to 20.68; RD 0.05, 95% CI ‐0.07 to 0.16; heterogeneity not applicable) (Lauritzen 2004).
Childhood prevalence (Outcome 2.14)
See Analysis 2.14.
2.14. Analysis.
Comparison 2 Higher versus lower PUFA intake: subgrouped by supplementation of infant versus supplementation of mother, Outcome 14 Food allergy ‐ childhood prevalence.
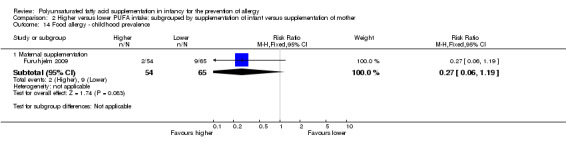
Maternal supplementation (Outcome 2.14.1): one study reported no difference in childhood prevalence of food allergy (119 infants; RR 0.27, 95% CI 0.06 to 1.19; RD ‐0.10, 95% CI ‐0.20 to ‐0.00; heterogeneity not applicable; NNTB 10, 95% CI 5 to ∞) (Furuhjelm 2009).
The subgroups were not significantly different with respect to infant incidence (I2 = 0%, P = 1.00).
Subgroup analysis: higher versus lower PUFA intake: supplementation with n‐3 versus n‐6 PUFA (Comparison 3)
Primary outcomes
All allergic disease
Infant incidence (Outcome 3.1)
See Analysis 3.1.
3.1. Analysis.
Comparison 3 Higher versus lower PUFA intake: subgrouped by n‐3 versus n‐6 supplementation, Outcome 1 All allergic disease ‐ infant incidence.
n‐3 Supplementation (Outcome 3.1.1): one study reported no difference in infant incidence of all allergic disease (323 infants; RR 0.96, 95% CI 0.73 to 1.26; RD ‐0.02, 95% CI ‐0.12 to 0.09; heterogeneity not applicable) (Meldrum 2011).
Childhood incidence (Outcome 3.2)
See Analysis 3.2.
3.2. Analysis.
Comparison 3 Higher versus lower PUFA intake: subgrouped by n‐3 versus n‐6 supplementation, Outcome 2 All allergic disease ‐ childhood incidence.
n‐3 Supplementation (Outcome 3.2.1): meta‐analysis of two studies found no difference in infant incidence of all allergic disease (154 infants; RR 0.69, 95% CI 0.47 to 1.02, I2 = 43%; RD ‐0.16, 95% CI ‐0.31 to ‐0.00, I2 = 63%; NNTB 6, 95% CI 3 to ∞) (Birch 2005; Lauritzen 2004).
Childhood prevalence (Outcome 3.3)
See Analysis 3.3.
3.3. Analysis.
Comparison 3 Higher versus lower PUFA intake: subgrouped by n‐3 versus n‐6 supplementation, Outcome 3 All allergic disease ‐ childhood prevalence.
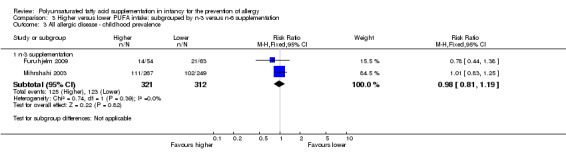
n‐3 Supplementation (Outcome 3.3.1): meta‐analysis of two studies found no difference in infant incidence of all allergic disease (633 infants; RR 0.98, 95% CI 0.81 to 1.19, I2 = 36%; RD ‐0.01, 95% CI ‐0.08 to 0.07, I2 = 0%) (Furuhjelm 2009; Mihrshahi 2003).
Secondary outcomes
Asthma
Infant incidence (Outcome 3.4)
See Analysis 3.4.
3.4. Analysis.
Comparison 3 Higher versus lower PUFA intake: subgrouped by n‐3 versus n‐6 supplementation, Outcome 4 Asthma ‐ infant incidence.
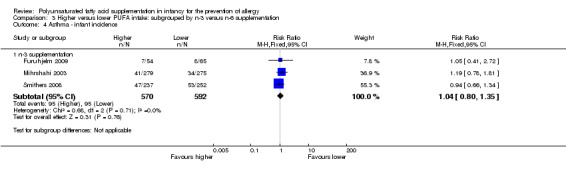
n‐3 Supplementation (Outcome 3.4.1): meta‐analysis of three studies found no difference in infant incidence of asthma (1162 infants; RR 1.04, 95% CI 0.80 to 1.35, I2 = 0%; RD 0.01, 95% CI ‐0.04 to 0.05, I2 = 0%) (Furuhjelm 2009; Mihrshahi 2003; Smithers 2008).
Childhood incidence (Outcome 3.5)
See Analysis 3.5.
3.5. Analysis.
Comparison 3 Higher versus lower PUFA intake: subgrouped by n‐3 versus n‐6 supplementation, Outcome 5 Asthma ‐ childhood incidence.
n‐3 Supplementation (Outcome 3.5.1): one study reported no difference in childhood incidence of asthma (89 infants; RR 0.45, 95% CI 0.20 to 1.02; RD ‐0.20, 95% CI ‐0.37 to ‐0.02; heterogeneity not applicable; NNTB 5, 95% CI 3 to 50) (Birch 2005).
Childhood prevalence (Outcome 3.6)
See Analysis 3.6.
3.6. Analysis.
Comparison 3 Higher versus lower PUFA intake: subgrouped by n‐3 versus n‐6 supplementation, Outcome 6 Asthma ‐ childhood prevalence.
n‐3 Supplementation (Outcome 3.6.1): meta‐analysis of two studies found no difference in childhood prevalence of asthma (635 infants; RR 1.12, 95% CI 0.82 to 1.53, I2 = 0%; RD 0.02, 95% CI ‐0.04 to 0.09, I2 = 0%) (Furuhjelm 2009; Mihrshahi 2003).
Dermatitis/eczema
Infant incidence (Outcome 3.7)
See Analysis 3.7.
3.7. Analysis.
Comparison 3 Higher versus lower PUFA intake: subgrouped by n‐3 versus n‐6 supplementation, Outcome 7 Dermatitis/eczema ‐ infant incidence.
n‐3 Supplementation (Outcome 3.7.1): meta‐analysis of five studies found no difference in infant incidence of dermatitis/eczema (1657 infants; RR 0.95, 95% CI 0.82 to 1.09, I2 = 0%; RD ‐0.02, 95% CI ‐0.06 to 0.03, I2 = 3%) (Furuhjelm 2009; Linnamaa 2010; Meldrum 2011; Mihrshahi 2003; Smithers 2008).
n‐6 Supplementation (Outcome 3.7.2): meta‐analysis of two studies found no difference in infant incidence of dermatitis/eczema (249 infants; RR 0.85, 95% CI 0.59 to 1.23, I2 = 0%; RD ‐0.05, 95% CI ‐0.16 to 0.06, I2 = 0%) (Kitz 2006; van Gool 2003).
Childhood incidence (Outcome 3.8)
See Analysis 3.8.
3.8. Analysis.

Comparison 3 Higher versus lower PUFA intake: subgrouped by n‐3 versus n‐6 supplementation, Outcome 8 Dermatitis/eczema ‐ childhood incidence.
n‐3 Supplementation (Outcome 3.8.1): meta‐analysis of two studies reported found no difference in childhood incidence of dermatitis/eczema (154 infants; RR 0.65, 95% CI 0.34 to 1.24, I2 = 0%; RD ‐0.09 95% CI ‐0.22 to 0.04, I2 = 24%) (Birch 2005; Lauritzen 2004).
Childhood prevalence (Outcome 3.9)
See Analysis 3.9.
3.9. Analysis.
Comparison 3 Higher versus lower PUFA intake: subgrouped by n‐3 versus n‐6 supplementation, Outcome 9 Dermatitis/eczema ‐ childhood prevalence.
n‐3 Supplementation (Outcome 3.9.1): meta‐analysis of two studies reported found no difference in childhood prevalence of dermatitis/eczema (635 infants; RR 0.81, 95% CI 0.59 to 1.09, I2 = 0%; RD ‐0.04 95% CI ‐0.11 to 0.02, I2 = 0%) (Furuhjelm 2009; Mihrshahi 2003).
The subgroups were not significantly different with respect to infant incidence (I2 = 0%, P = 0.59).
Allergic rhinitis
Infant incidence (Outcome 3.10)
See Analysis 3.10.
3.10. Analysis.
Comparison 3 Higher versus lower PUFA intake: subgrouped by n‐3 versus n‐6 supplementation, Outcome 10 Allergic rhinitis ‐ infant incidence.
n‐3 Supplementation (Outcome 3.10.1): meta‐analysis of two studies found a significant reduction in infant incidence of allergic rhinitis (594 infants; RR 0.47, 95% CI 0.23 to 0.96, I2 = 6%; RD ‐0.04, 95% CI ‐0.08 to ‐0.00, I2 = 54%; NNTB 25, 95% CI 13 to ∞) (Furuhjelm 2009; Smithers 2008).
Childhood prevalence (Outcome 3.11)
See Analysis 3.11.
3.11. Analysis.
Comparison 3 Higher versus lower PUFA intake: subgrouped by n‐3 versus n‐6 supplementation, Outcome 11 Allergic rhinitis ‐ childhood prevalence.
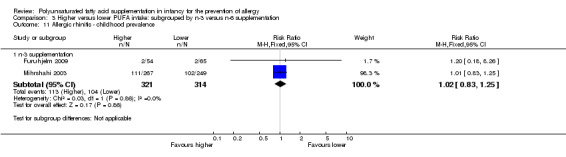
n‐3 Supplementation (Outcome 3.11.1): meta‐analysis of two studies found a significant reduction in childhood prevalence of allergic rhinitis (635 infants; RR 1.02, 95% CI 0.83 to 1.25, I2 = 0%; RD 0.01, 95% CI ‐0.06 to 0.08, I2 = 0%) (Furuhjelm 2009; Mihrshahi 2003).
Food allergy
Infant incidence (Outcome 3.12)
See Analysis 3.12.
3.12. Analysis.
Comparison 3 Higher versus lower PUFA intake: subgrouped by n‐3 versus n‐6 supplementation, Outcome 12 Food allergy ‐ infant incidence.
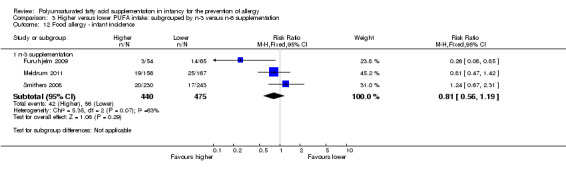
n‐3 Supplementation (Outcome 3.12.1): meta‐analysis of three studies found no difference in infant incidence of food allergy (915 infants; RR 0.81, 95% CI 0.56 to 1.19, I2 = 63%; RD ‐0.02, 95% CI ‐0.06 to 0.02, I2 = 74%) (Furuhjelm 2009; Meldrum 2011; Smithers 2008).
Childhood incidence (Outcome 3.13)
See Analysis 3.13.
3.13. Analysis.
Comparison 3 Higher versus lower PUFA intake: subgrouped by n‐3 versus n‐6 supplementation, Outcome 13 Food allergy ‐ childhood incidence.
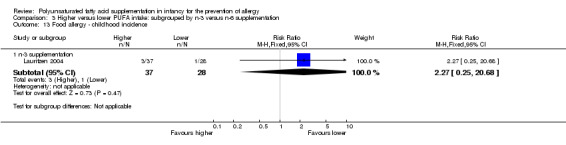
n‐3 Supplementation (Outcome 3.13.1): one study reported no difference in childhood incidence of food allergy (65 infants; RR 2.27, 95% CI 0.25 to 20.68; RD 0.05, 95% CI ‐0.07 to 0.16; heterogeneity not applicable) (Lauritzen 2004).
Childhood prevalence (Outcome 3.14)
See Analysis 3.14.
3.14. Analysis.
Comparison 3 Higher versus lower PUFA intake: subgrouped by n‐3 versus n‐6 supplementation, Outcome 14 Food allergy ‐ childhood prevalence.
n‐3 Supplementation (Outcome 3.14.1): one study reported no difference in childhood prevalence of food allergy (119 infants; RR 0.27, 95% CI 0.06 to 1.19; RD ‐0.10, 95% CI ‐0.20 to ‐0.00; heterogeneity not applicable; NNTB 10, 95% CI 5 to ∞) (Furuhjelm 2009).
Subgroup analysis: higher versus lower PUFA intake: supplementation of human milk fed infants versus formula fed infants (Comparison 4)
Primary outcomes
All allergic disease
Infant incidence (Outcome 4.1)
See Analysis 4.1.
4.1. Analysis.

Comparison 4 Higher versus lower PUFA intake: subgrouped by method of infant feeding, Outcome 1 All allergic disease ‐ infant incidence.
Human milk fed infants (Outcome 4.1.1): one study reported no difference in infant incidence of all allergic disease (323 infants; RR 0.96, 95% CI 0.73 to 1.26; RD ‐0.02, 95% CI ‐0.12 to 0.09; heterogeneity not applicable) (Meldrum 2011).
Childhood incidence (Outcome 4.2)
See Analysis 4.2.
4.2. Analysis.
Comparison 4 Higher versus lower PUFA intake: subgrouped by method of infant feeding, Outcome 2 All allergic disease ‐ childhood incidence.
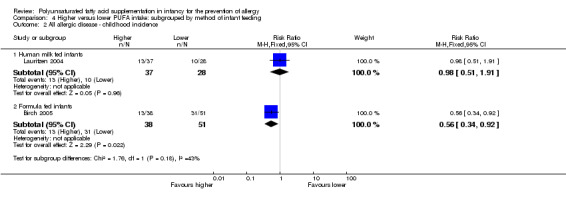
Human milk fed infants (Outcome 4.2.1): one study reported no difference in childhood incidence of all allergic disease (65 infants; RR 0.98, 95% CI 0.51 to 1.91; RD ‐0.01, 95% CI ‐0.24 to 0.23; heterogeneity not applicable) (Lauritzen 2004).
Formula fed infants (Outcome 4.2.2): one study reported a significant reduction in childhood incidence of all allergic disease (89 infants; RR 0.56, 95% CI 0.34 to 0.92; RD ‐0.27, 95% CI ‐0.47 to ‐0.06; heterogeneity not applicable; NNTB 4, 95% CI 2 to 17) (Birch 2005).
Childhood prevalence (Outcome 4.3)
See Analysis 4.3.
4.3. Analysis.
Comparison 4 Higher versus lower PUFA intake: subgrouped by method of infant feeding, Outcome 3 All allergic disease ‐ childhood prevalence.
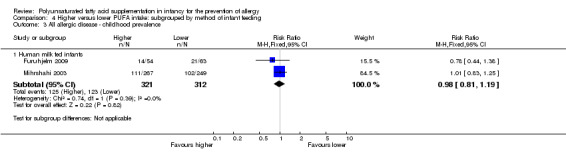
Human milk fed infants (Outcome 4.3.1): meta‐analysis of two studies found no difference in childhood prevalence of all allergic disease (633 infants; RR 0.98, 95% CI 0.81 to 1.19, I2 = 36%; RD ‐0.01, 95% CI ‐0.08 to 0.07, I2 = 0%) (Furuhjelm 2009; Mihrshahi 2003).
The subgroups were not significantly different with respect to childhood incidence (I2 = 43%, P = 0.18).
Secondary outcomes
Asthma
Infant incidence (Outcome 4.4)
See Analysis 4.4.
4.4. Analysis.
Comparison 4 Higher versus lower PUFA intake: subgrouped by method of infant feeding, Outcome 4 Asthma ‐ infant incidence.
Human milk fed infants (Outcome 4.4.1): meta‐analysis of three studies found no difference in infant incidence of asthma (1162 infants; RR 1.04, 95% CI 0.80 to 1.35, I2 = 0%; RD 0.01, 95% CI ‐0.04 to 0.05, I2 = 0%) (Furuhjelm 2009; Mihrshahi 2003; Smithers 2008).
Childhood incidence (Outcome 4.5)
See Analysis 4.5.
4.5. Analysis.
Comparison 4 Higher versus lower PUFA intake: subgrouped by method of infant feeding, Outcome 5 Asthma ‐ childhood incidence.
Formula fed infants (Outcome 4.5.1): one study reported no difference in childhood incidence of asthma (89 infants; RR 0.45, 95% CI 0.20 to 1.02; RD ‐0.20, 95% CI ‐0.37 to ‐0.02; heterogeneity not applicable; NNTB 5, 95% CI 3 to 50) (Birch 2005).
Childhood prevalence (Outcome 4.6)
See Analysis 4.6.
4.6. Analysis.

Comparison 4 Higher versus lower PUFA intake: subgrouped by method of infant feeding, Outcome 6 Asthma ‐ childhood prevalence.
Human milk fed infants (Outcome 4.6.1): meta‐analysis of two studies found no difference in childhood prevalence of asthma (635 infants; RR 1.12, 95% CI 0.82 to 1.53, I2 = 0%; RD 0.02, 95% CI ‐0.04 to 0.09, I2 = 0%) (Furuhjelm 2009; Mihrshahi 2003).
Dermatitis/eczema
Infant incidence (Outcome 4.7)
See Analysis 4.7.
4.7. Analysis.
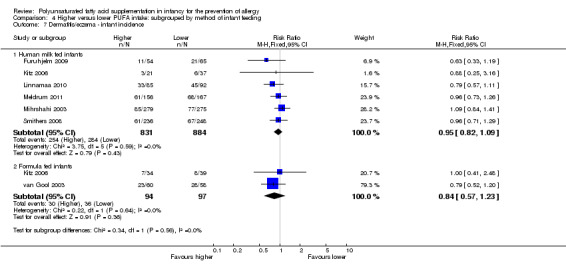
Comparison 4 Higher versus lower PUFA intake: subgrouped by method of infant feeding, Outcome 7 Dermatitis/eczema ‐ infant incidence.
Human milk fed infants (Outcome 4.7.1): meta‐analysis of six studies found no difference in infant incidence of dermatitis/eczema (1715 infants; RR 0.95, 95% CI 0.82 to 1.09, I2 = 0%; RD ‐0.02, 95% CI ‐0.06 to 0.03, I2 = 0%) (Furuhjelm 2009; Kitz 2006; Linnamaa 2010; Meldrum 2011; Mihrshahi 2003; Smithers 2008).
Formula fed infants (Outcome 4.7.2): meta‐analysis of two studies found no difference in infant incidence of dermatitis/eczema (191 infants; RR 0.84, 95% CI 0.57 to 1.23, I2 = 0%; RD ‐0.06, 95% CI ‐0.19 to 0.07, I2 = 0%) (Kitz 2006; van Gool 2003).
Childhood incidence (Outcome 4.8)
See Analysis 4.8.
4.8. Analysis.
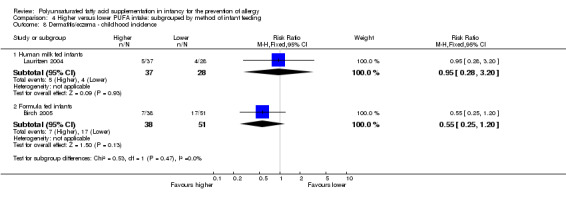
Comparison 4 Higher versus lower PUFA intake: subgrouped by method of infant feeding, Outcome 8 Dermatitis/eczema ‐ childhood incidence.
Human milk fed infants (Outcome 4.8.1): one study reported no difference in childhood incidence of dermatitis/eczema (65 infants; RR 0.95, 95% CI 0.28 to 3.20; RD ‐0.01, 95% CI ‐0.18 to 0.16; heterogeneity not applicable) (Lauritzen 2004).
Formula fed infants (Outcome 4.8.2): one study reported no difference in childhood incidence of dermatitis/eczema (89 infants; RR 0.55, 95% CI 0.25 to 1.20; RD ‐0.15, 95% CI ‐0.33 to 0.03; heterogeneity not applicable) (Birch 2005).
Childhood prevalence (Outcome 4.9)
See Analysis 4.9.
4.9. Analysis.

Comparison 4 Higher versus lower PUFA intake: subgrouped by method of infant feeding, Outcome 9 Dermatitis/eczema ‐ childhood prevalence.
Human milk fed infants (Outcome 4.9.1): meta‐analysis of two studies found no difference in childhood prevalence of dermatitis/eczema (635 infants; RR 0.81, 95% CI 0.59 to 1.09, I2 = 0%; RD ‐0.04 95% CI ‐0.11 to 0.02, I2 = 0%) (Furuhjelm 2009; Mihrshahi 2003).
The subgroups were not significantly different with respect to infant incidence (I2 = 0%, P = 0.56) and childhood incidence (I2 = 0%, P = 0.47).
Allergic rhinitis
Infant incidence (Outcome 4.10)
See Analysis 4.10.
4.10. Analysis.
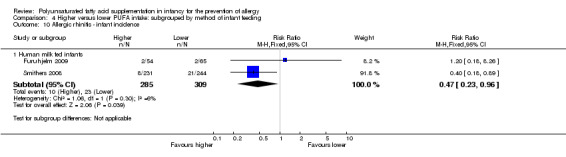
Comparison 4 Higher versus lower PUFA intake: subgrouped by method of infant feeding, Outcome 10 Allergic rhinitis ‐ infant incidence.
Human milk fed infants (Outcome 4.10.1): meta‐analysis of two studies found a significant reduction in infant incidence of allergic rhinitis (594 infants; RR 0.47, 95% CI 0.23 to 0.96, I2 = 6%; RD ‐0.04, 95% CI ‐0.08 to ‐0.00, I2 = 54%; NNTB 25, 95% CI 13 to ∞) (Furuhjelm 2009; Smithers 2008).
Childhood prevalence (Outcome 4.11)
See Analysis 4.11.
4.11. Analysis.

Comparison 4 Higher versus lower PUFA intake: subgrouped by method of infant feeding, Outcome 11 Allergic rhinitis ‐ childhood prevalence.
Human milk fed infants (Outcome 4.11.1): meta‐analysis of two studies found no difference in childhood prevalence of allergic rhinitis (635 infants; RR 1.02, 95% CI 0.83 to 1.25, I2 = 0%; RD 0.01, 95% CI ‐0.06 to 0.08, I2 = 0%) (Furuhjelm 2009; Mihrshahi 2003).
Food allergy
Infant incidence (Outcome 4.12)
See Analysis 4.12.
4.12. Analysis.
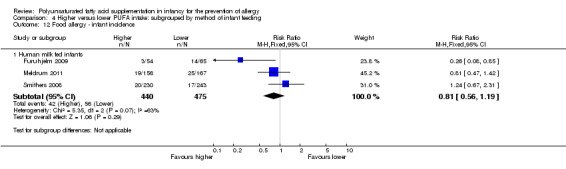
Comparison 4 Higher versus lower PUFA intake: subgrouped by method of infant feeding, Outcome 12 Food allergy ‐ infant incidence.
Human milk fed infants (Outcome 4.12.1): meta‐analysis of three studies found no difference in infant incidence of food allergy with moderate heterogeneity between studies (915 infants; RR 0.81, 95% CI 0.56 to 1.19, I2 = 63%; RD ‐0.02, 95% CI ‐0.06 to 0.02, I2 = 74%) (Furuhjelm 2009; Meldrum 2011; Smithers 2008).
Childhood incidence (Outcome 4.13)
See Analysis 4.13.
4.13. Analysis.
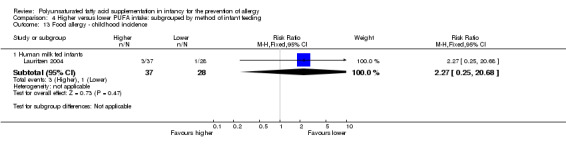
Comparison 4 Higher versus lower PUFA intake: subgrouped by method of infant feeding, Outcome 13 Food allergy ‐ childhood incidence.
Human milk fed infants (Outcome 4.13.1): one study reported no difference in childhood incidence of food allergy (65 infants; RR 2.27, 95% CI 0.25 to 20.68; RD 0.05, 95% CI ‐0.07 to 0.16; heterogeneity not applicable) (Lauritzen 2004).
Childhood prevalence (Outcome 4.14)
See Analysis 4.14.
4.14. Analysis.

Comparison 4 Higher versus lower PUFA intake: subgrouped by method of infant feeding, Outcome 14 Food allergy ‐ childhood prevalence.
Human milk fed infants (Outcome 4.14.1): one study reported no difference in childhood prevalence of food allergy (119 infants; RR 0.27, 95% CI 0.06 to 1.19; RD ‐0.10, 95% CI ‐0.20 to ‐0.00; heterogeneity not applicable; NNTB 10, 95% CI 5 to ∞) (Furuhjelm 2009).
Subgroup analysis: higher versus lower PUFA intake: subgrouped by infant heredity for allergy (Comparison 5)
Primary outcomes
All allergic disease
Infant incidence (Outcome 5.1)
See Analysis 5.1.
5.1. Analysis.
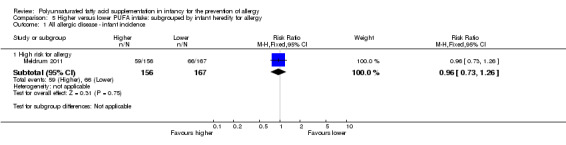
Comparison 5 Higher versus lower PUFA intake: subgrouped by infant heredity for allergy, Outcome 1 All allergic disease ‐ infant incidence.
High risk (Outcome 5.1.1): one study reported no difference in infant incidence of all allergic disease (323 infants; RR 0.96, 95% CI 0.73 to 1.26; RD ‐0.02, 95% CI ‐0.12 to 0.09; heterogeneity not applicable) (Meldrum 2011).
Childhood incidence (Outcome 5.2)
See Analysis 5.2.
5.2. Analysis.
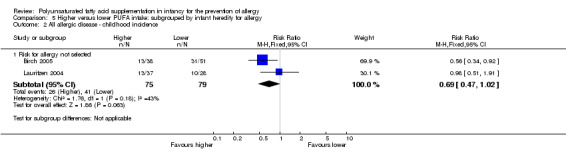
Comparison 5 Higher versus lower PUFA intake: subgrouped by infant heredity for allergy, Outcome 2 All allergic disease ‐ childhood incidence.
Not selected (Outcome 5.2.1): meta‐analysis of two studies found no difference in childhood incidence of all allergic disease (154 infants; RR 0.69, 95% CI 0.47 to 1.02, I2 = 43%; RD ‐0.16, 95% CI ‐0.31 to ‐0.00, I2 = 63%; NNTB 6, 95% CI 3 to ∞) (Birch 2005; Lauritzen 2004).
Childhood prevalence (Outcome 5.3)
See Analysis 5.3.
5.3. Analysis.

Comparison 5 Higher versus lower PUFA intake: subgrouped by infant heredity for allergy, Outcome 3 All allergic disease ‐ childhood prevalence.
High risk (Outcome 5.3.1): meta‐analysis of two studies found no difference in childhood prevalence of all allergic disease (633 infants; RR 0.98, 95% CI 0.81 to 1.19, I2 = 36%; RD ‐0.01, 95% CI ‐0.08 to 0.07, I2 = 0%) (Furuhjelm 2009; Mihrshahi 2003).
Secondary outcomes
Asthma
Infant incidence (Outcome 5.4)
See Analysis 5.4.
5.4. Analysis.
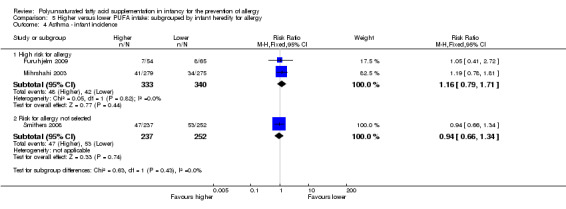
Comparison 5 Higher versus lower PUFA intake: subgrouped by infant heredity for allergy, Outcome 4 Asthma ‐ infant incidence.
High risk (Outcome 5.4.1): meta‐analysis of two studies found no difference in infant incidence of asthma (673 infants; RR 1.16, 95% CI 0.79 to 1.71, I2 = 0%; RD 0.02, 95% CI ‐0.03 to 0.07, I2 = 0%) (Furuhjelm 2009; Mihrshahi 2003).
Not selected (Outcome 5.4.2): one study reported no difference in infant incidence of asthma (489 infants; RR 0.94, 95% CI 0.66 to 1.34; RD ‐0.01, 95% CI ‐0.08 to 0.06; heterogeneity not applicable) (Smithers 2008).
Childhood incidence (Outcome 5.5)
See Analysis 5.5.
5.5. Analysis.
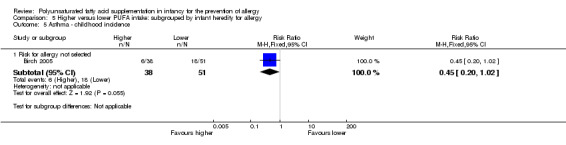
Comparison 5 Higher versus lower PUFA intake: subgrouped by infant heredity for allergy, Outcome 5 Asthma ‐ childhood incidence.
Not selected (Outcome 5.5.1): one study reported no difference in childhood incidence of asthma (89 infants; RR 0.45, 95% CI 0.20 to 1.02; RD ‐0.20, 95% CI ‐0.37 to ‐0.02; heterogeneity not applicable; NNTB 5, 95% CI 3 to 50) (Birch 2005).
Childhood prevalence (Outcome 5.6)
See Analysis 5.6.
5.6. Analysis.

Comparison 5 Higher versus lower PUFA intake: subgrouped by infant heredity for allergy, Outcome 6 Asthma ‐ childhood prevalence.
High risk (Outcome 5.6.1): meta‐analysis of two studies found no difference in childhood prevalence of asthma (635 infants; RR 1.12, 95% CI 0.82 to 1.53, I2 = 0%; RD 0.02, 95% CI ‐0.04 to 0.09, I2 = 0%) (Furuhjelm 2009; Mihrshahi 2003).
The subgroups were not significantly different with respect to infant incidence (I2 = 0%, P = 0.43).
Dermatitis/eczema
Infant incidence (Outcome 5.7)
See Analysis 5.7.
5.7. Analysis.
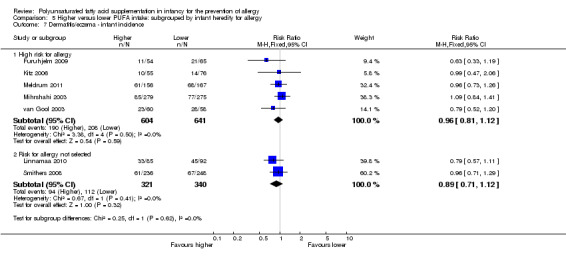
Comparison 5 Higher versus lower PUFA intake: subgrouped by infant heredity for allergy, Outcome 7 Dermatitis/eczema ‐ infant incidence.
High risk (Outcome 5.7.1): meta‐analysis of five studies found no difference in infant incidence of dermatitis/eczema (1245 infants; RR 0.96, 95% CI 0.81 to 1.12, I2 = 0%; RD ‐0.01, 95% CI ‐0.07 to 0.04, I2 = 0%) (Furuhjelm 2009; Kitz 2006; Meldrum 2011; Mihrshahi 2003; van Gool 2003).
Not selected (Outcome 5.7.2): meta‐analysis of two studies found no difference in infant incidence of dermatitis/eczema (661 infants; RR 0.89, 95% CI 0.71 to 1.12, I2 = 0%; RD ‐0.04, 95% CI ‐0.11 to 0.03, I2 = 11%) (Linnamaa 2010; Smithers 2008).
Childhood incidence (Outcome 5.8)
See Analysis 5.8.
5.8. Analysis.

Comparison 5 Higher versus lower PUFA intake: subgrouped by infant heredity for allergy, Outcome 8 Dermatitis/eczema ‐ childhood incidence.
Not selected (Outcome 5.8.1): meta‐analysis of two studies found no difference in childhood incidence of dermatitis/eczema (154 infants; RR 0.65, 95% CI 0.34 to 1.24, I2 = 0%; RD ‐0.09 95% CI ‐0.22 to 0.04, I2 = 24%) (Birch 2005; Lauritzen 2004).
Childhood prevalence (Outcome 5.9)
See Analysis 5.9.
5.9. Analysis.

Comparison 5 Higher versus lower PUFA intake: subgrouped by infant heredity for allergy, Outcome 9 Dermatitis/eczema ‐ childhood prevalence.
High risk (Outcome 5.9.1): meta‐analysis of two studies found no difference in childhood prevalence of dermatitis/eczema (635 infants; RR 0.81, 95% CI 0.59 to 1.09, I2 = 0%; RD ‐0.04 95% CI ‐0.11 to 0.02, I2 = 0%) (Furuhjelm 2009; Mihrshahi 2003).
The subgroups were not significantly different with respect to infant incidence (I2 = 0%, P = 0.62).
Allergic rhinitis
Infant incidence (Outcome 5.10)
See Analysis 5.10.
5.10. Analysis.
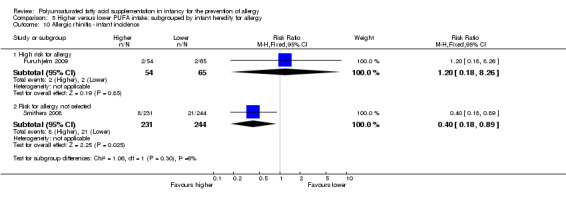
Comparison 5 Higher versus lower PUFA intake: subgrouped by infant heredity for allergy, Outcome 10 Allergic rhinitis ‐ infant incidence.
High risk (Outcome 5.10.1): one study reported no difference in infant incidence of allergic rhinitis (119 infants; RR 1.20, 95% CI 0.18 to 8.26; RD 0.01, 95% CI ‐0.06 to 0.07; heterogeneity not applicable) (Furuhjelm 2009).
Not selected (Outcome 5.10.2): one study reported a significant reduction in infant incidence of allergic rhinitis (475 infants; RR 0.40, 95% CI 0.18 to 0.89; RD ‐0.05, 95% CI ‐0.09 to ‐0.01; heterogeneity not applicable; NNTB 20, 95% CI 11 to 100) (Smithers 2008).
Childhood prevalence (Outcome 5.11)
See Analysis 5.11.
5.11. Analysis.
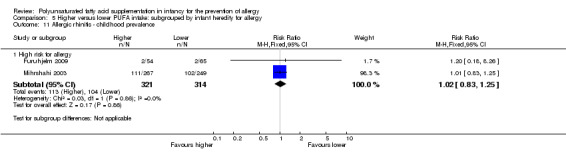
Comparison 5 Higher versus lower PUFA intake: subgrouped by infant heredity for allergy, Outcome 11 Allergic rhinitis ‐ childhood prevalence.
High risk (Outcome 5.11.1): meta‐analysis of two studies found no difference in childhood prevalence of allergic rhinitis (635 infants; RR 1.02, 95% CI 0.83 to 1.25, I2 = 0%; RD 0.01, 95% CI ‐0.06 to 0.08, I2 = 0%) (Furuhjelm 2009; Mihrshahi 2003).
The subgroups were not significantly different with respect to infant incidence (I2 = 6%, P = 0.30).
Food allergy
Infant incidence (Outcome 5.12)
See Analysis 5.12.
5.12. Analysis.
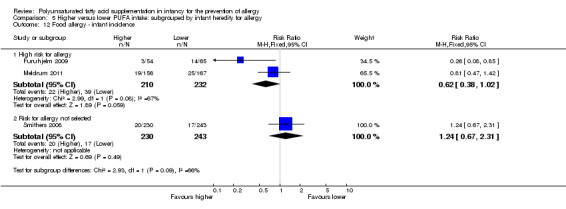
Comparison 5 Higher versus lower PUFA intake: subgrouped by infant heredity for allergy, Outcome 12 Food allergy ‐ infant incidence.
High risk (Outcome 5.12.1): meta‐analysis of two studies found no difference in infant incidence of food allergy with moderate heterogeneity between studies found (442 infants; RR 0.62, 95% CI 0.38 to 1.02, I2 = 67%; RD ‐0.06, 95% CI ‐0.13 to ‐0.00, I2 = 71%; NNTB 17, 95% CI 7 to ∞) (Furuhjelm 2009; Meldrum 2011).
Not selected (Outcome 5.12.2): one study reported no difference in infant incidence of food allergy (473 infants; RR 1.24, 95% CI 0.67 to 2.31; RD 0.02, 95% CI ‐0.03 to 0.07; heterogeneity not applicable) (Smithers 2008).
Childhood incidence (Outcome 5.13)
See Analysis 5.13.
5.13. Analysis.
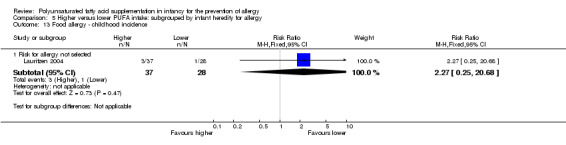
Comparison 5 Higher versus lower PUFA intake: subgrouped by infant heredity for allergy, Outcome 13 Food allergy ‐ childhood incidence.
Not selected (Outcome 5.13.1): one study reported no difference in childhood incidence of food allergy (65 infants; RR 2.27, 95% CI 0.25 to 20.68; RD 0.05, 95% CI ‐0.07 to 0.16; heterogeneity not applicable) (Lauritzen 2004).
Childhood prevalence (Outcome 5.14)
See Analysis 5.14.
5.14. Analysis.
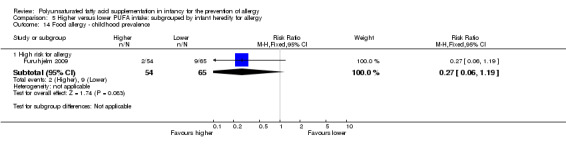
Comparison 5 Higher versus lower PUFA intake: subgrouped by infant heredity for allergy, Outcome 14 Food allergy ‐ childhood prevalence.
High risk (Outcome 5.14.1): one study reported no difference in childhood prevalence of food allergy (119 infants; RR 0.27, 95% CI 0.06 to 1.19; RD ‐0.10, 95% CI ‐0.20 to ‐0.00; heterogeneity not applicable; NNTB 10, 95% CI 5 to ∞) (Furuhjelm 2009).
The subgroups were not significantly different with respect to infant incidence (I2 = 66%, P = 0.09).
Subgroup analysis: higher versus lower PUFA intake: subgrouped by gestational age at birth (Comparison 6)
Primary outcomes
All allergic disease
Infant incidence (Outcome 6.1)
See Analysis 6.1.
6.1. Analysis.
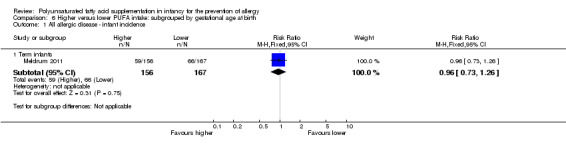
Comparison 6 Higher versus lower PUFA intake: subgrouped by gestational age at birth, Outcome 1 All allergic disease ‐ infant incidence.
Term infants (Outcome 6.1.1): one study reported no difference in infant incidence of all allergic disease (323 infants; RR 0.96, 95% CI 0.73 to 1.26; RD ‐0.02, 95% CI ‐0.12 to 0.09; heterogeneity not applicable) (Meldrum 2011).
Childhood incidence (Outcome 6.2)
See Analysis 6.2.
6.2. Analysis.
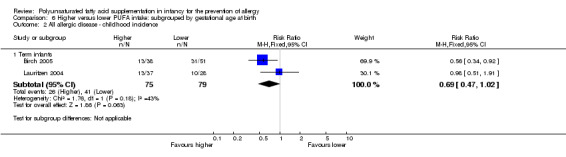
Comparison 6 Higher versus lower PUFA intake: subgrouped by gestational age at birth, Outcome 2 All allergic disease ‐ childhood incidence.
Term infants (Outcome 6.2.1): meta‐analysis of two studies found no difference in childhood incidence of all allergic disease (154 infants; RR 0.69, 95% CI 0.47 to 1.02, I2 = 43%; RD ‐0.16, 95% CI ‐0.31 to ‐0.00, I2 = 63%; NNTB 6, 95% CI 3 to ∞) (Birch 2005; Lauritzen 2004).
Childhood prevalence (Outcome 6.3)
See Analysis 6.3.
6.3. Analysis.

Comparison 6 Higher versus lower PUFA intake: subgrouped by gestational age at birth, Outcome 3 All allergic disease ‐ childhood prevalence.
Term infants (Outcome 6.3.1): meta‐analysis of two studies found no difference in childhood prevalence of all allergic disease (633 infants; RR 0.98, 95% CI 0.81 to 1.19, I2 = 36%; RD ‐0.01, 95% CI ‐0.08 to 0.07, I2 = 0%) (Furuhjelm 2009; Mihrshahi 2003).
Secondary outcomes
Asthma
Infant incidence (Outcome 6.4)
See Analysis 6.4.
6.4. Analysis.
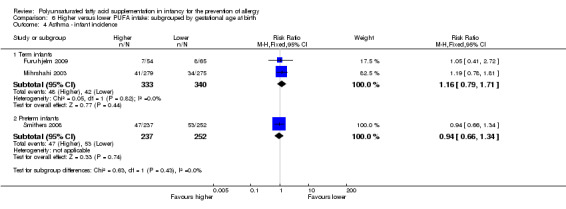
Comparison 6 Higher versus lower PUFA intake: subgrouped by gestational age at birth, Outcome 4 Asthma ‐ infant incidence.
Term infants (Outcome 6.4.1): meta‐analysis of two studies found no difference in infant incidence of asthma (673 infants; RR 1.16, 95% CI 0.79 to 1.71, I2 = 0%; RD 0.02, 95% CI ‐0.03 to 0.07, I2 = 0%) (Furuhjelm 2009; Mihrshahi 2003).
Preterm infants (Outcome 6.4.2): one study reported no difference in infant incidence of asthma (489 infants; RR 0.94, 95% CI 0.66 to 1.34; RD ‐0.01, 95% CI ‐0.08 to 0.06; heterogeneity not applicable) (Smithers 2008).
Childhood incidence (Outcome 6.5)
See Analysis 6.5.
6.5. Analysis.
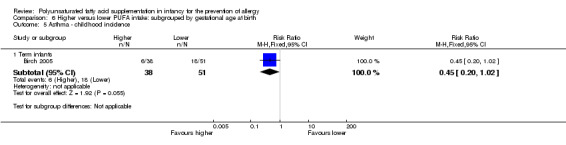
Comparison 6 Higher versus lower PUFA intake: subgrouped by gestational age at birth, Outcome 5 Asthma ‐ childhood incidence.
Term infants (Outcome 6.5.1): one study reported no difference in childhood incidence of asthma (89 infants; RR 0.45, 95% CI 0.20 to 1.02; RD ‐0.20, 95% CI ‐0.37 to ‐0.02; heterogeneity not applicable; NNTB 5, 95% CI 3 to 50) (Birch 2005).
Childhood prevalence (Outcome 6.6)
See Analysis 6.6.
6.6. Analysis.
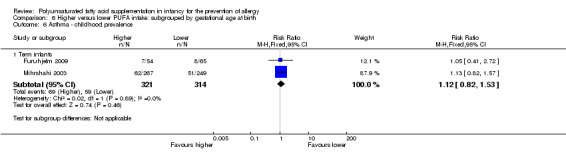
Comparison 6 Higher versus lower PUFA intake: subgrouped by gestational age at birth, Outcome 6 Asthma ‐ childhood prevalence.
Term infants (Outcome 6.6.1): meta‐analysis of two studies found no difference in childhood prevalence of asthma (635 infants; RR 1.12, 95% CI 0.82 to 1.53, I2 = 0%; RD 0.02, 95% CI ‐0.04 to 0.09, I2 = 0%) (Furuhjelm 2009; Mihrshahi 2003).
The subgroups were not significantly different with respect to infant incidence (I2 = 0%, P = 0.43).
Dermatitis/eczema
Infant incidence (Outcome 6.7)
See Analysis 6.7.
6.7. Analysis.
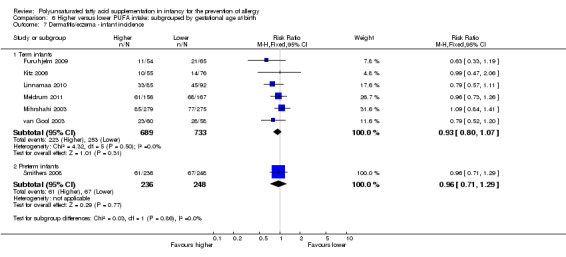
Comparison 6 Higher versus lower PUFA intake: subgrouped by gestational age at birth, Outcome 7 Dermatitis/eczema ‐ infant incidence.
Term infants (Outcome 6.7.1): meta‐analysis of six studies found no difference in infant incidence of dermatitis/eczema (1422 infants; RR 0.93, 95% CI 0.80 to 1.07, I2 = 0%; RD ‐0.03, 95% CI ‐0.07 to 0.02, I2 = 0%) (Furuhjelm 2009; Kitz 2006; Linnamaa 2010; Meldrum 2011; Mihrshahi 2003; van Gool 2003).
Preterm infants (Outcome 6.7.2): one study reported no difference in infant incidence of dermatitis/eczema (484 infants; RR 0.96, 95% CI 0.71 to 1.29; RD ‐0.01, 95% CI ‐0.09 to 0.07; heterogeneity not applicable) (Smithers 2008).
Childhood incidence (Outcome 6.8)
See Analysis 6.8.
6.8. Analysis.
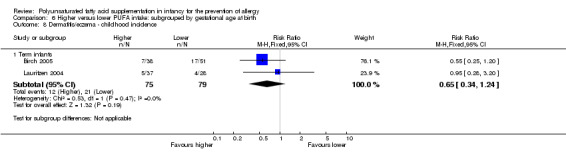
Comparison 6 Higher versus lower PUFA intake: subgrouped by gestational age at birth, Outcome 8 Dermatitis/eczema ‐ childhood incidence.
Term infants (Outcome 6.8.1): meta‐analysis of two studies found no difference in childhood incidence of dermatitis/eczema (154 infants; RR 0.65, 95% CI 0.34 to 1.24, I2 = 0%; RD ‐0.09 95% CI ‐0.22 to 0.04, I2 = 24%) (Birch 2005; Lauritzen 2004).
Childhood prevalence (Outcome 6.9)
See Analysis 6.9.
6.9. Analysis.

Comparison 6 Higher versus lower PUFA intake: subgrouped by gestational age at birth, Outcome 9 Dermatitis/eczema ‐ childhood prevalence.
Term infants (Outcome 6.9.1): meta‐analysis of two studies found no difference in childhood prevalence of dermatitis/eczema (635 infants; RR 0.81, 95% CI 0.59 to 1.09, I2 = 0%; RD ‐0.04 95% CI ‐0.11 to 0.02, I2 = 0%) (Furuhjelm 2009; Mihrshahi 2003).
The subgroups were not significantly different with respect to infant incidence (I2 = 0%, P = 0.86).
Allergic rhinitis
Infant incidence (Outcome 6.10)
See Analysis 6.10.
6.10. Analysis.

Comparison 6 Higher versus lower PUFA intake: subgrouped by gestational age at birth, Outcome 10 Allergic rhinitis ‐ infant incidence.
Term infants (Outcome 6.10.1): one study reported no difference in infant incidence of allergic rhinitis (119 infants; RR 1.20, 95% CI 0.18 to 8.26; RD 0.01, 95% CI ‐0.06 to 0.07; heterogeneity not applicable) (Furuhjelm 2009).
Preterm infants (Outcome 6.10.2): one study reported a significant reduction in infant incidence of allergic rhinitis (475 infants; RR 0.40, 95% CI 0.18 to 0.89; RD ‐0.05, 95% CI ‐0.09 to ‐0.01; heterogeneity not applicable; NNTB 20, 95% CI 11 to 100) (Smithers 2008).
Childhood prevalence (Outcome 6.11)
See Analysis 6.11.
6.11. Analysis.

Comparison 6 Higher versus lower PUFA intake: subgrouped by gestational age at birth, Outcome 11 Allergic rhinitis ‐ childhood prevalence.
Term infants (Outcome 6.11.1): meta‐analysis of two studies found no difference in childhood prevalence of allergic rhinitis (635 infants; RR 1.02, 95% CI 0.83 to 1.25, I2 = 0%; RD 0.01, 95% CI ‐0.06 to 0.08, I2 = 0%) (Furuhjelm 2009; Mihrshahi 2003).
The subgroups were not significantly different with respect to infant incidence (I2 = 6%, P = 0.30).
Food allergy
Infant incidence (Outcome 6.12)
See Analysis 6.12.
6.12. Analysis.
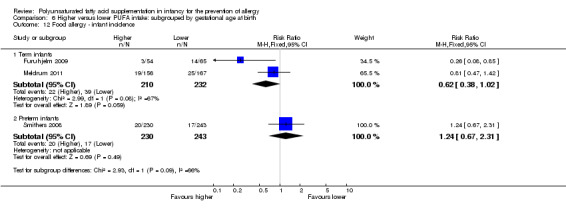
Comparison 6 Higher versus lower PUFA intake: subgrouped by gestational age at birth, Outcome 12 Food allergy ‐ infant incidence.
Term infants (Outcome 6.12.1): meta‐analysis of two studies found no difference in infant incidence of food allergy with moderate heterogeneity between studies (442 infants; RR 0.62, 95% CI 0.38 to 1.02, I2 = 67%; RD ‐0.06, 95% CI ‐0.13 to ‐0.00, I2 = 71%; NNTB 17, 95% CI 7 to ∞) (Furuhjelm 2009; Meldrum 2011).
Preterm infants (Outcome 6.12.2): one study reported no difference in infant incidence of food allergy (473 infants; RR 1.24, 95% CI 0.67 to 2.31; RD 0.02, 95% CI ‐0.03 to 0.07; heterogeneity not applicable) (Smithers 2008).
Childhood incidence (Outcome 6.13)
See Analysis 6.13.
6.13. Analysis.
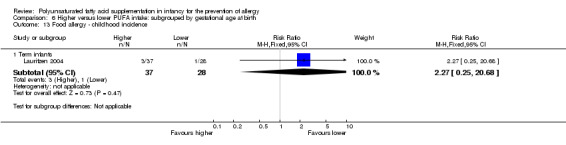
Comparison 6 Higher versus lower PUFA intake: subgrouped by gestational age at birth, Outcome 13 Food allergy ‐ childhood incidence.
Term infants (Outcome 6.13.1): one study reported no difference in childhood incidence of food allergy (65 infants; RR 2.27, 95% CI 0.25 to 20.68; RD 0.05, 95% CI ‐0.07 to 0.16; heterogeneity not applicable) (Lauritzen 2004).
Childhood prevalence (Outcome 6.14)
See Analysis 6.14.
6.14. Analysis.

Comparison 6 Higher versus lower PUFA intake: subgrouped by gestational age at birth, Outcome 14 Food allergy ‐ childhood prevalence.
Term infants (Outcome 6.14.1): one study reported no difference in childhood prevalence of food allergy (119 infants; RR 0.27, 95% CI 0.06 to 1.19; RD ‐0.10, 95% CI ‐0.20 to ‐0.00; heterogeneity not applicable; NNTB 10, 95% CI 5 to ∞) (Furuhjelm 2009).
The subgroups were not significantly different with respect to infant incidence (I2 = 66%, P = 0.09).
Sensitivity analysis (Comparison 7)
Primary outcomes
All allergic disease
No high quality studies reported all allergy as an outcome measure.
Secondary outcomes
Asthma (Outcome 7.1)
See Analysis 7.1.
7.1. Analysis.
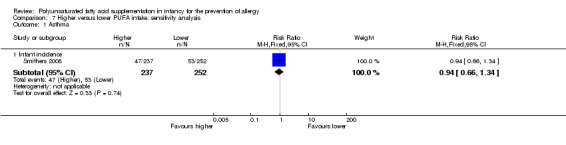
Comparison 7 Higher versus lower PUFA intake: sensitivity analysis, Outcome 1 Asthma.
Infant incidence (Outcome 7.1.1)
One high quality study reported no difference in infant incidence of asthma (489 infants; RR 0.94, 95% CI 0.66 to 1.34; RD ‐0.01, 95% CI ‐0.08 to 0.06; heterogeneity not applicable) (Smithers 2008).
Dermatitis/eczema (Outcome 7.2)
See Analysis 7.2.
7.2. Analysis.
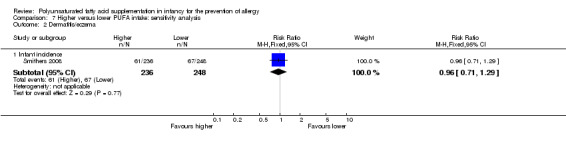
Comparison 7 Higher versus lower PUFA intake: sensitivity analysis, Outcome 2 Dermatitis/eczema.
Infant incidence (Outcome 7.2.1)
One high quality study reported no difference in infant incidence of dermatitis/eczema (484 infants; RR 0.96, 95% CI 0.71 to 1.29; RD ‐0.01, 95% CI ‐0.09 to 0.07; heterogeneity not applicable) (Smithers 2008).
Allergic rhinitis (Outcome 7.3)
See Analysis 7.3.
7.3. Analysis.
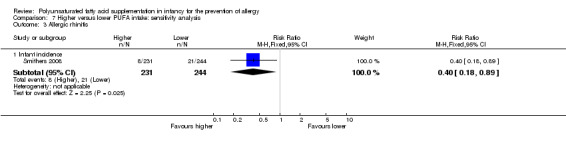
Comparison 7 Higher versus lower PUFA intake: sensitivity analysis, Outcome 3 Allergic rhinitis.
Infant incidence (Outcome 7.3.1)
One high quality study reported a reduction in allergic rhinitis (475 infants; RR 0.40, 95% CI 0.18 to 0.89; RD ‐0.05, 95% CI ‐0.09 to ‐0.01; heterogeneity not applicable; NNTB 20, 95% CI 11 to 100) (Smithers 2008).
Food allergy (Outcome 7.4)
See Analysis 7.4.
7.4. Analysis.
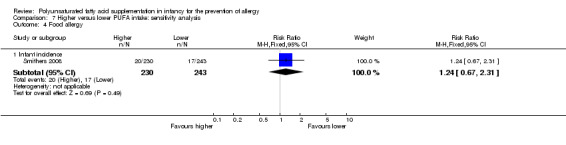
Comparison 7 Higher versus lower PUFA intake: sensitivity analysis, Outcome 4 Food allergy.
Infant incidence (Outcome 7.4.1)
One high quality study reported no difference in food allergy (473 infants; RR 1.24, 95% CI 0.67 to 2.31; RD 0.02, 95% CI ‐0.03 to 0.07; heterogeneity not applicable) (Smithers 2008).
Discussion
Summary of main results
Primary outcomes
PUFA supplementation in infancy did not affect infant incidence, childhood incidence or childhood prevalence of all allergy (GRADE level of evidence: very low ‐ see grading of evidence summaries in Table 1; Table 2; and Table 3. In subgroup analyses, there were no statistically significant differences according to maternal versus infant supplementation of PUFA, or according to infant risk of allergy. One study of high PUFA intake with high omega‐3:omega‐6 ratio in formula fed infants reported a significant reduction in childhood incidence of all allergic disease (89 infants; RR 0.56, 95% CI 0.34 to 0.92; RD ‐0.27, 95% CI ‐0.47 to ‐0.06; heterogeneity not applicable; NNTB 4, 95% CI 2 to 17) (Birch 2005).
Secondary outcomes
Asthma: PUFA supplementation in infancy did not affect infant incidence, childhood incidence or childhood prevalence of asthma (GRADE level of evidence: very low to low). In subgroup analysis, there were no statistically significant differences according to maternal versus infant supplementation, human milk versus formula fed infants, infant risk of allergy or according to gestational age at birth.
Dermatitis/eczema: PUFA supplementation in infancy did not affect infant incidence, childhood incidence or childhood prevalence of dermatitis/eczema (GRADE level of evidence: very low). In subgroup analysis, there were no statistically significant differences according to maternal versus infant supplementation, omega‐3 versus omega‐6 supplementation, human milk versus formula fed infants, infant risk of allergy or according to gestational age at birth.
Allergic rhinitis: PUFA supplementation in infancy was associated with a significant reduction in infant incidence of allergic rhinitis (2 studies, 594 infants; RR 0.47, 95% CI 0.23 to 0.96, I2 = 6%; RD ‐0.04, 95% CI ‐0.08 to ‐0.00, I2 = 54%; NNTB 25, 95% CI 13 to ∞) (GRADE level of evidence: very low). In subgroup analysis, one study in preterm infants not selected for risk of allergy supplemented with n‐3 PUFA reported a significant reduction in infant incidence of allergic rhinitis (475 infants; RR 0.40, 95% CI 0.18 to 0.89; RD ‐0.05, 95% CI ‐0.09 to ‐0.01; heterogeneity not applicable; NNTB 20, 95% CI 11 to 100) (Smithers 2008), and one study in term infants at high risk of allergy reported no difference in infant incidence of allergic rhinitis (119 infants; RR 1.20, 95% CI 0.18 to 8.26; RD 0.01, 95% CI ‐0.06 to 0.07; heterogeneity not applicable) (Furuhjelm 2009). PUFA supplementation in infancy did not affect childhood prevalence of allergic rhinitis (GRADE level of evidence: very low). In subgroup analysis, there were no statistically significant differences according to infant versus maternal supplementation.
Food allergy: PUFA supplementation in infancy did not affect infant incidence, childhood incidence or childhood prevalence of food allergy (GRADE level of evidence: very low). There was moderate heterogeneity between studies that reported infant incidence of food allergy (3 studies; 915 infants; RR 0.81, 95% CI 0.56 to 1.19, I2 = 63%; RD ‐0.02, 95% CI ‐0.06 to 0.02, I2 = 74%). In subgroup analysis, there were no statistically significant differences according to maternal versus infant supplementation, or infant risk of allergy.
No studies reported cow's milk protein allergy, soy protein allergy, urticaria or anaphylaxis as outcome measures.
Overall completeness and applicability of evidence
There are substantial limitations to the overall completeness and applicability of evidence. Of the 17 included studies, eight studies did not report data that were able to be included in meta‐analyses. There were a further 83 studies that had eligible participants and comparisons but were excluded solely because they did not include allergy as an outcome measure. This raises concerns regarding the potential for reporting bias. However, none of these 83 studies enrolled infants at high risk of allergy. We assessed five studies as ongoing. Of these, three studies enrolled infants not selected for risk of allergy and did not prespecify allergy as an outcome measure (Caplan 2013; Collins 2012; Millett 2010). One ongoing study enrolled infants not selected for risk of allergy and prespecified adverse events but not allergy as an outcome measure (Gianni 2012). One ongoing study enrolled infants at high risk of allergy and prespecified atopic dermatitis as an outcome measure (Liu 2013).
Outcome reporting was variable. Outcomes reported by more than half of the nine studies, which reported allergy outcome data that we were able to extract for use in this review, included all allergy (five studies) and dermatitis/eczema (nine studies). The timing of allergy assessment and length of follow‐up was also variable. Four studies reported allergy outcomes beyond infancy for 789 infants with no significant difference found for any allergy outcome in childhood.
The types of PUFAs used in individual studies was highly variable. PUFA supplementations were derived from a variety of different sources. Consequently, n‐3:n‐6 ratios were not consistent across studies and supplements had varying amounts of LCPUFAs. The amount of PUFA used for supplementation was also variable as was the underlying PUFA intake of the infants in individual studies. Studies variably compared intermediate to high PUFA intakes in intervention groups with intermediate to high PUFA intakes in control groups. The duration of supplementation was not consistent across studies although the duration for eligibility in the review was at least one month of supplementation.
Subgroup analyses according to the amount of PUFA supplementation were not prespecified or performed. It is pragmatically difficult to quantify the amount of supplementation due to the different ways infants were supplemented. This included PUFA supplements given to the infants directly, increased PUFA concentrations in formula milk and supplementation given to breastfeeding mothers.
Quality of the evidence
There is a substantial concern for publication bias, particularly regarding studies that do not enrol infants at high risk of allergy. There are a substantial number of studies that have not reported allergy outcomes. We assessed only one study that reported allergy outcomes as high quality with low risk of bias from allocation concealment, randomisation, blinding of treatment and less than 10% loss to follow‐up (Smithers 2008). The other studies had methodological concerns such as not reporting method of sequence generation, high risk for reporting bias and high risk for attrition bias (range of losses 10% to 56%). The majority of studies reported links with commercial interests.
It is unclear if the effect of PUFA supplementation in reducing the infant incidence of allergic rhinitis is clinically important. Meta‐analysis found a significant reduction in infant incidence of allergic rhinitis with the upper CI including a benefit of unclear clinical importance (2 studies, 594 infants; fixed effect RR 0.47, 95% CI 0.23 to 0.96; heterogeneity I2 = 6%, P = 0.30). This may be a chance finding given data were predominately from one study (Smithers 2008). Potential benefits did not persist beyond two years of age. No study reported childhood incidence of allergic rhinitis and meta‐analysis found no difference in childhood prevalence of allergic rhinitis (2 studies, 635 infants; fixed effect RR 1.02, 95% CI 0.83 to 1.25; heterogeneity I2 = 0%).
We graded the evidence for no effect on infant incidence, childhood incidence and childhood prevalence of all allergy as very low with downgrading due to losses to follow‐up and wide CIs. We graded the reduction in infant incidence of allergic rhinitis as very low with downgrading due to wide CIs, reporting by a minority of studies and one study reporting an effect. We graded the evidence for no effect on infant incidence, childhood incidence and childhood prevalence of the other allergic outcomes as very low to low.
Potential biases in the review process
We conducted extensive searches of the published and unpublished literature for trials of PUFAs in infancy. There is substantial potential for publication bias from under‐reporting of negative trials in infants not selected for risk of allergy. Some studies that did not report allergy assessed infants for adverse events and tolerance. There is potential for selective reporting bias as the review combined studies reporting outcomes at multiple times and differing time periods. We minimised this in the review by prespecifying definitions for timing of reporting and prespecifying the use of data from the latest time point within these time periods reported by each study.
Two review authors (TS, DAO) independently assessed the trials and extracted data. We prespecified all allergic outcomes reported and subgroup analyses. Outcomes included in this review were compatible with standardised definitions of clinical allergy. We did not included surrogate measures of allergy including results of skin tests and serological evidence of atopy without clinical allergy as prespecified outcomes in this review as they have a variable relationship with clinical manifestations of allergy. The authors of this review have no financial or material conflicts of interest to report.
Agreements and disagreements with other studies or reviews
A related Cochrane systematic review, 'Maternal prenatal and/or postnatal n‐3 long chain polyunsaturated fatty acids (LCPUFA) supplementation for preventing allergies in early childhood' (Gunaratne 2015), assessed the effect of n‐3 LCPUFA supplementation in pregnant or breastfeeding (or both) women on allergy outcomes in their children. The review concluded, "Overall, there is limited evidence to support maternal n‐3 LCPUFA supplementation during pregnancy and/or lactation for reducing allergic disease in children."
There have been several systematic reviews assessing the effect of perinatal PUFA supplementation on a range of allergy outcomes in infants. The majority of reviews have concluded that the evidence for PUFA supplementation in infancy for the prevention of allergy is inconclusive (Anandan 2009; D'Auria 2014; Foolad 2013; Klemens 2011; Kremmyda 2011). A review that concluded that there is likely to be a protective effect was partly based on studies that have reported on immune markers of allergic disease rather than clinical allergy (Koletzko 2014).
Authors' conclusions
Implications for practice.
There is no evidence that polyunsaturated fatty acid (PUFA) supplementation in infancy has an effect on infant or childhood allergy, asthma, dermatitis/eczema or food allergy. However, the quality of evidence was graded as very low. There is insufficient evidence to determine an effect on allergic rhinitis.
Implications for research.
Further large independent trials are needed before PUFA supplementation can be recommended for the prevention of allergy. High quality trials are needed in preterm and term infants, particularly in those at high risk of allergy. Allergy outcomes should be prespecified using standardised definitions and should be measured beyond infancy.
Acknowledgements
We would like to thank external referee Janet Berrington.
Appendices
Appendix 1. CENTRAL search strategy
All MeSH terms exploded
#1 MeSH descriptor: (Infant)
#2 neonat*:ti,ab,kw
#3 infant*:ti,ab,kw
#4 newborn*:ti,ab,kw
#5 pediatric*:ti,ab,kw
#6 paediatric*:ti,ab,kw
#7 #1 or #2 or #3 or #4 or #5 or #6
#8 MeSH descriptor: [Fatty Acids, Unsaturated]
#9 MeSH descriptor: [Fatty Acids, Omega‐3]
#10 MeSH descriptor: [Fatty Acids, Omega‐6]
#11 MeSH descriptor: [Dietary Fats, Unsaturated]
#12 MeSH descriptor: [Linolenic Acids]
#13 MeSH descriptor: [Linoleic Acids]
#14 MeSH descriptor: [Docosahexaenoic Acids]
#15 MeSH descriptor: [Eicosapentaenoic Acid]
#16 pufa:ti,ab,kw
#17 polyunsaturated*:ti,ab,kw
#18 omega‐3:ti,ab,kw
#19 omega‐6:ti,ab,kw
#20 linolenic*:ti,ab,kw
#21 linoleic*:ti,ab,kw
#22 docosahexaenoic*:ti,ab,kw
#23 eicosapentaenoic*:ti,ab,kw
#24 #8 or #9 or #10 or #11 or #12 or #13 or #14 or #15 or #16 or #17 or #18 or #19 or #20 or #21 or #22 or #23
#25 #7 and #24=1079 records
Appendix 2. MEDLINE search strategy
All MeSH terms exploded
1. infant$.mp
2. infant.me
3. newborn$.mp
4. neonat$.mp
5. pediatric$.mp
6. paediatric$.mp
7. #1 OR #2 OR #3 OR #4 OR #5 OR #6
8. PUFA.mp
9. polyunsaturated$.mp
10. fatty acids, unsaturated.me
11. dietary fats, unsaturated.me
12. omega‐3.mp
13. fatty acids, omega‐3.me
14. omega‐6.mp
15. fatty acids, omega‐6.me
16. linolenic$.mp
17. linolenic acids.me
18. linoleic$.mp
19. linoleic acid.me
20. docosahexaenoic$.mp
21. docosahexaenoic acids.me
22. eicosapentaenoic$.mp
23. eicosapentaenoic acid.me
24. #8 OR #9 OR #10 OR #11 OR #12 OR #13 OR #14 OR #15 OR #16 OR #17 OR #18 OR #19 OR #20 OR #22 OR #23
25. #7 AND #24
26. limit 25 to 'randomised controlled trial'=875 records
Appendix 3. EMBASE search strategy
All MeSH terms exploded
1. infant$.mp
2. newborn$.mp
3. neonat$.mp
4. pediatric$.mp
5. paediatric$.mp
6. exp pediatrics
7. #1 OR #2 OR #3 OR #4 OR #5 OR #6
8. PUFA.mp
9. polyunsaturated$.mp
10. exp polyunsaturated fatty acid
11. exp unsaturated fatty acid
12. omega‐3.mp
13. exp omega 3 fatty acid
14. omega‐6.mp
15. exp omega 6 fatty acid
16. linolenic$.mp
17.exp linolenic acid
18. linoleic$.mp
19.exp linoleic acid
20. docosahexaenoic$.mp
21. exp docosahexaenoic acid
22. eicosapentaenoic$.mp
23. exp icosapentaenoic acid
24. exp fish oil
25. #8 OR #9 OR #10 OR #11 OR #12 OR #13 OR #14 OR #15 OR #16 OR #17 OR #18 OR #19 OR #20 OR #21 OR #22 OR #23 OR #24
26. #7 AND #25
27. limit 41 to 'randomised controlled trial'
Appendix 4. Risk of bias tool
1. Sequence generation (checking for possible selection bias)
For each included study, we described the method used to generate the allocation sequence in sufficient detail to allow an assessment of whether it should produce comparable groups. We assessed the method as:
low risk (any truly random process, e.g. random number table; computer random number generator);
high risk (any non‐random process, e.g. odd or even date of birth; hospital or clinic record number);
unclear risk.
2. Allocation concealment (checking for possible selection bias)
For each included study, we described the method used to conceal the allocation sequence in sufficient detail and determined whether intervention allocation could have been foreseen in advance of, or during recruitment, or changed after assignment.
We assessed the methods as:
low risk (e.g. telephone or central randomisation; consecutively numbered sealed opaque envelopes);
high risk (open random allocation; unsealed or non‐opaque envelopes, alternation; date of birth);
unclear risk.
3. Blinding of participants and personnel (checking for possible performance bias)
For each included study, we described the methods used, if any, to blind study participants and personnel from knowledge of which intervention a participant received. We judged studies to be at low risk of bias if they were blinded, or if we judged that the lack of blinding could not have affected the results.
We assessed the methods as:
low risk, high risk or unclear risk for participants;
low risk, high risk or unclear risk for personnel.
4. Blinding of outcome assessment (checking for possible detection bias)
For each included study, we described the methods used, if any, to blind outcome assessors from knowledge of which intervention a participant received. We judged studies to be at low risk of bias if they were blinded, or if we judged that the lack of blinding could not have affected the results.
We assessed the methods as:
low risk, high risk or unclear risk for blinding of outcome assessors.
5. Incomplete outcome data (checking for possible attrition bias through withdrawals, drop‐outs, protocol deviations)
For each included study and for each outcome or class of outcomes, we described the completeness of data including attrition and exclusions from the analysis. We stated whether attrition and exclusions were reported, the numbers included in the analysis at each stage (compared with the total randomised participants), reasons for attrition or exclusion where reported, and whether missing data were balanced across groups or were related to outcomes.
Where sufficient information was reported or could be supplied by the trial authors, we included missing data in the analyses. We assessed the methods as:
low risk (< 10% missing data);
high risk;
unclear risk.
6. Outcome reporting bias
For each included study, we assessed the possibility of selective outcome reporting bias by assessing the reported methodology in the trial publication and, when necessary, compared with the entry in the clinical trial registries, the original trial protocols, or both obtained by contacting study authors.
We assessed the methods as:
low risk (where it was clear that all of the study's prespecified outcomes and all expected outcomes of interest to the review were reported);
high risk (where not all the study's prespecified outcomes were reported; one or more reported primary outcomes were not prespecified; outcomes of interest were reported incompletely and so could not be used; study did not include results of a key outcome that would have been expected to have been reported);
unclear risk.
7. Other sources of bias
For each included study, we described any important concern we had about other possible sources of bias. We assessed whether each study was free of other problems that could put it at risk of bias. We assessed the methods as:
low risk;
high risk;
unclear risk.
Overall risk of bias
We made explicit judgements about whether studies were at high risk of bias, according to the criteria given in the Cochrane Handbook for Systematic Reviews of Interventions (Higgins 2011). With reference to 1. to 7. above, we assessed the likely magnitude and direction of the bias and whether we considered it was likely to impact on the findings. We explored the impact of the level of bias through undertaking sensitivity analyses ‐ see Sensitivity analysis.
Data and analyses
Comparison 1. Higher versus lower PUFA intake.
| Outcome or subgroup title | No. of studies | No. of participants | Statistical method | Effect size |
|---|---|---|---|---|
| 1 All allergic disease | 5 | Risk Ratio (M‐H, Fixed, 95% CI) | Subtotals only | |
| 1.1 Infant incidence | 1 | 323 | Risk Ratio (M‐H, Fixed, 95% CI) | 0.96 [0.73, 1.26] |
| 1.2 Childhood incidence | 2 | 154 | Risk Ratio (M‐H, Fixed, 95% CI) | 0.69 [0.47, 1.02] |
| 1.3 Childhood prevalence | 2 | 633 | Risk Ratio (M‐H, Fixed, 95% CI) | 0.98 [0.81, 1.19] |
| 2 Asthma | 4 | Risk Ratio (M‐H, Fixed, 95% CI) | Subtotals only | |
| 2.1 Infant incidence | 3 | 1162 | Risk Ratio (M‐H, Fixed, 95% CI) | 1.04 [0.80, 1.35] |
| 2.2 Childhood incidence | 1 | 89 | Risk Ratio (M‐H, Fixed, 95% CI) | 0.45 [0.20, 1.02] |
| 2.3 Childhood prevalence | 2 | 635 | Risk Ratio (M‐H, Fixed, 95% CI) | 1.12 [0.82, 1.53] |
| 3 Dermatitis/eczema | 9 | Risk Ratio (M‐H, Fixed, 95% CI) | Subtotals only | |
| 3.1 Infant incidence | 7 | 1906 | Risk Ratio (M‐H, Fixed, 95% CI) | 0.93 [0.82, 1.06] |
| 3.2 Childhood incidence | 2 | 154 | Risk Ratio (M‐H, Fixed, 95% CI) | 0.65 [0.34, 1.24] |
| 3.3 Childhood prevalence | 2 | 635 | Risk Ratio (M‐H, Fixed, 95% CI) | 0.81 [0.59, 1.09] |
| 4 Allergic rhinitis | 3 | Risk Ratio (M‐H, Fixed, 95% CI) | Subtotals only | |
| 4.1 Infant incidence | 2 | 594 | Risk Ratio (M‐H, Fixed, 95% CI) | 0.47 [0.23, 0.96] |
| 4.2 Childhood prevalence | 2 | 635 | Risk Ratio (M‐H, Fixed, 95% CI) | 1.02 [0.83, 1.25] |
| 5 Food allergy | 4 | Risk Ratio (M‐H, Fixed, 95% CI) | Subtotals only | |
| 5.1 Infant incidence | 3 | 915 | Risk Ratio (M‐H, Fixed, 95% CI) | 0.81 [0.56, 1.19] |
| 5.2 Childhood incidence | 1 | 65 | Risk Ratio (M‐H, Fixed, 95% CI) | 2.27 [0.25, 20.68] |
| 5.3 Childhood prevalence | 1 | 119 | Risk Ratio (M‐H, Fixed, 95% CI) | 0.27 [0.06, 1.19] |
Comparison 2. Higher versus lower PUFA intake: subgrouped by supplementation of infant versus supplementation of mother.
| Outcome or subgroup title | No. of studies | No. of participants | Statistical method | Effect size |
|---|---|---|---|---|
| 1 All allergic disease ‐ infant incidence | 1 | Risk Ratio (M‐H, Fixed, 95% CI) | Subtotals only | |
| 1.1 Infant supplementation | 1 | 323 | Risk Ratio (M‐H, Fixed, 95% CI) | 0.96 [0.73, 1.26] |
| 2 All allergic disease ‐ childhood incidence | 2 | Risk Ratio (M‐H, Fixed, 95% CI) | Subtotals only | |
| 2.1 Infant supplementation | 1 | 89 | Risk Ratio (M‐H, Fixed, 95% CI) | 0.56 [0.34, 0.92] |
| 2.2 Maternal supplementation | 1 | 65 | Risk Ratio (M‐H, Fixed, 95% CI) | 0.98 [0.51, 1.91] |
| 3 All allergic disease ‐ childhood prevalence | 2 | Risk Ratio (M‐H, Fixed, 95% CI) | Subtotals only | |
| 3.1 Infant supplementation | 1 | 516 | Risk Ratio (M‐H, Fixed, 95% CI) | 1.01 [0.83, 1.25] |
| 3.2 Maternal supplementation | 1 | 117 | Risk Ratio (M‐H, Fixed, 95% CI) | 0.78 [0.44, 1.38] |
| 4 Asthma ‐ infant incidence | 3 | Risk Ratio (M‐H, Fixed, 95% CI) | Subtotals only | |
| 4.1 Infant supplementation | 1 | 554 | Risk Ratio (M‐H, Fixed, 95% CI) | 1.19 [0.78, 1.81] |
| 4.2 Maternal supplementation | 2 | 608 | Risk Ratio (M‐H, Fixed, 95% CI) | 0.96 [0.69, 1.33] |
| 5 Asthma ‐ childhood incidence | 1 | Risk Ratio (M‐H, Fixed, 95% CI) | Subtotals only | |
| 5.1 Infant supplementation | 1 | 89 | Risk Ratio (M‐H, Fixed, 95% CI) | 0.45 [0.20, 1.02] |
| 6 Asthma ‐ childhood prevalence | 2 | Risk Ratio (M‐H, Fixed, 95% CI) | Subtotals only | |
| 6.1 Infant supplementation | 1 | 516 | Risk Ratio (M‐H, Fixed, 95% CI) | 1.13 [0.82, 1.57] |
| 6.2 Maternal supplementation | 1 | 119 | Risk Ratio (M‐H, Fixed, 95% CI) | 1.05 [0.41, 2.72] |
| 7 Dermatitis/eczema ‐ infant incidence | 7 | Risk Ratio (M‐H, Fixed, 95% CI) | Subtotals only | |
| 7.1 Infant supplementation | 5 | 1245 | Risk Ratio (M‐H, Fixed, 95% CI) | 0.95 [0.82, 1.11] |
| 7.2 Maternal supplementation | 3 | 661 | Risk Ratio (M‐H, Fixed, 95% CI) | 0.88 [0.68, 1.15] |
| 8 Dermatitis/eczema ‐ childhood incidence | 2 | Risk Ratio (M‐H, Fixed, 95% CI) | Subtotals only | |
| 8.1 Infant supplementation | 1 | 89 | Risk Ratio (M‐H, Fixed, 95% CI) | 0.55 [0.25, 1.20] |
| 8.2 Maternal supplementation | 1 | 65 | Risk Ratio (M‐H, Fixed, 95% CI) | 0.95 [0.28, 3.20] |
| 9 Dermatitis/eczema ‐ childhood prevalence | 2 | Risk Ratio (M‐H, Fixed, 95% CI) | Subtotals only | |
| 9.1 Infant supplementation | 1 | 516 | Risk Ratio (M‐H, Fixed, 95% CI) | 0.85 [0.62, 1.18] |
| 9.2 Maternal supplementation | 1 | 119 | Risk Ratio (M‐H, Fixed, 95% CI) | 0.56 [0.23, 1.36] |
| 10 Allergic rhinitis ‐ infant incidence | 2 | Risk Ratio (M‐H, Fixed, 95% CI) | Subtotals only | |
| 10.1 Maternal supplementation | 2 | 594 | Risk Ratio (M‐H, Fixed, 95% CI) | 0.47 [0.23, 0.96] |
| 11 Allergic rhinitis ‐ childhood prevalence | 2 | Risk Ratio (M‐H, Fixed, 95% CI) | Subtotals only | |
| 11.1 Infant supplementation | 1 | 516 | Risk Ratio (M‐H, Fixed, 95% CI) | 1.01 [0.83, 1.25] |
| 11.2 Maternal supplementation | 1 | 119 | Risk Ratio (M‐H, Fixed, 95% CI) | 1.20 [0.18, 8.26] |
| 12 Food allergy ‐ infant incidence | 3 | Risk Ratio (M‐H, Fixed, 95% CI) | Subtotals only | |
| 12.1 Infant supplementation | 1 | 323 | Risk Ratio (M‐H, Fixed, 95% CI) | 0.81 [0.47, 1.42] |
| 12.2 Maternal supplementation | 2 | 592 | Risk Ratio (M‐H, Fixed, 95% CI) | 0.81 [0.48, 1.37] |
| 13 Food allergy ‐ childhood incidence | 1 | Risk Ratio (M‐H, Fixed, 95% CI) | Subtotals only | |
| 13.1 Maternal supplementation | 1 | 65 | Risk Ratio (M‐H, Fixed, 95% CI) | 2.27 [0.25, 20.68] |
| 14 Food allergy ‐ childhood prevalence | 1 | Risk Ratio (M‐H, Fixed, 95% CI) | Subtotals only | |
| 14.1 Maternal supplementation | 1 | 119 | Risk Ratio (M‐H, Fixed, 95% CI) | 0.27 [0.06, 1.19] |
Comparison 3. Higher versus lower PUFA intake: subgrouped by n‐3 versus n‐6 supplementation.
| Outcome or subgroup title | No. of studies | No. of participants | Statistical method | Effect size |
|---|---|---|---|---|
| 1 All allergic disease ‐ infant incidence | 1 | Risk Ratio (M‐H, Fixed, 95% CI) | Subtotals only | |
| 1.1 n‐3 supplementation | 1 | 323 | Risk Ratio (M‐H, Fixed, 95% CI) | 0.96 [0.73, 1.26] |
| 2 All allergic disease ‐ childhood incidence | 2 | Risk Ratio (M‐H, Fixed, 95% CI) | Subtotals only | |
| 2.1 n‐3 supplementation | 2 | 154 | Risk Ratio (M‐H, Fixed, 95% CI) | 0.69 [0.47, 1.02] |
| 3 All allergic disease ‐ childhood prevalence | 2 | Risk Ratio (M‐H, Fixed, 95% CI) | Subtotals only | |
| 3.1 n‐3 supplementation | 2 | 633 | Risk Ratio (M‐H, Fixed, 95% CI) | 0.98 [0.81, 1.19] |
| 4 Asthma ‐ infant incidence | 3 | Risk Ratio (M‐H, Fixed, 95% CI) | Subtotals only | |
| 4.1 n‐3 supplementation | 3 | 1162 | Risk Ratio (M‐H, Fixed, 95% CI) | 1.04 [0.80, 1.35] |
| 5 Asthma ‐ childhood incidence | 1 | Risk Ratio (M‐H, Fixed, 95% CI) | Subtotals only | |
| 5.1 n‐3 supplementation | 1 | 89 | Risk Ratio (M‐H, Fixed, 95% CI) | 0.45 [0.20, 1.02] |
| 6 Asthma ‐ childhood prevalence | 2 | Risk Ratio (M‐H, Fixed, 95% CI) | Subtotals only | |
| 6.1 n‐3 supplementation | 2 | 635 | Risk Ratio (M‐H, Fixed, 95% CI) | 1.12 [0.82, 1.53] |
| 7 Dermatitis/eczema ‐ infant incidence | 7 | Risk Ratio (M‐H, Fixed, 95% CI) | Subtotals only | |
| 7.1 n‐3 supplementation | 5 | 1657 | Risk Ratio (M‐H, Fixed, 95% CI) | 0.95 [0.82, 1.09] |
| 7.2 n‐6 supplementation | 2 | 249 | Risk Ratio (M‐H, Fixed, 95% CI) | 0.85 [0.59, 1.23] |
| 8 Dermatitis/eczema ‐ childhood incidence | 2 | Risk Ratio (M‐H, Fixed, 95% CI) | Subtotals only | |
| 8.1 n‐3 supplementation | 2 | 154 | Risk Ratio (M‐H, Fixed, 95% CI) | 0.65 [0.34, 1.24] |
| 9 Dermatitis/eczema ‐ childhood prevalence | 2 | Risk Ratio (M‐H, Fixed, 95% CI) | Subtotals only | |
| 9.1 n‐3 supplementation | 2 | 635 | Risk Ratio (M‐H, Fixed, 95% CI) | 0.81 [0.59, 1.09] |
| 10 Allergic rhinitis ‐ infant incidence | 2 | Risk Ratio (M‐H, Fixed, 95% CI) | Subtotals only | |
| 10.1 n‐3 supplementation | 2 | 594 | Risk Ratio (M‐H, Fixed, 95% CI) | 0.47 [0.23, 0.96] |
| 11 Allergic rhinitis ‐ childhood prevalence | 2 | Risk Ratio (M‐H, Fixed, 95% CI) | Subtotals only | |
| 11.1 n‐3 supplementation | 2 | 635 | Risk Ratio (M‐H, Fixed, 95% CI) | 1.02 [0.83, 1.25] |
| 12 Food allergy ‐ infant incidence | 3 | Risk Ratio (M‐H, Fixed, 95% CI) | Subtotals only | |
| 12.1 n‐3 supplementation | 3 | 915 | Risk Ratio (M‐H, Fixed, 95% CI) | 0.81 [0.56, 1.19] |
| 13 Food allergy ‐ childhood incidence | 1 | Risk Ratio (M‐H, Fixed, 95% CI) | Subtotals only | |
| 13.1 n‐3 supplementation | 1 | 65 | Risk Ratio (M‐H, Fixed, 95% CI) | 2.27 [0.25, 20.68] |
| 14 Food allergy ‐ childhood prevalence | 1 | Risk Ratio (M‐H, Fixed, 95% CI) | Subtotals only | |
| 14.1 n‐3 supplementation | 1 | 119 | Risk Ratio (M‐H, Fixed, 95% CI) | 0.27 [0.06, 1.19] |
Comparison 4. Higher versus lower PUFA intake: subgrouped by method of infant feeding.
| Outcome or subgroup title | No. of studies | No. of participants | Statistical method | Effect size |
|---|---|---|---|---|
| 1 All allergic disease ‐ infant incidence | 1 | Risk Ratio (M‐H, Fixed, 95% CI) | Subtotals only | |
| 1.1 Human milk fed infants | 1 | 323 | Risk Ratio (M‐H, Fixed, 95% CI) | 0.96 [0.73, 1.26] |
| 2 All allergic disease ‐ childhood incidence | 2 | Risk Ratio (M‐H, Fixed, 95% CI) | Subtotals only | |
| 2.1 Human milk fed infants | 1 | 65 | Risk Ratio (M‐H, Fixed, 95% CI) | 0.98 [0.51, 1.91] |
| 2.2 Formula fed infants | 1 | 89 | Risk Ratio (M‐H, Fixed, 95% CI) | 0.56 [0.34, 0.92] |
| 3 All allergic disease ‐ childhood prevalence | 2 | Risk Ratio (M‐H, Fixed, 95% CI) | Subtotals only | |
| 3.1 Human milk fed infants | 2 | 633 | Risk Ratio (M‐H, Fixed, 95% CI) | 0.98 [0.81, 1.19] |
| 4 Asthma ‐ infant incidence | 3 | Risk Ratio (M‐H, Fixed, 95% CI) | Subtotals only | |
| 5 Asthma ‐ childhood incidence | 1 | Risk Ratio (M‐H, Fixed, 95% CI) | Subtotals only | |
| 5.1 Formula fed infants | 1 | 89 | Risk Ratio (M‐H, Fixed, 95% CI) | 0.45 [0.20, 1.02] |
| 6 Asthma ‐ childhood prevalence | 2 | Risk Ratio (M‐H, Fixed, 95% CI) | Subtotals only | |
| 6.1 Human milk fed infants | 2 | 635 | Risk Ratio (M‐H, Fixed, 95% CI) | 1.12 [0.82, 1.53] |
| 7 Dermatitis/eczema ‐ infant incidence | 7 | Risk Ratio (M‐H, Fixed, 95% CI) | Subtotals only | |
| 7.1 Human milk fed infants | 6 | 1715 | Risk Ratio (M‐H, Fixed, 95% CI) | 0.95 [0.82, 1.09] |
| 7.2 Formula fed infants | 2 | 191 | Risk Ratio (M‐H, Fixed, 95% CI) | 0.84 [0.57, 1.23] |
| 8 Dermatitis/eczema ‐ childhood incidence | 2 | Risk Ratio (M‐H, Fixed, 95% CI) | Subtotals only | |
| 8.1 Human milk fed infants | 1 | 65 | Risk Ratio (M‐H, Fixed, 95% CI) | 0.95 [0.28, 3.20] |
| 8.2 Formula fed infants | 1 | 89 | Risk Ratio (M‐H, Fixed, 95% CI) | 0.55 [0.25, 1.20] |
| 9 Dermatitis/eczema ‐ childhood prevalence | 2 | Risk Ratio (M‐H, Fixed, 95% CI) | Subtotals only | |
| 9.1 Human milk fed infants | 2 | 635 | Risk Ratio (M‐H, Fixed, 95% CI) | 0.81 [0.59, 1.09] |
| 10 Allergic rhinitis ‐ infant incidence | 2 | Risk Ratio (M‐H, Fixed, 95% CI) | Subtotals only | |
| 10.1 Human milk fed infants | 2 | 594 | Risk Ratio (M‐H, Fixed, 95% CI) | 0.47 [0.23, 0.96] |
| 11 Allergic rhinitis ‐ childhood prevalence | 2 | Risk Ratio (M‐H, Fixed, 95% CI) | Subtotals only | |
| 11.1 Human milk fed infants | 2 | 635 | Risk Ratio (M‐H, Fixed, 95% CI) | 1.02 [0.83, 1.25] |
| 12 Food allergy ‐ infant incidence | 3 | Risk Ratio (M‐H, Fixed, 95% CI) | Subtotals only | |
| 12.1 Human milk fed infants | 3 | 915 | Risk Ratio (M‐H, Fixed, 95% CI) | 0.81 [0.56, 1.19] |
| 13 Food allergy ‐ childhood incidence | 1 | Risk Ratio (M‐H, Fixed, 95% CI) | Subtotals only | |
| 13.1 Human milk fed infants | 1 | 65 | Risk Ratio (M‐H, Fixed, 95% CI) | 2.27 [0.25, 20.68] |
| 14 Food allergy ‐ childhood prevalence | 1 | Risk Ratio (M‐H, Fixed, 95% CI) | Subtotals only | |
| 14.1 Human milk fed infants | 1 | 119 | Risk Ratio (M‐H, Fixed, 95% CI) | 0.27 [0.06, 1.19] |
Comparison 5. Higher versus lower PUFA intake: subgrouped by infant heredity for allergy.
| Outcome or subgroup title | No. of studies | No. of participants | Statistical method | Effect size |
|---|---|---|---|---|
| 1 All allergic disease ‐ infant incidence | 1 | Risk Ratio (M‐H, Fixed, 95% CI) | Subtotals only | |
| 1.1 High risk for allergy | 1 | 323 | Risk Ratio (M‐H, Fixed, 95% CI) | 0.96 [0.73, 1.26] |
| 2 All allergic disease ‐ childhood incidence | 2 | Risk Ratio (M‐H, Fixed, 95% CI) | Subtotals only | |
| 2.1 Risk for allergy not selected | 2 | 154 | Risk Ratio (M‐H, Fixed, 95% CI) | 0.69 [0.47, 1.02] |
| 3 All allergic disease ‐ childhood prevalence | 2 | Risk Ratio (M‐H, Fixed, 95% CI) | Subtotals only | |
| 3.1 High risk for allergy | 2 | 633 | Risk Ratio (M‐H, Fixed, 95% CI) | 0.98 [0.81, 1.19] |
| 4 Asthma ‐ infant incidence | 3 | Risk Ratio (M‐H, Fixed, 95% CI) | Subtotals only | |
| 4.1 High risk for allergy | 2 | 673 | Risk Ratio (M‐H, Fixed, 95% CI) | 1.16 [0.79, 1.71] |
| 4.2 Risk for allergy not selected | 1 | 489 | Risk Ratio (M‐H, Fixed, 95% CI) | 0.94 [0.66, 1.34] |
| 5 Asthma ‐ childhood incidence | 1 | Risk Ratio (M‐H, Fixed, 95% CI) | Subtotals only | |
| 5.1 Risk for allergy not selected | 1 | 89 | Risk Ratio (M‐H, Fixed, 95% CI) | 0.45 [0.20, 1.02] |
| 6 Asthma ‐ childhood prevalence | 2 | Risk Ratio (M‐H, Fixed, 95% CI) | Subtotals only | |
| 6.1 High risk for allergy | 2 | 635 | Risk Ratio (M‐H, Fixed, 95% CI) | 1.12 [0.82, 1.53] |
| 7 Dermatitis/eczema ‐ infant incidence | 7 | Risk Ratio (M‐H, Fixed, 95% CI) | Subtotals only | |
| 7.1 High risk for allergy | 5 | 1245 | Risk Ratio (M‐H, Fixed, 95% CI) | 0.96 [0.81, 1.12] |
| 7.2 Risk for allergy not selected | 2 | 661 | Risk Ratio (M‐H, Fixed, 95% CI) | 0.89 [0.71, 1.12] |
| 8 Dermatitis/eczema ‐ childhood incidence | 2 | Risk Ratio (M‐H, Fixed, 95% CI) | Subtotals only | |
| 8.1 Risk for allergy not selected | 2 | 154 | Risk Ratio (M‐H, Fixed, 95% CI) | 0.65 [0.34, 1.24] |
| 9 Dermatitis/eczema ‐ childhood prevalence | 2 | Risk Ratio (M‐H, Fixed, 95% CI) | Subtotals only | |
| 9.1 High risk for allergy | 2 | 635 | Risk Ratio (M‐H, Fixed, 95% CI) | 0.81 [0.59, 1.09] |
| 10 Allergic rhinitis ‐ infant incidence | 2 | Risk Ratio (M‐H, Fixed, 95% CI) | Subtotals only | |
| 10.1 High risk for allergy | 1 | 119 | Risk Ratio (M‐H, Fixed, 95% CI) | 1.20 [0.18, 8.26] |
| 10.2 Risk for allergy not selected | 1 | 475 | Risk Ratio (M‐H, Fixed, 95% CI) | 0.40 [0.18, 0.89] |
| 11 Allergic rhinitis ‐ childhood prevalence | 2 | Risk Ratio (M‐H, Fixed, 95% CI) | Subtotals only | |
| 11.1 High risk for allergy | 2 | 635 | Risk Ratio (M‐H, Fixed, 95% CI) | 1.02 [0.83, 1.25] |
| 12 Food allergy ‐ infant incidence | 3 | Risk Ratio (M‐H, Fixed, 95% CI) | Subtotals only | |
| 12.1 High risk for allergy | 2 | 442 | Risk Ratio (M‐H, Fixed, 95% CI) | 0.62 [0.38, 1.02] |
| 12.2 Risk for allergy not selected | 1 | 473 | Risk Ratio (M‐H, Fixed, 95% CI) | 1.24 [0.67, 2.31] |
| 13 Food allergy ‐ childhood incidence | 1 | Risk Ratio (M‐H, Fixed, 95% CI) | Subtotals only | |
| 13.1 Risk for allergy not selected | 1 | 65 | Risk Ratio (M‐H, Fixed, 95% CI) | 2.27 [0.25, 20.68] |
| 14 Food allergy ‐ childhood prevalence | 1 | Risk Ratio (M‐H, Fixed, 95% CI) | Subtotals only | |
| 14.1 High risk for allergy | 1 | 119 | Risk Ratio (M‐H, Fixed, 95% CI) | 0.27 [0.06, 1.19] |
Comparison 6. Higher versus lower PUFA intake: subgrouped by gestational age at birth.
| Outcome or subgroup title | No. of studies | No. of participants | Statistical method | Effect size |
|---|---|---|---|---|
| 1 All allergic disease ‐ infant incidence | 1 | Risk Ratio (M‐H, Fixed, 95% CI) | Subtotals only | |
| 1.1 Term infants | 1 | 323 | Risk Ratio (M‐H, Fixed, 95% CI) | 0.96 [0.73, 1.26] |
| 2 All allergic disease ‐ childhood incidence | 2 | Risk Ratio (M‐H, Fixed, 95% CI) | Subtotals only | |
| 2.1 Term infants | 2 | 154 | Risk Ratio (M‐H, Fixed, 95% CI) | 0.69 [0.47, 1.02] |
| 3 All allergic disease ‐ childhood prevalence | 2 | Risk Ratio (M‐H, Fixed, 95% CI) | Subtotals only | |
| 3.1 Term infants | 2 | 633 | Risk Ratio (M‐H, Fixed, 95% CI) | 0.98 [0.81, 1.19] |
| 4 Asthma ‐ infant incidence | 3 | Risk Ratio (M‐H, Fixed, 95% CI) | Subtotals only | |
| 4.1 Term infants | 2 | 673 | Risk Ratio (M‐H, Fixed, 95% CI) | 1.16 [0.79, 1.71] |
| 4.2 Preterm infants | 1 | 489 | Risk Ratio (M‐H, Fixed, 95% CI) | 0.94 [0.66, 1.34] |
| 5 Asthma ‐ childhood incidence | 1 | Risk Ratio (M‐H, Fixed, 95% CI) | Subtotals only | |
| 5.1 Term infants | 1 | 89 | Risk Ratio (M‐H, Fixed, 95% CI) | 0.45 [0.20, 1.02] |
| 6 Asthma ‐ childhood prevalence | 2 | Risk Ratio (M‐H, Fixed, 95% CI) | Subtotals only | |
| 6.1 Term infants | 2 | 635 | Risk Ratio (M‐H, Fixed, 95% CI) | 1.12 [0.82, 1.53] |
| 7 Dermatitis/eczema ‐ infant incidence | 7 | Risk Ratio (M‐H, Fixed, 95% CI) | Subtotals only | |
| 7.1 Term infants | 6 | 1422 | Risk Ratio (M‐H, Fixed, 95% CI) | 0.93 [0.80, 1.07] |
| 7.2 Preterm infants | 1 | 484 | Risk Ratio (M‐H, Fixed, 95% CI) | 0.96 [0.71, 1.29] |
| 8 Dermatitis/eczema ‐ childhood incidence | 2 | Risk Ratio (M‐H, Fixed, 95% CI) | Subtotals only | |
| 8.1 Term infants | 2 | 154 | Risk Ratio (M‐H, Fixed, 95% CI) | 0.65 [0.34, 1.24] |
| 9 Dermatitis/eczema ‐ childhood prevalence | 2 | Risk Ratio (M‐H, Fixed, 95% CI) | Subtotals only | |
| 9.1 Term infants | 2 | 635 | Risk Ratio (M‐H, Fixed, 95% CI) | 0.81 [0.59, 1.09] |
| 10 Allergic rhinitis ‐ infant incidence | 2 | Risk Ratio (M‐H, Fixed, 95% CI) | Subtotals only | |
| 10.1 Term infants | 1 | 119 | Risk Ratio (M‐H, Fixed, 95% CI) | 1.20 [0.18, 8.26] |
| 10.2 Preterm infants | 1 | 475 | Risk Ratio (M‐H, Fixed, 95% CI) | 0.40 [0.18, 0.89] |
| 11 Allergic rhinitis ‐ childhood prevalence | 2 | Risk Ratio (M‐H, Fixed, 95% CI) | Subtotals only | |
| 11.1 Term infants | 2 | 635 | Risk Ratio (M‐H, Fixed, 95% CI) | 1.02 [0.83, 1.25] |
| 12 Food allergy ‐ infant incidence | 3 | Risk Ratio (M‐H, Fixed, 95% CI) | Subtotals only | |
| 12.1 Term infants | 2 | 442 | Risk Ratio (M‐H, Fixed, 95% CI) | 0.62 [0.38, 1.02] |
| 12.2 Preterm infants | 1 | 473 | Risk Ratio (M‐H, Fixed, 95% CI) | 1.24 [0.67, 2.31] |
| 13 Food allergy ‐ childhood incidence | 1 | Risk Ratio (M‐H, Fixed, 95% CI) | Subtotals only | |
| 13.1 Term infants | 1 | 65 | Risk Ratio (M‐H, Fixed, 95% CI) | 2.27 [0.25, 20.68] |
| 14 Food allergy ‐ childhood prevalence | 1 | Risk Ratio (M‐H, Fixed, 95% CI) | Subtotals only | |
| 14.1 Term infants | 1 | 119 | Risk Ratio (M‐H, Fixed, 95% CI) | 0.27 [0.06, 1.19] |
Comparison 7. Higher versus lower PUFA intake: sensitivity analysis.
| Outcome or subgroup title | No. of studies | No. of participants | Statistical method | Effect size |
|---|---|---|---|---|
| 1 Asthma | 1 | Risk Ratio (M‐H, Fixed, 95% CI) | Subtotals only | |
| 1.1 Infant incidence | 1 | 489 | Risk Ratio (M‐H, Fixed, 95% CI) | 0.94 [0.66, 1.34] |
| 2 Dermatitis/eczema | 1 | Risk Ratio (M‐H, Fixed, 95% CI) | Subtotals only | |
| 2.1 Infant incidence | 1 | 484 | Risk Ratio (M‐H, Fixed, 95% CI) | 0.96 [0.71, 1.29] |
| 3 Allergic rhinitis | 1 | Risk Ratio (M‐H, Fixed, 95% CI) | Subtotals only | |
| 3.1 Infant incidence | 1 | 475 | Risk Ratio (M‐H, Fixed, 95% CI) | 0.40 [0.18, 0.89] |
| 4 Food allergy | 1 | Risk Ratio (M‐H, Fixed, 95% CI) | Subtotals only | |
| 4.1 Infant incidence | 1 | 473 | Risk Ratio (M‐H, Fixed, 95% CI) | 1.24 [0.67, 2.31] |
Characteristics of studies
Characteristics of included studies [ordered by study ID]
Birch 2005.
| Methods | Multicentre, double‐blind RCT in USA | |
| Participants | 2 cohorts from previously completed RCTs (cohort A and B) Inclusion criteria: infants (not selected for risk of allergy); gestation 37 to 40 weeks; birth weight appropriate for gestational age; singleton birth; exclusively formula fed Exclusion criteria: family history of milk protein allergy or genetic or familial eye disease; maternal vegetarian or vegan dietary patterns; maternal metabolic disease, anaemia or infection; congenital malformation or infection; jaundice, perinatal asphyxia or meconium aspiration; neonatal intensive care unit admission |
|
| Interventions | Infants randomised to AA + DHA supplement for first year of life Control (n = 90): Enfamil formula with iron (LA 8.5 g/L, α‐LA 0.9 g/L) (n‐3:n‐6 ratio = 1:9) Intervention: control formula with added AA/DHA formula (n = 89): (LA 8.4 g/L, AA 0.4 g/L, α‐LA 0.9 g/L, DHA 0.2 g/L) (n‐3:n‐6 ratio = 1:8) Control group intermediate‐high PUFA intake, intervention group high PUFA intake Co‐interventions: none reported |
|
| Outcomes | Primary outcome (cohort A): visual cortex maturity as assessed by sweep visual evoked potential acuity Primary outcome (cohort B): metabolic parameters including lipoprotein profile, antioxidant status and hydroelectrolytic balance Outcome assessed: incidence of respiratory infections and allergic disease in first 3 years of life (infant allergy incidence) |
|
| Notes | Supported by Mead Johnson Nutrition Co‐authors employees of Mead Johnson Nutrition |
|
| Risk of bias | ||
| Bias | Authors' judgement | Support for judgement |
| Random sequence generation (selection bias) | Unclear risk | Cohort A: all infants were randomly assigned with the use of a single randomisation schedule at a central location. The randomisation schedule had random length blocks (block length varied from 6 to 12) and was provided in individual sealed envelopes to the study site Cohort B: method not reported |
| Allocation concealment (selection bias) | Low risk | |
| Blinding of participants and personnel (performance bias) All outcomes | Low risk | Cohort A: each diet masked by colour and number code Cohort B: reported to be "double blind" but details not reported |
| Blinding of outcome assessment (detection bias) All outcomes | Low risk | |
| Incomplete outcome data (attrition bias) All outcomes | High risk | 90/179 (50%) no outcome data |
| Selective reporting (reporting bias) | High risk | Allergy not prespecified but reported |
| Other bias | Low risk | Groups well balanced after allocation |
Damsgaard 2006.
| Methods | Multicentre 2 x 2 factorial RCT in Denmark May to October 2003 | |
| Participants | Singleton term infants supplemented from 9 to 12 months with a birth weight > 2500 g and above the 5th percentile for gestational age, a 5‐minute Apgar score ≥ 7, no major complications at birth or in fetal life, and no chronic diseases, with a daily consumption of cow's milk or infant formula | |
| Interventions | Infants supplemented from 9 to 12 months Intervention (n = 45): fish oil 5 mL/day (high PUFA intake) (LCPUFA 352 g/L n‐3 60% EPA and 40% DHA and cholesterol 3 g/L; mean fish oil consumption 3.3 mL/day n‐3 LCPUFA 924 mg/day) Control (n = 49): no fish oil (intermediate PUFA intake) Infants were also randomly assigned to drink either cow's milk or standard infant formula (no LCPUFA 18:2(n‐6) and 18:3(n‐3) in a ratio of 8:1) |
|
| Outcomes | Blood pressure, FA profile, growth up to 12 months Allergy: at the end of the intervention period of 3 months, parents were interviewed about infant diet, growth and allergy diagnoses using questions validated for atopic dermatitis. Only reported allergic tendencies (itchy rash, wheezing or food allergy) as verified by a doctor |
|
| Notes | Allergy data only reported at baseline | |
| Risk of bias | ||
| Bias | Authors' judgement | Support for judgement |
| Random sequence generation (selection bias) | Unclear risk | Method not reported. Randomisation done within clusters of 12 by drawing notes from 1 envelope for each intervention |
| Allocation concealment (selection bias) | Low risk | Parents who agreed to the principle of randomisations and whose infants met the inclusion criteria were invited to an individual introduction visit |
| Blinding of participants and personnel (performance bias) All outcomes | High risk | Unmasked |
| Blinding of outcome assessment (detection bias) All outcomes | High risk | |
| Incomplete outcome data (attrition bias) All outcomes | High risk | 11/91 (12%) lost at 12 months |
| Selective reporting (reporting bias) | High risk | Allergy not a stated primary outcome but reported |
| Other bias | High risk | Baseline differences between groups |
Fewtrell 2004.
| Methods | Multicentre RCT in UK April 1995 and July 1997 | |
| Participants | Preterm neonates birth weight ≤ 2000 g supplemented until 9 months' corrected age (formula fed) | |
| Interventions | Intervention (n = 122): fish oil LCPUFA supplemented formula (EPA 0.1%; γ‐LA 0.9%; AA 0.04%; DHA 0.5%) (intermediate‐high PUFA intake) Control (n = 116): borage oil supplemented formula (no EPA; γ‐LA; AA; DHA) (intermediate PUFA intake) |
|
| Outcomes | Growth, development up to 18 months Prevalence of asthma, eczema recorded but not reported |
|
| Notes | Did not report allergy | |
| Risk of bias | ||
| Bias | Authors' judgement | Support for judgement |
| Random sequence generation (selection bias) | Low risk | Random permuted block allocation with assignments kept in sealed opaque envelopes and opened at the point of randomisation |
| Allocation concealment (selection bias) | Low risk | |
| Blinding of participants and personnel (performance bias) All outcomes | Low risk | Trial formulas were identical in appearance and smell. Blinding was maintained until |
| Blinding of outcome assessment (detection bias) All outcomes | Low risk | |
| Incomplete outcome data (attrition bias) All outcomes | High risk | 121/238 (51%) lost at 18 months; 131/238 (55%) lost at 10 years |
| Selective reporting (reporting bias) | High risk | Allergy not prespecified, recorded but not reported |
| Other bias | Unclear risk | Some baseline imbalances between groups |
Furuhjelm 2009.
| Methods | Multicentre, double‐blind RCT in Sweden March 2003 to June 2005 | |
| Participants | Pregnant women with at least 1 first‐degree relative with current or previous allergic symptoms (i.e. bronchial asthma, eczema, allergic food reactions, itching and running eyes and nose at exposure to pollen, pets or other known allergens) Exclusion criteria: allergy to soy or fish; treatment with anticoagulants or n‐3 FA supplements |
|
| Interventions | Mothers randomised to n‐3 FA supplement from 25th week of gestation until cessation of breastfeeding mean 3 to 4 months Control (n = 75): supplemented with soy bean oil (LA 2.5 g, α‐LA 0.2 g; n‐3:n‐6 ratio = 1:9) Intervention (n = 70): supplemented with DHA 1.1 g + EPA 1.6 g (n‐3:n‐6 ratio: n‐3 only) Control group intermediate‐high PUFA intake, intervention group high PUFA intake |
|
| Outcomes | Primary outcome: allergic sensitisation and disease in first 2 years Paediatric allergy research nurses examined children at 3, 6 and 12 months In case of eczema or a food reaction a paediatrician also examined the child Food allergy was defined as: gastrointestinal symptoms, hives, aggravated eczema or wheeze following ingestion of egg or milk in the presence of detectable IgE antibodies or a positive SPT to the particular food. Recovery from symptoms after elimination of the particular food from the diet and reoccurrence after ingestion of the food was required for the diagnosis IgE‐associated eczema: reoccurring and itching eczematous, lichenified or nummular dermatitis according to the criteria modified by Oranje in 1995 (Oranje 1995) in the presence of detectable IgE antibodies or positive SPT towards egg, milk or wheat |
|
| Notes | Supported by GlaxoSmithKline, Sweden Note: childhood prevalence reported at 24 months |
|
| Risk of bias | ||
| Bias | Authors' judgement | Support for judgement |
| Random sequence generation (selection bias) | Unclear risk | Producer performed block randomisation. Method not reported |
| Allocation concealment (selection bias) | Low risk | Recruited ... then accepted participation in a randomised study |
| Blinding of participants and personnel (performance bias) All outcomes | Low risk | Mothers and study personnel blinded to group allocation. Capsules could not be distinguished from each other |
| Blinding of outcome assessment (detection bias) All outcomes | Low risk | |
| Incomplete outcome data (attrition bias) All outcomes | High risk | 29/145 (20%) no outcome data |
| Selective reporting (reporting bias) | Low risk | Primary outcome: allergic sensitisation and disease during the first year of life |
| Other bias | Low risk | Groups similar at baseline |
Hayes 1992.
| Methods | Single centre RCT in USA before 1992 | |
| Participants | Term neonates fed fat‐modified formulas until 4 months of age (formula fed) | |
| Interventions | Control (n = 15): coconut oil/soybean oil formula (LA 25%, α‐LA 2.5%) (intermediate PUFA intake) Intervention (n = 15): corn oil/soybean oil formula (LA 58.5%, α‐LA 2.0%) (intermediate‐high PUFA intake) |
|
| Outcomes | FA profile, growth up to 4 months of age. Parents recorded a diary before each visit including formula acceptance and tolerance | |
| Notes | Did not report allergy | |
| Risk of bias | ||
| Bias | Authors' judgement | Support for judgement |
| Random sequence generation (selection bias) | Unclear risk | Method not reported |
| Allocation concealment (selection bias) | Unclear risk | Details not reported |
| Blinding of participants and personnel (performance bias) All outcomes | Unclear risk | Method not reported |
| Blinding of outcome assessment (detection bias) All outcomes | Unclear risk | Method not reported |
| Incomplete outcome data (attrition bias) All outcomes | Low risk | No loss to follow‐up |
| Selective reporting (reporting bias) | High risk | The parent reported diarrhoea, vomiting, spitting up, prolonged crying (colic), rash, runny nose, wheezing, constipation, appetite changes or other notable conditions |
| Other bias | Unclear risk | Baseline characteristics not reported |
Hoffman 2008.
| Methods | Multicentre RCT in USA before 2008 | |
| Participants | Term neonates with birth weight > 2500 g supplemented until 4 months of age (formula fed) Exclusion criteria: history of underlying disease or malformation that could interfere with growth and development; large‐for‐gestational‐age infants whose mothers had diabetes; breastfeeding within 24 hours prior to randomisation; evidence of formula intolerance or poor intake at time of randomisation; weight at randomisation < 98% of birth weight; enlarged liver or spleen; or plans to move outside area |
|
| Interventions | Intervention (n = 124): soy formula with DHA 17 mg/100 kcal + AA 34 mg/100 kcal (intermediate PUFA intake) Control (n = 120): soy formula without DHA + AA (intermediate PUFA intake) |
|
| Outcomes | FA profile, growth up to 4 months of age. Used SCORAD assessment of atopic dermatitis. Recorded adverse events | |
| Notes | Reported atopic dermatitis severity but not incidence | |
| Risk of bias | ||
| Bias | Authors' judgement | Support for judgement |
| Random sequence generation (selection bias) | Unclear risk | Method not reported |
| Allocation concealment (selection bias) | Unclear risk | Details not reported |
| Blinding of participants and personnel (performance bias) All outcomes | Unclear risk | Method not reported |
| Blinding of outcome assessment (detection bias) All outcomes | Unclear risk | Method not reported |
| Incomplete outcome data (attrition bias) All outcomes | High risk | 62/244 (25%) did not complete study |
| Selective reporting (reporting bias) | High risk | Atopic dermatitis assessed using SCORAD indices prespecified but incidence not reported |
| Other bias | Unclear risk | Some baseline differences |
Kitz 2006.
| Methods | Multicentre, double‐blind RCT in Germany before 2006 | |
| Participants | Inclusion criteria: full term infants; at least 1 first‐degree relative with atopic disease Exclusion criteria: newborns unable to be fed orally; severe concurrent disease |
|
| Interventions | Infants randomised to γ‐LA supplement for first 5 months of life Stratification into 3 groups based on maternal decision whether to breastfeed within the first 2 days of life Exclusively breastfed infants (n = 58) Control 1 (n = 37): whey hydrolysate Intervention 1 (n = 21): whey hydrolysate + γ‐LA 0.1 g (n‐3:n‐6 ratio: n‐6 only) (γ‐LA supplement) Both groups intermediate PUFA intake Breast and formula fed infants (n = 53) Control 2 (n = 31): maternal whey or whey formula (γ‐LA <0.1 g) Intervention 2 (n = 22): maternal whey + γ‐LA 0.1 g or whey formula + γ‐LA 0.2 g (n‐3:n‐6 ratio: n‐6 only) (γ‐LA supplement) Both groups intermediate‐high PUFA intake Exclusively formula fed infants (n = 20) Control 3 intervention (n = 8): whey formula (γ‐LA < 0.1 g) Intervention 3 (n = 12): whey formula + γ‐LA 0.2 g (n‐3:n‐6 ratio: n‐6 only) (γ‐LA supplement) Both groups high PUFA intake Co‐interventions: none reported |
|
| Outcomes | Primary outcome: atopic dermatitis in first 12 months of life Secondary outcome: serum IgE level at 12 months Study participants seen at 1 week, 4 and 12 months. Skin atopy score of atopic dermatitis (SCORAD) used. Diagnosis of atopic eczema was made by the criteria of Hanifin (Hanifin 1980) Total serum IgE determined at birth, age of 4 and 12 months |
|
| Notes | No conflict of interest declared | |
| Risk of bias | ||
| Bias | Authors' judgement | Support for judgement |
| Random sequence generation (selection bias) | Unclear risk | Method not reported |
| Allocation concealment (selection bias) | Unclear risk | Method not reported |
| Blinding of participants and personnel (performance bias) All outcomes | Unclear risk | Reported to be "double‐blind" but details not reported |
| Blinding of outcome assessment (detection bias) All outcomes | Unclear risk | Reported to be "double‐blind" but details not reported |
| Incomplete outcome data (attrition bias) All outcomes | Low risk | 6/137 (4%) not followed due to non‐compliance |
| Selective reporting (reporting bias) | Unclear risk | No primary outcome stated. Eczema reported at 3 time points |
| Other bias | Unclear risk | Baseline characteristics not reported |
Lauritzen 2004.
| Methods | Multicentre, double‐blind RCT with parallel reference group in Denmark December 1998 to November 1999 | |
| Participants | Maternal inclusion criteria: pregnant women; fish intake below population median (n‐3 LCPUFA < 0.4 g/day); uncomplicated pregnancy; pre‐pregnancy BMI < 30 kg/m2; no metabolic disorders; intention to breastfeed for at least 4 months of age Infant inclusion criteria: healthy; term; singleton; birth weight appropriate for gestational age; Apgar score > 7; able to start supplements within 2 weeks of birth (not selected for risk of allergy) |
|
| Interventions | Breastfeeding mothers randomised to supplement for the first 4 months of life Control (n = 60): olive oil (predominantly n‐9) (intermediate PUFA intake) Intervention (n = 62): supplemented with fish oil 4 g/day (n‐3 LCPUFA 1.5 g; n‐3:n‐6 ratio = n‐3 only) (high PUFA intake) Co‐interventions: none reported |
|
| Outcomes | Primary outcomes: breast milk FA composition; n‐3 PUFA levels in infant erythrocytes; infant development during the first year of life Secondary outcomes: immune function as assessed by cytokine responses Allergy: parent interviews about allergy diagnoses in the child, signs of allergic tendencies, and family history of allergy using validated questionnaire for atopic dermatitis at 2.5 years. Allergic tendencies (itchy rash, wheezing or food allergy) verified by a doctor |
|
| Notes | No conflict of interest declared Allergic tendencies verified by doctor used for review |
|
| Risk of bias | ||
| Bias | Authors' judgement | Support for judgement |
| Random sequence generation (selection bias) | Low risk | Random block‐wise allocation to the supplement groups was applied in blocks of 2 in 5 strata according to mean parental education |
| Allocation concealment (selection bias) | Low risk | |
| Blinding of participants and personnel (performance bias) All outcomes | Low risk | Investigators and families blinded to randomisation throughout the first year of life |
| Blinding of outcome assessment (detection bias) All outcomes | Low risk | |
| Incomplete outcome data (attrition bias) All outcomes | High risk | 68/122 (56%) no follow‐up data |
| Selective reporting (reporting bias) | High risk | Allergy not prespecified. Time point for assessment not prespecified |
| Other bias | Low risk | Groups well balanced after allocation |
Linnamaa 2010.
| Methods | Multicentre, double‐blind RCT in Finland 2004 to 2008 | |
| Participants | Inclusion criteria: pregnant women (not selected for risk of allergy); <16 weeks' gestation; preterm and sick infants excluded after randomisation | |
| Interventions | Mothers randomised to blackcurrant seed oil supplement from 8 to 16 weeks' gestation through exclusive breastfeeding period. Infants supplemented with same oil 1 mL/day after exclusive breastfeeding period until 2 years Control (n = 162): supplemented with placebo = olive oil 3 g/day (LA 9%; no γ‐LA or α‐LA or stearidonic acid; predominantly oleic acid 73%: n‐9). Infants 1 mL/day to 2 years (intermediate PUFA intake) Intervention (n = 151): supplemented with blackcurrant seed oil 3 g/day (LA 48%, γ‐LA 13%, α‐LA 14%, stearidonic acid 3%; oleic acid 14%) (n‐3:n‐6 ratio 1:4). Infants 1 mL/day to 2 years (high PUFA intake) Co‐interventions: none reported |
|
| Outcomes | Primary outcome: atopic dermatitis in first 12 months Secondary outcomes: atopic dermatitis in first 2 years; serum IgE level and SPT during first 2 years; FA analysis A specialist in dermatology evaluated the skin of each child at each visit. Atopic dermatitis was defined as a chronic or relapsing itchy dermatitis with a characteristic morphology and distribution. The SCORAD index used to assess dermatitis severity Skin tests were carried out at 3‐, 12‐ and 24‐month visits |
|
| Notes | No conflict of interest declared Note: data for eczema calculated from percentages in paper |
|
| Risk of bias | ||
| Bias | Authors' judgement | Support for judgement |
| Random sequence generation (selection bias) | Low risk | Assigned by a random number list .... immediately after the mother was enrolled |
| Allocation concealment (selection bias) | Low risk | Randomisation performed by personnel not involved in recruitment or subsequent assessment |
| Blinding of participants and personnel (performance bias) All outcomes | Low risk | Oils could not be distinguished from each other |
| Blinding of outcome assessment (detection bias) All outcomes | Low risk | Randomisation performed by personnel not involved in recruitment or subsequent assessment |
| Incomplete outcome data (attrition bias) All outcomes | High risk | 145/322 (45%) lost to follow‐up |
| Selective reporting (reporting bias) | Low risk | Prespecified atopic dermatitis by the age of 12 months as primary outcome |
| Other bias | Low risk | Groups similar at baseline |
Lucas 1999.
| Methods | Multicentre RCT in UK 1993 to 1995 | |
| Participants | Women giving birth to healthy singletons of appropriate size for gestational age and > 37 weeks' gestation supplemented until 6 months of age (formula fed) | |
| Interventions | Intervention (n = 154): LCPUFA supplemented formula (AA 0.30% and DHA 0.32% obtained from purified egg phospholipid and triglyceride fractions) (intermediate PUFA intake) Control (n = 155): unsupplemented formula (intermediate PUFA intake) |
|
| Outcomes | Primary outcome: 'explore efficacy and safety outcomes' Other outcomes: development, growth, safety data until 18 months. History of eczema (coded as none, possibly some, small patches, small areas requiring regular use of steroid cream or widespread eczema with itching and scratching; the latter 3 categories were considered as eczema), wheeze, and asthma recorded. Summary of reports of infection and atopy compared at 9 months |
|
| Notes | Nestec Ltd (Switzerland) for collaboration, funding and supply of trial diets Allergy outcomes reported as odds ratios (95% CI) |
|
| Risk of bias | ||
| Bias | Authors' judgement | Support for judgement |
| Random sequence generation (selection bias) | Low risk | Random permuted block design stratified by centre and gender concealed by sealed opaque envelopes |
| Allocation concealment (selection bias) | Low risk | |
| Blinding of participants and personnel (performance bias) All outcomes | Low risk | Mothers and study personnel were unaware of the dietary allocations ‐ differences between the coded formulas were not evident by observation |
| Blinding of outcome assessment (detection bias) All outcomes | Low risk | |
| Incomplete outcome data (attrition bias) All outcomes | High risk | 69/309 (22%) lost or excluded at 9 months |
| Selective reporting (reporting bias) | High risk | Multiple allergy endpoints measured |
| Other bias | Unclear risk | Similar at baseline. Substantial withdrawals with differences between groups in numbers lost at 9 months |
Makrides 2002.
| Methods | Single centre RCT in Australia before 2001 | |
| Participants | Healthy 6‐month‐old infants born at term (> 37 weeks' gestation) with birth weights > 2500 g. Supplemented diet of weaning infants between 6 and 12 months of age with 4 eggs per week | |
| Interventions | Breastfed infants Intervention (n = 27): n‐3 eggs x 4 per week (intermediate‐high PUFA intake) Control 1 (n = 27): regular eggs x 4 per week (intermediate PUFA intake) Control 2 (n = 28): no egg supplement (intermediate PUFA intake) Formula fed infants Intervention (n = 26): n‐3 eggs x 4 per week (intermediate‐high PUFA intake) Control 1 (n = 26): regular eggs x 4 per week (intermediate PUFA intake) Control 2 (n = 27): no egg supplement (intermediate PUFA intake) |
|
| Outcomes | Primary outcome measures included erythrocyte DHA concentrations, infant iron status and plasma cholesterol concentrations. Secondary outcomes included growth and plasma indexes of atopy (egg yolk and egg white RAST) | |
| Notes | Did not report clinical allergy | |
| Risk of bias | ||
| Bias | Authors' judgement | Support for judgement |
| Random sequence generation (selection bias) | Low risk | Computer generated randomisation schedule. Breastfed and formula fed infants were allocated by using separate schedules |
| Allocation concealment (selection bias) | Low risk | |
| Blinding of participants and personnel (performance bias) All outcomes | Low risk | Eggs were supplied in plain cartons coded A or B. Note second control group received no eggs |
| Blinding of outcome assessment (detection bias) All outcomes | Low risk | |
| Incomplete outcome data (attrition bias) All outcomes | High risk | 23/161 (14%) lost |
| Selective reporting (reporting bias) | Low risk | Allergy not prespecified or reported |
| Other bias | Unclear risk | Some baseline differences |
Meldrum 2011.
| Methods | Single centre, double‐blind RCT in Australia June 2005 and October 2008 | |
| Participants | Inclusion criteria: infants; maternal history of doctor diagnosed asthma or allergic rhinitis; maternal SPT positive to at least 1 allergen Exclusion criteria: maternal smoking; autoimmune disease; pre‐existing medical conditions other than asthma; high‐risk pregnancy; seafood allergy; fish eaten > 3 times per week; fish oil supplementation already taken (in excess of 1000 mg/day); pre‐term delivery < 36 week; infant with congenital abnormalities or significant disease not related to intervention |
|
| Interventions | Infants (mixed feeding, mostly breastfed) randomised to fish oil supplement for first 6 months of life Control (n = 202): supplemented with olive oil 650 mg (66.6% n‐9 oleic acid) Intervention (n = 218): supplemented with fish oil 650 mg (DHA 0.28 g, EPA 0.11 g) (n‐3:n‐6 ratio n‐3 only) Control group intermediate PUFA intake, intervention group high PUFA intake Co‐interventions: none reported |
|
| Outcomes | Primary outcomes: 1. Infant FA status 2. Immune development as determined by adaptive (T cell) and innate in vitro immune responses using samples collected at 6 months and at 1 year of age 3. Allergic outcomes (food allergy, eczema, asthma, wheezing and allergen sensitisation) at 12, 30 and 60 months of age determined through clinical history, allergen SPT and clinical examination 4. Infant neurodevelopment and language as determined by the Bayley Scales of Infant Development III, the Achenbach Child Behaviour Checklist, and the Macarthur Communicative Development Inventory. Further assessments are proposed at 6 years of age |
|
| Notes | No conflict of interest declared. 12‐month assessments reported to date | |
| Risk of bias | ||
| Bias | Authors' judgement | Support for judgement |
| Random sequence generation (selection bias) | Low risk | Randomisation based on computer software (Excel) generation and stratified by block randomisation according to maternal allergy (asthma versus other allergy), parity (first child versus second or more child) and paternal allergy (allergic versus non‐allergic) |
| Allocation concealment (selection bias) | Low risk | |
| Blinding of participants and personnel (performance bias) All outcomes | Low risk | Placebo capsules used |
| Blinding of outcome assessment (detection bias) All outcomes | Low risk | Research scientists involved in the assessments will remain blind to the interventions for the duration of the study, until after the completion of the 6‐year clinical visits |
| Incomplete outcome data (attrition bias) All outcomes | High risk | 97/420 (23%) lost to follow‐up at 12 months |
| Selective reporting (reporting bias) | Low risk | Prespecified allergy outcomes |
| Other bias | Low risk | Groups similar at baseline |
Mihrshahi 2003.
| Methods | Multicentre, parallel‐group RCT in Australia with completion of recruitment January 2000 | |
| Participants | Inclusion criteria: ≥ 1 parent or sibling with symptoms of asthma as assessed by screening questionnaire; reasonable fluency in English; telephone at home; reside within 30 km from centre of recruitment; any method of feeding Exclusion criteria: pet cat at home; families on strict vegetarian diet; multiple births; babies born < 36 weeks' gestation Withdrawal criteria: birth weight < 2.5 kg; babies requiring surgery; babies requiring hospitalisation for > 1 week; babies with significant neonatal disease; babies with congenital malformations |
|
| Interventions | Pregnant women randomised at 36 weeks' gestation to dietary FA modification for mother and infant for at least 5 years Control (n = 304): supplemented with Sunola (sunflower) oil 500 mg (n‐3 PUFA < 0.1 g; n‐6 PUFA < 0.1 g) administered to infant when formula introduced, or at 6 months (n‐3:n‐6 ratio = 1:23); family provided with polyunsaturated oils for cooking (intermediate PUFA intake) Intervention (n = 312): supplemented with tuna fish oil 500 mg (n‐3 PUFA 0.2 g, n‐6 PUFA < 0.1 g) administered to infant when formula introduced or at 6 months (n‐3:n‐6 ratio = 6:1); families provided with canola‐based (high n‐3) oils for cooking (high PUFA intake). Co‐interventions: parallel (factorial) randomisation to active house dust mite avoidance |
|
| Outcomes | Primary outcomes: asthma symptoms at 18 months; wheeze frequency; physician diagnosed asthma at 18 months; asthma at 3 to 5 years Secondary outcomes: eczema using validated questionnaire; nocturnal cough; allergic symptoms SPT at 18 months |
|
| Notes | Contributions of goods and services Allergopharma Joachim Ganzer KG Germany, John Sands Australia, Nu‐Mega Ingredients Pty Ltd. Co‐author consultant arrangements with Merck Sharp & Dohme, Altana Pharma Note: groups with house dust mite avoidance measures were included in the review |
|
| Risk of bias | ||
| Bias | Authors' judgement | Support for judgement |
| Random sequence generation (selection bias) | Low risk | Randomised in blocks of 4 sealed in sequentially numbered sealed envelopes |
| Allocation concealment (selection bias) | Low risk | Informed consent 34 to 37 weeks' gestation, randomisation at 36‐week home visit |
| Blinding of participants and personnel (performance bias) All outcomes | Unclear risk | Placebo supplemented although active supplements had a slight fishy smell |
| Blinding of outcome assessment (detection bias) All outcomes | Low risk | Research personnel undertaking outcome assessments blinded to group allocation of participants |
| Incomplete outcome data (attrition bias) All outcomes | High risk | 62/616 (10%) at 18 months; 90/616 (15%) at 3 years; 100/616 (16%) no 5‐year outcome data |
| Selective reporting (reporting bias) | Low risk | The primary aim in children at high risk of allergic disease was the incidence of allergy and asthma at age 5 years |
| Other bias | Low risk | Groups similar at baseline |
Morris 2000.
| Methods | Single centre RCT in UK before 2000 | |
| Participants | Term neonates supplemented until 12 weeks (formula fed). Participants (n = 140) (numbers per group not specified) | |
| Interventions | Intervention: LCPUFA supplemented formula (AA 0.4% + DHA 0.2%) (intermediate PUFA intake) Control: standard formula (no AA or DHA) (intermediate PUFA intake) |
|
| Outcomes | Growth up to 12 months | |
| Notes | Allergic symptoms measured but not reported | |
| Risk of bias | ||
| Bias | Authors' judgement | Support for judgement |
| Random sequence generation (selection bias) | Unclear risk | Following recruitment each participant was block randomised in a double‐blind fashion. Method not reported |
| Allocation concealment (selection bias) | Low risk | |
| Blinding of participants and personnel (performance bias) All outcomes | Low risk | Coded milk |
| Blinding of outcome assessment (detection bias) All outcomes | Low risk | |
| Incomplete outcome data (attrition bias) All outcomes | High risk | 31/140 (22%) withdrawn |
| Selective reporting (reporting bias) | High risk | Measured 'allergic symptoms' but did not report data |
| Other bias | High risk | Differences between groups at baseline |
O'Connor 2001.
| Methods | Multicentre RCT in USA October 1996 and January 1998 | |
| Participants | Preterm infants (< 33 weeks' gestation) with birth weight 750 g to 1805 g supplemented until 12 months' corrected age (formula fed) | |
| Interventions | Intervention 1 (n = 283): AA + DHA supplemented formula (fish/fungal oil) (in hospital formula: AA 0.43% + EPA 0.08% + DHA 0.27%; postdischarge preterm formula: AA 0.43% + no EPA + DHA 0.16%) (intermediate‐high PUFA intake) Intervention 2 (n = 283): AA + DHA supplemented formula (egg‐derived triglyceride/fish oil) (in hospital formula: AA 0.41% + no EPA + DHA 0.24%; postdischarge preterm formula: AA 0.41% + no EPA + DHA 0.15%) (intermediate‐high PUFA intake) Control (n = 144): standard formula (no AA or EPA or DHA) (intermediate PUFA intake) |
|
| Outcomes | Hospital morbidity, serious adverse events, FA profile, visual acuity, growth, development up to 12 months' corrected age | |
| Notes | Serious adverse events including asthma and wheezing measured but not reported separately | |
| Risk of bias | ||
| Bias | Authors' judgement | Support for judgement |
| Random sequence generation (selection bias) | Low risk | Centrally computer generated randomisation schedule was stratified for site, gender and birth weight stratum (750 to 1250 g and 1251 to 1800 g) using a random permuted blocks algorithm |
| Allocation concealment (selection bias) | Low risk | 'After informed written consent ... infants were randomized to 1 of 3 study formula groups' |
| Blinding of participants and personnel (performance bias) All outcomes | Unclear risk | Not reported |
| Blinding of outcome assessment (detection bias) All outcomes | Unclear risk | Not reported |
| Incomplete outcome data (attrition bias) All outcomes | High risk | 94/470 (20%) did not complete study |
| Selective reporting (reporting bias) | High risk | Serious adverse events including asthma and wheezing measured but not reported separately |
| Other bias | Low risk | Groups similar at baseline |
Smithers 2008.
| Methods | Multicentre, double‐blind RCT in Australia April 2001 and September 2003 | |
| Participants | Inclusion criteria: infants born before 33 weeks' gestation (not selected for risk of allergy); within 5 days of receiving any enteral feeds Exclusion criteria: major congenital or chromosomal abnormalities; multiple birth where not all live‐born infants were eligible; enrolled in other trials of FA supplementation; lactating mothers in whom tuna oil was contraindicated |
|
| Interventions | Randomised to intervention within 5 days of birth until infants reached their estimated due date Intervention: DHA‐rich tuna oil supplement (n = 322): mothers randomised to DHA‐rich tuna oil until expected date of delivery 3 g/day (DHA ˜ 1.3 g; n‐3:n‐6 ratio = n‐3 only). If supplementary formula was required, infants were given a high‐DHA preterm formula (DHA 1% + AA 0.6%) (high PUFA intake) Control (n = 335): maternal soy oil 3 g/day (LA ˜ 1.5 g, α‐LA ˜ 0.2 g) (n‐3:n‐6 ratio = 1:8). If supplementary formula was required, infants were given a standard preterm formula (DHA 0.35%, AA 0.6%) (intermediate PUFA intake) Co‐interventions: none reported |
|
| Outcomes | Primary outcomes: neurodevelopment at 18 months; intellectual ability at 7 years Secondary outcomes: growth; safety; cognitive function; educational progress; behaviour; quality of life; symptoms of asthma and allergy; anthropometrics; blood pressure Parental recall of subsequent hospitalisations and diagnoses were sought at the ages of term, 4, 12 and 18 months' corrected age Structured parental interviews at 12 and 18 months allowed parents to report medical attention for, or the treatment of, hay fever, eczema, asthma or food allergy |
|
| Notes | Co‐authors on scientific advisory boards for Nestle, Fonterra and Nutricia with associated honoraria | |
| Risk of bias | ||
| Bias | Authors' judgement | Support for judgement |
| Random sequence generation (selection bias) | Low risk | Mother‐infant pairs were randomly assigned a unique study number through a computer‐driven telephone randomisation service according to an independently generated randomisation schedule. Stratification was by centre, birth weight and infant sex |
| Allocation concealment (selection bias) | Low risk | |
| Blinding of participants and personnel (performance bias) All outcomes | Low risk | To facilitate blinding, each treatment group was separately colour‐coded into 2 groups. All capsules were similar in size, shape and colour. If formula was required in the pilot phase, 2 drops of oil from capsules in matching colour‐coded containers were added to each 90 mL jar of formula. For the remainder of the trial, ready‐to‐feed preterm formula to trial specifications and packaged the formula according to the colour codes were manufactured |
| Blinding of outcome assessment (detection bias) All outcomes | Low risk | Parents, clinicians and all research personnel blinded to participant study group |
| Incomplete outcome data (attrition bias) All outcomes | Low risk | 54/657 (8%) incomplete outcome data at 18 months |
| Selective reporting (reporting bias) | Low risk | Structured parental interviews at 12 and 18 months allowed parents to report medical attention for, or the treatment of, hay fever, eczema, asthma or food allergy |
| Other bias | Low risk | Groups well balanced after allocation |
van Gool 2003.
| Methods | Multicentre, double‐blind RCT in Netherlands October 1997 and April 2000 | |
| Participants | Formula fed infants (n = 121) with a maternal history of atopic disease: gestational age ≥ 38 weeks, birth weight > 2500 g, an uncomplicated perinatal period and exclusive formula‐feeding from 2 weeks age Maternal inclusion criteria: maternal history of allergic asthma or allergic rhinoconjunctivitis related to aeroallergen exposure or atopic dermatitis or a positive allergen test or improvement of asthma or rhinoconjunctivitis with the use of antihistamine or anti‐asthma drugs Maternal exclusion criteria: diabetes treated with medication or diet, or both; pre‐eclampsia; metabolic disease |
|
| Interventions | Infants randomised to supplement for first 6 months of life Control (n = 60): supplemented with sunflower oil 446 mg (LA 0.2 g; n‐3:n‐6 ratio = n‐6 only) Intervention (n = 61): supplemented with borage oil 446 mg (LA 0.2 g; γ‐LA 103 mg/day; n‐3:n‐6 ratio = n‐6 only) Both groups intermediate PUFA intake Co‐interventions: none reported |
|
| Outcomes | Primary outcome: atopic dermatitis at 12 months by dermatologist using the criteria of the UK Working Party Secondary outcome: total IgE and specific IgE for common aero‐ and food allergens at age 1 year (UniCAP) Severity of dermatitis scored by dermatologist using SCORAD |
|
| Notes | Supported by F Hoffmann‐La Roche (Basel, Switzerland), Friesland Coberco Dairy Foods (Leeuwarden, Netherlands) | |
| Risk of bias | ||
| Bias | Authors' judgement | Support for judgement |
| Random sequence generation (selection bias) | Unclear risk | Block randomisation in blocks of 4. Method not reported |
| Allocation concealment (selection bias) | Low risk | |
| Blinding of participants and personnel (performance bias) All outcomes | Low risk | Powders packaged in low‐oxygen sachets to blind the investigators and parents to possible differences in smell and appearance |
| Blinding of outcome assessment (detection bias) All outcomes | Low risk | |
| Incomplete outcome data (attrition bias) All outcomes | Low risk | 3/121 (2%) lost to follow‐up |
| Selective reporting (reporting bias) | Low risk | Primary outcome atopic dermatitis at 12 months |
| Other bias | Low risk | Groups similar at baseline |
AA: arachidonic acid; BMI: body mass index; CI: confidence interval; DHA: docosahexaenoic acid; EPA: eicosapentaenoic acid; FA: fatty acid; IgE: immunoglobulin E; LA: linoleic acid; LCPUFA: long chain polyunsaturated fatty acid; n: number of participants; PUFA: polyunsaturated fatty acid; RAST: radioallergosorbent test; RCT: randomised controlled trial; SCORAD: SCORing Atopic Dermatitis; SPT: skin prick test.
Characteristics of excluded studies [ordered by study ID]
| Study | Reason for exclusion |
|---|---|
| Agostoni 1994 | Excluded as allergy not prespecified or reported Multicentre (n = 6) randomised controlled trial in Italy and Ireland in 1992 Term neonates supplemented from birth until 4 months (formula fed) Intervention (n = 111): LCPUFA supplemented formula (LA 11.5% to 12.8% of fat; α‐LA 0.6% to 0.65%; AA 0.3% to 0.4%; DHA 0.15% to 0.25%) (intermediate PUFA intake) Control (n = 126): standard formula (LA 11.4% of fat; α‐LA 0.7%; AA < 0.1%; DHA 0%) (low PUFA intake) Outcome: neurodevelopment at 4 months; blood pressure in childhood; growth and developmental quotient at 4, 12, 18 and 24 months; 24 months Brunet‐Lézine's scale of development; at age 6 years intelligence quotient, attention control (Day‐Night Test), and speed of processing on the Matching Familiar Figures Test |
| Agostoni 2009 | Excluded as allergy not prespecified or reported Multicentre randomised controlled trial in Italy May 2005 and June 2005 Term neonates supplemented from hospital discharge until 12 months (mixed feeding, mostly breastfed) Intervention (n = 580): DHA 20 mg supplement (intermediate PUFA intake) + vitamin D3 400 IU Control (n = 580): placebo (intermediate PUFA intake) = vitamin D3 400 IU Outcome: achievement of gross motor milestones in first year of life |
| Alam 2010 | Excluded as allergy not prespecified or reported Multicentre cluster (16 villages) randomised controlled trial in Bangladesh November 1995 to October 1997 Pregnant women recruited at 5 to 7 months of gestation and treated until 6 months' postpartum (infants mostly breastfed) Intervention (n = 341): soybean oil 20 mL (high PUFA intake) Control (n = 335): no supplement (intermediate PUFA intake) Outcome: plasma vitamin A status at 6 months PUFA intake not reported |
| Amesz 2010 | Excluded as used co‐interventions that differed between treatment and control groups Single centre randomised controlled trial in Netherlands Participants: 102 preterm infants born at gestational age ≤ 32 weeks or birth weights ≤ 1500 g supplemented until 6 months' corrected age (formula fed) Intervention (n = 52): postdischarge formula with AA 0.5% to 0.6% + DHA 0.4% to 0.5% supplemented formula (intermediate‐high PUFA intake). The postdischarge formula provided the same quantity of energy but a higher level of protein and a lower level of carbohydrates, higher levels of some minerals, vitamins, and LCPUFA Control (n = 50): standard term formula (intermediate PUFA intake) Outcomes: fatty acid profile, growth up to 6 months' corrected age Did not report allergy |
| Andersen 2011 | Excluded as allergy not prespecified or reported Multicentre randomised controlled trial in Denmark January 2008 to March 2009 Infants supplemented from 9 to 18 months of age (mixed feeding) Intervention (n = 75): fish oil 5 mL daily (EPA + DHA 1.6 g/day) (high PUFA intake; high n‐3) Control (n = 79): sunflower oil 5 mL daily (LA 3.1 g/day) (intermediate‐high PUFA intake; high n‐6) Outcome: growth up to 18 months |
| Auestad 1997 | Excluded as allergy not prespecified or reported Multicentre randomised controlled trial in USA before 1997 Formula fed term neonates supplemented from before 9 days to until 12 months if formula fed Formula groups (oil blend consisted of high oleic safflower, coconut and soy oils) Intervention 1 (n = 59): AA 0.43% + DHA 0.12% supplemented formula (egg derived phospholipid) (intermediate PUFA intake) Intervention 2 (n = 61): DHA 0.23% supplemented formula (fish oil derived) (intermediate PUFA intake) Control (n = 63): standard formula (intermediate PUFA intake; no DHA or AA) Outcome: visual acuity at 12 months |
| Auestad 2001 | Excluded as allergy not prespecified or reported Multicentre randomised controlled trial in USA before 2001 Term neonates supplemented until 12 months (formula fed and breastfed groups) Formula fed infants Intervention 1 (n = 80): AA 0.45% + DHA 0.14% supplemented formulas (egg derived) (intermediate‐high PUFA intake) Intervention 2 (n = 82): AA 0.46% + DHA 0.13% supplemented formulas (fish/fungal derived) (intermediate‐high PUFA intake) Control 1 (n = 77): standard formula (intermediate‐high PUFA intake; no AA or DHA) Breastfed infants (supplemented after 3 months) Intervention (n = 83): AA + DHA supplemented formula (egg derived) (intermediate‐high PUFA intake) Control 2 (n = 82): standard formula (intermediate‐high PUFA intake) Outcome: multiple measures of infant development up to 14 months |
| Ben 2004 | Excluded as allergy not prespecified or reported Multicentre randomised controlled trial in China 2001 to 2002 Term neonates supplemented until 6 months of age (formula fed) Intervention (n = 69): AA + DHA supplemented formulas (intermediate PUFA intake) (LA 435 mg; α‐LA 62 mg; AA 6.9 mg; and DHA 6.9 mg per 100 mL) Control (n = 52): standard formula (intermediate PUFA intake) (LA 440 mg; α‐LA 44 mg; no AA or DHA per 100 mL) Outcome: growth, development and infections up to 6 months |
| Benito Fernandez 2002 | Excluded as allergy not prespecified or reported Single centre randomised controlled trial in Spain before June 2001 Term neonates (n = 37) supplemented until 2 months (formula fed) Intervention/control (numbers per group not specified): 1 of 4 formulas (standard (low‐intermediate), n‐3 supplemented (intermediate), n‐3 + n‐6 supplemented (intermediate), nucleotide supplemented (intermediate‐high)) Outcome: fatty acid profile, growth up to 2 months Written in Spanish; English abstract |
| Bergmann 2008 | Excluded as allergy not prespecified or reported Multicentre randomised controlled trial in Germany October 2000 to August 2002 Pregnant women supplemented from 21 to 37 weeks' gestation; and then from 2 weeks' to 3 months' postpartum Intervention (n = 48): maternal DHA 200 mg supplement (intermediate PUFA intake) (fish oil derived) Control (n = 48): no maternal DHA supplement (intermediate PUFA intake) Outcome: growth up to 21 months |
| Berseth 2014 | Excluded as used co‐interventions that differed between treatment and control groups Multicentre randomised controlled trial in USA Participants: 150 preterm infants born at gestational age ≤ 30 + 3/7 weeks or birth weights ≤ 1250 g supplemented for 28 days, until hospital discharge or discontinuation of breast milk (breast milk fed) Intervention (n = 75): concentrated human milk fortifier enriched with LCPUFA (intermediate‐high PUFA intake) Control (n = 75): standard milk fortifier (intermediate PUFA intake) Outcomes: fatty acid profile, growth, adverse events up to 28 days Did not report allergy |
| Billeaud 1996 | Excluded as allergy not prespecified or reported Multicentre randomised controlled trial in France before 1996 Preterm neonates < 34 weeks' gestation supplemented until 37 weeks' corrected gestation (formula fed) Intervention (n = 31): α‐LA 1.95% supplemented formula (intermediate PUFA intake) Control (n = 32): standard formula with α‐LA 0.55% (low‐intermediate PUFA intake) Outcome: fatty acid profile, growth up to 37 weeks' corrected gestation |
| Birch 1992 | Excluded as allergy not prespecified or reported Single centre randomised controlled trial in USA before 1992 73 healthy preterm infants born at 27 to 33 weeks' postconception Formula groups fed from 10 days postnatal to 57 weeks' postconception Control: corn oil that provided solely linoleic acid Intervention 1: soy oil that provided LA and α‐LA or Intervention 2: soy/marine oil that was similar to the soy oil formula but also provided DHA 0.46% Outcome: visual evoked potentials at 57 weeks |
| Birch 1998 | Excluded as allergy not prespecified or reported Multicentre randomised controlled trial in USA Term neonates supplemented until 17 weeks (formula fed) Intervention 1 (n = 27): AA 0.72% + DHA 0.36% supplemented formula (intermediate PUFA intake) Intervention 2 (n = 26): DHA 0.35% supplemented formula (intermediate PUFA intake) Control (n = 26): standard formula (intermediate PUFA intake; no AA or DHA) Outcome: fatty acid profile, visual acuity, growth up to 12 months |
| Birch 2002 | Excluded as allergy not prespecified or reported Multicentre randomised controlled trial in USA before 2001 Term neonates supplemented from 6 weeks to 12 months (formula fed) Intervention (n = 32): AA 0.72% + DHA 0.36% supplemented formula Control (n = 33): standard formula Outcome: visual acuity up to 12 months |
| Birch 2010 | Excluded as allergy not prespecified or reported Multicentre randomised controlled trial in USA before 1998 Participants: term neonates supplemented from birth to 12 months (formula fed) Intervention 1 (n = 84): DHA 0.32% + 0.64% AA (34 mg/100 kcal) formula Intervention 2 (n = 85): DHA 0.64% (34 mg/100 kcal) + AA 0.64% (34 mg/100 kcal) formula Intervention 3 (n = 88): DHA 0.96% (51 mg/100 kcal) + AA 0.64% (34 mg/100 kcal) formula Control (n = 86): standard formula with no DHA or AA Outcome: visual acuity up to 12 months |
| Boehm 1996 | Excluded as allergy not prespecified or reported Single centre randomised controlled trial in Germany before 1996 Very‐low‐birth‐weight infants appropriate for gestational age from 2nd week to discharge When breast milk was not available the infants were randomly assigned to be fed either: Control: standard preterm formula (n = 11), virtually LCPUFA free (LA 11.3%, α‐LA 0.56%) Intervention: LCPUFA supplemented formula (n = 12). (LA 12.75%, α‐LA 0.82%; DHA 0.15%; AA 0.25%) Changed to identical fatty acid term formulas at 34 to 36 weeks' postconceptual age Outcome: fatty acid composition of serum and red blood cell membrane phospholipids |
| Boehm 1997 | Excluded as intervention < 1 month Single centre randomised controlled trial in Germany Participants: 39 very‐low‐birth‐weight infants appropriate for gestational age over 10‐day feeding period Intervention: LCPUFA‐supplemented formula (n = 11) (DHA: 50.2 ± 4.2 mg/72 hours; AA: 30.2 ± 2.7 mg/72 hours) (intermediate‐high PUFA intake) Control: LCPUFA‐free formula (n = 11) (intermediate PUFA intake) Outcome: DHA and AA absorption Did not report allergy |
| Bondia‐Martinez 1998 | Excluded as allergy not prespecified or reported Single centre randomised controlled trial in Spain before 1998 Term neonates supplemented until 3 months (formula fed) Intervention (n = 18): AA 0.30% + DHA 0.15% supplemented formula (intermediate PUFA intake) Control (n = 15): standard formula (intermediate PUFA intake) Outcome: fatty acid profile at 3 months |
| Bougle 1999 | Excluded as allergy not prespecified or reported Single centre randomised controlled trial in France before 1999 Preterm neonates < 34 weeks' gestation supplemented for at least 30 days until 37 weeks' corrected gestation (formula fed) Intervention (n = 14): LCPUFA enriched formula (LA 17.7%, α‐LA 1.2%; DHA 0.6%; EPA 0.1%, AA 0.1%) (intermediate PUFA intake) Control (n = 11): standard formula with no LCPUFA (LA 14.1%, α‐LA 1.3%) (intermediate PUFA intake) Outcome: fatty acid profile, auditory and visual evoked potentials, nerve conduction velocity, growth up to 37 weeks' corrected gestation |
| Bouwstra 2003 | Excluded as allergy not prespecified or reported Multicentre randomised controlled trial in Netherlands February 1997 until October 1999 Term neonates supplemented until 2 months (formula fed) Intervention (n = 145): AA 0.45% + DHA 0.3% supplemented formula (intermediate PUFA intake) Control (n = 167): standard formula (intermediate PUFA intake) Outcome: general movements at 3 months |
| Carlson 1987 | Excluded as allergy not prespecified or reported Single centre randomised controlled trial in USA May 1985 and January 1986 Infants born at < 1500 g (range 600 g to 1440 g) Intervention (n = 30): preterm formula with the fish oil supplement (750 mg/kg/day). (Provided approximately 6 times as much DHA as would have been received by infants fed preterm human milk) Control (n = 31): preterm formula (no DHA) Outcome: red blood cell membrane docosahexaenoic acid |
| Carlson 1991a | Excluded as allergy not prespecified or reported Single centre randomised controlled trial in USA November 1987 and 1989 Preterm infants (600 to 1270 g birth weight) when tolerated preterm formulas at intakes > 462 to 504 kJ/kg/day for 5 to 7 days Randomised to receive 1 of 3 formulas for 4 weeks Intervention 1 (n = 8): preterm formula contained EPA 0.3% and DHA 0.2% from marine oil Intervention 2 (n = 7): preterm formula contained EPA 0.7% and DHA 0.4% from marine oil Control (n = 6): preterm formula did not contain marine oil and was free of EPA and DHA Outcome: fatty acid profiles up to 12 months' corrected age |
| Carlson 1991b | Excluded as allergy not prespecified or reported Single centre randomised controlled trial in USA November 1987 and 1989 Infants weighed 748 to 1398 g at birth and were eligible for the study when they were receiving > 462 kJ/kg/day of a preterm formula Randomised (n = 79; group numbers unclear) to receive 1 of 2 formulas to discharge and then term formula with or without marine oil postdischarge until 79 weeks' postconceptual age Control: preterm formula without marine oil during hospital stay; then term formula without marine oil post discharge to 79 weeks' postconceptual age Intervention 2: preterm formula contained EPA 0.3% and DHA 0.2% from marine oil during hospital stay; then term formula with marine oil post discharge to 79 weeks' postconceptual age Outcome: fatty acid profiles up to 12 months' corrected age. Visual acuity as measured by the Teller Acuity Card procedure |
| Carlson 1996a | Excluded as allergy not prespecified or reported Single centre randomised controlled trial in USA before 1996 Term neonates supplemented until 12 months (formula fed) Intervention (n = 28): AA 0.43% + DHA 0.1% supplemented formula (added egg phospholipid) (intermediate PUFA intake) Control (n = 31): standard formula (intermediate PUFA intake) (no DHA or AA) Outcome: fatty acid profile, visual acuity up to 12 months |
| Carlson 1996b | Excluded as allergy not prespecified or reported Single centre randomised controlled trial in USA before 1996 Participants (n = 94) (numbers per group not specified): preterm neonates supplemented until 2 months' corrected age (formula fed) Intervention: marine oil supplemented formula (high PUFA intake) Control: standard formula (high PUFA intake) Outcome: fatty acid profile, visual acuity, growth up to 12 months |
| Carlson 1998 | Excluded as allergy not prespecified or reported Single centre randomised controlled trial in USA September 1992 to March 1997 Participants (n = 120) (numbers per group not specified): preterm neonates supplemented until 4 months' corrected age (formula fed) Intervention: egg phospholipid supplemented formula AA 0.41%; DHA 0.13%; no γ‐LA (intermediate‐high PUFA intake; high n‐3; low n‐6) Control: standard formula (no AA or DHA; γ‐LA 2.24%) (intermediate PUFA intake; no n‐3; high n‐6) Outcome: hospital morbidity, fatty acid profile, growth up to 4 months |
| Carnielli 1998 | Excluded as allergy not prespecified or reported Single centre randomised controlled trial in Italy 1992 to 1995 Preterm infants fed exclusively with study formulas until ≥ 5 weeks old. Report control and treatment 2 groups continued on formulas until 7 months of age Control (n = 19): preterm formula without LCPUFAs added. (No AA or DHA; no n‐3 or n‐6) Intervention 1 (n = 19): preterm formulas supplemented with LCPUFAs derived from egg phospholipids. (AA 0.35%; DHA 0.24%; n‐3 0.55%; n‐3 0.45%) Intervention 2 (n = 19): preterm formula with LCPUFAs from triacylglycerols derived from unicellular organisms. (AA 0.84%; DHA 0.64%; n‐3 0.97%; n‐3 0.64%) Outcome: dietary intakes, fecal excretion and intestinal absorption of LCPUFAs. Fatty acid profile up to 7 months |
| Clandinin 1992 | Excluded as allergy not prespecified or reported Single centre randomised controlled trial in Canada before April 1990 Preterm neonates supplemented from first week of life for four weeks (formula fed) Intervention (n = 12): preterm formula with LCPUFA supplementation (intermediate‐high PUFA intake) Control (n = 10): standard preterm formula (intermediate PUFA intake) Outcome: fatty acid profile after 4 weeks |
| Clandinin 1997 | Excluded as allergy not prespecified or reported Single centre controlled trial in USA before April 1997 Stable preterm infants appropriate weight for gestational age (n = 72) 4 formulas contain the same nutrient composition but provided increasing levels of AA (0%, 0.32%, 0.49% and 1.1%) and DHA (0%, 0.24%, 0.35% and 0.75%) for 6 weeks Outcome: erythrocyte membrane phospholipid content and lipoprotein content up to 6 weeks |
| Clandinin 2005 | Excluded as allergy not prespecified or reported Multicentre randomised controlled trial in Canada Preterm neonates gestational age was ≤ 35 weeks' postmenstrual age and they had received < 10 total days of enteral feedings of > 30 mL/kg/day Preterm neonates supplemented until 6 months (formula fed) Intervention 1 (n = 112): AA + DHA supplemented formulas (intermediate PUFA intake) (DHA 17 mg/100 kcal from algal oil and AA 34 mg/100 kcal from fungal oil; DHA 0.3% and AA 0.6%) Intervention 2 (n = 130): AA + DHA supplemented formulas (high PUFA intake) (DHA 17 mg/100 kcal from tuna fish oil and AA 34 mg/100 kcal from fungal oil; DHA 0.3% and AA 0.6%) Control (n = 119): standard formula (intermediate PUFA intake) Outcome: growth, development up to 18 months |
| Clark 1992 | Excluded as allergy not prespecified or reported Single centre randomised controlled trial in Australia before 1992 Healthy term infants whose mothers had decided not to breastfeed were enrolled in the study at birth Infants were randomly allocated to 1 of 3 formulas for a total of 10 weeks Intervention 1 (n = 10): formula with a high ratio of LA to α‐LA 19:1 (LA 14%; α‐LA 0.7%) Intervention 2 (n = 11): formula contained LA:α‐LA ratio 4:1 reduced by increasing α‐LA (LA 13%; α‐LA 3.3%) or Intervention 2 (n = 8): formula contained LA:α‐LA ratio 3:1 reduced by decreasing LA (LA 3.5%; α‐LA 1.1%). Outcome: incorporation of n‐3 and n‐6 C20 and C22 fatty acids into erythrocyte membranes |
| Decsi 1995 | Excluded as allergy not prespecified or reported Single centre randomised controlled trial in Hungary before 1995 Healthy, full‐term, appropriate‐for‐gestational age infants fed formula were enrolled at 5 days of age supplemented until 4 months (formula fed) Intervention (n = 12): LCPUFA 1.1% supplemented formula (intermediate PUFA intake) (AA 0.5%; α‐LA 0.2%; EPA 0.03%; DHA 0.3%) Control (n = 10): standard formula with low LCPUFA intake 0.1% (no AA or α‐LA or EPA or DHA) Outcome: fatty acid profile up to 4 months |
| Decsi 1997 | Excluded as allergy not prespecified or reported Single centre randomised controlled trial in Hungary prior to March 1996 Full term infants whose parents decided not to breastfeed, formula fed for 1 month Randomly assigned to: Control (n = 10): conventional cow's milk protein formula based on and vegetable fat (No AA; α‐LA 1.0; No DHA; LCPUFA 0.1%) Intervention (n = 12): same formula supplemented with egg lipids and evening primrose oil (AA 0.4%; α‐LA 0.6; DHA 0.2%; LCPUFA 0.9%) Outcome: lipid profiles to 30 days |
| Demmelmair 2001 | Excluded as allergy not prespecified or reported Single centre randomised controlled trial in Hungary December 1994 to May 1997 Preterm neonates supplemented for 28 days (formula fed) Intervention 1 (n = 13): borage oil supplemented formula (intermediate PUFA intake) (0.6% γ‐LA) Intervention 2 (n = 13): borage oil + low fish oil supplemented formula (intermediate PUFA intake) (γ‐LA 0.6%; DHA 0.3%; EPA 0.06%) Intervention 3 (n = 14): borage oil + high fish oil supplemented formula (intermediate‐high PUFA intake) (γ‐LA 0.6%; DHA 0.3%; EPA 0.2%) Control (n = 13): standard formula (intermediate PUFA intake) Outcome: fatty acid profile up to 4 months |
| Dotterud 2013 | Excluded as non‐randomised and used co‐interventions that differed between treatment and control groups Multicentre non‐randomised controlled clinical trial in Norway A multiple life‐style intervention programme was introduced as a primary healthcare intervention involving increased maternal and infant dietary n‐3 PUFA intake, reduced tobacco smoke exposure and reduced indoor dampness in homes. Pregnant women and children up to 2 years of age were recruited to participate in a before‐and‐after study Intervention (n = 2860): increased n‐3 PUFA intake as part of intervention programme (unknown PUFA intake) Control (n = 4780): recruited before initiation of intervention programme (unknown PUFA intake) Outcome: prevalence of parentally reported allergy related diseases at 2 years of age |
| Faldella 1996 | Excluded as allergy not prespecified or reported Single centre randomised controlled trial in Italy before 1996 Preterm neonates < 33 weeks of gestational age, appropriate weight and with no malformation supplemented until 12 weeks' corrected age (formula fed) Intervention (n = 23): LCPUFA supplemented formula (AA 0.01%; DHA 0.3%; n‐6 4.3%) (intermediate PUFA intake) Control (n = 26): standard formula (no AA or DHA) (low‐intermediate PUFA intake) Outcome: visual evoked potentials, growth up to 12 weeks' corrected age |
| Fang 2005 | Excluded as allergy not prespecified or reported Single centre randomised controlled trial in Taiwan before 2005 Preterm neonates 30 to 37 weeks' gestation, > 2000 g, over 32 weeks and on full feeds supplemented for 6 months (formula fed) Intervention (n = 16): AA + DHA supplemented formula (unclear PUFA intake) Control (n = 11): standard formula (unclear PUFA intake) Outcome: visual acuity, growth, development up to 12 months |
| Fewtrell 2002 | Excluded as allergy not prespecified or reported Multicentre randomised controlled trial in UK before 2002 Preterm neonates < 1750 g supplemented until hospital discharge (formula fed minimum 3 weeks) Intervention (n = 95): LCPUFA supplemented formula (EPA 0.04%; AA 0.31%; DHA 0.17%; cholesterol 7.73%) (intermediate PUFA intake) Control (n = 100): standard formula (no EPA or AA or DHA or cholesterol) (low PUFA intake) Outcome: hospital morbidity, growth, development up to 18 months |
| Fidler 2000 | Excluded as intervention < 1 month Single centre randomised controlled trial in Germany Participants: healthy breastfeeding women with healthy single, full‐term newborns. The infants were exclusively breastfed during the duration of the study. At 4 weeks' postpartum, mothers were randomly assigned to receive 2 DHA capsules per day for 14 days Intervention: DHA capsule twice daily (intermediate‐high PUFA intake) Control: placebo oil (intermediate PUFA intake) Outcome: effect on human milk fatty acid composition Did not report allergy |
| Field 2000 | Excluded as allergy not prespecified or reported Single centre randomised controlled trial in Canada before 2000 Stable preterm infants gestational age 27 and 36 weeks appropriate for gestational age and receive 100% of requirements enterally by day 14 Groups received formula from before day 8 to day 42 of postnatal life Control (n = 12): standard preterm formula (no AA or DHA) Intervention (n = 15): same formula supplemented with AA 0.49% and DHA 0.35% Outcome: immune cell types and the antigenic maturity of T cells |
| Field 2008 | Excluded as allergy not prespecified or reported Single centre randomised controlled trial in Canada before 2007 Mothers who had chosen to switch from breastfeeding to formula before 14 days age Randomised to feeding from 14 days to 16 weeks age Control (n = 14): standard term infant formula Intervention (n = 16): same formula supplemented with AA 0.34% and DHA 0.2% Outcome: immune cell phenotypes and the ability of peripheral blood cells to proliferate and produce cytokines in vitro |
| Fleddermann 2014 | Excluded as used co‐interventions that differed between treatment and control groups Single centre randomised controlled trial in Serbia Participants: 213 term infants born at 37 to 41 weeks' gestation, appropriate for gestational age given modified infant formula for 4 months (formula fed) Intervention (n = 107): reduced protein formula enriched with α‐lactalbumin and LCPUFA (intermediate‐high PUFA intake) Control (n = 106): standard term formula (intermediate PUFA intake) Outcomes: fatty acid profile, growth, tolerance up to 4 months Did not report allergy |
| Foreman‐van Drongelen 1995 | Excluded as allergy not prespecified or reported Multicentre randomised controlled trial in Netherlands before 1994 Preterm neonates < 37 weeks' gestation appropriate for gestational age supplemented until 3 months' corrected age (formula fed) Randomised to formula (preterm to 2000 g then term formula) Intervention (n = 15): dihomo‐γ‐linolenic acid 0.06% + AA 0.61% + DHA 0.30% supplemented formulas (intermediate PUFA intake) Control (n = 16): standard formula (intermediate PUFA intake) (no dihomo‐γ‐linolenic acid or AA or DHA) Outcome: fatty acid profile at 3 months' corrected age |
| Ghebremeskel 1995 | Excluded as allergy not prespecified or reported Single centre randomised controlled trial in UK before 1994 Preterm neonates supplemented until term corrected age (formula fed). Participants (n = 63): numbers per group not specified; includes breast milk fed controls Intervention: AA 0.12% + DHA 0.51% supplemented formula (intermediate PUFA intake) Control: standard formula AA 0.04% + No DHA (low PUFA intake) Outcome: fatty acid profile at term corrected age |
| Gibson 1997 | Excluded as used co‐interventions that differed between treatment and control groups Single centre randomised controlled trial in Australia Participants: mothers of term infants (> 37 weeks' gestation) who intended to breastfeed for at least 12 weeks Mothers were randomised to receive 1 of 5 doses (0.2, 0.4, 0.9 or 1.3 g DHA/day) of a DHA‐rich algal oil between day 5 and week 12 postpartum. The oil contained 43% DHA, 1% n‐6 PUFA, 38% saturates and 18% monounsaturates Intervention 1 (n = 10): DHA 0.35% of fatty acids in breast milk Intervention 2 (n = 12): DHA 0.46% Intervention 3 (n = 10): DHA 0.86% Intervention 4 (n = 8): DHA 1.13% Control (n = 12): no DHA supplement (DHA 0.21%: intermediate PUFA intake) Outcomes: fatty acid profile, visual evoked potentials, growth, development up to 2 years. Adverse events were assessed at each visit by a nurse Did not report allergy |
| Gibson 2009 | Excluded as used co‐interventions that differed between treatment and control groups Single centre randomised controlled trial in Australia Participants: 142 term infants > 36 weeks, < 11 days old assigned to 1 of 2 formulas for 4 months (formula fed) Intervention (n = 72): formula with LCPUFA and probiotics supplements (intermediate PUFA intake) Control (n = 70): standard term formula (intermediate PUFA intake) Outcomes: fatty acid profile, growth, tolerance, adverse events up to 4 months Did not report allergy |
| Granot 2011 | Excluded as allergy not prespecified or reported Single centre randomised controlled trial in Israel before 2011 60 pregnant women aged 20 to 35 years in their 3rd pregnancy supplemented from 12 weeks' gestation until 4 months postpartum Intervention (n = 30): DHA 400 mg/day from 12 weeks' gestation until 4 months' postpartum (high PUFA intake) Control (n = 30): no DHA supplement (intermediate PUFA intake) Outcome: infant immune cell profile at 4 months |
| Groh‐Wargo 2005 | Excluded as allergy not prespecified or reported Single centre randomised controlled trial in USA September 1997 and September 1998 Preterm neonates with birth weight 750 to 1800 g and gestational age < 33 weeks supplemented until 12 months (formula fed) Intervention 1 (n = 20): DHA 0.26% + AA 0.42% from fish/fungal oil supplemented formula to 40 weeks' corrected age; and DHA 0.26% + AA 0.42% from 40 weeks' corrected age Intervention 2 (n = 18): DHA 0.26% + AA 0.42% from egg/fish oil supplemented formula; and DHA 0.26% + AA 0.42% from 40 weeks' corrected age Control (n = 22): standard formula Outcome: growth and body composition up to 12 months' corrected age Note: 20 of 60 infants also enrolled in O'Connor 2001 |
| Hauner 2012 | Excluded as allergy not prespecified or reported Single centre randomised controlled trial in Germany July 2006 and May 2009 Healthy pregnant women before the 15th week of gestation Women supplemented from 15th week of gestation to 4 months postpartum: Intervention (n = 104): LCPUFA supplement (high PUFA intake) (fish oil supplement as capsules containing n‐3 LCPUFAs 1200 mg (DHA 1020 mg and EPA 180 mg) and 9 mg vitamin E per day) Control (n = 104): no LCPUFA supplement (intermediate PUFA intake) Outcome: infant fat mass up to 12 months |
| Hawkes 2001 | Excluded as allergy not prespecified or reported Single centre randomised controlled trial in Australia before 2001 Healthy women aged ≥ 18 years who delivered full‐term singleton infants and intended to breastfeed for ≥ 12 weeks Randomly allocated from day 3 postpartum until the end of their 12th postpartum week Control (n = 40): 4 x 500 mg placebo oil capsules Intervention 1 (n = 40): DHA 300 mg/day and EPA 70 mg/day (2 x 500 mg tuna oil capsules + 2 x 500 mg placebo oil capsules) Intervention 2 (n = 40): DHA 600 mg/day and EPA 140 mg/day (4 x 500 mg tuna oil capsules) Outcome: maternal immune profile at 5 weeks |
| Helland 1998 | Excluded as supplementation period < 1 month Single centre randomised controlled trial in Norway Participants: 22 healthy, lactating women recruited at child healthcare centres 3 ± 8 weeks after they had given birth Supplementation period was 14 days, between 3 and 8 weeks' postpartum Intervention 1: cod liver oil 2.5 mL/day (intermediate‐high PUFA intake) Intervention 2: cod liver oil 5 mL/day (intermediate‐high PUFA intake) Intervention 3: cod liver oil 10 mL/day (intermediate‐high PUFA intake) Control: no supplementation (intermediate PUFA intake) Cod liver oil contained EPA 7.7 g, DHA 10.2 g and total n‐3 fatty acids 22.9 g per 100 mL Outcome: amount of essential fatty acids in mothers' breast milk Did not report allergy |
| Helland 2001 | Excluded as allergy not prespecified or reported Multicentre randomised controlled trial in Norway December 1994 and October 1996 Healthy women with single pregnancies aged 19 to 35 years, and nulli‐ or primipara and intending to breastfeed Supplemented from 17 to 19 weeks' gestation until 3 months' postpartum Intervention (n = 301): cod liver oil 10 mL/day (DHA 1183 mg/10 mL, EPA 803 mg/10 mL; n‐3 PUFAs 2494 mg/10 mL) (high PUFA intake) Control (n = 289): corn oil 10 mL/day (LA 4747 mg/10 mL and α‐LA 92 mg/10 mL) (intermediate PUFA intake) Outcome: growth and development up to 12 months |
| Henriksen 2008 | Excluded as allergy not prespecified or reported Multicentre randomised controlled trial in Norway December 2003 and November 2005 Very low birth weight neonates supplemented until discharge (breast milk fed) Intervention (n = 68): LA 18.8% + DHA 6.9% + AA 6.7% + α‐LA 2.3% supplemented feeds (high PUFA intake) Control (n = 73): unsupplemented feeds: LA 27.1% + α‐LA 3.4% + no DHA or AA (intermediate PUFA intake) Outcome: fatty acid profile, growth, development up to 18 months |
| Hoffman 2003 | Excluded as allergy not prespecified or reported Multicentre randomised controlled trial in USA before 2003 Infants supplemented from 4 to 6 months until 12 months of age (breastfed until enrolment) Intervention (n = 33): dihomo‐γ‐linolenic acid 0.05% + AA 0.72% + DHA 0.36% supplemented formula (intermediate‐high PUFA intake) Control (n = 35): standard formula (no dihomo‐γ‐linolenic acid or AA or DHA) (intermediate PUFA intake) Outcome: fatty acid profile, visual evoked potentials, growth up to 12 months |
| Hoffman 2004 | Excluded as allergy not prespecified or reported Multicentre randomised controlled trial in USA Infants supplemented from 6 to 12 months (breastfed until enrolment) Intervention (n = 28): egg yolk enriched baby foods with α‐LA 0.366% + AA 0.078% + DHA 0.115% (n‐6 1.18%; n‐3 0.51%; n‐6:n‐3 PUFA ratio 2.3) (intermediate PUFA intake) Control (n = 27): no supplement α‐LA 0.011% + AA 0.001% + no DHA (n‐6 0.12%; n‐3 0.01%; n‐6:n‐3 PUFA ratio 9.8) (intermediate PUFA intake) Outcome: fatty acid profile, visual evoked potentials, growth up to 12 months |
| Hoffman 2006 | Excluded as allergy not prespecified or reported Multicentre randomised controlled trial in USA before 2005 Term neonates 38 to 42 weeks' gestation with birth weight > 2500 g supplemented until 4 months of age (formula fed) Intervention (n = 39): high LCPUFA formula (LA 17.2% + α‐LA 1.65% + AA 0.64% + DHA 0.32%) (intermediate PUFA intake) Control (n = 27): low LCPUFA formula (LA 19.5% + α‐LA 2.1% + AA 0.4% + DHA 0.15%) (intermediate PUFA intake) Outcome: fatty acid profile, growth up to 4 months |
| Horby Jorgensen 1998 | Excluded as allergy not prespecified or reported Single centre randomised controlled trial in Denmark began in October 1993 Uncomplicated pregnancy, term delivery (gestational age 37 to 42 weeks), birth weight 2700 to 4500 g, Apgar > 7 after 5 minutes, and no neonatal diseases; supplemented until 4 months (formula fed). Participants: (n = 39) (numbers per group not specified) Intervention 1 (n = 14): LCPUFA supplemented formula (DHA 0.3% + EPA 0.4% in fish oil) (intermediate PUFA intake) Intervention 2 (n = 12): LCPUFA supplemented formula (DHA 0.3% + EPA 0.4% + γ‐LA 0.5% in borage oil) (intermediate PUFA intake) Control (n = 11): standard formula (no LCPUFA supplement) (intermediate PUFA intake) Outcome: fatty acid profile, visual evoked potentials, growth up to 4 months |
| Innis 1996 | Excluded as allergy not prespecified or reported Single centre randomised controlled trial in USA before 1996 Term gestation infants formula fed to 16 weeks of age 3 formulas contained soy and coconut oil and were relatively low in 18:1, but high in 18:2n‐6 and 18:3n‐3 (high 18:2n‐6 formulas) Intervention 1 (n = 16 + losses): high LA 34.2% + DHA 0% Intervention 2 (n = 18 + losses): high LA 32.2% + DHA 0.10% Intervention 3 (n = 17 + losses): high LA 31.9% + DHA 0.22% 3 formulas contained high‐oleic safflower, soy and coconut oil, and were high in 18:1 lower in 18:2n‐6 and 18:3n‐3 (low 18:2n‐6 formulas) Intervention 4 (n = 21 + losses): low LA 20.5% + DHA 0% Intervention 5 (n = 17 + losses): low LA 20.0% + DHA 0.11% Intervention 6 (n = 16 + losses): low LA 20.4% + DHA 0.24% Outcome: plasma and erythrocyte phospholipid fatty acids and growth |
| Innis 2002 | Excluded as allergy not prespecified or reported Multicentre randomised controlled trial in USA before 2002 Very low birth weight (846 to 1560 g) infants fed formula until discharge Intervention 1 (n = 66): DHA 0.34% supplemented formula (intermediate‐high PUFA intake) Intervention 2 (n = 66): AA 0.60% + DHA 0.33% supplemented formula (intermediate‐high PUFA intake) Control (n = 62): standard formula (intermediate‐high PUFA intake) Outcome: fatty acid profile, visual acuity, growth up to 4 months |
| Jensen 1996 | Excluded as allergy not prespecified or reported Multicentre randomised controlled trial in USA before 1996 Healthy term infants whose mothers had elected not to breastfeed supplemented until 4 months (formula fed) Intervention 1 (n = 20): α‐LA 3.24% supplemented formulas (intermediate to intermediate‐high PUFA intake) Intervention 2 (n = 20): α‐LA 1.7% supplemented formulas (intermediate to intermediate‐high PUFA intake) Intervention 3 (n = 20): α‐LA 0.95% supplemented formulas (intermediate to intermediate‐high PUFA intake) Control (n = 20): low α‐LA 0.4% formula (low‐intermediate PUFA intake) Outcome: fatty acid profile, visual evoked potentials, growth up to 4 months, neurodevelopment at 12 months |
| Jensen 2000 | Excluded as allergy not prespecified or reported Multicentre randomised controlled trial in USA before 2000 Breastfeeding mothers of term neonates supplemented from 2 to 8 weeks' postpartum Intervention 1 (n = 7): algae‐produced triacylglycerol with a high DHA content supplement (intermediate to intermediate‐high PUFA intake) Intervention 2 (n = 7): eggs 2/day with a high DHA content supplement (intermediate to intermediate‐high PUFA intake) Intervention 3 (n = 6): low‐EPA, high‐DHA fish oil supplement (intermediate to intermediate‐high PUFA intake) Control (n = 7): regular eggs 2/day with no DHA supplement (intermediate PUFA intake) Outcome: fatty acid profile at 8 weeks |
| Kaempf‐Rotzoll 2003 | Excluded as allergy not prespecified or reported Single centre randomised controlled trial in Germany before 2003 Preterm neonates 28 to 32 weeks' gestation supplemented from birth until 6 weeks (formula fed) Intervention (n = 9 + losses): LCPUFA‐enriched formula + vitamin E supplementation (LA 14.8%, AA 0.37%, α‐LA 0.9%, DHA 0.2%) (intermediate PUFA intake) Control (n = 11 + losses): standard formula + vitamin E supplementation (LA 15.5%, AA 0%, α‐LA 0.85%, DHA 0%) (intermediate PUFA intake) Outcome: fatty acid profile, growth and neurodevelopment to 24 months |
| Kohn 1994 | Excluded as allergy not prespecified or reported Single centre randomised controlled trial in Belgium before 1994 Healthy, term infants with gestational age of 38.5 to 41.5 weeks and a birth weight 2800 to 4000 g supplemented until 3 months (formula fed) Intervention: α‐LA 0.28% + AA 0.25% + DHA 0.18% supplemented formula (intermediate PUFA intake) Control: standard formula (no α‐LA + AA 0.02% + no DHA) (low‐intermediate PUFA intake) Outcome: fatty acid profile, growth up to 3 months |
| Koletzko 1989 | Excluded as supplementation period < 1 month Single centre randomised controlled trial in Germany Participants: premature infants with a birth weight of ≥ 1300 g. Infants fed from day 4 to 21 of life Intervention (n = 8): AA 0.2% and DHA 0.1% (intermediate PUFA intake) Control (n = 10): adapted formula (no AA or DHA) (low PUFA intake) Outcome: composition of plasma lipids Did not report allergy |
| Koletzko 1995 | Excluded as supplementation period < 1 month, allergy not prespecified or reported Single centre randomised controlled trial in Germany Participants: premature infants with a birth weight of ≥ 1300 g. Infants fed from day 4 to 21 of life Intervention (n = 9): α‐LA (n‐6: 0.2%; n‐3 0.8%) + EPA 0.03% + AA 0.5% + DHA 0.3% from egg and evening primrose oil (intermediate PUFA intake) Control (n = 10): adapted formula (AA 0.05%; α‐LA (n‐6: 0%; n‐3: 0.4%); no EPA or DHA) (low PUFA intake) Outcome: composition of plasma lipids Did not report allergy |
| Koletzko 2003 | Excluded as allergy not prespecified or reported Multicentre randomised controlled trial in Germany before 2003 Preterm neonates born < 1800 g supplemented for 4 weeks (formula fed) Intervention (n = 15): LCPUFA supplemented formula with LA 0.5% + α‐LA 0.8% + AA 0.4% + DHA 0.57% (intermediate PUFA intake) Control (n = 15): standard formula AA 0.04% + no DHA (intermediate PUFA intake) Outcome: fatty acid profile, growth up to 4 weeks |
| Lapillonne 2000a | Excluded as allergy not prespecified or reported Single centre randomised controlled trial in France before 2000 Term infants appropriate for gestational age and born with a birth weight > 280 g supplemented until 4 months (formula fed) Infants who had a history of maternal cocaine or alcohol abuse, or born to mothers with a history of diabetes, hyperlipidaemia, abnormal dietary patterns (strict vegetarian or vegan diets) were ineligible for participation Intervention (n = 12): LCPUFA supplemented formula (LA 17.62%, AA 0.03%, α‐LA 1.07%, DHA 0.31%, EPA 0.08%) (intermediate PUFA intake) Control (n = 12): standard formula (LA 17.35%, α‐LA 1.59%) (intermediate PUFA intake) Outcome: fatty acid profile, growth up to 4 months |
| Lapillonne 2000b | Excluded as allergy not prespecified or reported Single centre randomised controlled trial in France before 2000 Preterm infants appropriate for gestational age 700 to 1500 g supplemented until 4 months' corrected age (formula fed) Exclusion criteria included major neonatal morbidity; postnatal age > 21 days, requirement for supplemental oxygen or treatments (e.g. diuretics and corticosteroids) that could influence growth and development; failure to achieve full enteral feeding of 150 mL/kg/day by a postnatal age of 21 days; and maternal history of cocaine/alcohol abuse, diabetes, hyperlipidaemia or abnormal dietary patterns (strict vegetarian diets) Intervention (n = 11): LCPUFA supplemented formula (LA 17.78%, AA 0.02%, α‐LA 1.1%, DHA 0.37%, EPA 0.05%) (intermediate PUFA intake) Control (n = 12): standard formula (LA 17.95%, α‐LA 1.6%) (intermediate PUFA intake) Outcome: fatty acid profile, growth up to 6 months' corrected age |
| Leite 2013 | Excluded as supplementation period < 1 month and PUFA content comparable between treatment and control groups Single centre randomised controlled crossover trial in Brazil Participants: 33 term infants aged 84 to 156 ± 3 days fed 1 of 2 formulas with crossover after 14 days (formula fed) Intervention 1: standard term formula containing palm oils (intermediate PUFA intake) Intervention 2: standard term formula not containing palm oils (intermediate PUFA intake) Outcomes: metabolic parameters, growth, tolerance up to 36 days Did not report allergy |
| Liu 1987 | Excluded as supplementation period < 1 month, allergy not prespecified or reported Single centre randomised controlled trial in USA Participants: 17 Infants < 1500 g at birth (range 560 to 1440 g) randomly allocated to formulas for 2 weeks Intervention: similac Special Care with 100 or 250 μL MaxEPA (DHA 0.2% or 0.5%) per 4‐ounce bottle (intermediate PUFA intake) Control: similac Special Care with soybean oil 250 μL (no DHA) (low PUFA intake) Outcome: plasma phospholipid AA and DHA Did not report allergy |
| Llorente 2003 | Excluded as allergy not prespecified or reported Single centre randomised controlled trial in USA before 2003 Pregnant women who planned to breastfeed their infants exclusively for at least 4 months Breastfeeding women (n = 138) allocated within 1 week of delivery for 4 months Intervention (n = 51 reported): algae‐derived triglyceride capsule 200 mg DHA/day Control (n = 50 reported): placebo capsule Infant outcomes not reported |
| Lopez‐Alarcon 2006 | Excluded as supplementation period < 1 month, allergy not prespecified or reported Single centre randomised controlled trial in Mexico Participants: 27 preterm and term infants with sepsis after a surgical procedure given DHA or placebo for 2 weeks Intervention: DHA supplement 100 mg (intermediate PUFA intake) Control: olive oil 100 mg (intermediate PUFA intake) Outcomes: fatty acid profile, growth, illness severity after 2 weeks Did not report allergy |
| Lucia Bergmann 2007 | Excluded as allergy not prespecified or reported Multicentre randomised controlled trial in Germany October 2000 to August 2002 Pregnant women supplemented until 3 months' postpartum (n = 144) (numbers per group not specified) Exclusion criteria for prospective mothers were increased risk of premature delivery or multiple pregnancy, allergy to cow's milk protein, lactose intolerance, diabetes, smoking, consumption of alcohol (> 20 g/week), or participation in another study. Infants were excluded from the study if they were premature at birth (< 37 weeks’ gestation), had any major malformations or were hospitalised for more than 1 week Intervention: DHA supplement 200 mg/day + prebiotic (intermediate PUFA intake) Control: no DHA supplement (intermediate PUFA intake) (2 control groups, prebiotic in 1 group) Outcome: growth up to 21 months |
| Makrides 1995 | Excluded as allergy not prespecified or reported Single centre randomised controlled trial in Australia before 1995 Women giving birth to healthy infants of 37 to 42 weeks' gestation, supplemented until 30 weeks age (formula fed). Participants (n = 89) (numbers per group not specified, includes breast milk fed controls) Intervention: LCPUFA supplemented formula using fish and evening primrose oil (γ‐LA 0.27% + AA 0.01% + EPA 0.58% + DHA 0.36%) (intermediate‐high PUFA intake) Control: standard formula (γ‐LA 0.05% + no AA or EPA or DHA) (intermediate PUFA intake) Outcome: fatty acid profile, visual evoked potentials, growth up to 30 weeks |
| Makrides 1999 | Excluded as allergy not prespecified or reported Single centre randomised controlled trial in Australia December 1993 and November 1994 Healthy, white, term infants supplemented until 12 months (formula fed) Intervention 1 (n = 27): DHA 0.35% supplemented formula from tuna oil (intermediate PUFA intake) Intervention 2 (n = 28): AA 0.34% + DHA 0.34% supplemented formula from egg phospholipid (intermediate PUFA intake) Control (n = 28): standard formula (intermediate PUFA intake) Outcome: fatty acid profile, growth up to 2 years |
| Makrides 2000 | Excluded as allergy not prespecified or reported Single centre randomised controlled trial in Australia November 1994 and June 1995 Healthy, white, term infants supplemented from birth to 34 weeks (formula fed) Intervention: LA:α‐LA 16.6%:3.3% (5:1) (total n‐6 = 16.9%; total n‐3 = 3.3%) Control: LA:α‐LA of 16.9%:1.7% (10:1) (total n‐6 = 17.0%; total n‐3 = 1.7%) Outcome: fatty acid profiles, growth and visual evoked potential acuity |
| Martinez 2002 | Excluded as allergy not prespecified or reported Single centre randomised controlled trial in Brazil before 2002 Preterm very‐low‐birth‐weight infants on full enteral feeding for 2 days, gestational age 28 to 34 weeks; birth weight 900 to 1500 g supplemented for 30 days (formula fed) Intervention (n = 20): egg lipid extracts 0.9 g/100 kcal = 0.63% and evening primrose oil supplemented formula (α‐LA 0.2% + EPA 0.03% + AA 0.5% + DHA 0.3%; n‐3 0.8%) (intermediate PUFA intake) Control (n = 20): standard formula (AA 0.05%; no α‐LA or EPA or DHA; n‐3 = 0.4%) (intermediate PUFA intake) Outcome: fatty acid profile, growth at 30 days |
| Maurage 1998 | Excluded as allergy not prespecified or reported Single centre randomised controlled trial in France before 1998 Term neonates supplemented for 6 weeks (formula fed). Participants (n = 98) (numbers per group not specified, includes breast milk fed controls) Intervention 1 (high EPA): fish oil supplemented formulas (no AA; EPA 0.35% + DHA 0.45%) (intermediate PUFA intake) Intervention 2 (low EPA): fish oil supplemented formulas (no AA; EPA 0.10% + DHA 0.45%) (intermediate PUFA intake) Control: standard formula (no AA; EPA 0.10% + DHA 0.45%) (intermediate PUFA intake) Outcome: fatty acid profile at 6 weeks |
| Mize 1995 | Excluded as allergy not prespecified or reported Single centre randomised controlled trial in USA before 1995 Full term newborn infants appropriate for gestational age with gestational age 37 to 41 weeks supplemented until 12 months (formula fed) Intervention (n = 22): LCPUFA supplemented formula (PUFA 16.3%) (high PUFA intake) Control (n = 20): high monounsaturated fatty acid formula (PUFA 7.1%) (intermediate PUFA intake) Outcome: fatty acid profile, growth up to 12 months |
| Moltu 2013 | Excluded as used co‐interventions that differed between treatment and control groups, allergy not prespecified or reported Multicentre randomised controlled trial in Norway Participants: very‐low‐birth‐weight infants within 24 hours after birth Intervention group (n = 24): received significantly higher amounts of energy, protein, lipids, vitamin A, AA and DHA in parenteral and enteral nutrition (intermediate‐high PUFA intake) Control group (n = 26): lower amounts of energy, protein, lipids, vitamin A, AA and DHA in parenteral and enteral nutrition (intermediate PUFA intake) Outcomes: postnatal growth and clinical outcome during neonatal hospitalisation, urinary metabolite profiles Did not report allergy |
| Morgan 1998a | Excluded as supplementation period < 1 month, allergy not prespecified or reported Single centre randomised controlled trial in UK Participants: 20 preterm infants < 32 weeks, birth weight 1000 to 1500 g randomly allocated to formulas for 6 days (formula fed) Intervention (n = 10): preterm formula with LCPUFA supplement (intermediate‐high PUFA intake) Control (n = 10): preterm formula without LCPUFA supplement (intermediate PUFA intake) Outcome: fatty acid profile, fat excretion at 6 days Did not report allergy |
| Morgan 1998b | Excluded as supplementation period < 1 month, allergy not prespecified or reported Single centre randomised controlled trial in UK Participants: 20 term infants 37 to 42 weeks, birth weight 2500 to 4500 g randomly allocated to formulas for 6 days (formula fed) Intervention (n = 10): term formula with LCPUFA supplement (intermediate‐high PUFA intake) Control (n = 10): term formula without LCPUFA supplement (intermediate PUFA intake) Outcome: fatty acid profile, fat excretion at 6 days Did not report allergy |
| Moya 2001 | Excluded as supplementation period < 1 month, allergy not prespecified or reported Single centre randomised controlled trial in Spain Participants: 31 preterm infants (mean gestation 34 weeks) fed 1 of 3 formulas for 20 days Control (n = 9): preterm formula with no LCPUFA (intermediate PUFA intake) Intervention 2 + 3 (n = 21): preterm formula with LCPUFA (intermediate PUFA intake) Outcome: metabolic parameters, tolerance up to 20 days Did not report allergy |
| Ponder 1992 | Excluded as allergy not prespecified or reported Multicentre randomised controlled trial in USA before 1992 Full‐term 37 to 42 weeks' gestation with weight, length and head circumference 5th to 95th percentile supplemented until 8 weeks (formula fed) Intervention (n = 11: losses not reported): soy oil based formula (60% soy oil and 40% coconut oil: LA 34.2%; α‐LA 4.8%) (high PUFA intake) Control (n = 14: losses not reported): corn oil based formula (50% corn oil and 50% coconut oil: LA 31.4%; α‐LA 0.8%) (intermediate PUFA intake) Outcome: fatty acid profile, growth, development up to 8 weeks |
| Ramirez 2001 | Excluded as allergy not prespecified or reported Single centre randomised controlled trial in Brazil before 2001 Preterm neonates supplemented for 30 days (formula fed) Intervention (n = 17): LCPUFA supplemented formula (EA 0.18% + AA 0.34% + adrenic acid 0.16% + DHA 0.23%) (intermediate PUFA intake) Control (n = 17): standard formula (no EA or AA or Adrenic acid or DHA) (intermediate PUFA intake) Outcome: fatty acid profile, growth at 30 days. Tolerance recorded |
| Rodriguez 2003 | Excluded as supplementation period < 1 month Single centre randomised controlled trial in Hungary Participants: preterm infants (gestational age < 37 weeks), birth weight 1000 to 2000 g, weight appropriate for gestational age, exclusive formula feeding with a minimal daily ingestion of 100 mL/kg Randomised to formula for 7 days Intervention: 40% medium‐chain triglycerides (total n‐6 PUFA 11.98%; n‐3 PUFA 1.13%) (intermediate PUFA intake) Control: minimal medium chain fatty acids (total n‐6 PUFA 13.28%; n‐3 PUFA 1.03%) (intermediate PUFA intake) Outcome: fatty acid metabolism Did not report allergy |
| Ryan 1999 | Excluded as allergy not prespecified or reported 2 centre randomised controlled trial in USA May 1993 and September 1994 Healthy low‐birth‐weight infants 940 to 2250 g beginning at 7 to 10 days prior to hospital discharge to 59 weeks' postmenstrual age Intervention (n = 46): DHA 0.2% from fish oil (EPA 0.04% + AA 0.1% + DHA 0.2%) Control (n = 44): control formula (no EPA or AA or DHA) Outcome: growth and body composition to 59 weeks' postmenstrual age. Sudden infant death syndrome |
| Sauerwald 2012 | Excluded as allergy not prespecified or reported Multicentre randomised controlled trial in Germany before 2012 Preterm neonates birth weight 1000 to 2200 g exclusively (80% of total energy intake) fed formula or human milk supplemented for 28 days Intervention 1 (n = 13): DHA supplemented formula (DHA 0.33%) (intermediate to intermediate‐high PUFA intake; total PUFA = 18.42%; total n‐6 LC‐PUFA = 0.16%; total n‐3 LC‐PUFA = 0.41%). Intervention 2 (n = 15): DHA supplemented formula (DHA 0.52%) (intermediate to intermediate‐high PUFA intake; total PUFA = 19.01%; total n‐6 LC‐PUFA = 0.20%; total n‐3 LC‐PUFA = 0.65%). Control (n = 14): low DHA formula (DHA 0.04%) (intermediate PUFA intake; total PUFA = 18.21%; total n‐6 LC‐PUFA = 0.12%; total n‐3 LC‐PUFA = 0.05%) Outcome: fatty acid profile, growth up to 28 days |
| Schwartz 2009 | Excluded as allergy not prespecified or reported Multicentre randomised controlled trial in Germany September 2005 and July 2006 Healthy term newborn infants (gestational age > 37 weeks, birth weight > 2500 g); German speaking mother; intention to breastfeed Randomly allocated to complementary food (commercial vegetable‐potato‐meat meals in jars) from 4 to 6 months of age until 10 months Intervention (n = 66): rapeseed oil complementary feeds (LA 20%; α‐LA 9%; LA/α‐LA = 2.2) (intermediate PUFA intake) Control (n = 66): corn oil complementary feeds (LA 55%; α‐LA 1%; LA/α‐LA = 55) (intermediate PUFA intake) Outcome: fatty acid profile at 10 months |
| Siahanidou 2007 | Excluded as allergy not prespecified or reported Single centre randomised controlled trial in Greece before 2007 Preterm neonates (n = 140) gestational age ≥ 28 weeks, birth weight ≥ 1000 g, no family history of hyper‐ or hypolipidaemias, no congenital malformation and mothers who elected formula feeding supplemented for 1 month Intervention (n = 50 excluding losses): LCPUFA supplemented formula (AA 12.0 mg/100 mL and DHA 7.1 mg/100 mL) (unclear PUFA intake) Control (n = 54 excluding losses): unsupplemented formula (no AA or DHA) (unclear PUFA intake) Outcome: lipid peroxidation in serum after 1 month; adiponectin levels; visfatin levels; neonatal morbidity to discharge |
| Smit 2000a | Excluded as allergy not prespecified or reported Single centre randomised controlled trial in Pakistan before 2000 Malnourished infants (8 to 30 months) supplemented for 9 weeks (mixed feeding) Intervention (n = 10): fish oil supplement (AA 10 mg/day; EPA 190 mg/day; DHA 112 mg/day) (intermediate‐high PUFA intake) Control (n = 7): no fish oil supplement (low‐intermediate PUFA intake) Outcome: fatty acid profile, growth after 9 weeks |
| Smit 2000b | Excluded as supplementation period < 1 month, allergy not prespecified or reported Single centre randomised controlled trial in Netherlands Participants: 29 mothers who were breastfeeding 3 to 10 months supplemented for 7 days Intervention 1 (n = 10): AA oil 0.8 mL (intermediate PUFA intake) Intervention 2 (n = 9): AA oil 0.8 mL + DHA oil 1.7 mL (intermediate‐high PUFA intake) Control (n = 10): unsupplemented (intermediate PUFA intake) Outcome: breast milk fatty acid composition Did not report allergy |
| Socha 2002 | Excluded as infants with cholestasis, allergy not prespecified or reported Single centre randomised controlled trial in Poland Participants: infants with cholestasis (2 to 5 months) supplemented for 1 month (formula fed) Intervention (n = 11): LCPUFA supplemented formula (intermediate PUFA intake) Control (n = 12): standard formula (low‐intermediate PUFA intake) Outcome: fatty acid profile, growth after 1 month Did not report allergy |
| Stier 1997 | Excluded as supplementation period < 1 month, allergy not prespecified or reported Single centre randomised controlled trial in Germany Participants: 20 preterm infants < 32 weeks, birth weight < 2000 g randomly allocated to formulas for 3 weeks Intervention (n = 10): preterm formula with LCPUFA supplement (intermediate PUFA intake) Control (n = 10): preterm formula without LCPUFA supplement (intermediate PUFA intake) Outcome: urine prostanoids, growth up to 3 weeks Did not report allergy |
| Uauy 1990 | Excluded as allergy not prespecified or reported Single centre randomised controlled trial in USA before 1990 Preterm neonates birth weight 1000 to 1500 g; appropriate for gestational age, enteral feedings 70 to 120 kcal/kg and free of major neonatal morbidity by day 10. Supplemented until 36 weeks' corrected gestational age (formula fed) Control (n = 10): formula medium‐chain triglyceride/coconut/corn oil blend (predominant n‐6 PUFA: oleic acid 11.8%; LA 24.2%; α‐LA 0.5%; n‐6 > C18 none; n‐3 > C18 none) (low‐intermediate PUFA intake) Intervention 1 (n = 10): formula medium‐chain triglyceride/coconut/soy blend (high n‐3 PUFA: oleic acid 10.3%; LA 20.8%; α‐LA 2.7; n‐6 > C18 none; n‐3 > C18 none) (intermediate‐high PUFA intake) Intervention 2 (n = 12): formula medium‐chain triglyceride/ coconut/ soy/marine oil blend (high n‐3 PUFA: oleic acid 10.7%; LA 20.4%; α‐LA 1.4; n‐6 > C18 0.1%; n‐3 > C18 1.0%) (intermediate‐high PUFA intake) Outcome: fatty acid profile, visual evoked potentials, growth at 36 weeks' corrected gestational age. Growth, clinical tolerance, coagulation test results, changes in erythrocyte membrane fluidity and plasma concentrations of vitamins A and E from 30 to 57 weeks' postmenstrual age |
| Unay 2004 | Excluded as allergy not prespecified or reported Single centre randomised controlled trial in Turkey November 2000 and September 2001 Healthy, full term newborns appropriate size for gestational age who were not going to be breastfed supplemented until 16 weeks (formula fed) Intervention (n = 28): DHA supplemented formula (oleic acid 50.8%; LA 9.7%; α‐LA 1.2% DHA 0.5%) (intermediate PUFA intake) Control (n = 26): unsupplemented formula (oleic acid 44.9%; LA 11.2%; α‐LA 2.2%: no DHA) (intermediate PUFA intake) Outcome: auditory evoked potentials at 16 weeks |
| Van Biervliet 1986 | Excluded as allergy not prespecified or reported Single centre randomised controlled trial in Belgium before 1986 Healthy full‐term infants fed formula for 30 days Control (n = 10): 80% derived from milk‐fat, 20% from corn oil (C16:1 3.6%; C18:1 32.4%; C18:2 12.8%; C18:3 1.0%; C20:4 0.8%) Intervention (n = 10): vegetable origin (73% palm olein, 20% coconut oil, 7% corn oil) (C16:1 0.2%; C18:1 37.5%; C18:2 15.1%; C18:3 0.3%; C20:4 0.3%) Outcome: plasma lipoprotein composition |
| Van Biervliet 1992 | Excluded as allergy not prespecified or reported Single centre randomised controlled trial in Belgium before 1992 Healthy term newborn infants supplemented until 30 days (formula fed) Intervention (n = 10): α‐LA supplemented formula (C18:2n‐6 14.8%; C18:3n‐6 0.7%; C20:2n‐6 0.1%; C18:3n‐3 0.6%; cholesterol 4.0%) (low‐intermediate PUFA intake) Control (n = 10): unsupplemented formula (C18:2n‐6 13.4%; C18:3n‐3 0.1%; cholesterol 10.0%) (low‐intermediate PUFA intake) Outcome: fatty acid profile at 30 days |
| van der Merwe 2013 | Excluded as allergy not prespecified or reported Multicentre randomised controlled trial in Gambia May 2007 to October 2008 172 rural Gambian infants aged 3 to 9 months (mixed feeding) Intervention (n = 92): fish oil supplement (EPA 300 mg/day + DHA 200 mg/day) (intermediate‐high PUFA intake) Control (n = 91): olive oil supplement (intermediate PUFA intake) Outcome: gut integrity, morbidity, growth, development up to 12 months |
| van Goor 2009 | Excluded as allergy not prespecified or reported Multicentre randomised controlled trial in Netherlands December 2004 to December 2006 Women supplemented from enrolment 12 to 20th weeks' pregnancy until 12 weeks' postpartum Intervention 1 (n = 63): DHA 220 mg supplement + 1 capsule soy bean oil (intermediate‐high PUFA intake) Intervention 2 (n = 58): AA 220 mg + DHA 220 mg supplement (intermediate‐high PUFA intake) Control (n = 62): placebo 2 capsules soy bean oil (intermediate PUFA intake) Outcome: human milk AA + DHA content; general movements assessment at 12 weeks; neurodevelopment at 18 months; depressive symptoms |
| van Wezel‐Meijler 2002 | Excluded as allergy not prespecified or reported Single centre randomised controlled trial in Netherlands September 1993 and January 1996 Preterm neonates < 34 weeks' gestation, birth weight < 1750 g and normal neurological examination throughout the neonatal period. Supplemented until 6 months' corrected age (formula fed) Intervention (n = 28): AA 0.70% + DHA 0.34% supplemented formula (unclear PUFA intake) Control (n = 27): standard formula (low‐intermediate PUFA intake) Outcome: magnetic resonance imaging, visual acuity and development up to 2 years' corrected age |
| Vanderhoof 1999 | Excluded as allergy not prespecified or reported Multicentre randomised controlled trial in USA before 1999 Preterm neonates medically stable, < 28 days old, had received enteral feedings for < 24 hours, birth weight 750 to 2000 g and appropriate for gestational age. Supplemented until 8 weeks' corrected age (formula fed) Intervention (n = 77): LCPUFA supplemented formula (AA 0.50% + DHA 0.35%) (unclear PUFA intake) Control (n = 78): standard formula (no AA or DHA) (unclear PUFA intake) Outcome: fatty acid profile, growth up to 8 weeks' corrected age |
| Weizman 1998 | Excluded as allergy not prespecified or reported Single centre randomised controlled trial in Israel before 1998 Term neonates supplemented for 30 days (formula fed) Intervention (n = 25): PUFA supplemented formula (LA 24.2%, α‐LA 0.25%) (unclear PUFA intake) Control (n = 25): standard formula (unclear PUFA intake) Outcome: growth, development up to 3 months. Reported safety and efficacy Written in Hebrew; English abstract |
| Yang 2013 | Excluded as allergy not prespecified or reported Single centre randomised controlled trial in USA before 2013 Preterm neonates with enterostomies supplemented postoperatively until reanastomosis (2 to 10 weeks) (mixed feeding) Intervention (n = 18): fish oil supplement (infants < 1000 g: 0.2 g every 12 hours; infants > 1000 g: 0.25 g every 12 hours; maximum 0.5 g every 6 hours) (DHA dose range 50 to < 315 mg/day) (high PUFA intake) Control (n = 78): no fish oil supplement (intermediate PUFA intake) Outcome: fat absorption, growth until reanastomosis |
AA: arachidonic acid; DHA: docosahexaenoic acid; EPA: eicosapentaenoic acid; IU: international unit; LA: linoleic acid; LCPUFA: long chain polyunsaturated fatty acid; PUFA: polyunsaturated fatty acid.
Characteristics of ongoing studies [ordered by study ID]
Caplan 2013.
| Trial name or title | PUFA Supplementation in Premature Infants |
| Methods | Multicentre, randomised, placebo controlled, double blind trial |
| Participants | Inclusion criteria: premature infant born at gestational age < 34 weeks; birth weight < 1000 g; legally authorised representative is able to provide written informed consent within the first 72 hours of life, prior to the performance of a protocol‐specified evaluations or procedures Exclusion criteria: infants with known metabolic disorder or known congenital gastrointestinal anomaly. Infants who are deemed to be inappropriate for enrolment per attending neonatologist |
| Interventions | 2 doses of PUFA will be compared to placebo ‐ a "high" dose and a "low" dose |
| Outcomes | LCPUFA levels measured at 2 and 8 weeks of life Resolvin, a metabolite of LCPUFA, measured at 2 and 8 weeks of life |
| Starting date | ‐ |
| Contact information | ‐ |
| Notes | ClinicalTrials.gov Identifier: NCT01955044 |
Collins 2012.
| Trial name or title | Can Omega 3 Fatty Acids Improve Respiratory Outcomes in Preterm Infants? |
| Methods | Randomised controlled trial |
| Participants | Inclusion criteria: born at < 29 weeks' gestational age; within 3 days of commencing enteral feeds; has a legally acceptable representative capable of understanding the informed consent document and providing consent on the infant's behalf Exclusion criteria: infants who have a major congenital or chromosomal abnormality; women providing breast milk who are taking supplements providing DHA > 250 mg/day and do not wish to stop taking supplements; infants participating in another fatty acid study; infants receiving intravenous lipid emulsions containing fish oil given as early lipid parenteral nutrition support |
| Interventions | Intervention: tuna oil emulsion containing DHA 120 mg/mL to provide DHA 60 mg/kg/day (0.17 mL/kg 3 times a day). Intervention given enterally within 72 hours of the first enteral feed and continued until 36 weeks' postmenstrual age or discharge home (whichever occurs first) Control: soy oil emulsion with no additional DHA given at 0.17 mL/kg 3 times a day. Control given enterally within 72 hours of the first enteral feed and continued until 36 weeks' postmenstrual age or discharge home (whichever occurs first) |
| Outcomes | Bronchopulmonary dysplasia at 36 weeks' postmenstrual age; safety and tolerability; length of hospital stay; growth rate; grade of intraventricular haemorrhage; confirmed sepsis; confirmed necrotising enterocolitis; grade of retinopathy of prematurity and death Attention (ability to resist distraction) to 2 years' corrected age |
| Starting date | 2012 |
| Contact information | ‐ |
| Notes | ACTRN12612000503820 |
Gianni 2012.
| Trial name or title | The Influence of a Formula Supplemented with Dairy Lipids and Plant Oils on the Erythrocyte Membrane Omega‐3 Fatty Acid Profile in Healthy Full‐Term Infants |
| Methods | Double‐blind controlled randomised trial |
| Participants | 75 healthy full‐term infants Inclusion criteria: gestational age 37 to 42 weeks, birth weight > 2500 g, healthy newborns from normal pregnancy, aged up to 3 weeks when entering the study Exclusion criteria: newborns whose parents have planned to move within 6 months after birth, newborns with a positive family history of allergy to milk proteins, newborns with known congenital or postnatal diseases which could interfere with the study |
| Interventions | 4 months of formula feeding Control: formula supplemented with a mixture of dairy lipids and plant oils or a formula containing only plant oils Intervention: formula containing plant oils supplemented with arachidonic acid and DHA |
| Outcomes | Erythrocyte membrane omega‐3 fatty acid profile, LCPUFAs and the other fatty acids content, plasma lipid profile and insulin‐growth factor 1 level measured after 4 months Gastrointestinal tolerance, the changes in blood fatty acids content, in growth and body composition Adverse events and serious adverse events |
| Starting date | 2012 |
| Contact information | ‐ |
| Notes | ClinicalTrials.gov Identifier NCT01611649 |
Liu 2013.
| Trial name or title | The Effects of Polyunsaturated Fatty Acids (PUFA) on Allergic/Atopic Dermatitis |
| Methods | Randomised double blind controlled trial |
| Participants | Inclusion criteria: woman pregnant between 16 and 20 weeks, mother delivers after 36 weeks, mother is willing to breastfeed for 4 months, mother has potential to deliver a child with increased risk of atopic dermatitis, signed informed consent Exclusion criteria: mother is smoking, disease with influence on breastfeeding, complicated pregnancy, allergic to seafood, allergic to soy, allergic to marine fish, mother has > 2 salmon or tuna meals per week, mother is undergoing treatment with anticoagulants |
| Interventions | PUFA supplementation during pregnancy and lactation period |
| Outcomes | Fatty acid composition in human milk and plasma of the mothers and the clinical outcome of atopic dermatitis in infants at increased risk |
| Starting date | April 2015 (postponed) |
| Contact information | ‐ |
| Notes | ClinicalTrials.gov Identifier: NCT01936194 |
Millett 2010.
| Trial name or title | Effect of Docosahexaenoic Acid (DHA)‐Enriched Human Milk in Premature Newborns (DHARMA) |
| Methods | Randomised double blind controlled trial |
| Participants | Inclusion criteria: childbirth between 34 and 35 weeks' gestational age, breastfeeding, Caucasian, affiliation to social security, obtained consent from mother and parents for the child, mother with balanced diet, no allergy to eggs, single pregnancy Exclusion criteria: allergy to egg, unbalanced diet, diabetes, known digestive disease, contraindication with breastfeeding, smoker (> 5 cigarettes/day), alcoholism (daily consumption of alcohol), multiple pregnancy |
| Interventions | Lactating mothers and their newborn with mothers Supplemented with DHA Glycerophospholipid enriched in docosahexaenoic acid No supplementation |
| Outcomes | PUFA status and infant survey at 6 months |
| Starting date | February 2010 |
| Contact information | ‐ |
| Notes | This study has been terminated (difficulties of recruitment) |
DHA: docosahexaenoic acid; LCPUFA: long chain polyunsaturated fatty acid; PUFA: polyunsaturated fatty acid.
Differences between protocol and review
The protocol listed food hypersensitivity as a secondary outcome. We have omitted this as the review is focused on clinical allergic outcomes. The term 'hypersensitivity' includes clinical reactions that are not related to allergy.
In the review, we excluded studies that included eligible participants and compared eligible interventions but did not prespecify or report allergy. Although it was intended to include these to facilitate the assessment of publication bias, this would have resulted in an excessively cumbersome review. The potential for publication bias has still been addressed.
Risk differences are reported for all outcomes despite not being prespecified in the protocol.
Contributions of authors
TS, DAO and JKS contributed to the protocol. TS and DAO performed the literature search, independently assessed studies for eligibility, performed critical appraisal of eligible studies and data extraction, and formed a consensus on the conclusions. TS wrote the review with DAO.
Sources of support
Internal sources
No sources of support supplied
External sources
-
Australian Satellite of the Cochrane Neonatal Review Group, Australia.
NH&MRC grant RIMS project ID: 2013‐01632
-
Eunice Kennedy Shriver National Institute of Child Health and Human Development, National Institutes of Health, Department of Health and Human Services, USA.
Editorial support of the Cochrane Neonatal Review Group has been funded with Federal funds from the Eunice Kennedy Shriver National Institute of Child Health and Human Development National Institutes of Health, Department of Health and Human Services, USA, under Contract No. HHSN275201100016C
Declarations of interest
None known.
New
References
References to studies included in this review
Birch 2005 {published data only}
- Birch EE, Castaneda YS, Wheaton DH, Birch DG, Uauy RD, Hoffman DR. Visual maturation of term infants fed long‐chain polyunsaturated fatty acid‐supplemented or control formula for 12 mo. American Journal of Clinical Nutrition 2005;81(4):871‐9. [PUBMED: 15817866] [DOI] [PubMed] [Google Scholar]
- Birch EE, Khoury JC, Berseth CL, Castaneda YS, Couch JM, Bean J, et al. The impact of early nutrition on incidence of allergic manifestations and common respiratory illnesses in children. Journal of Pediatrics 2010;156(6):902‐6, 906.e1. [PUBMED: 20227721] [DOI] [PubMed] [Google Scholar]
- Drover J, Hoffman DR, Castaneda YS, Morale SE, Birch EE. Three randomized controlled trials of early long‐chain polyunsaturated fatty acid supplementation on means‐end problem solving in 9‐month‐olds. Child Development 2009;80(5):1376‐84. [PUBMED: 19765006] [DOI] [PMC free article] [PubMed] [Google Scholar]
- Drover JR, Felius J, Hoffman DR, Castaneda YS, Garfield S, Wheaton DH, et al. A randomized trial of DHA intake during infancy: school readiness and receptive vocabulary at 2‐3.5 years of age. Early Human Development 2012;88(11):885‐91. [PUBMED: 22835597] [DOI] [PubMed] [Google Scholar]
- Morale SE, Hoffman DR, Castaneda YS, Wheaton DH, Burns RA, Birch EE. Duration of long‐chain polyunsaturated fatty acids availability in the diet and visual acuity. Early Human Development 2005;81(2):197‐203. [PUBMED: 15748975] [DOI] [PubMed] [Google Scholar]
Damsgaard 2006 {published data only}
- Damsgaard CT, Lauritzen L, Kjaer TM, Holm PM, Fruekilde MB, Michaelsen KF, et al. Fish oil supplementation modulates immune function in healthy infants. Journal of Nutrition 2007;137(4):1031‐6. [PUBMED: 17374672] [DOI] [PubMed] [Google Scholar]
- Damsgaard CT, Schack‐Nielsen L, Michaelsen KF, Fruekilde MB, Hels O, Lauritzen L. Fish oil affects blood pressure and the plasma lipid profile in healthy Danish infants. Journal of Nutrition 2006;136(1):94‐9. [PUBMED: 16365065] [DOI] [PubMed] [Google Scholar]
- Harbild HL, Harslof LB, Christensen JH, Kannass KN, Lauritzen L. Fish oil‐supplementation from 9 to 12 months of age affects infant attention in a free‐play test and is related to change in blood pressure. Prostaglandins, Leukotrienes, and Essential Fatty Acids 2013;89(5):327‐33. [PUBMED: 24045099] [DOI] [PubMed] [Google Scholar]
- Lauritzen L, Christensen JH, Damsgaard CT, Michaelsen KF. The effect of fish oil supplementation on heart rate in healthy Danish infants. Pediatric Research 2008;64(6):610‐4. [PUBMED: 18679165] [DOI] [PubMed] [Google Scholar]
- Nielsen S, Nielsen DS, Lauritzen L, Jakobsen M, Michaelsen KF. Impact of diet on the intestinal microbiota in 10‐month‐old infants. Journal of Pediatric Gastroenterology and Nutrition 2007;44(5):613‐8. [PUBMED: 17460496] [DOI] [PubMed] [Google Scholar]
Fewtrell 2004 {published data only}
- Fewtrell MS, Abbott RA, Kennedy K, Singhal A, Morley R, Caine E, et al. Randomized, double‐blind trial of long‐chain polyunsaturated fatty acid supplementation with fish oil and borage oil in preterm infants. Journal of Pediatrics 2004;144(4):471‐9. [PUBMED: 15069395] [DOI] [PubMed] [Google Scholar]
- Isaacs EB, Ross S, Kennedy K, Weaver LT, Lucas A, Fewtrell MS. 10‐year cognition in preterms after random assignment to fatty acid supplementation in infancy. Pediatrics 2011;128(4):e890‐8. [PUBMED: 21930549] [DOI] [PubMed] [Google Scholar]
- Kennedy K, Ross S, Isaacs EB, Weaver LT, Singhal A, Lucas A, Fewtrell MS. The 10‐year follow‐up of a randomised trial of long‐chain polyunsaturated fatty acid supplementation in preterm infants: effects on growth and blood pressure. Archives of Disease in Childhood 2010;95(8):588‐95. [PUBMED: 20515959] [DOI] [PubMed] [Google Scholar]
Furuhjelm 2009 {published data only}
- Furuhjelm C, Jenmalm MC, Falth‐Magnusson K, Duchen K. Th1 and Th2 chemokines, vaccine‐induced immunity, and allergic disease in infants after maternal omega‐3 fatty acid supplementation during pregnancy and lactation. Pediatric Research 2011;69(3):259‐64. [PUBMED: 21099447] [DOI] [PubMed] [Google Scholar]
- Furuhjelm C, Warstedt K, Fageras M, Falth‐Magnusson K, Larsson J, Fredriksson M, et al. Allergic disease in infants up to 2 years of age in relation to plasma omega‐3 fatty acids and maternal fish oil supplementation in pregnancy and lactation. Pediatric Allergy and Immunology 2011;22(5):505‐14. [PUBMED: 21332799] [DOI] [PubMed] [Google Scholar]
- Furuhjelm C, Warstedt K, Larsson J, Fredriksson M, Bottcher MF, Falth‐Magnusson K, et al. Fish oil supplementation in pregnancy and lactation may decrease the risk of infant allergy. Acta Paediatrica 2009;98(9):1461‐7. [PUBMED: 19489765] [DOI] [PubMed] [Google Scholar]
Hayes 1992 {published data only}
- Hayes KC, Pronczuk A, Wood RA, Guy DG. Modulation of infant formula fat profile alters the low‐density lipoprotein/high‐density lipoprotein ratio and plasma fatty acid distribution relative to those with breast‐feeding. Journal of Pediatrics 1992;120(4 Pt 2):S109‐16. [PUBMED: 1560323] [DOI] [PubMed] [Google Scholar]
Hoffman 2008 {published data only}
- Hoffman D, Ziegler E, Mitmesser SH, Harris CL, Diersen‐Schade DA. Soy‐based infant formula supplemented with DHA and ARA supports growth and increases circulating levels of these fatty acids in infants. Lipids 2008;43(1):29‐35. [PUBMED: 17912568] [DOI] [PubMed] [Google Scholar]
Kitz 2006 {published data only}
- Kitz R, Rose MA, Schonborn H, Zielen S, Bohles HJ. Impact of early dietary gamma‐linolenic acid supplementation on atopic eczema in infancy. Pediatric Allergy and Immunology 2006;17(2):112‐7. [PUBMED: 16618360] [DOI] [PubMed] [Google Scholar]
Lauritzen 2004 {published data only}
- Asserhoj M, Nehammer S, Matthiessen J, Michaelsen KF, Lauritzen L. Maternal fish oil supplementation during lactation may adversely affect long‐term blood pressure, energy intake, and physical activity of 7‐year‐old boys. Journal of Nutrition 2009;139(2):298‐304. [PUBMED: 19091800] [DOI] [PubMed] [Google Scholar]
- Cheatham CL, Nerhammer AS, Asserhoj M, Michaelsen KF, Lauritzen L. Fish oil supplementation during lactation: effects on cognition and behavior at 7 years of age. Lipids 2011;46(7):637‐45. [PUBMED: 21512889] [DOI] [PubMed] [Google Scholar]
- Larnkjaer A, Christensen JH, Michaelsen KF, Lauritzen L. Maternal fish oil supplementation during lactation does not affect blood pressure, pulse wave velocity, or heart rate variability in 2.5‐y‐old children. Journal of Nutrition 2006;136(6):1539‐44. [PUBMED: 16702318] [DOI] [PubMed] [Google Scholar]
- Lauritzen L, Hoppe C, Straarup EM, Michaelsen KF. Maternal fish oil supplementation in lactation and growth during the first 2.5 years of life. Pediatric Research 2005;58(2):235‐42. [PUBMED: 16006428] [DOI] [PubMed] [Google Scholar]
- Lauritzen L, Jorgensen MH, Mikkelsen TB, Skovgaard lM, Straarup EM, Olsen SF, et al. Maternal fish oil supplementation in lactation: effect on visual acuity and n‐3 fatty acid content of infant erythrocytes. Lipids 2004;39(3):195‐206. [PUBMED: 15233397] [DOI] [PubMed] [Google Scholar]
- Lauritzen L, Jorgensen MH, Olsen SF, Straarup EM, Michaelsen KF. Maternal fish oil supplementation in lactation: effect on developmental outcome in breast‐fed infants. Reproduction, Nutrition, Development 2005;45(5):535‐47. [PUBMED: 16188206] [DOI] [PubMed] [Google Scholar]
- Lauritzen L, Kjaer TM, Fruekilde MB, Michaelsen KF, Frokiaer H. Fish oil supplementation of lactating mothers affects cytokine production in 2 1/2‐year‐old children. Lipids 2005;40(7):669‐76. [PUBMED: 16196417] [DOI] [PubMed] [Google Scholar]
Linnamaa 2010 {published data only}
- Linnamaa P, Nieminen K, Koulu L, Tuomasjukka S, Kallio H, Yang B, et al. Black currant seed oil supplementation of mothers enhances IFN‐gamma and suppresses IL‐4 production in breast milk. Pediatric Allergy and Immunology 2013;24(6):562‐6. [PUBMED: 23980846] [DOI] [PubMed] [Google Scholar]
- Linnamaa P, Savolainen J, Koulu L, Tuomasjukka S, Kallio H, Yang B, et al. Blackcurrant seed oil for prevention of atopic dermatitis in newborns: a randomized, double‐blind, placebo‐controlled trial. Clinical and Experimental Allergy 2010;40(8):1247‐55. [PUBMED: 20545710] [DOI] [PubMed] [Google Scholar]
Lucas 1999 {published data only}
- Lucas A, Stafford M, Morley R, Abbott R, Stephenson T, MacFadyen U, et al. Efficacy and safety of long‐chain polyunsaturated fatty acid supplementation of infant‐formula milk: a randomised trial. Lancet 1999;354(9194):1948‐54. [PUBMED: 10622297] [DOI] [PubMed] [Google Scholar]
- Singhal A, Morley R, Cole TJ, Kennedy K, Sonksen P, Isaacs E, et al. Infant nutrition and stereoacuity at age 4‐6 y. American Journal of Clinical Nutrition 2007;85(1):152‐9. [PUBMED: 17209191] [DOI] [PubMed] [Google Scholar]
Makrides 2002 {published data only}
- Makrides M, Hawkes JS, Neumann MA, Gibson RA. Nutritional effect of including egg yolk in the weaning diet of breast‐fed and formula‐fed infants: a randomized controlled trial. American Journal of Clinical Nutrition 2002;75(6):1084‐92. [PUBMED: 12036817] [DOI] [PubMed] [Google Scholar]
Meldrum 2011 {published data only}
- D'Vaz N, Meldrum SJ, Dunstan JA, Lee‐Pullen TF, Metcalfe J, Holt BJ, et al. Fish oil supplementation in early infancy modulates developing infant immune responses. Clinical and Experimental Allergy 2012;42(8):1206‐16. [PUBMED: 22805468] [DOI] [PubMed] [Google Scholar]
- D'Vaz N, Meldrum SJ, Dunstan JA, Martino D, McCarthy S, Metcalfe J, et al. Postnatal fish oil supplementation in high‐risk infants to prevent allergy: randomized controlled trial. Pediatrics 2012;130(4):674‐82. [PUBMED: 22945403] [DOI] [PubMed] [Google Scholar]
- Meldrum SJ, D'Vaz N, Casadio Y, Dunstan JA, Niels Krogsgaard‐Larsen N, Simmer K, et al. Determinants of DHA levels in early infancy: differential effects of breast milk and direct fish oil supplementation. Prostaglandins, Leukotrienes, and Essential Fatty Acids 2012;86(6):233‐9. [PUBMED: 22572105] [DOI] [PubMed] [Google Scholar]
- Meldrum SJ, D'Vaz N, Dunstan J, Mori TA, Prescott SL. The Infant Fish Oil Supplementation Study (IFOS): design and research protocol of a double‐blind, randomised controlled n‐3 LCPUFA intervention trial in term infants. Contemporary Clinical Trials 2011;32(5):771‐8. [PUBMED: 21718804] [DOI] [PubMed] [Google Scholar]
- Meldrum SJ, D'Vaz N, Simmer K, Dunstan JA, Hird K, Prescott SL. Effects of high‐dose fish oil supplementation during early infancy on neurodevelopment and language: a randomised controlled trial. British Journal of Nutrition 2012;108(8):1443‐54. [PUBMED: 22348468] [DOI] [PubMed] [Google Scholar]
Mihrshahi 2003 {published data only}
- Almqvist C, Garden F, Xuan W, Mihrshahi S, Leeder SR, Oddy W, et al. Omega‐3 and omega‐6 fatty acid exposure from early life does not affect atopy and asthma at age 5 years. Journal of Clinical Immunology 2007;119(6):1438‐44. [PUBMED: 17379291] [DOI] [PubMed] [Google Scholar]
- Ayer JG, Harmer JA, Xuan W, Toelle B, Webb K, Almqvist C, et al. Dietary supplementation with n‐3 polyunsaturated fatty acids in early childhood: effects on blood pressure and arterial structure and function at age 8 y. American Journal of Clinical Nutrition 2009;90(2):438‐46. [PUBMED: 19515739] [DOI] [PubMed] [Google Scholar]
- Hoyos C, Almqvist C, Garden F, Xuan W, Oddy WH, Marks GB, et al. Effect of omega 3 and omega 6 fatty acid intakes from diet and supplements on plasma fatty acid levels in the first 3 years of life. Asia Pacific Journal of Clinical Nutrition 2008;17(4):552‐7. [PUBMED: 19114389] [PubMed] [Google Scholar]
- Marks GB, Mihrshahi S, Kemp AS, Tovey ER, Webb K, Almqvist C, et al. Prevention of asthma during the first 5 years of life: a randomized controlled trial. Journal of Allergy and Clinical Immunology 2006;118(1):53‐61. [PUBMED: 16815138] [DOI] [PubMed] [Google Scholar]
- Mihrshahi S, Peat JK, Marks GB, Mellis CM, Tovey ER, Webb K, et al. Eighteen‐month outcomes of house dust mite avoidance and dietary fatty acid modification in the Childhood Asthma Prevention Study (CAPS). Journal of Allergy and Clinical Immunology 2003;111(1):162‐8. [PUBMED: 12532113] [DOI] [PubMed] [Google Scholar]
- Mihrshahi S, Peat JK, Webb K, Oddy W, Marks GB, Mellis CM, CAPS Team. Effect of omega‐3 fatty acid concentrations in plasma on symptoms of asthma at 18 months of age. Pediatric Allergy and Immunology 2004;15(6):517‐22. [PUBMED: 15610365] [DOI] [PubMed] [Google Scholar]
- Peat JK, Mihrshahi S, Kemp AS, Marks GB, Tovey ER, Webb K, et al. Three‐year outcomes of dietary fatty acid modification and house dust mite reduction in the Childhood Asthma Prevention Study. Journal of Allergy and Clinical Immunology 2004;114(4):807‐13. [PUBMED: 15480319] [DOI] [PubMed] [Google Scholar]
- Skilton MR, Ayer JG, Harmer JA, Webb K, Leeder SR, Marks GB, et al. Impaired fetal growth and arterial wall thickening: a randomized trial of omega‐3 supplementation. Pediatrics 2012;129(3):e698‐703. [PUBMED: 22351892] [DOI] [PubMed] [Google Scholar]
Morris 2000 {published data only}
- Morris G, Moorcraft J, Mountjoy A, Wells JC. A novel infant formula milk with added long‐chain polyunsaturated fatty acids from single‐cell sources: a study of growth, satisfaction and health. European Journal of Clinical Nutrition 2000;54(12):883‐6. [PUBMED: 11114686] [DOI] [PubMed] [Google Scholar]
O'Connor 2001 {published data only}
- O'Connor DL, Hall R, Adamkin D, Auestad N, Castillo M, Connor WE, et al. Growth and development in preterm infants fed long‐chain polyunsaturated fatty acids: a prospective, randomized controlled trial. Pediatrics 2001;108(2):359‐71. [PUBMED: 11483801] [DOI] [PubMed] [Google Scholar]
- O'Connor DL, Jacobs J, Hall R, Adamkin D, Auestad N, Castillo M, et al. Growth and development of premature infants fed predominantly human milk, predominantly premature infant formula, or a combination of human milk and premature formula. Journal of Pediatric Gastroenterology and Nutrition 2003;37(4):437‐46. [PUBMED: 14508214] [DOI] [PubMed] [Google Scholar]
Smithers 2008 {published data only}
- Atwell K, Collins CT, Sullivan TR, Ryan P, Gibson RA, Makrides M, et al. Respiratory hospitalisation of infants supplemented with docosahexaenoic acid as preterm neonates. Journal of Paediatrics and Child Health 2013;49(1):E17‐22. [PUBMED: 23279074] [DOI] [PubMed] [Google Scholar]
- Collins CT, Gibson RA, Anderson PJ, McPhee AJ, Sullivan TR, Gould JF, et al. Neurodevelopmental outcomes at 7 years' corrected age in preterm infants who were fed high‐dose docosahexaenoic acid to term equivalent: a follow‐up of a randomised controlled trial. BMJ Open 2015;5(3):e007314. [PUBMED: 25787990] [DOI] [PMC free article] [PubMed] [Google Scholar]
- Collins CT, Makrides M, Gibson RA, McPhee AJ, Davis PG, Doyle LW, et al. Pre‐ and post‐term growth in pre‐term infants supplemented with higher‐dose DHA: a randomised controlled trial. British Journal of Nutrition 2011;105(11):1635‐43. [PUBMED: 21443815] [DOI] [PubMed] [Google Scholar]
- Makrides M, Gibson RA, McPhee AJ, Collins CT, Davis PG, Doyle LW, et al. Neurodevelopmental outcomes of preterm infants fed high‐dose docosahexaenoic acid: a randomized controlled trial. JAMA 2009;301(2):175‐82. [PUBMED: 19141765] [DOI] [PubMed] [Google Scholar]
- Manley BJ, Makrides M, Collins CT, McPhee AJ, Gibson RA, Ryan P, et al. High‐dose docosahexaenoic acid supplementation of preterm infants: respiratory and allergy outcomes. Pediatrics 2011;128(1):e71‐7. [PUBMED: 21708809] [DOI] [PubMed] [Google Scholar]
- Smithers LG, Collins CT, Simmonds LA, Gibson RA, McPhee A, Makrides M. Feeding preterm infants milk with a higher dose of docosahexaenoic acid than that used in current practice does not influence language or behavior in early childhood: a follow‐up study of a randomized controlled trial. American Journal of Clinical Nutrition 2010;91(3):628‐34. [PUBMED: 20053878] [DOI] [PubMed] [Google Scholar]
- Smithers LG, Gibson RA, McPhee A, Makrides M. Effect of long‐chain polyunsaturated fatty acid supplementation of preterm infants on disease risk and neurodevelopment: a systematic review of randomized controlled trials. American Journal of Clinical Nutrition 2008;87(4):912‐20. [PUBMED: 18400714] [DOI] [PubMed] [Google Scholar]
- Smithers LG, Gibson RA, McPhee A, Makrides M. Effect of two doses of docosahexaenoic acid (DHA) in the diet of preterm infants on infant fatty acid status: results from the DINO trial. Prostaglandins, Leukotrienes, and Essential Fatty Acids 2008;79(3‐5):141‐6. [PUBMED: 18951004] [DOI] [PubMed] [Google Scholar]
- Smithers LG, Gibson RA, McPhee A, Makrides M. Higher dose of docosahexaenoic acid in the neonatal period improves visual acuity of preterm infants: results of a randomized controlled trial. American Journal of Clinical Nutrition 2008;88(4):1049‐56. [PUBMED: 18842793] [DOI] [PubMed] [Google Scholar]
van Gool 2003 {published data only}
- Gool CJ, Thijs C, Henquet CJ, Houwelingen AC, Dagnelie PC, Schrander J, et al. Gamma‐linolenic acid supplementation for prophylaxis of atopic dermatitis ‐ a randomized controlled trial in infants at high familial risk. American Journal of Clinical Nutrition 2003;77(4):943‐51. [PUBMED: 12663296] [DOI] [PubMed] [Google Scholar]
References to studies excluded from this review
Agostoni 1994 {published data only}
- Agostoni C, Riva E, Bellu R, Trojan S, Luotti D, Giovannini M. Effects of diet on the lipid and fatty acid status of full‐term infants at 4 months. Journal of the American College of Nutrition 1994;13(6):658‐64. [PUBMED: 7706601] [DOI] [PubMed] [Google Scholar]
- Agostoni C, Trojan S, Bellu R, Riva E, Bruzzese MG, Giovannini M. Developmental quotient at 24 months and fatty acid composition of diet in early infancy: a follow up study. Archives of Disease in Childhood 1997;76(5):421‐4. [PUBMED: 9196357] [DOI] [PMC free article] [PubMed] [Google Scholar]
- Agostoni C, Trojan S, Bellu R, Riva E, Giovannini M. Neurodevelopmental quotient of healthy term infants at 4 months and feeding practice: the role of long‐chain polyunsaturated fatty acids. Pediatric Research 1995;38(2):262‐6. [PUBMED: 7478826] [DOI] [PubMed] [Google Scholar]
- Forsyth JS, Varma S, Colvin M. A randomised controlled study of the effect of long chain polyunsaturated fatty acid supplementation on stool hardness during formula feeding. Archives of Disease in Childhood 1999;81(3):253‐6. [PUBMED: 10451400] [DOI] [PMC free article] [PubMed] [Google Scholar]
- Forsyth JS, Willatts P, Agostoni C, Bissenden J, Casaer P, Boehm G. Long chain polyunsaturated fatty acid supplementation in infant formula and blood pressure in later childhood: follow up of a randomised controlled trial. BMJ 2003;326(7396):953. [PUBMED: 12727766] [DOI] [PMC free article] [PubMed] [Google Scholar]
- Willatts P, Forsyth JS, DiModugno MK, Varma S, Colvin M. Effect of long‐chain polyunsaturated fatty acids in infant formula on problem solving at 10 months of age. Lancet 1998;352(9129):688‐91. [PUBMED: 9728984] [DOI] [PubMed] [Google Scholar]
- Willatts P, Forsyth JS, DiModugno MK, Varma S, Colvin M. Influence of long‐chain polyunsaturated fatty acids on infant cognitive function. Lipids 1998;33(10):973‐80. [PUBMED: 9832076] [DOI] [PubMed] [Google Scholar]
- Willatts P, Forsyth S, Agostoni C, Casaer P, Riva E, Boehm G. Effects of long‐chain PUFA supplementation in infant formula on cognitive function in later childhood. American Journal of Clinical Nutrition 2013;98(2):536S‐42S. [PUBMED: 23783296] [DOI] [PubMed] [Google Scholar]
Agostoni 2009 {published data only}
- Agostoni C, Zuccotti G V, Radaelli G, Besana R, Podesta A, Sterpa A, et al. Docosahexaenoic acid supplementation and time at achievement of gross motor milestones in healthy infants: a randomized, prospective, double‐blind, placebo‐controlled trial. American Journal of Clinical Nutrition 2009;89(1):64‐70. [PUBMED: 19056592] [DOI] [PubMed] [Google Scholar]
Alam 2010 {published data only}
- Alam DS, Raaij JM, Hautvast JG, Yunus M, Wahed MA, Fuchs GJ. Effect of dietary fat supplementation during late pregnancy and first six months of lactation on maternal and infant vitamin A status in rural Bangladesh. Journal of Health, Population & Nutrition 2010;28(4):333‐42. [PUBMED: 20824976] [DOI] [PMC free article] [PubMed] [Google Scholar]
Amesz 2010 {published data only}
- Amesz EM, Schaafsma A, Cranendonk A, Lafeber HN. Optimal growth and lower fat mass in preterm infants fed a protein‐enriched postdischarge formula. Journal of Pediatric Gastroenterology and Nutrition 2010;50(2):200‐7. [DOI] [PubMed] [Google Scholar]
- Lagemaat M, Rotteveel J, Muskiet FA, Schaafsma A, Lafeber HN. Post term dietary‐induced changes in DHA and AA status relate to gains in weight, length, and head circumference in preterm infants. Prostaglandins Leukotrienes & Essential Fatty Acids 2011;85(6):311‐6. [DOI] [PubMed] [Google Scholar]
Andersen 2011 {published data only}
- Andersen AD, Michaelsen KF, Hellgren LI, Trolle E, Lauritzen L. A randomized controlled intervention with fish oil versus sunflower oil from 9 to 18 months of age: exploring changes in growth and skinfold thicknesses. Pediatric Research 2011;70(4):368‐74. [PUBMED: 21691253] [DOI] [PubMed] [Google Scholar]
- Andersen AD, Molbak L, Michaelsen KF, Lauritzen L. Molecular fingerprints of the human fecal microbiota from 9 to 18 months old and the effect of fish oil supplementation. Journal of Pediatric Gastroenterology and Nutrition 2011;53(3):303‐9. [PUBMED: 21865979] [DOI] [PubMed] [Google Scholar]
- Harslof LB, Damsgaard CT, Andersen AD, Aakjaer DL, Michaelsen KF, Hellgren LI, et al. Reduced ex vivo stimulated IL‐6 response in infants randomized to fish oil from 9 to 18 months, especially among PPARG2 and COX2 wild types. Prostaglandins, Leukotrienes, and Essential Fatty Acids 2015;94:21‐7. [PUBMED: 25498245] [DOI] [PubMed] [Google Scholar]
- Harslof LB, Damsgaard CT, Hellgren LI, Andersen AD, Vogel U, Lauritzen L. Effects on metabolic markers are modified by PPARG2 and COX2 polymorphisms in infants randomized to fish oil. Genes & Nutrition 2014;9(3):396. [PUBMED: 24643342] [DOI] [PMC free article] [PubMed] [Google Scholar]
Auestad 1997 {published data only}
- Auestad N, Montalto MB, Hall RT, Fitzgerald KM, Wheeler RE, Connor WE, et al. Visual acuity, erythrocyte fatty acid composition, and growth in term infants fed formulas with long chain polyunsaturated fatty acids for one year. Ross Pediatric Lipid Study. Pediatric Research 1997;41(1):1‐10. [PUBMED: 8979282] [DOI] [PubMed] [Google Scholar]
- Auestad N, Scott DT, Janowsky JS, Jacobsen C, Carroll RE, Montalto MB, et al. Visual, cognitive, and language assessments at 39 months: a follow‐up study of children fed formulas containing long‐chain polyunsaturated fatty acids to 1 year of age. Pediatrics 2003;112(3 Pt 1):e177‐83. [DOI] [PubMed] [Google Scholar]
- Scott DT, Janowsky JS, Carroll RE, Taylor JA, Auestad N, Montalto MB. Formula supplementation with long‐chain polyunsaturated fatty acids: are there developmental benefits?. Pediatrics 1998;102(5):E59. [DOI] [PubMed] [Google Scholar]
Auestad 2001 {published data only}
- Auestad N, Halter R, Hall RT, Blatter M, Bogle M L, Burks W, et al. Growth and development in term infants fed long‐chain polyunsaturated fatty acids: a double‐masked, randomized, parallel, prospective, multivariate study. Pediatrics 2001;108(2):372‐81. [DOI] [PubMed] [Google Scholar]
Ben 2004 {published data only}
- Ben XM, Zhou XY, Zhao WH, Yu WL, Pan W, Zhang WL, et al. Growth and development of term infants fed with milk with long‐chain polyunsaturated fatty acid supplementation. Chinese Medical Journal 2004;117(8):1268‐70. [PUBMED: 15361309] [PubMed] [Google Scholar]
Benito Fernandez 2002 {published data only}
- Benito Fernandez J, Ruiz Sanz JI, Aquino Farina L, Pijoan Zubizarreta JI, Sasieta Altuna M, Sanjurjo Crespo P. The influence of human milk and various artificial formulae commercially available in Spain on the fatty acid status of infants in the first two months of life. Anales Espanoles de Pediatria 2002;57(2):163‐9. [PUBMED: 12139873] [PubMed] [Google Scholar]
Bergmann 2008 {published data only}
- Bergmann RL, Haschke‐Becher E, Klassen‐Wigger P, Bergmann KE, Richter R, Dudenhausen JW, et al. Supplementation with 200 mg/day docosahexaenoic acid from mid‐pregnancy through lactation improves the docosahexaenoic acid status of mothers with a habitually low fish intake and of their infants. Annals of Nutrition & Metabolism 2008;52(2):157‐66. [PUBMED: 18446020] [DOI] [PMC free article] [PubMed] [Google Scholar]
Berseth 2014 {published data only}
- Berseth CL, Harris CL, Wampler JL, Hoffman DR, Diersen‐Schade DA. Liquid human milk fortifier significantly improves docosahexaenoic and arachidonic acid status in preterm infants. Prostaglandins, Leukotrienes, and Essential Fatty Acids 2014;91(3):97‐103. [DOI] [PubMed] [Google Scholar]
- Moya F, Sisk PM, Walsh KR, Berseth CL. A new liquid human milk fortifier and linear growth in preterm infants. Pediatrics 2012;130(4):e928‐35. [DOI] [PubMed] [Google Scholar]
Billeaud 1996 {published data only}
- Babin F, Rodriguez A, Sarda P, Vandeputte B, Mendy F, Descomps B. Alpha linolenic acid in cholesterol esters: a marker of alphalinolenic acid intake in newborns. European Journal of Clinical Nutrition 2000;54(11):840‐3. [PUBMED: 11114678] [DOI] [PubMed] [Google Scholar]
- Billeaud C, Bougle D, Sarda P, Combe N, Mazette S, Babin F, et al. Effects of preterm infant formula supplementation with alpha‐linolenic acid with a linoleate/alpha‐linolenate ratio of 6: a multicentric study. European Journal of Clinical Nutrition 1997;51(8):520‐6. [PUBMED: 11248877] [DOI] [PubMed] [Google Scholar]
- Bougle D, Nouvelot A, Billeaud C, Sarda P, Entressangles B, Descomps B, et al. Relationships between red blood cell vitamin E and polyunsaturated fatty acid in the premature infant. Annals of Nutrition & Metabolism 1996;40(6):325‐30. [PUBMED: 9087310] [DOI] [PubMed] [Google Scholar]
Birch 1992 {published data only}
- Birch DG, Birch EE, Hoffman DR, Uauy RD. Retinal development in very‐low‐birth‐weight infants fed diets differing in omega‐3 fatty acids. Investigative Ophthalmology & Visual Science 1992;33(8):2365‐76. [PUBMED: 1386065] [PubMed] [Google Scholar]
- Birch EE, Birch DG, Hoffman DR, Uauy R. Dietary essential fatty acid supply and visual acuity development. Investigative Ophthalmology & Visual Science 1992;33(11):3242‐53. [PUBMED: 1399429] [PubMed] [Google Scholar]
Birch 1998 {published data only}
- Birch EE, Garfield S, Castaneda Y, Hughbanks‐Wheaton D, Uauy R, Hoffman D. Visual acuity and cognitive outcomes at 4 years of age in a double‐blind, randomized trial of long‐chain polyunsaturated fatty acid‐supplemented infant formula. Early Human Development 2007;83(5):279‐84. [PUBMED: 17240089] [DOI] [PubMed] [Google Scholar]
- Birch EE, Garfield S, Hoffman DR, Uauy R, Birch DG. A randomized controlled trial of early dietary supply of long‐chain polyunsaturated fatty acids and mental development in term infants. Developmental Medicine and Child Neurology 2000;42(3):174‐81. [PUBMED: 10755457] [DOI] [PubMed] [Google Scholar]
- Birch EE, Hoffman DR, Uauy R, Birch DG, Prestidge C. Visual acuity and the essentiality of docosahexaenoic acid and arachidonic acid in the diet of term infants. Pediatric Research 1998;44(2):201‐9. [PUBMED: 9702915] [DOI] [PubMed] [Google Scholar]
- Hoffman DR, Birch EE, Birch DG, Uauy R, Castaneda YS, Lapus MG, et al. Impact of early dietary intake and blood lipid composition of long‐chain polyunsaturated fatty acids on later visual development. Journal of Pediatric Gastroenterology and Nutrition 2000;31(5):540‐53. [PUBMED: 11144440] [DOI] [PubMed] [Google Scholar]
- Morale SE, Hoffman DR, Castaneda YS, Wheaton DH, Burns RA, Birch EE. Duration of long‐chain polyunsaturated fatty acids availability in the diet and visual acuity. Early Human Development 2005;81(2):197‐203. [PUBMED: 15748975] [DOI] [PubMed] [Google Scholar]
Birch 2002 {published data only}
- Birch EE, Hoffman DR, Castaneda YS, Fawcett SL, Birch DG, Uauy RD. A randomized controlled trial of long‐chain polyunsaturated fatty acid supplementation of formula in term infants after weaning at 6 wk of age. American Journal of Clinical Nutrition 2002;75(3):570‐80. [PUBMED: 11864865] [DOI] [PubMed] [Google Scholar]
- Drover J, Hoffman DR, Castaneda YS, Morale SE, Birch EE. Three randomized controlled trials of early long‐chain polyunsaturated fatty acid supplementation on means‐end problem solving in 9‐month‐olds. Child Development 2009;80(5):1376‐84. [PUBMED: 19765006] [DOI] [PMC free article] [PubMed] [Google Scholar]
- Morale SE, Hoffman DR, Castaneda YS, Wheaton DH, Burns RA, Birch EE. Duration of long‐chain polyunsaturated fatty acids availability in the diet and visual acuity. Early Human Development 2005;81(2):197‐203. [PUBMED: 15748975] [DOI] [PubMed] [Google Scholar]
Birch 2010 {published data only}
- Birch EE, Carlson SE, Hoffman DR, Fitzgerald‐Gustafson KM, Fu VL, Drover JR, et al. The DIAMOND (DHA Intake And Measurement Of Neural Development) study: a double‐masked, randomized controlled clinical trial of the maturation of infant visual acuity as a function of the dietary level of docosahexaenoic acid. American Journal of Clinical Nutrition 2010;91(4):848‐59. [PUBMED: 20130095] [DOI] [PubMed] [Google Scholar]
- Colombo J, Carlson SE, Cheatham CL, Fitzgerald‐Gustafson KM, Kepler A, Doty T. Long‐chain polyunsaturated fatty acid supplementation in infancy reduces heart rate and positively affects distribution of attention. Pediatric Research 2011;70(4):406‐10. [PUBMED: 21705959] [DOI] [PMC free article] [PubMed] [Google Scholar]
- Colombo J, Carlson SE, Cheatham CL, Shaddy DJ, Kerling EH, Thodosoff JM, et al. Long‐term effects of LCPUFA supplementation on childhood cognitive outcomes. American Journal of Clinical Nutrition 2013;98(2):403‐12. [PUBMED: 23803884] [DOI] [PMC free article] [PubMed] [Google Scholar]
- Drover JR, Felius J, Hoffman DR, Castaneda YS, Garfield S, Wheaton DH, et al. A randomized trial of DHA intake during infancy: school readiness and receptive vocabulary at 2‐3.5 years of age. Early Human Development 2012;88(11):885‐91. [PUBMED: 22835597] [DOI] [PubMed] [Google Scholar]
- Drover JR, Hoffman DR, Castaneda YS, Morale SE, Garfield S, Wheaton DH, et al. Cognitive function in 18‐month‐old term infants of the DIAMOND study: a randomized, controlled clinical trial with multiple dietary levels of docosahexaenoic acid. Early Human Development 2011;87(3):223‐30. [PUBMED: 21295417] [DOI] [PubMed] [Google Scholar]
Boehm 1996 {published data only}
- Boehm G, Borte M, Bohles HJ, Muller H, Kohn G, Moro G. Docosahexaenoic and arachidonic acid content of serum and red blood cell membrane phospholipids of preterm infants fed breast milk, standard formula or formula supplemented with n‐3 and n‐6 long‐chain polyunsaturated fatty acids. European Journal of Pediatrics 1996;155(5):410‐6. [PUBMED: 8741041] [DOI] [PubMed] [Google Scholar]
Boehm 1997 {published data only}
- Boehm G, Muller H, Kohn G, Moro G, Minoli I, Bohles HJ. Docosahexaenoic and arachidonic acid absorption in preterm infants fed LCP‐free or LCP‐supplemented formula in comparison to infants fed fortified breast milk. Annals of Nutrition & Metabolism 1997;41(4):235‐41. [DOI] [PubMed] [Google Scholar]
Bondia‐Martinez 1998 {published data only}
- Bondia‐Martinez E, Lopez‐Sabater MC, Castellote‐Bargallo AI, Rodriguez‐Palmero M, Gonzalez‐Corbella MJ, Rivero‐Urgell M, et al. Fatty acid composition of plasma and erythrocytes in term infants fed human milk and formulae with and without docosahexaenoic and arachidonic acids from egg yolk lecithin. Early Human Development 1998;53(Suppl):S109‐19. [PUBMED: 10102659] [DOI] [PubMed] [Google Scholar]
Bougle 1999 {published data only}
- Bougle D, Denise P, Vimard F, Nouvelot A, Penneillo MJ, Guillois B. Early neurological and neuropsychological development of the preterm infant and polyunsaturated fatty acids supply. Clinical Neurophysiology 1999;110(8):1363‐70. [PUBMED: 10454271] [DOI] [PubMed] [Google Scholar]
Bouwstra 2003 {published data only}
- Bouwstra H, Dijck‐Brouwer DA, Boehm G, Boersma ER, Muskiet FA, Hadders‐Algra M. Long‐chain polyunsaturated fatty acids and neurological developmental outcome at 18 months in healthy term infants. Acta Paediatrica 2005;94(1):26‐32. [PUBMED: 15858956] [DOI] [PubMed] [Google Scholar]
- Bouwstra H, Dijck‐Brouwer DA, Wildeman JA, Tjoonk HM, Heide JC, Boersma ER, et al. Long‐chain polyunsaturated fatty acids have a positive effect on the quality of general movements of healthy term infants. American Journal of Clinical Nutrition 2003;78(2):313‐8. [PUBMED: 12885715] [DOI] [PubMed] [Google Scholar]
- Jong C, Boehm G, Kikkert HK, Hadders‐Algra M. The Groningen LCPUFA study: no effect of short‐term postnatal long‐chain polyunsaturated fatty acids in healthy term infants on cardiovascular and anthropometric development at 9 years. Pediatric Research 2011;70(4):411‐6. [PUBMED: 21705958] [DOI] [PubMed] [Google Scholar]
- Jong C, Kikkert HK, Fidler V, Hadders‐Algra M. Effects of long‐chain polyunsaturated fatty acid supplementation of infant formula on cognition and behaviour at 9 years of age. Developmental Medicine & Child Neurology 2012;54(12):1102‐8. [PUBMED: 23066842] [DOI] [PubMed] [Google Scholar]
- Jong C, Kikkert HK, Fidler V, Hadders‐Algra M. The Groningen LCPUFA study: no effect of postnatal long‐chain polyunsaturated fatty acids in healthy term infants on neurological condition at 9 years. British Journal of Nutrition 2010;104(4):566‐72. [PUBMED: 20370943] [DOI] [PubMed] [Google Scholar]
Carlson 1987 {published data only}
- Carlson SE, Cooke RJ, Rhodes PG, Peeples JM, Werkman SH. Effect of vegetable and marine oils in preterm infant formulas on blood arachidonic and docosahexaenoic acids. Journal of Pediatrics 1992;120(4 Pt 2):S159‐67. [PUBMED: 1532828] [DOI] [PubMed] [Google Scholar]
- Carlson SE, Rhodes PG, Rao VS, Goldgar DE. Effect of fish oil supplementation on the n‐3 fatty acid content of red blood cell membranes in preterm infants. Pediatric Research 1987;21(5):507‐10. [PUBMED: 2954026] [DOI] [PubMed] [Google Scholar]
Carlson 1991a {published data only}
- Carlson SE, Cooke RJ, Rhodes PG, Peeples JM, Werkman SH. Effect of vegetable and marine oils in preterm infant formulas on blood arachidonic and docosahexaenoic acids. Journal of Pediatrics 1992;120(4 Pt 2):S159‐67. [PUBMED: 1532828] [DOI] [PubMed] [Google Scholar]
- Carlson SE, Cooke RJ, Rhodes PG, Peeples JM, Werkman SH, Tolley EA. Long‐term feeding of formulas high in linolenic acid and marine oil to very low birth weight infants: phospholipid fatty acids. Pediatric Research 1991;30(5):404‐12. [PUBMED: 1684416] [DOI] [PubMed] [Google Scholar]
Carlson 1991b {published data only}
- Carlson SE, Cooke RJ, Rhodes PG, Peeples JM, Werkman SH, Tolley EA. Long‐term feeding of formulas high in linolenic acid and marine oil to very low birth weight infants: phospholipid fatty acids. Pediatric Research 1991;30(5):404‐12. [PUBMED: 1684416] [DOI] [PubMed] [Google Scholar]
- Carlson SE, Werkman SH, Rhodes PG, Tolley EA. Visual‐acuity development in healthy preterm infants: effect of marine‐oil supplementation. American Journal of Clinical Nutrition 1993;58(1):35‐42. [PUBMED: 8317386] [DOI] [PubMed] [Google Scholar]
- Werkman SH, Carlson SE. A randomized trial of visual attention of preterm infants fed docosahexaenoic acid until nine months. Lipids 1996;31(1):91‐7. [PUBMED: 8649241] [DOI] [PubMed] [Google Scholar]
Carlson 1996a {published data only}
- Carlson SE, Ford AJ, Werkman SH, Peeples JM, Koo WW. Visual acuity and fatty acid status of term infants fed human milk and formulas with and without docosahexaenoate and arachidonate from egg yolk lecithin. Pediatric Research 1996;39(5):882‐8. [PUBMED: 8726246] [DOI] [PubMed] [Google Scholar]
Carlson 1996b {published data only}
- Carlson SE, Werkman SH. A randomized trial of visual attention of preterm infants fed docosahexaenoic acid until two months. Lipids 1996;31(1):85‐90. [PUBMED: 8649239] [DOI] [PubMed] [Google Scholar]
- Carlson SE, Werkman SH, Tolley EA. Effect of long‐chain n‐3 fatty acid supplementation on visual acuity and growth of preterm infants with and without bronchopulmonary dysplasia. American Journal of Clinical Nutrition 1996;63(5):687‐97. [PUBMED: 8615350] [DOI] [PubMed] [Google Scholar]
Carlson 1998 {published data only}
- Carlson SE, Montalto MB, Ponder DL, Werkman SH, Korones SB. Lower incidence of necrotizing enterocolitis in infants fed a preterm formula with egg phospholipids. Pediatric Research 1998;44(4):491‐8. [PUBMED: 9773836] [DOI] [PubMed] [Google Scholar]
Carnielli 1998 {published data only}
- Carnielli VP, Simonato M, Verlato G, Luijendijk I, Curtis M, Sauer PJ, et al. Synthesis of long‐chain polyunsaturated fatty acids in preterm newborns fed formula with long‐chain polyunsaturated fatty acids. American Journal of Clinical Nutrition 2007;86(5):1323‐30. [PUBMED: 17991642] [DOI] [PubMed] [Google Scholar]
- Carnielli VP, Verlato G, Pederzini F, Luijendijk I, Boerlage A, Pedrotti D, et al. Intestinal absorption of long‐chain polyunsaturated fatty acids in preterm infants fed breast milk or formula. American Journal of Clinical Nutrition 1998;67(1):97‐103. [PUBMED: 9440382] [DOI] [PubMed] [Google Scholar]
Clandinin 1992 {published data only}
- Clandinin MT, Garg ML, Parrott A, Aerde J, Hervada A, Lien E. Addition of long‐chain polyunsaturated fatty acids to formula for very low birth weight infants. Lipids 1992;27(11):896‐900. [PUBMED: 1491607] [DOI] [PubMed] [Google Scholar]
- Clandinin MT, Parrott A, Aerde JE, Hervada AR, Lien E. Feeding preterm infants a formula containing C20 and C22 fatty acids simulates plasma phospholipid fatty acid composition of infants fed human milk. Early Human Development 1992;31(1):41‐51. [PUBMED: 1486817] [DOI] [PubMed] [Google Scholar]
Clandinin 1997 {published data only}
- Clandinin MT, Aerde JE, Parrott A, Field CJ, Euler AR, Lien E. Assessment of feeding different amounts of arachidonic and docosahexaenoic acids in preterm infant formulas on the fatty acid content of lipoprotein lipids. Acta Paediatrica 1999;88(8):890‐6. [PUBMED: 10503691] [DOI] [PubMed] [Google Scholar]
- Clandinin MT, Aerde JE, Parrott A, Field CJ, Euler AR, Lien EL. Assessment of the efficacious dose of arachidonic and docosahexaenoic acids in preterm infant formulas: fatty acid composition of erythrocyte membrane lipids. Pediatric Research 1997;42(6):819‐25. [PUBMED: 9396564] [DOI] [PubMed] [Google Scholar]
Clandinin 2005 {published data only}
- Clandinin MT, Aerde JE, Merkel KL, Harris CL, Springer MA, Hansen JW, et al. Growth and development of preterm infants fed infant formulas containing docosahexaenoic acid and arachidonic acid. Journal of Pediatrics 2005;146(4):461‐8. [PUBMED: 15812447] [DOI] [PubMed] [Google Scholar]
Clark 1992 {published data only}
- Clark KJ, Makrides M, Neumann MA, Gibson RA. Determination of the optimal ratio of linoleic acid to alpha‐linolenic acid in infant formulas. Journal of Pediatrics 1992;120(4 Pt 2):S151‐8. [PUBMED: 1348533] [DOI] [PubMed] [Google Scholar]
- Gibson RA, Makrides M, Clark KJ, Neumann MA, Lines DR. Long chain omega 3 polyunsaturates in formula‐fed term infants. Advances in Experimental Medicine and Biology 1992;318:341‐5. [PUBMED: 1353286] [DOI] [PubMed] [Google Scholar]
Decsi 1995 {published data only}
- Decsi T, Koletzko B. Growth, fatty acid composition of plasma lipid classes, and plasma retinol and alpha‐tocopherol concentrations in full‐term infants fed formula enriched with omega‐6 and omega‐3 long‐chain polyunsaturated fatty acids. Acta Paediatrica 1995;84(7):725‐32. [PUBMED: 7549287] [DOI] [PubMed] [Google Scholar]
- Decsi T, Szasz M, Sarkany I, Botykai A, Berthold K. Effect of long‐chain polyunsaturated fatty acids on arachidonate and docosahexaeonic acid in healthy infants in the first four months of life. Orvosi hetilap 1996;137(38):2089‐92. [PUBMED: 8966026] [PubMed] [Google Scholar]
- Koletzko B, Decsi T, Sawatzki G. Vitamin E status of low birthweight infants fed formula enriched with long‐chain polyunsaturated fatty acids. International Journal for Vitamin and Nutrition Research. Internationale Zeitschrift fur Vitamin‐ und Ernahrungsforschung. Journal International de Vitaminologie et de Nutrition 1995;65(2):101‐4. [PUBMED: 7591527] [PubMed] [Google Scholar]
Decsi 1997 {published data only}
- Decsi T, Burus I, Koletzko B. Effects of dietary long‐chain polyunsaturated fatty acids on plasma amino acids and indices of protein metabolism in infants: results from a randomized clinical trial. Annals of Nutrition & Metabolism 1998;42(4):195‐201. [PUBMED: 9745105] [DOI] [PubMed] [Google Scholar]
- Decsi T, Fekete M, Koletzko B. Plasma lipid and apolipoprotein concentrations in full term infants fed formula supplemented with long‐chain polyunsaturated fatty acids and cholesterol. European Journal of Pediatrics 1997;156(5):397‐400. [PUBMED: 9177986] [DOI] [PubMed] [Google Scholar]
Demmelmair 2001 {published data only}
- Demmelmair H, Feldl F, Horvath I, Niederland T, Ruszinko V, Raederstorff D, et al. Influence of formulas with borage oil or borage oil plus fish oil on the arachidonic acid status in premature infants. Lipids 2001;36(6):555‐66. [PUBMED: 11485158] [DOI] [PubMed] [Google Scholar]
Dotterud 2013 {published data only}
- Dotterud CK, Storro O, Simpson MR, Johnsen R, Oien T. The impact of pre‐ and postnatal exposures on allergy related diseases in childhood: a controlled multicentre intervention study in primary health care. BMC Public Health 2013;13:123. [DOI] [PMC free article] [PubMed] [Google Scholar]
Faldella 1996 {published data only}
- Faldella G, Govoni M, Alessandroni R, Marchiani E, Salvioli GP, Biagi PL, et al. Visual evoked potentials and dietary long chain polyunsaturated fatty acids in preterm infants. Archives of Disease in Childhood. Fetal and Neonatal Edition 1996;75(2):F108‐12. [PUBMED: 8949693] [DOI] [PMC free article] [PubMed] [Google Scholar]
Fang 2005 {published data only}
- Fang PC, Kuo HK, Huang CB, Ko TY, Chen CC, Chung MY. The effect of supplementation of docosahexaenoic acid and arachidonic acid on visual acuity and neurodevelopment in larger preterm infants. Chang Gung Medical Journal 2005;28(10):708‐15. [PUBMED: 16382755] [PubMed] [Google Scholar]
Fewtrell 2002 {published data only}
- Fewtrell MS, Morley R, Abbott RA, Singhal A, Isaacs EB, Stephenson T, et al. Double‐blind, randomized trial of long‐chain polyunsaturated fatty acid supplementation in formula fed to preterm infants. Pediatrics 2002;110(1 Pt 1):73‐82. [PUBMED: 12093949] [DOI] [PubMed] [Google Scholar]
Fidler 2000 {published data only}
- Fidler N, Sauerwald T, Pohl A, Demmelmair H, Koletzko B. Docosahexaenoic acid transfer into human milk after dietary supplementation: a randomized clinical trial. Journal of Lipid Research 2000;41(9):1376‐83. [PubMed] [Google Scholar]
Field 2000 {published data only}
- Field CJ, Thomson CA, Aerde JE, Parrott A, Euler A, Lien E, et al. Lower proportion of CD45R0+ cells and deficient interleukin‐10 production by formula‐fed infants, compared with human‐fed, is corrected with supplementation of long‐chain polyunsaturated fatty acids. Journal of Pediatric Gastroenterology and Nutrition 2000;31(3):291‐9. [PUBMED: 10997375] [DOI] [PubMed] [Google Scholar]
Field 2008 {published data only}
- Field CJ, Aerde JE, Goruk S, Clandinin MT. Effect of feeding a formula supplemented with long‐chain polyunsaturated fatty acids for 14 weeks improves the ex vivo response to a mitogen and reduces the response to a soy protein in infants at low risk for allergy. Journal of Pediatric Gastroenterology and Nutrition 2010;50(6):661‐9. [PUBMED: 20386325] [DOI] [PubMed] [Google Scholar]
- Field CJ, Aerde JE, Robinson LE, Clandinin MT. Effect of providing a formula supplemented with long‐chain polyunsaturated fatty acids on immunity in full‐term neonates. British Journal of Nutrition 2008;99(1):91‐9. [PUBMED: 17640422] [DOI] [PubMed] [Google Scholar]
- Field CJ, Aerde JE, Robinson LE, Clandinin MT. Feeding a formula supplemented with long chain polyunsaturated fatty acids modifies the "ex vivo" cytokine responses to food proteins in infants at low risk for allergy. Pediatric Research 2008;64(4):411‐7. [PUBMED: 18552712] [DOI] [PubMed] [Google Scholar]
Fleddermann 2014 {published data only}
- Fleddermann M, Demmelmair H, Grote V, Nikolic T, Trisic B, Koletzko B. Infant formula composition affects energetic efficiency for growth: the BeMIM study, a randomized controlled trial. Clinical Nutrition 2014;33(4):588‐95. [DOI] [PubMed] [Google Scholar]
Foreman‐van Drongelen 1995 {published data only}
- Foreman‐van Drongelen MM, Houwelingen AC, Kester AD, Jong AE, Blanco CE, Hasaart TH, et al. Long‐chain polyene status of preterm infants with regard to the fatty acid composition of their diet: comparison between absolute and relative fatty acid levels in plasma and erythrocyte phospholipids. British Journal of Nutrition 1995;73(3):405‐22. [PUBMED: 7766564] [DOI] [PubMed] [Google Scholar]
- Foreman‐van Drongelen MM, Houwelingen AC, Kester AD, Blanco CE, Hasaart TH, Hornstra G. Influence of feeding artificial‐formula milks containing docosahexaenoic and arachidonic acids on the postnatal long‐chain polyunsaturated fatty acid status of healthy preterm infants. British Journal of Nutrition 1996;76(5):649‐67. [PUBMED: 8958000] [DOI] [PubMed] [Google Scholar]
Ghebremeskel 1995 {published data only}
- Ghebremeskel K, Leighfield M, Leaf A, Costeloe K, Crawford M. Fatty acid composition of plasma and red cell phospholipids of preterm babies fed on breast milk and formulae. European Journal of Pediatrics 1995;154(1):46‐52. [PUBMED: 7895755] [PubMed] [Google Scholar]
Gibson 1997 {published data only}
- Gibson RA, Neumann MA, Makrides M. Effect of increasing breast milk docosahexaenoic acid on plasma and erythrocyte phospholipid fatty acids and neural indices of exclusively breast fed infants. European Journal of Clinical Nutrition 1997;51(9):578‐84. [DOI] [PubMed] [Google Scholar]
Gibson 2009 {published data only}
- Gibson RA, Barclay D, Marshall H, Moulin J, Maire JC, Makrides M. Safety of supplementing infant formula with long‐chain polyunsaturated fatty acids and Bifidobacterium lactis in term infants: a randomised controlled trial. British Journal of Nutrition 2009;101(11):1706‐13. [DOI] [PubMed] [Google Scholar]
Granot 2011 {published data only}
- Granot E, Jakobovich E, Rabinowitz R, Levy P, Schlesinger M. DHA supplementation during pregnancy and lactation affects infants' cellular but not humoral immune response. Mediators of Inflammation 2011;2011:493925. [PUBMED: 21941411] [DOI] [PMC free article] [PubMed] [Google Scholar]
Groh‐Wargo 2005 {published data only}
- Groh‐Wargo S, Jacobs J, Auestad N, O'Connor DL, Moore JJ, Lerner E. Body composition in preterm infants who are fed long‐chain polyunsaturated fatty acids: a prospective, randomized, controlled trial. Pediatric Research 2005;57(5 Pt 1):712‐8. [PUBMED: 15718356] [DOI] [PubMed] [Google Scholar]
Hauner 2012 {published data only}
- Brunner S, Schmid D, Huttinger K, Much D, Bruderl M, Sedlmeier EM, et al. Effect of reducing the n‐6/n‐3 fatty acid ratio on the maternal and fetal leptin axis in relation to infant body composition. Obesity 2014;22(1):217‐24. [PUBMED: 23596009] [DOI] [PubMed] [Google Scholar]
- Hauner H, Much D, Vollhardt C, Brunner S, Schmid D, Sedlmeier EM, et al. Effect of reducing the n‐6:n‐3 long‐chain PUFA ratio during pregnancy and lactation on infant adipose tissue growth within the first year of life: an open‐label randomized controlled trial. American Journal of Clinical Nutrition 2012;95(2):383‐94. [PUBMED: 22205307] [DOI] [PubMed] [Google Scholar]
- Much D, Brunner S, Vollhardt C, Schmid D, Sedlmeier EM, Bruderl M, et al. Breast milk fatty acid profile in relation to infant growth and body composition: results from the INFAT study. Pediatric Research 2013;74(2):230‐7. [PUBMED: 23715519] [DOI] [PubMed] [Google Scholar]
- Much D, Brunner S, Vollhardt C, Schmid D, Sedlmeier EM, Bruderl M, et al. Effect of dietary intervention to reduce the n‐6/n‐3 fatty acid ratio on maternal and fetal fatty acid profile and its relation to offspring growth and body composition at 1 year of age. European Journal of Clinical Nutrition 2013;67(3):282‐8. [PUBMED: 23340492] [DOI] [PubMed] [Google Scholar]
Hawkes 2001 {published data only}
- Hawkes JS, Bryan DL, Makrides M, Neumann MA, Gibson RA. A randomized trial of supplementation with docosahexaenoic acid‐rich tuna oil and its effects on the human milk cytokines interleukin 1 beta, interleukin 6, and tumor necrosis factor alpha. American Journal of Clinical Nutrition 2002;75(4):754‐60. [PUBMED: 11916764] [DOI] [PubMed] [Google Scholar]
- Hawkes JS, Bryan DL, Neumann MA, Makrides M, Gibson RA. Transforming growth factor beta in human milk does not change in response to modest intakes of docosahexaenoic acid. Lipids 2001;36(10):1179‐81. [PUBMED: 11768164] [DOI] [PubMed] [Google Scholar]
Helland 1998 {published data only}
- Helland IB, Saarem K, Saugstad OD, Drevon CA. Fatty acid composition in maternal milk and plasma during supplementation with cod liver oil. European Journal of Clinical Nutrition 1998;52(11):839‐45. [DOI] [PubMed] [Google Scholar]
Helland 2001 {published data only}
- Helland IB, Saugstad OD, Saarem K, Houwelingen AC, Nylander G, Drevon CA. Supplementation of n‐3 fatty acids during pregnancy and lactation reduces maternal plasma lipid levels and provides DHA to the infants. Journal of Maternal‐fetal & Neonatal Medicine 2006;19(7):397‐406. [PUBMED: 16923694] [DOI] [PubMed] [Google Scholar]
- Helland IB, Saugstad OD, Smith L, Saarem K, Solvoll K, Ganes T, et al. Similar effects on infants of n‐3 and n‐6 fatty acids supplementation to pregnant and lactating women. Pediatrics 2001;108(5):E82. [PUBMED: 11694666] [DOI] [PubMed] [Google Scholar]
- Helland IB, Smith L, Blomen B, Saarem K, Saugstad OD, Drevon CA. Effect of supplementing pregnant and lactating mothers with n‐3 very‐long‐chain fatty acids on children's IQ and body mass index at 7 years of age. Pediatrics 2008;122(2):e472‐9. [PUBMED: 18676533] [DOI] [PubMed] [Google Scholar]
- Helland IB, Smith L, Saarem K, Saugstad OD, Drevon CA. Maternal supplementation with very‐long‐chain n‐3 fatty acids during pregnancy and lactation augments children's IQ at 4 years of age. Pediatrics 2003;111(1):e39‐44. [PUBMED: 12509593] [DOI] [PubMed] [Google Scholar]
Henriksen 2008 {published data only}
- Henriksen C, Haugholt K, Lindgren M, Aurvag AK, Ronnestad A, Gronn M, et al. Improved cognitive development among preterm infants attributable to early supplementation of human milk with docosahexaenoic acid and arachidonic acid. Pediatrics 2008;121(6):1137‐45. [PUBMED: 18519483] [DOI] [PubMed] [Google Scholar]
- Henriksen C, Westerberg AC, Ronnestad A, Nakstad B, Veierod MB, Drevon CA, et al. Growth and nutrient intake among very‐low‐birth‐weight infants fed fortified human milk during hospitalisation. British Journal of Nutrition 2009;102(8):1179‐86. [PUBMED: 19445820] [DOI] [PubMed] [Google Scholar]
- Westerberg AC, Henriksen C, Ellingvag A, Veierod MB, Juliusson PB, Nakstad B, et al. First year growth among very low birth weight infants. Acta Paediatrica 2010;99(4):556‐62. [PUBMED: 20096031] [DOI] [PubMed] [Google Scholar]
- Westerberg AC, Schei R, Henriksen C, Smith L, Veierod MB, Drevon CA, et al. Attention among very low birth weight infants following early supplementation with docosahexaenoic and arachidonic acid. Acta Paediatrica 2011;100(1):47‐52. [PUBMED: 20624152] [DOI] [PubMed] [Google Scholar]
Hoffman 2003 {published data only}
- Drover J, Hoffman DR, Castaneda YS, Morale SE, Birch EE. Three randomized controlled trials of early long‐chain polyunsaturated fatty acid supplementation on means‐end problem solving in 9‐month‐olds. Child Development 2009;80(5):1376‐84. [PUBMED: 19765006] [DOI] [PMC free article] [PubMed] [Google Scholar]
- Hoffman DR, Birch EE, Castaneda YS, Fawcett SL, Wheaton DH, Birch DG, et al. Visual function in breast‐fed term infants weaned to formula with or without long‐chain polyunsaturates at 4 to 6 months: a randomized clinical trial. Journal of Pediatrics 2003;142(6):669‐77. [PUBMED: 12838196] [DOI] [PubMed] [Google Scholar]
- Morale SE, Hoffman DR, Castaneda YS, Wheaton DH, Burns RA, Birch EE. Duration of long‐chain polyunsaturated fatty acids availability in the diet and visual acuity. Early Human Development 2005;81(2):197‐203. [PUBMED: 15748975] [DOI] [PubMed] [Google Scholar]
Hoffman 2004 {published data only}
- Hoffman DR, Theuer RC, Castaneda YS, Wheaton DH, Bosworth RG, O'Connor AR, et al. Maturation of visual acuity is accelerated in breast‐fed term infants fed baby food containing DHA‐enriched egg yolk. Journal of Nutrition 2004;134(9):2307‐13. [PUBMED: 15333721] [DOI] [PubMed] [Google Scholar]
Hoffman 2006 {published data only}
- Hoffman DR, Wheaton DK, James KJ, Tuazon M, Diersen‐Schade DA, Harris CL, et al. Docosahexaenoic acid in red blood cells of term infants receiving two levels of long‐chain polyunsaturated fatty acids. Journal of Pediatric Gastroenterology and Nutrition 2006;42(3):287‐92. [PUBMED: 16540798] [DOI] [PubMed] [Google Scholar]
Horby Jorgensen 1998 {published data only}
- Horby Jorgensen M, Holmer G, Lund P, Hernell O, Michaelsen KF. Effect of formula supplemented with docosahexaenoic acid and gamma‐linolenic acid on fatty acid status and visual acuity in term infants. Journal of Pediatric Gastroenterology and Nutrition 1998;26(4):412‐21. [PUBMED: 9552137] [DOI] [PubMed] [Google Scholar]
Innis 1996 {published data only}
- Innis SM, Auestad N, Siegman JS. Blood lipid docosahexaenoic and arachidonic acid in term gestation infants fed formulas with high docosahexaenoic acid, low eicosapentaenoic acid fish oil. Lipids 1996;31(6):617‐25. [PUBMED: 8784742] [DOI] [PubMed] [Google Scholar]
Innis 2002 {published data only}
- Innis SM, Adamkin DH, Hall RT, Kalhan SC, Lair C, Lim M, et al. Docosahexaenoic acid and arachidonic acid enhance growth with no adverse effects in preterm infants fed formula. Journal of Pediatrics 2002;140(5):547‐54. [PUBMED: 12032520] [DOI] [PubMed] [Google Scholar]
Jensen 1996 {published data only}
- Jensen CL, Chen H, Fraley JK, Anderson RE, Heird WC. Biochemical effects of dietary linoleic/alpha‐linolenic acid ratio in term infants. Lipids 1996;31(1):107‐13. [PUBMED: 8649227] [DOI] [PubMed] [Google Scholar]
- Jensen CL, Prager TC, Fraley JK, Chen H, Anderson RE, Heird WC. Effect of dietary linoleic/alpha‐linolenic acid ratio on growth and visual function of term infants. Journal of Pediatrics 1997;131(2):200‐9. [PUBMED: 9290604] [DOI] [PubMed] [Google Scholar]
- Voigt RG, Jensen CL, Fraley JK, Rozelle JC, Brown FR 3rd, Heird WC. Relationship between omega3 long‐chain polyunsaturated fatty acid status during early infancy and neurodevelopmental status at 1 year of age. Journal of Human Nutrition and Dietetics 2002;15(2):111‐20. [PUBMED: 11972740] [DOI] [PubMed] [Google Scholar]
Jensen 2000 {published data only}
- Jensen CL, Maude M, Anderson RE, Heird WC. Effect of docosahexaenoic acid supplementation of lactating women on the fatty acid composition of breast milk lipids and maternal and infant plasma phospholipids. American Journal of Clinical Nutrition 2000;71(1 Suppl):292S‐9S. [PUBMED: 10617985] [DOI] [PubMed] [Google Scholar]
Kaempf‐Rotzoll 2003 {published data only}
- Kaempf‐Rotzoll DE, Hellstern G, Linderkamp O. Influence of long‐chain polyunsaturated fatty acid formula feeds on vitamin E status in preterm infants. International Journal for Vitamin and Nutrition Research 2003;73(5):377‐87. [PUBMED: 14639802] [DOI] [PubMed] [Google Scholar]
Kohn 1994 {published data only}
- Kohn G, Sawatzki G, Biervliet JP, Rosseneu M. Diet and the essential fatty acid status of term infants. Acta Paediatrica Supplement 1994;402:69‐74. [PUBMED: 7841626] [DOI] [PubMed] [Google Scholar]
Koletzko 1989 {published data only}
- Koletzko B, Schmidt E, Bremer HJ, Haug M, Harzer G. Effects of dietary long‐chain polyunsaturated fatty acids on the essential fatty acid status of premature infants. European Journal of Pediatrics 1989;148(7):669‐75. [DOI] [PubMed] [Google Scholar]
Koletzko 1995 {published data only}
- Koletzko B, Edenhofer S, Lipowsky G, Reinhardt D. Effects of a low birthweight infant formula containing human milk levels of docosahexaenoic and arachidonic acids. Journal of Pediatric Gastroenterology and Nutrition 1995;21(2):200‐8. [DOI] [PubMed] [Google Scholar]
Koletzko 2003 {published data only}
- Koletzko B, Sauerwald U, Keicher U, Saule H, Wawatschek S, Bohles H, et al. Fatty acid profiles, antioxidant status, and growth of preterm infants fed diets without or with long‐chain polyunsaturated fatty acids. A randomized clinical trial. European Journal of Nutrition 2003;42(5):243‐53. [PUBMED: 14569405] [DOI] [PubMed] [Google Scholar]
Lapillonne 2000a {published data only}
- Lapillonne A, Brossard N, Claris O, Reygrobellet B, Salle BL. Erythrocyte fatty acid composition in term infants fed human milk or a formula enriched with a low eicosapentanoic acid fish oil for 4 months. European Journal of Pediatrics 2000;159(1‐2):49‐53. [PUBMED: 10653329] [DOI] [PubMed] [Google Scholar]
Lapillonne 2000b {published data only}
- Lapillonne A, Picaud JC, Chirouze V, Goudable J, Reygrobellet B, Claris O, et al. The use of low‐EPA fish oil for long‐chain polyunsaturated fatty acid supplementation of preterm infants. Pediatric Research 2000;48(6):835‐41. [PUBMED: 11102555] [DOI] [PubMed] [Google Scholar]
Leite 2013 {published data only}
- Leite M E, Lasekan J, Baggs G, Ribeiro T, Menezes‐Filho J, Pontes M, et al. Calcium and fat metabolic balance, and gastrointestinal tolerance in term infants fed milk‐based formulas with and without palm olein and palm kernel oils: a randomized blinded crossover study. BMC Pediatrics 2013;13:215. [DOI] [PMC free article] [PubMed] [Google Scholar]
Liu 1987 {published data only}
- Carlson SE, Cooke RJ, Rhodes PG, Peeples JM, Werkman SH. Effect of vegetable and marine oils in preterm infant formulas on blood arachidonic and docosahexaenoic acids. Journal of Pediatrics 1992;120(4 Pt 2):S159‐67. [DOI] [PubMed] [Google Scholar]
- Liu CC, Carlson SE, Rhodes PG, Rao VS, Meydrech EF. Increase in plasma phospholipid docosahexaenoic and eicosapentaenoic acids as a reflection of their intake and mode of administration. Pediatric Research 1987;22(3):292‐6. [DOI] [PubMed] [Google Scholar]
Llorente 2003 {published data only}
- Jensen CL, Voigt RG, Prager TC, Zou YL, Fraley JK, Rozelle JC, et al. Effects of maternal docosahexaenoic acid intake on visual function and neurodevelopment in breastfed term infants. American Journal of Clinical Nutrition 2005;82(1):125‐32. [PUBMED: 16002810] [DOI] [PubMed] [Google Scholar]
- Llorente AM, Jensen CL, Voigt RG, Fraley JK, Berretta MC, Heird WC. Effect of maternal docosahexaenoic acid supplementation on postpartum depression and information processing. American Journal of Obstetrics and Gynecology 2003;188(5):1348‐53. [PUBMED: 12748510] [DOI] [PubMed] [Google Scholar]
Lopez‐Alarcon 2006 {published data only}
- Lopez‐Alarcon M, Bernabe‐Garcia M, Prado M, Rivera D, Ruiz G, Maldonado J, et al. Docosahexaenoic acid administered in the acute phase protects the nutritional status of septic neonates. Nutrition 2006;22(7‐8):731‐7. [DOI] [PubMed] [Google Scholar]
- Lopez‐Alarcon M, Bernabe‐Garcia M, Valle O, Gonzalez‐Moreno G, Martinez‐Basilea A, Villegas R. Oral administration of docosahexaenoic acid attenuates interleukin‐1beta response and clinical course of septic neonates. Nutrition 2012;28(4):384‐90. [DOI] [PubMed] [Google Scholar]
Lucia Bergmann 2007 {published data only}
- Lucia Bergmann R, Bergmann KE, Haschke‐Becher E, Richter R, Dudenhausen JW, Barclay D, et al. Does maternal docosahexaenoic acid supplementation during pregnancy and lactation lower BMI in late infancy?. Journal of Perinatal Medicine 2007;35(4):295‐300. [PUBMED: 17547539] [DOI] [PubMed] [Google Scholar]
Makrides 1995 {published data only}
- Makrides M, Neumann M, Simmer K, Pater J, Gibson R. Are long‐chain polyunsaturated fatty acids essential nutrients in infancy?. Lancet 1995;345(8963):1463‐8. [PUBMED: 7769900] [DOI] [PubMed] [Google Scholar]
- Makrides M, Neumann MA, Simmer K, Gibson RA. Erythrocyte fatty acids of term infants fed either breast milk, standard formula, or formula supplemented with long‐chain polyunsaturates. Lipids 1995;30(10):941‐8. [PUBMED: 8538382] [DOI] [PubMed] [Google Scholar]
Makrides 1999 {published data only}
- Makrides M, Neumann MA, Simmer K, Gibson RA. A critical appraisal of the role of dietary long‐chain polyunsaturated fatty acids on neural indices of term infants: a randomized, controlled trial. Pediatrics 2000;105(1 Pt 1):32‐8. [PUBMED: 10617701] [DOI] [PubMed] [Google Scholar]
- Makrides M, Neumann MA, Simmer K, Gibson RA. Dietary long‐chain polyunsaturated fatty acids do not influence growth of term infants: a randomized clinical trial. Pediatrics 1999;104(3 Pt 1):468‐75. [PUBMED: 10469771] [DOI] [PubMed] [Google Scholar]
Makrides 2000 {published data only}
- Makrides M, Neumann MA, Jeffrey B, Lien EL, Gibson RA. A randomized trial of different ratios of linoleic to alpha‐linolenic acid in the diet of term infants: effects on visual function and growth. American Journal of Clinical Nutrition 2000;71(1):120‐9. [PUBMED: 10617956] [DOI] [PubMed] [Google Scholar]
Martinez 2002 {published data only}
- Martinez FE, Sieber VM, Jorge SM, Ferlin ML, Mussi‐Pinhata MM. Effect of supplementation of preterm formula with long chain polyunsaturated fatty acids on mineral balance in preterm infants. Journal of Pediatric Gastroenterology & Nutrition 2002;35(4):503‐7. [PUBMED: 12394374] [DOI] [PubMed] [Google Scholar]
Maurage 1998 {published data only}
- Guesnet P, Pugo‐Gunsam P, Maurage C, Pinault M, Giraudeau B, Alessandri JM, et al. Blood lipid concentrations of docosahexaenoic and arachidonic acids at birth determine their relative postnatal changes in term infants fed breast milk or formula. American Journal of Clinical Nutrition 1999;70(2):292‐8. [PUBMED: 10426708] [DOI] [PubMed] [Google Scholar]
- Maurage C, Guesnet P, Pinault M, Rochette de Lempdes J, Durand G, Antoine J, et al. Effect of two types of fish oil supplementation on plasma and erythrocyte phospholipids in formula‐fed term infants. Biology of the Neonate 1998;74(6):416‐29. [PUBMED: 9784633] [DOI] [PubMed] [Google Scholar]
Mize 1995 {published data only}
- Mize CE, Uauy R, Kramer R, Benser M, Allen S, Grundy SM. Lipoprotein‐cholesterol responses in healthy infants fed defined diets from ages 1 to 12 months: comparison of diets predominant in oleic acid versus linoleic acid, with parallel observations in infants fed a human milk‐based diet. Journal of Lipid Research 1995;36(6):1178‐87. [PUBMED: 7665996] [PubMed] [Google Scholar]
Moltu 2013 {published data only}
- Moltu SJ, Blakstad EW, Strommen K, Almaas AN, Nakstad B, Ronnestad A, et al. Enhanced feeding and diminished postnatal growth failure in very‐low‐birth‐weight infants. Journal of Pediatric Gastroenterology and Nutrition 2014;58:344‐51. [DOI] [PMC free article] [PubMed] [Google Scholar]
- Moltu SJ, Sachse D, Blakstad EW, Strommen K, Nakstad B, Almaas AN, et al. Urinary metabolite profiles in premature infants show early postnatal metabolic adaptation and maturation. Nutrients 2014;6:1913‐30. [DOI] [PMC free article] [PubMed] [Google Scholar]
- Moltu SJ, Strommen K, Blakstad EW, Almaas AN, Westerberg AC, Braekke K, et al. Enhanced feeding in very‐low‐birth‐weight infants may cause electrolyte disturbances and septicemia ‐ a randomized, controlled trial. Clinical Nutrition 2013;32:207‐12. [DOI] [PubMed] [Google Scholar]
- Strommen K, Blakstad EW, Moltu SJ, Almaas AN, Westerberg AC, Amlien IK, et al. Enhanced nutrient supply to very low birth weight infants is associated with improved white matter maturation and head growth. Neonatology 2015;107:68‐75. [DOI] [PubMed] [Google Scholar]
Morgan 1998a {published data only}
- Morgan C, Stammers J, Colley J, Spencer S A, Hull D. Fatty acid balance studies in preterm infants fed formula milk containing long‐chain polyunsaturated fatty acids (LCP) II. Acta Paediatrica 1998;87:318‐24. [DOI] [PubMed] [Google Scholar]
Morgan 1998b {published data only}
- Morgan C, Davies L, Corcoran F, Stammers J, Colley J, Spencer SA, et al. Fatty acid balance studies in term infants fed formula milk containing long‐chain polyunsaturated fatty acids. Acta Paediatrica 1998;87:136‐42. [DOI] [PubMed] [Google Scholar]
Moya 2001 {published data only}
- Moya M, Cortes E, Juste M, Dios JG, Vera A. Fatty acid absorption in preterms on formulas with and without long‐chain polyunsaturated fatty acids and in terms on formulas without these added. European Journal of Clinical Nutrition 2001;55:755‐62. [DOI] [PubMed] [Google Scholar]
Ponder 1992 {published data only}
- Ponder DL, Innis SM, Benson JD, Siegman JS. Docosahexaenoic acid status of term infants fed breast milk or infant formula containing soy oil or corn oil. Pediatric Research 1992;32(6):683‐8. [PUBMED: 1287559] [DOI] [PubMed] [Google Scholar]
Ramirez 2001 {published data only}
- Ramirez M, Gallardo EM, Souto AS, Weissheimer C, Gil A. Plasma fatty‐acid composition and antioxidant capacity in low birth‐weight infants fed formula enriched with n‐6 and n‐3 long‐chain polyunsaturated fatty acids from purified phospholipids. Clinical Nutrition 2001;20(1):69‐76. [PUBMED: 11161546] [DOI] [PubMed] [Google Scholar]
Rodriguez 2003 {published data only}
- Rodriguez M, Funke S, Fink M, Demmelmair H, Turini M, Crozier G, et al. Plasma fatty acids and [13C]linoleic acid metabolism in preterm infants fed a formula with medium‐chain triglycerides. Journal of Lipid Research 2003;44:41‐8. [DOI] [PubMed] [Google Scholar]
Ryan 1999 {published data only}
- Ryan AS, Montalto MB, Groh‐Wargo S, Mimouni F, Sentipal‐Walerius J, Doyle J, et al. Effect of DHA‐containing formula on growth of preterm infants to 59 weeks postmenstrual age. American Journal of Human Biology 1999;11(4):457‐67. [PUBMED: 11533965] [DOI] [PubMed] [Google Scholar]
Sauerwald 2012 {published data only}
- Sauerwald UC, Fink MM, Demmelmair H, Schoenaich PV, Rauh‐Pfeiffer AA, Koletzko B. Effect of different levels of docosahexaenoic acid supply on fatty acid status and linoleic and alpha‐linolenic acid conversion in preterm infants. Journal of Pediatric Gastroenterology & Nutrition 2012;54(3):353‐63. [PUBMED: 22008957] [DOI] [PubMed] [Google Scholar]
Schwartz 2009 {published data only}
- Schwartz J, Drossard C, Dube K, Kannenberg F, Kunz C, Kalhoff H, et al. Dietary intake and plasma concentrations of PUFA and LC‐PUFA in breastfed and formula fed infants under real‐life conditions. European Journal of Nutrition 2010;49(3):189‐95. [PUBMED: 19851802] [DOI] [PubMed] [Google Scholar]
- Schwartz J, Dube K, Alexy U, Kalhoff H, Kersting M. PUFA and LC‐PUFA intake during the first year of life: can dietary practice achieve a guideline diet?. European Journal of Clinical Nutrition 2010;64(2):124‐30. [PUBMED: 19935821] [DOI] [PubMed] [Google Scholar]
- Schwartz J, Dube K, Sichert‐Hellert W, Kannenberg F, Kunz C, Kalhoff H, et al. Modification of dietary polyunsaturated fatty acids via complementary food enhances n‐3 long‐chain polyunsaturated fatty acid synthesis in healthy infants: a double blinded randomised controlled trial. Archives of Disease in Childhood 2009;94(11):876‐82. [PUBMED: 19193660] [DOI] [PubMed] [Google Scholar]
Siahanidou 2007 {published data only}
- Siahanidou T, Lazaropoulou C, Michalakakou K, Papassotiriou I, Bacoula C, Mandyla H. Oxidative stress in preterm infants fed a formula containing long‐chain polyunsaturated fatty acids (LCPUFA). American Journal of Perinatology 2007;24(8):475‐9. [PUBMED: 17992715] [DOI] [PubMed] [Google Scholar]
- Siahanidou T, Margeli A, Kappis A, Papassotiriou I, Mandyla H. Circulating visfatin levels in healthy preterm infants are independently associated with high‐density lipoprotein cholesterol levels and dietary long‐chain polyunsaturated fatty acids. Metabolism 2011;60(3):389‐93. [PUBMED: 20359723] [DOI] [PubMed] [Google Scholar]
- Siahanidou T, Margeli A, Lazaropoulou C, Karavitakis E, Papassotiriou I, Mandyla H. Circulating adiponectin in preterm infants fed long‐chain polyunsaturated fatty acids (LCPUFA)‐supplemented formula ‐ a randomized controlled study. Pediatric Research 2008;63(4):428‐32. [PUBMED: 18356752] [DOI] [PubMed] [Google Scholar]
Smit 2000a {published data only}
- Smit EN, Oelen EA, Seerat E, Boersma ER, Muskiet FA. Fish oil supplementation improves docosahexaenoic acid status of malnourished infants. Archives of Disease in Childhood 2000;82(5):366‐9. [PUBMED: 10799425] [DOI] [PMC free article] [PubMed] [Google Scholar]
Smit 2000b {published data only}
- Smit EN, Koopmann M, Boersma ER, Muskiet FA. Effect of supplementation of arachidonic acid (AA) or a combination of AA plus docosahexaenoic acid on breastmilk fatty acid composition. Prostaglandins, Leukotrienes, and Essential Fatty Acids 2000;62:335‐40. [DOI] [PubMed] [Google Scholar]
Socha 2002 {published data only}
- Socha P, Koletzko B, Jankowska I, Pawlowska J, Demmelmair H, Stolarczyk A, et al. Long‐chain PUFA supplementation improves PUFA profile in infants with cholestasis. Lipids 2002;37:953‐7. [DOI] [PubMed] [Google Scholar]
Stier 1997 {published data only}
- Stier C, Hess M, Watzer B, Schweer H, Seyberth H W, Leonhardt A. Prostanoid formation during feeding of a preterm formula with long‐chain polyunsaturated fatty acids in healthy preterm infants during the first weeks of life. Pediatric Research 1997;42:509‐13. [DOI] [PubMed] [Google Scholar]
Uauy 1990 {published data only}
- Hoffman DR, Uauy R. Essentiality of dietary omega 3 fatty acids for premature infants: plasma and red blood cell fatty acid composition. Lipids 1992;27(11):886‐95. [PUBMED: 1362792] [DOI] [PubMed] [Google Scholar]
- Uauy R, Hoffman DR, Birch EE, Birch DG, Jameson DM, Tyson J. Safety and efficacy of omega‐3 fatty acids in the nutrition of very low birth weight infants: soy oil and marine oil supplementation of formula. Journal of Pediatrics 1994;124(4):612‐20. [PUBMED: 7908693] [DOI] [PubMed] [Google Scholar]
- Uauy RD, Birch DG, Birch EE, Tyson JE, Hoffman DR. Effect of dietary omega‐3 fatty acids on retinal function of very‐low‐birth‐weight neonates. Pediatric Research 1990;28(5):485‐92. [PUBMED: 2255573] [DOI] [PubMed] [Google Scholar]
- Uauy‐Dagach R, Mena P, Hoffman DR. Essential fatty acid metabolism and requirements for LBW infants. Acta Paediatrica Supplement 1994;405:78‐85. [PUBMED: 7734797] [DOI] [PubMed] [Google Scholar]
Unay 2004 {published data only}
- Unay B, Sarici SU, Ulas UH, Akin R, Alpay F, Gokcay E. Nutritional effects on auditory brainstem maturation in healthy term infants. Archives of Disease in Childhood Fetal & Neonatal Edition 2004;89(2):F177‐9. [PUBMED: 14977907] [DOI] [PMC free article] [PubMed] [Google Scholar]
Van Biervliet 1986 {published data only}
- Biervliet JP, Rosseneu M, Caster H. Influence of dietary factors on the plasma lipoprotein composition and content in neonates. European Journal of Pediatrics 1986;144(5):489‐93. [PUBMED: 3456892] [DOI] [PubMed] [Google Scholar]
Van Biervliet 1992 {published data only}
- Biervliet JP, Vinaimont N, Vercaemst R, Rosseneu M. Serum cholesterol, cholesteryl ester, and high‐density lipoprotein development in newborn infants: response to formulas supplemented with cholesterol and gamma‐linolenic acid. Journal of Pediatrics 1992;120(4 Pt 2):S101‐8. [PUBMED: 1313864] [DOI] [PubMed] [Google Scholar]
Vanderhoof 1999 {published data only}
- Vanderhoof J, Gross S, Hegyi T. A multicenter long‐term safety and efficacy trial of preterm formula supplemented with long‐chain polyunsaturated fatty acids. Journal of Pediatric Gastroenterology and Nutrition 2000;31(2):121‐7. [PUBMED: 10941962] [DOI] [PubMed] [Google Scholar]
- Vanderhoof J, Gross S, Hegyi T, Clandinin T, Porcelli P, DeCristofaro J, et al. Evaluation of a long‐chain polyunsaturated fatty acid supplemented formula on growth, tolerance, and plasma lipids in preterm infants up to 48 weeks postconceptional age. Journal of Pediatric Gastroenterology & Nutrition 1999;29(3):318‐26. [PUBMED: 10467999] [DOI] [PubMed] [Google Scholar]
van der Merwe 2013 {published data only}
- Merwe LF, Moore SE, Fulford AJ, Halliday KE, Drammeh S, Young S, et al. Long‐chain PUFA supplementation in rural African infants: a randomized controlled trial of effects on gut integrity, growth, and cognitive development. American Journal of Clinical Nutrition 2013;97(1):45‐57. [PUBMED: 23221579] [DOI] [PMC free article] [PubMed] [Google Scholar]
van Goor 2009 {published data only}
- Doornbos B, Goor SA, Dijck‐Brouwer DA, Schaafsma A, Korf J, Muskiet FA. Supplementation of a low dose of DHA or DHA+AA does not prevent peripartum depressive symptoms in a small population based sample. Progress in Neuro‐psychopharmacology & Biological Psychiatry 2009;33(1):49‐52. [PUBMED: 18955102] [DOI] [PubMed] [Google Scholar]
- Goor SA, Dijck‐Brouwer DA, Doornbos B, Erwich JJ, Schaafsma A, Muskiet FA, et al. Supplementation of DHA but not DHA with arachidonic acid during pregnancy and lactation influences general movement quality in 12‐week‐old term infants. British Journal of Nutrition 2010;103(2):235‐42. [PUBMED: 19703327] [DOI] [PubMed] [Google Scholar]
- Goor SA, Dijck‐Brouwer DA, Erwich JJ, Schaafsma A, Hadders‐Algra M. The influence of supplemental docosahexaenoic and arachidonic acids during pregnancy and lactation on neurodevelopment at eighteen months. Prostaglandins, Leukotrienes, and Essential Fatty Acids 2011;84(5‐6):139‐46. [PUBMED: 21316208] [DOI] [PubMed] [Google Scholar]
- Goor SA, Dijck‐Brouwer DA, Hadders‐Algra M, Doornbos B, Erwich JJ, Schaafsma A, et al. Human milk arachidonic acid and docosahexaenoic acid contents increase following supplementation during pregnancy and lactation. Prostaglandins, Leukotrienes, and Essential Fatty Acids 2009;80(1):65‐9. [PUBMED: 19118992] [DOI] [PubMed] [Google Scholar]
van Wezel‐Meijler 2002 {published data only}
- Wezel‐Meijler G, Knaap MS, Huisman J, Jonkman EJ, Valk J, Lafeber HN. Dietary supplementation of long‐chain polyunsaturated fatty acids in preterm infants: effects on cerebral maturation. Acta Paediatrica 2002;91(9):942‐50. [PUBMED: 12412870] [DOI] [PubMed] [Google Scholar]
Weizman 1998 {published data only}
- Weizman Z, Brutman E, Leader D, Zegerman C. Evaluation of a local infant formula enriched with polyunsaturated fatty acids produced in Israel. Harefuah 1998;134(9):686‐90, 751. [PUBMED: 10909613] [PubMed] [Google Scholar]
Yang 2013 {published data only}
- Yang Q, Ayers K, Chen Y, Helderman J, Welch CD, O'Shea TM. Early enteral fat supplement and fish oil increases fat absorption in the premature infant with an enterostomy. Journal of Pediatrics 2013;163(2):429‐34. [PUBMED: 23453547] [DOI] [PubMed] [Google Scholar]
- Yang Q, Ayers K, Welch CD, O'Shea TM. Randomized controlled trial of early enteral fat supplement and fish oil to promote intestinal adaptation in premature infants with an enterostomy. Journal of Pediatrics 2014;165(2):274‐9.e1. [PUBMED: 24630347] [DOI] [PubMed] [Google Scholar]
References to ongoing studies
Caplan 2013 {unpublished data only}
- Caplan M. PUFA supplementation in premature infants. clinicaltrials.gov/ct2/show/NCT01955044 (accessed 30 august 2016).
Collins 2012 {unpublished data only}
- Collins C. Can omega 3 fatty acids improve respiratory outcomes in preterm infants?. www.anzctr.org.au/Trial/Registration/TrialReview.aspx?id=362028 (accessed 30 August 2016).
Gianni 2012 {unpublished data only}
- Gianni ML, Roggero P, Baudry C, Ligneul A, Morniroli D, Garbarino F, et al. The influence of a formula supplemented with dairy lipids and plant oils on the erythrocyte membrane omega‐3 fatty acid profile in healthy full‐term infants: a double‐blind randomized controlled trial. BMC Pediatrics 2012;12:164. [DOI] [PMC free article] [PubMed] [Google Scholar]
Liu 2013 {unpublished data only}
- Liu Z, Yin H, Liu B. The effects of polyunsaturated fatty acids (PUFA) on allergic/atopic dermatitis. clinicaltrials.gov/ct2/show/NCT01936194 (accessed 30 August 2016).
Millett 2010 {unpublished data only}
- Millett V. Effect of docosahexaenoic acid (DHA)‐enriched human milk in premature newborns (DHARMA). clinicaltrials.gov/ct2/show/NCT01062373 (accessed 30 August 2016).
Additional references
Ait‐Khaled 2009
- Ait‐Khaled N, Pearce N, Anderson HR, Ellwood P, Montefort S, Shah J, International Study of Asthma and Allergies in Childhood Phase Three Study Group. Global map of the prevalence of symptoms of rhinoconjunctivitis in children: the International Study of Asthma and Allergies in Childhood (ISAAC) Phase Three. Allergy 2009;64(1):123‐48. [DOI] [PubMed] [Google Scholar]
Anandan 2009
- Anandan C, Nurmatov U, Sheikh A. Omega 3 and 6 oils for primary prevention of allergic disease: systematic review and meta‐analysis. Allergy 2009;64(6):840‐8. [DOI] [PubMed] [Google Scholar]
Arshad 1993
- Arshad SH, Stevens M, Hide DW. The effect of genetic and environmental factors on the prevalence of allergic disorders at the age of two years. Clinical and Experimental Allergy 1993;23(6):504‐11. [DOI] [PubMed] [Google Scholar]
ASCIA 2007
- Access Economics Pty Limited. The economic impact of allergic disease in Australia: not to be sneezed at, 2007. apo.org.au/research/economic‐impact‐allergic‐disease‐australia‐not‐be‐sneezed (accessed 27 July 2012).
Bays 2007
- Bays HE. Safety considerations with omega‐3 fatty acid therapy. American Journal of Cardiology 2007;99(6A):35C‐43C. [DOI] [PubMed] [Google Scholar]
Calder 2006
- Calder PC. n‐3 polyunsaturated fatty acids, inflammation, and inflammatory diseases. American Journal of Clinical Nutrition 2006;83(6 Suppl):1505S‐19S. [DOI] [PubMed] [Google Scholar]
Chan‐Yeung 2000
- Chan‐Yeung M, Manfreda J, Dimich‐Ward H, Ferguson A, Warson W, Becker A. A randomized controlled study on the effectiveness of a multifaceted intervention program in the primary prevention of asthma in high‐risk infants. Archives of Pediatrics and Adolescent Medicine 2000;154(7):657‐63. [DOI] [PubMed] [Google Scholar]
D'Auria 2014
- D'Auria E, Miraglia Del Giudice M, Barberi S, Mandelli M, Verduci E, Leonardi S, et al. Omega‐3 fatty acids and asthma in children. Allergy and Asthma Proceedings 2014;35(3):233‐40. [DOI] [PubMed] [Google Scholar]
Deckelbaum 2006
- Deckelbaum RJ, Worgall TS, Seo T. n‐3 Fatty acids and gene expression. American Journal of Clinical Nutrition 2006;83(6 Suppl):1520S‐5S. [DOI] [PubMed] [Google Scholar]
Falth‐Magnussen 1992
- Falth‐Magnusson K, Kjellman NI. Allergy prevention by maternal elimination diet during late pregnancy ‐ a 5‐year follow‐up of a randomized study. Journal of Allergy and Clinical Immunology 1992;89(3):709‐13. [DOI] [PubMed] [Google Scholar]
FNB:IOM 2005
- Food and Nutrition Board: Institute of Medicine. Dietary Reference Intakes for Energy, Carbohydrate, Fiber, Fat, Fatty Acids, Cholesterol, Protein and Amino Acids (Macronutrients). Washington, DC: National Academies Press, 2005. [Google Scholar]
Foolad 2013
- Foolad N, Brezinski EA, Chase EP, Armstrong AW. Effect of nutrient supplementation on atopic dermatitis in children: a systematic review of probiotics, prebiotics, formula, and fatty acids. JAMA 2013;149(3):350‐5. [DOI] [PubMed] [Google Scholar]
Gdalevich 2001a
- Gdalevich M, Mimouni D, David M, Mimouni M. Breast‐feeding and the onset of atopic dermatitis in childhood: a systematic review and meta‐analysis of prospective studies. Journal of the American Academy of Dermatology 2001;45(4):520‐7. [DOI] [PubMed] [Google Scholar]
Gdalevich 2001b
- Gdalevich M, Mimouni D, Mimouni M. Breast‐feeding and the risk of bronchial asthma in childhood: a systematic review with meta‐analysis of prospective studies. Journal of Pediatrics 2001;139(2):261‐6. [DOI] [PubMed] [Google Scholar]
Goldberg 2007
- Goldberg RJ, Katz J. A meta‐analysis of the analgesic effects of omega‐3 polyunsaturated fatty acid supplementation for inflammatory joint pain. Pain 2007;129(1‐2):210‐23. [DOI] [PubMed] [Google Scholar]
GRADEpro 2008 [Computer program]
- Brozek J, Oxman A, Schünemann H. GRADEpro. Version 3.2 for Windows. The GRADE Working Group, 2008.
Gunaratne 2015
- Gunaratne A, Makrides M, Collins C. Maternal prenatal and/or postnatal n‐3 long chain polyunsaturated fatty acids (LCPUFA) supplementation for preventing allergies in early childhood. Cochrane Database of Systematic Reviews 2015, Issue 7. [DOI: 10.1002/14651858.CD010085.pub2] [DOI] [PMC free article] [PubMed] [Google Scholar]
Gupta 2004
- Gupta R, Sheikh A, Strachan DP, Anderson HR. Burden of allergic disease in the UK: secondary analyses of national databases. Clinical and Experimental Allergy 2004;34(4):520‐6. [DOI] [PubMed] [Google Scholar]
Hanifin 1980
- Hanifin JM, Rajka G. Diagnostic features of atopic dermatitis. Acta Dermato‐venereologica. Supplementum 1980;92:44‐7. [Google Scholar]
Hesselmar 2010
- Hesselmar B, Saalman R, Rudin A, Adlerberth I, Wold A. Early fish introduction is associated with less eczema, but not sensitization, in infants. Acta Paediatrica 2010;99(12):1861‐7. [DOI] [PubMed] [Google Scholar]
Higgins 2011
- Higgins JPT, Green S (editors). Cochrane Handbook for Systematic Reviews of Interventions Version 5.1.0. [updated March 2011]. The Cochrane Collaboration, 2011. Available from www.cochrane‐handbook.org.
Hoppu 2000
- Hoppu U, Kalliomaki M, Isolauri E. Maternal diet rich in saturated fat during breastfeeding is associated with atopic sensitization of the infant. European Journal of Clinical Nutrition 2000;54(9):702‐5. [DOI] [PubMed] [Google Scholar]
Johansson 2004
- Johansson SG, Bieber T, Dahl R, Friedmann PS, Lanier BQ, Lockey RF, et al. Revised nomenclature for allergy for global use: report of the Nomenclature Review Committee of the World Allergy Organization, October 2003. Journal of Allergy and Clinical Immunology 2004;113(5):832‐6. [DOI] [PubMed] [Google Scholar]
Kjellman 1977
- Kjellman NI. Atopic disease in seven‐year‐old children. Incidence in relation to family history. Acta Paediatrica Scandinavica 1997;66(4):465‐71. [DOI] [PubMed] [Google Scholar]
Klemens 2011
- Klemens CM, Berman DR, Mozurkewich EL. The effect of perinatal omega‐3 fatty acid supplementation on inflammatory markers and allergic diseases: a systematic review. BJOG 2011;118(8):916‐25. [DOI] [PubMed] [Google Scholar]
Koletzko 2014
- Koletzko B, Boey CC, Campoy C, Carlson SE, Chang N, Guillermo‐Tuazon MA, et al. Current information and Asian perspectives on long‐chain polyunsaturated fatty acids in pregnancy, lactation, and infancy: systematic review and practice recommendations from an early nutrition workshop. Annals of Nutrition & Metabolism 2014;65(1):49‐80. [DOI] [PubMed] [Google Scholar]
Kremmyda 2011
- Kremmyda LS, Vlachava M, Noakes PS, Diaper ND, Miles EA, Calder PC. Atopy risk in infants and children in relation to early exposure to fish, oily fish, or long‐chain omega‐3 fatty acids: a systematic review. Clinical Reviews in Allergy & Immunology 2011;41(1):36‐66. [DOI] [PubMed] [Google Scholar]
Kromann 1980
- Kromann N, Green A. Epidemiological studies in the Upernavik district, Greenland. Incidence of some chronic diseases 1950‐1974. Acta Medica Scandinavica 1980;208(5):401‐6. [PubMed] [Google Scholar]
Kull 2006
- Kull I, Bergstrom A, Lilja G, Pershagen G, Wickman M. Fish consumption during the first year of life and development of allergic diseases during childhood. Allergy 2006;61(8):1009‐15. [DOI] [PubMed] [Google Scholar]
Lai 2009
- Lai CK, Beasley R, Crane J, Foliaki S, Shah J, Weiland S, International Study of Asthma and Allergies in Childhood Phase Three Study Group. Global variation in the prevalence and severity of asthma symptoms: Phase Three of the International Study of Asthma and Allergies in Childhood (ISAAC). Thorax 2009;64(6):476‐83. [DOI] [PubMed] [Google Scholar]
Lewin 2005
- Lewin GA, Schachter HM, Yuen D, Merchant P, Mamaladze V, Tsertsvadze A. Effects of omega‐3 fatty acids on child and maternal health. Evidence Report/technology Assessment (Summary) 2005;118:1‐11. [PMC free article] [PubMed] [Google Scholar]
Lilja 1989
- Lilja G, Dannaeus A, Foucard T, Graff‐Lonnevig V, Johansson SG, Oman H. Effects of maternal diet during late pregnancy and lactation on the development of atopic diseases in infants up to 18 months of age‐ in‐vivo results. Clinical and Experimental Allergy 1989;19(4):473‐9. [DOI] [PubMed] [Google Scholar]
Mimouni Bloch 2002
- Mimouni Bloch A, Mimouni D, Mimouni M, Gdalevich M. Does breastfeeding protect against allergic rhinitis during childhood? A meta‐analysis of prospective studies. Acta Paediatrica 2002;91(3):275‐9. [DOI] [PubMed] [Google Scholar]
Nagel 2010
- Nagel G, Weinmayr G, Kleiner A, Garcia‐Marcos L, Strachan DP. Effect of diet on asthma and allergic sensitisation in the International Study on Allergies and Asthma in Childhood (ISAAC) Phase Two. Thorax 2010;65(6):516‐22. [DOI] [PubMed] [Google Scholar]
NHMRC 2006
- National Health and Medical Research Council. Nutrient reference values for Australia and New Zealand. www.nhmrc.gov.au/guidelines/publications (accessed 27 July 2012).
Notenbloom 2011
- Notenboom ML, Mommers M, Jansen EH, Penders J, Thijs C. Maternal fatty acid status in pregnancy and childhood atopic manifestations: KOALA Birth Cohort Study. Clinical and Experimental Allergy 2011;41(3):407‐16. [DOI] [PubMed] [Google Scholar]
Nurmatov 2011
- Nurmatov U, Devereux G, Sheikh A. Nutrients and foods for the primary prevention of asthma and allergy: systematic review and meta‐analysis. Journal of Allergy and Clinical Immunology 2011;127(3):724‐33.e30. [DOI] [PubMed] [Google Scholar]
Nwaru 2011
- Nwaru BI, Erkkola M, Lumia M, Kronberg‐Kippila C, Ahonen S, Kaila M, et al. Maternal intake of fatty acids during pregnancy and allergies in the offspring. British Journal of Nutrition 2012;108(4):720‐32. [DOI] [PubMed] [Google Scholar]
Odhiambo 2009
- Odhiambo JA, Williams HC, Clayton TO, Robertson CF, Asher MI, International Study of Asthma and Allergies in Childhood Phase Three Study Group. Global variations in prevalence of eczema symptoms in children from ISAAC Phase Three. Journal of Allergy and Clinical Immunology 2009;124(6):1251‐8.e23. [DOI] [PubMed] [Google Scholar]
Oranje 1995
- Oranje AP. Development of childhood eczema and its classification. Pediatric Allergy and Immunology 1995;6:31‐5. [DOI] [PubMed] [Google Scholar]
Osborn 2006a
- Osborn DA, Sinn J. Soy formula for prevention of allergy and food intolerance in infants. Cochrane Database of Systematic Reviews 2006, Issue 4. [DOI: 10.1002/14651858.CD003741.pub4] [DOI] [PMC free article] [PubMed] [Google Scholar]
Osborn 2006b
- Osborn DA, Sinn J. Formulas containing hydrolysed protein for prevention of allergy and food intolerance in infants. Cochrane Database of Systematic Reviews 2006, Issue 4. [DOI: 10.1002/14651858.CD003664.pub3] [DOI] [PubMed] [Google Scholar]
Osborn 2007a
- Osborn DA, Sinn JK. Prebiotics in infants for prevention of allergic disease and food hypersensitivity. Cochrane Database of Systematic Reviews 2007, Issue 4. [DOI: 10.1002/14651858.CD006474.pub2] [DOI] [PubMed] [Google Scholar]
Osborn 2007b
- Osborn DA, Sinn JK. Probiotics in infants for prevention of allergic disease and food hypersensitivity. Cochrane Database of Systematic Reviews 2007, Issue 4. [DOI: 10.1002/14651858.CD006475.pub2] [DOI] [PubMed] [Google Scholar]
RevMan 2014 [Computer program]
- The Nordic Cochrane Centre, The Cochrane Collaboration. Review Manager (RevMan). Version 5.3. Copenhagen: The Nordic Cochrane Centre, The Cochrane Collaboration, 2014.
Romieu 2007
- Romieu I, Torrent M, Garcia‐Esteban R, Ferrer C, Ribas‐Fito N, Anto JM, et al. Maternal fish intake during pregnancy and atopy and asthma in infancy. Clinical and Experimental Allergy 2007;37(4):518‐25. [DOI] [PubMed] [Google Scholar]
Schachter 2004
- Schachter HM, Reisman J, Tran K, Dales B, Kourad K, Barnes D, et al. Health effects of omega‐3 fatty acids on asthma. Evidence Report/technology Assessment (Summary) 2004;91:1‐7. [PMC free article] [PubMed] [Google Scholar]
Schwartz 2010
- Schwartz J, Dube K, Alexy U, Kalhoff H, Kersting M. PUFA and LC‐PUFA intake during the first year of life: can dietary practice achieve a guideline diet?. European Journal of Clinical Nutrition 2010;64(2):124‐30. [DOI] [PubMed] [Google Scholar]
Schünemann 2013
- Schünemann H, Brożek J, Guyatt G, Oxman A, editors. GRADE handbook for grading quality of evidence and strength of recommendations. Updated October 2013. www.guidelinedevelopment.org/handbook.
Suarez‐Varela 2010
- Suarez‐Varela MM, Alvarez LG, Kogan MD, Ferreira JC, Martinez Gimeno A, Aguinaga Ontoso I, et al. Diet and prevalence of atopic eczema in 6 to 7‐year‐old schoolchildren in Spain: ISAAC Phase III. Journal of Investigational Allergology and Clinical Immunology 2010;20(6):469‐75. [PubMed] [Google Scholar]
Thien 2002
- Woods RK, Thien FC, Abramson MJ. Dietary marine fatty acids (fish oil) for asthma in adults and children. Cochrane Database of Systematic Reviews 2002, Issue 3. [DOI: 10.1002/14651858.CD001283] [DOI] [PubMed] [Google Scholar]
Tromp 2011
- Tromp II, Kiefte‐de Jong JC, Lebon A, Renders CM, Jaddoe VW, Hofman A, et al. The introduction of allergenic foods and the development of reported wheezing and eczema in childhood: the Generation R study. Archives of Pediatrics & Adolescent Medicine 2011;165(10):933‐8. [DOI] [PubMed] [Google Scholar]
Virtanen 2010
- Virtanen SM, Kaila M, Pekkanen J, Kenward MG, Uusitalo U, Pietinen P, et al. Early introduction of oats associated with decreased risk of persistent asthma and early introduction of fish with decreased risk of allergic rhinitis. British Journal of Nutrition 2010;103(2):266‐73. [DOI] [PubMed] [Google Scholar]
Willers 2007
- Willers SM, Devereux G, Craig LC, McNeill G, Wijga AH, Abou El‐Magd W, et al. Maternal food consumption during pregnancy and asthma, respiratory and atopic symptoms in 5‐year‐old children. Thorax 2007;62(9):773‐9. [DOI] [PMC free article] [PubMed] [Google Scholar]
Willers 2008
- Willers SM, Wijga AH, Brunekreef B, Kerkhof M, Gerritsen J, Hoekstra MO, et al. Maternal food consumption during pregnancy and the longitudinal development of childhood asthma. American Journal of Respiratory and Critical Care Medicine 2008;178(2):124‐31. [DOI] [PubMed] [Google Scholar]
Willers 2011
- Willers SM, Wijga AH, Brunekreef B, Scholtens S, Postma DS, Kerkhof M, et al. Childhood diet and asthma and atopy at 8 years of age: the PIAMA birth cohort study. European Respiratory Journal 2011;37(5):1060‐7. [DOI] [PubMed] [Google Scholar]
Yaqoob 2007
- Yaqoob P, Calder PC. Fatty acids and immune function: new insights into mechanisms. British Journal of Nutrition 2007;98(Suppl 1):S41‐5. [DOI] [PubMed] [Google Scholar]