

Abstract
Background
A range of health workforce strategies are needed to address health service demands in low‐, middle‐ and high‐income countries. Non‐medical prescribing involves nurses, pharmacists, allied health professionals, and physician assistants substituting for doctors in a prescribing role, and this is one approach to improve access to medicines.
Objectives
To assess clinical, patient‐reported, and resource use outcomes of non‐medical prescribing for managing acute and chronic health conditions in primary and secondary care settings compared with medical prescribing (usual care).
Search methods
We searched databases including CENTRAL, MEDLINE, Embase, and five other databases on 19 July 2016. We also searched the grey literature and handsearched bibliographies of relevant papers and publications.
Selection criteria
Randomised controlled trials (RCTs), cluster‐RCTs, controlled before‐and‐after (CBA) studies (with at least two intervention and two control sites) and interrupted time series analysis (with at least three observations before and after the intervention) comparing: 1. non‐medical prescribing versus medical prescribing in acute care; 2. non‐medical prescribing versus medical prescribing in chronic care; 3. non‐medical prescribing versus medical prescribing in secondary care; 4 non‐medical prescribing versus medical prescribing in primary care; 5. comparisons between different non‐medical prescriber groups; and 6. non‐medical healthcare providers with formal prescribing training versus those without formal prescribing training.
Data collection and analysis
We used standard methodological procedures expected by Cochrane. Two review authors independently reviewed studies for inclusion, extracted data, and assessed study quality with discrepancies resolved by discussion. Two review authors independently assessed risk of bias for the included studies according to EPOC criteria. We undertook meta‐analyses using the fixed‐effect model where studies were examining the same treatment effect and to account for small sample sizes. We compared outcomes to a random‐effects model where clinical or statistical heterogeneity existed.
Main results
We included 46 studies (37,337 participants); non‐medical prescribing was undertaken by nurses in 26 studies and pharmacists in 20 studies. In 45 studies non‐medical prescribing as a component of care was compared with usual care medical prescribing. A further study compared nurse prescribing supported by guidelines with usual nurse prescribing care. No studies were found with non‐medical prescribing being undertaken by other health professionals. The education requirement for non‐medical prescribing varied with country and location.
A meta‐analysis of surrogate markers of chronic disease (systolic blood pressure, glycated haemoglobin, and low‐density lipoprotein) showed positive intervention group effects. There was a moderate‐certainty of evidence for studies of blood pressure at 12 months (mean difference (MD) ‐5.31 mmHg, 95% confidence interval (CI) ‐6.46 to ‐4.16; 12 studies, 4229 participants) and low‐density lipoprotein (MD ‐0.21, 95% CI ‐0.29 to ‐0.14; 7 studies, 1469 participants); we downgraded the certainty of evidence from high due to considerations of serious inconsistency (considerable heterogeneity), multifaceted interventions, and variable prescribing autonomy. A high‐certainty of evidence existed for comparative studies of glycated haemoglobin management at 12 months (MD ‐0.62, 95% CI ‐0.85 to ‐0.38; 6 studies, 775 participants). While there appeared little difference in medication adherence across studies, a meta‐analysis of continuous outcome data from four studies showed an effect favouring patient adherence in the non‐medical prescribing group (MD 0.15, 95% CI 0.00 to 0.30; 4 studies, 700 participants). We downgraded the certainty of evidence for adherence to moderate due to the serious risk of performance bias. While little difference was seen in patient‐related adverse events between treatment groups, we downgraded the certainty of evidence to low due to indirectness, as the range of adverse events may not be related to the intervention and selective reporting failed to adequately report adverse events in many studies.
Patients were generally satisfied with non‐medical prescriber care (14 studies, 7514 participants). We downgraded the certainty of evidence from high to moderate due to indirectness, in that satisfaction with the prescribing component of care was only addressed in one study, and there was variability of satisfaction measures with little use of validated tools. A meta‐analysis of health‐related quality of life scores (SF‐12 and SF‐36) found a difference favouring non‐medical prescriber care for the physical component score (MD 1.17, 95% CI 0.16 to 2.17), and the mental component score (MD 0.58, 95% CI ‐0.40 to 1.55). However, the quality of life measurement may more appropriately reflect composite care rather than the prescribing component of care, and for this reason we downgraded the certainty of evidence to moderate due to indirectness of the measure of effect. A wide variety of resource use measures were reported across studies with little difference between groups for hospitalisations, emergency department visits, and outpatient visits. In the majority of studies reporting medication use, non‐medical prescribers prescribed more drugs, intensified drug doses, and used a greater variety of drugs compared to usual care medical prescribers.
The risk of bias across studies was generally low for selection bias (random sequence generation), detection bias (blinding of outcome assessment), attrition bias (incomplete outcome data), and reporting bias (selective reporting). There was an unclear risk of selection bias (allocation concealment) and for other biases. A high risk of performance bias (blinding of participants and personnel) existed.
Authors' conclusions
The findings suggest that non‐medical prescribers, practising with varying but high levels of prescribing autonomy, in a range of settings, were as effective as usual care medical prescribers. Non‐medical prescribers can deliver comparable outcomes for systolic blood pressure, glycated haemoglobin, low‐density lipoprotein, medication adherence, patient satisfaction, and health‐related quality of life. It was difficult to determine the impact of non‐medical prescribing compared to medical prescribing for adverse events and resource use outcomes due to the inconsistency and variability in reporting across studies. Future efforts should be directed towards more rigorous studies that can clearly identify the clinical, patient‐reported, resource use, and economic outcomes of non‐medical prescribing, in both high‐income and low‐income countries.
Plain language summary
Prescribing roles for health professionals other than doctors
What is the aim of this review?
The aim of this Cochrane review was to find out if prescribing by health professionals other than doctors delivers comparable outcomes to prescribing by doctors. Cochrane researchers collected and analysed all relevant studies to answer this question and found 46 studies.
Key messages
With appropriate training and support, nurses and pharmacists are able to prescribe medicines as part of managing a range of conditions to achieve comparable health management outcomes to doctors. The majority of studies focus on chronic disease management in higher‐income counties where there is generally a moderate‐certainty of evidence supporting similar outcomes for the markers of disease in high blood pressure, diabetes, and high cholesterol. Further high‐quality studies are needed in poorer countries and to better quantify differences in prescribing outcomes for adverse events, and to determine health economic outcomes. Further studies could also focus more specifically on the prescribing component of care.
What was studied in the review?
A number of countries allow health professionals other than doctors to prescribe medicines. This shift in roles is thought to provide improved and timely access to medicines for consumers where there are shortages of doctors or the health system is facing pressures in coping with the burden of disease. In addition, this task shift has been supported by a number of governments as a way to more appropriately use the skills of health professionals, such as nurses and pharmacists, in the care of patients. We compared the outcomes of any healthcare workers who were prescribing with a high degree of autonomy with medical prescribers in the hospital or community setting in low‐, middle‐ and high‐income countries.
What are the main results of the review?
This review found 45 studies where nurses and pharmacists with high levels of prescribing autonomy were compared with usual care medical prescribers. A further study compared nurse prescribing with guideline support with usual nurse prescribing care. No studies were found with other health professionals or lay prescribers. Four nurse prescribing studies were undertaken in the low‐ and middle‐income settings of Colombia, South Africa, Uganda, and Thailand. The remainder of studies were undertaken in high‐income Western countries. Forty‐two studies were based in a community setting, two studies were located in hospitals, one study in the workplace, and one study in an aged care facility. Prescribing was but one part of many health‐related interventions, particularly in the management of chronic disease.
The review found that the outcomes for non‐medical prescribers were comparable to medical prescribers for: high blood pressure (moderate‐certainty of evidence); diabetes control (high‐certainty of evidence); high cholesterol (moderate‐certainty of evidence); adverse events (low‐certainty of evidence); patients adhering to their medication regimens (moderate‐certainty of evidence); patient satisfaction with care (moderate‐certainty of evidence); and health‐related quality of life (moderate‐certainty of evidence).
Pharmacists and nurses with varying levels of undergraduate, postgraduate, and specific on‐the‐job training related to the disease or condition were able to deliver comparable prescribing outcomes to doctors. Non‐medical prescribers frequently had medical support available to facilitate a collaborative practice model.
How up‐to‐date is this review?
The review authors searched for studies that had been published up to 19th July 2016.
Summary of findings
Summary of findings for the main comparison. Non‐medical prescribing compared to medical prescribing for acute and chronic disease management in primary and secondary care.
| Non‐medical prescribing compared to medical prescribing for acute and chronic disease management in primary and secondary care | ||||||
| Patient or population: patients with acute and chronic disease Settings: secondary care and ambulatory/primary care in low‐, middle‐ and high‐income counties Intervention: non‐medical prescribing Comparison: medical prescribing | ||||||
| Outcomes | Illustrative comparative risks* (95% CI) | Relative effect (95% CI) | No of Participants (studies) | Certainty of the evidence (GRADE) | Comments | |
| Assumed risk | Corresponding risk | |||||
| Medical prescribing | Non‐medical prescribing | |||||
| Systolic blood pressure (mmHg) at 12 months | The mean systolic blood pressure in the control group ranged from 124 mmHg to 149 mmHg | The mean systolic blood pressure in the intervention group was 5.31 mmHg lower (‐6.46 lower to ‐4.16 lower) | ‐ | 4229 (12 RCTs) | ⊕⊕⊕⊝ Moderate 1,2,3 | Random‐effects analysis: MD ‐5.91 mmHg lower (95% CI ‐7.71 lower to ‐4.10 lower) |
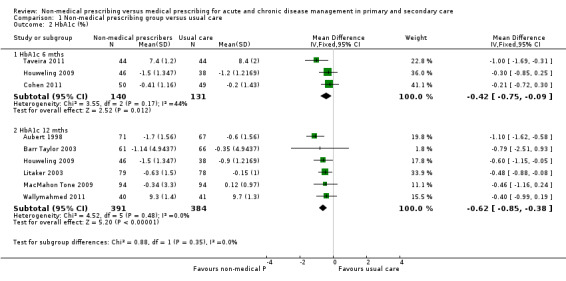
| Glycated haemoglobin (HbA1c, %) at 12 months | The mean change in glycated haemoglobin in the control group ranged from ‐0.90% to 9.7% | The mean change in glycated haemoglobin in the intervention group was 0.62% lower (‐0.85 lower to ‐0.38 lower) | ‐ | 775 (6 RCTs) | ⊕⊕⊕⊕ High2,3 | Random‐effects analysis: MD ‐0.62 (95% CI ‐0.85 to ‐0.38) |
| Low‐density lipoprotein (mmol/L) at 12 months | The mean low‐density lipoprotein in the control group ranged from ‐0.26 to 3.41 mmol/L | The mean low‐density lipoprotein in the intervention group was 0.21 mmol/L lower (‐0.29 lower to ‐0.14 lower) | ‐ | 1469 (7 RCTs) | ⊕⊕⊕⊝ Moderate1,2,3 | Random‐effects analysis: MD ‐0.30 (95% CI ‐0.62 to 0.02) |
| Adherence (continuous) 6 months follow‐up |
The mean adherence (continuous) in the control group was 0.79 | The mean adherence in the intervention group was 0.15 higher (0.00 higher to 0.30 higher) | ‐ | 700 (4 RCTs) | ⊕⊕⊕⊝ Moderate4,5 | |
| Patient satisfaction | Patient satisfaction was reported in 14 studies (Table 5). The majority of surveys were either not referenced or developed locally. Validated questionnaires assessing overall non‐medical practitioner satisfaction with care were reported in six studies rather than patient satisfaction with prescribing. An exception was the study by Bruhn 2013, which found for the prescribing intervention, patients were generally positive about the pharmacist prescribing service, 85% (39/46) were totally satisfied, while 9% (4/44) would have preferred to see their GP | Not estimable | 7514 (14 RCTs) |
⊕⊕⊕⊝ Moderate8,9 | ||
| Adverse events | There was little or no difference in adverse events between treatment groups in nine studies. Two studies reported higher rates of adverse events in the usual care group. It was difficult to determine effects in the remaining studies because limited data were reported | Not estimable | 18,400 (18 RCTs) |
⊕⊕⊝⊝ Low6,7 | ||
| Health‐related quality of life measured with SF‐12/36 | The mean health‐related quality of life in the control group was 0 | The mean health‐related quality of life in the intervention group: physical component was 1.17 higher (0.16 to 2.17) mental component was 0.58 higher (‐0.40 to 1.55) |
‐ | 4631 (8 RCTs) | ⊕⊕⊕⊝ Moderate10 |
|
| *The basis for the assumed risk (e.g. the median control group risk across studies) is provided in footnotes. The corresponding risk (and its 95% CI) is based on the assumed risk in the comparison group and the relative effect of the intervention (and its 95% CI). CI: confidence interval; GP: general practitioner; MD: mean difference; RCT: randomised controlled trial. | ||||||
| GRADE Working Group grades of evidence High‐certainty: Further research is very unlikely to change our confidence in the estimate of effect. Moderate‐certainty: Further research is likely to have an important impact on our confidence in the estimate of effect and may change the estimate. Low‐certainty: Further research is very likely to have an important impact on our confidence in the estimate of effect and is likely to change the estimate. Very low‐certainty: We are very uncertain about the estimate. | ||||||
1Downgraded one level due to serious inconsistency (considerable heterogeneity was found). 2Multifaceted interventions. 3Variable prescribing autonomy. 4Downgraded one level due to serious risk of bias (high risk of performance bias). 5Variable reporting measures of adherence. 6Downgraded one level due to indirectness (range of adverse events; may not be related to the intervention). 7Downgraded one level due to selective outcome reporting (adverse events not reported in many studies). 8Downgraded one level due to indirectness (prescribing component not adequately assessed across studies). 9Variability in satisfaction measures. 10Downgraded one level due to indirectness (prescribing component effect on quality of life difficult to determine).
4. Secondary outcomes ‐ patient and provider satisfaction.
| Study | Satisfaction tool measure | Outcome |
| Barr Taylor 2003 | Not specified | 19/57 respondents stated that the nurse care management programme was moderately helpful. 32/57 found it extremely helpful. 9/13 physicians with two or more patients recommended adoption of the nurse management programme. In other health care settings: 9 physicians felt the programme decreased their time with patients, while 4 thought it increased the time spent. |
| Bruhn 2013 | 11 patient satisfaction statements derived from a local prescribing feasibility study | For the prescribing intervention, patients were generally positive about the pharmacist prescribing service ‐ 85% (39/46) were totally satisfied, while 9% (4/44) would have preferred to see their GP. In semi‐structured interviews with GPs and pharmacists, all pharmacists and most GPs were positive about the intervention. Pharmacists found their role satisfying, interesting, and challenging. 17 of 23 GPs were positive about the pharmacists’ role. The cost‐effectiveness of the pharmacists' role, given limited resources, was one issue raised in the GP focus group. |
| Finley 2003 | Not specified | Patients reported greater treatment satisfaction with the collaborative care model than the control group in 6 of 11 measures including the overall treatment for depression, personal nature of the care, listening to concerns, explanations about why antidepressants were prescribed and how to take them, availability for advice, and overall satisfaction with the organisation. 18/37 primary care provider questionnaire respondents were satisfied with workflow, patient welfare. and the pharmacists' abilities. |
| Houweling 2009 | Patient Evaluation of the Quality of Diabetes Care (PEQD) | Patients' evaluations of their satisfaction with diabetes care from the specialist diabetes nurse were significantly more positive than the control group. |
| Houweling 2011 | Patient Evaluation of the Quality of Diabetes Care (PEQD) | The total satisfaction sum score for 14 PEQD measures for practice nurses was 66.4%, compared to 51.7% in the GP group which may be confounded by the amount of time given to each patient. On average GPs spent a total of 28 minutes per patient, whereas practice nurses spent 128 minutes per patient. |
| Hunt 2008 | Satisfation in the SF‐36 healthcare domain | Satisfaction with hypertension care was high in both groups, but with little or no difference in any of the 11 satisfaction measures. Satisfaction was not associated with blood pressure goal attainment. |
| Hirsch 2014 | 22‐item Pharmacist Service Questionnaire. 0‐100 scale |
Patient satisfaction with the clinical pharmacist were high, with mean scores 92.4 (±10.9) at 6 months (n = 49) and 92.7 (±11) at 9 months (n = 44). |
| Litaker 2003 | Patient Satisfaction Questionaire | Improvements in four areas of satisfaction in the intervention group linked to an increased time spent with patients and an emphasis on patient‐centred education and self‐management (i.e. quality and quantity of contact) from base line to study end. Between‐group comparisons at study end demonstrated little or no significant difference in patient satisfaction measures, including overall care and general satisfaction. |
| Logan 1979 | Not specified | 6% of patients were dissatisfied with care provided by nurses but details of the survey instrument were not provided: (assumed 12/206 intervention patients at 6 months but not specified). |
| McAlister 2014 | Not specified | Little or no difference in overall health care satisfaction between pharmacist‐ and nurse‐led care. |
| Magid 2013 | Not specified | Patients at 6 months reporting they were very or completely satisfied with their hypertension care was probably higher in the intervention group than the usual care group. |
| Margolis 2013 | Six items from the Consumer Assessment of Healthcare Providers and Systems adult survey (version 4) | Satisfaction items concerning clinicians listening carefully, explaining things clearly, and respecting what patients said showed larger improvements amongst patients in the telemonitoring intervention group than usual care at 6 months but not at 12 or 18 months. |
| Spitzer 1974 | Not specified | 96% of patients in the nurse practitioner group and 97% of patients in the conventional care group were satisfied with the health services received in the experimental period. |
| Vivian 2002 | Not specified | Little or no significant differences in patient satisfaction between groups. More patients in the intervention group felt that the pharmacist spent more time with them than did control patients, although there was little difference. There was no difference in satisfaction with pharmacy services or changes in patient satisfaction in either group from baseline to study end. This study was underpowered to detect a significant difference in patient satisfaction. |
GP: general practitioner
Background
Description of the healthcare challenge
A range of health workforce strategies are needed to address issues of health service access and efficiency. In low‐, middle‐ and high‐income countries, the increasing demand for health services arises from an ageing population and the resultant increasing burden of chronic disease (Bhanbhro 2011; Duckett 2005; Phillips 2008; WHO 2012).
Increased health demands can be met in part by task substitution within the health workforce. One health workforce strategy for task substitution is to permit prescribing by healthcare providers other than medical doctors. Non‐medical prescribers may include nurses, pharmacists, allied health professionals, and physician assistants. In some low‐ and middle‐income countries, lay health workers have been used to distribute medications with preventive or curative intent, including contraceptives, iron or vitamin supplements, vaccinations, and agents for tuberculosis management (Glenton 2013).
Extending a health provider's scope of practice, including the right to prescribe, has been supported in a number of countries as a means of benefiting patient care by the effective use of health professionals' skills, improving patient access to timely care, improving patient choice, and enhancing teamwork and the better use of resources (Department of Health 1999; Ellis 2006; Hooker 2006; Stewart 2010).
The devolution of prescribing rights in high‐income countries has continued from a historical base in the United States of America (USA) in the 1970s through to more recent government‐led reforms in the United Kingdom (UK), Canada, the Netherlands, New Zealand, and Australia. While the definition of prescribing may vary between countries, for the purpose of our review, prescribing was defined as: "an iterative process involving the steps of information gathering, clinical decision making, communication and evaluation which results in the initiation, continuation or cessation of a medicine" (Health Workforce Australia 2013). The term 'medical prescribing' refers to prescribing by medically qualified doctors. The supply of non‐prescription (over‐the‐counter) medicines by pharmacists or pharmacy assistants working in community pharmacies is excluded from our definition of prescribing, as is the supply of medicines by lay health workers.
The term 'non‐medical prescribing' originates from the UK, where it is defined as: "prescribing by specially trained nurses, optometrists, pharmacists, physiotherapists, podiatrists, and radiographers, working within their clinical competence as either independent or supplementary prescribers" (NPC 2012).
Supplementary prescribing which was introduced in the UK in 2003, is defined as 'a voluntary partnership between an independent prescriber (a doctor or dentist) and a supplementary prescriber (e.g. nurse, optometrist, pharmacist, physiotherapist, chiropodist/podiatrist, or radiographer) to implement an agreed patient‐specific clinical management plan with the patient's agreement' (Department of Health 2003). Non‐medical prescribing rights were extended in 2006 with the introduction of independent prescribing. The UK Department of Health defines independent prescribing as 'prescribing by a practitioner (e.g. doctor, dentist, nurse, pharmacist, optometrist) responsible and accountable for the assessment of patients with undiagnosed or diagnosed conditions, and for decisions about the clinical management required, including prescribing'. Independent prescribing is one element of the clinical management of a patient and occurs in partnership with the patient. It requires an initial patient assessment, interpretation of that assessment, a decision on safe and appropriate therapy, and a process for ongoing monitoring. The independent prescriber is responsible and accountable for at least this element of a patient's care (Department of Health 2006). Independent prescribing does not require a clinical management plan. From 1 May 2006, nurse and pharmacist independent prescribers who completed the appropriate training could prescribe, with a few exceptions, any licensed medicine for any medical condition within their competence. In 2009, independent prescribing rights were extended to include unlicensed medicines. While prescribing of controlled drugs was restricted, this limitation was removed through legislative change in April 2012 (Home Office 2012).
In the USA, devolution of prescribing authority varies from state to state. Collaborative Practice Agreements in 46 States allow a pharmacist to partner with a physician to manage a number of patient services, including medication management (Law 2013; Thomas 2006). Physician assistants and nurse practitioners were introduced in 1967 to support medical care. These practitioners undertake a range of clinical functions, including prescribing (Hooker 2006).
Within Canada, a pharmacist's scope of prescribing practice varies between the provinces from independently prescribing to adapting (modifying) or continuing prescriptions (Law 2012).
A collaborative prescribing model has emerged as the preferred model of practice within New Zealand and Australia. Collaborative prescribing is undertaken within a multidisciplinary team and can include the continuum of prescribing from transcription of orders (with or without medical signature), prescribing specified drugs and doses by protocol, prescribing by clinical management plan (allowing choice of drugs and doses) to independent prescribing, where a prescribing consultation with a medical practitioner is not required (Weeks 2008; Wheeler 2012).
The Health Professionals Prescribing Pathway developed by Health Workforce Australia (HWA) includes five steps to safely and competently prescribe, and covers: education and training, recognition by the profession's national registering board, authorisation to prescribe by legislation, prescribing within the scope of practice, and maintaining and enhancing competence to prescribe. The prescribing models suggested by HWA emphasise team communication and are divided into autonomous prescribing, prescribing under supervision, and prescribing via a structured prescribing arrangement (HWA 2013). The reforms started by HWA have been transferred to a working group of the Australian Health Practitioner Regulation Agency. As part of the reform process, health agencies in Australia, Canada, New Zealand, and the UK have developed prescribing competency frameworks for non‐medical health professionals (NPC 2012; NPS 2012; Pharmacy Council NZ 2013; Yuksel 2008).
Description of the intervention
For the purpose of our review the term 'non‐medical prescribing' was used to cover prescribing of medicines by a broad range of healthcare providers other than medical doctors, prescribing in primary or secondary care. No limitation was set on the type of non‐medical healthcare provider undertaking prescribing. Frequently, non‐medical prescribing is done in collaboration or partnership with doctors, and within this practice there are different models of prescribing practice. However, for this review the non‐medical prescriber was required to have a high degree of autonomy in their prescribing practice. We excluded studies reporting prescribing practices requiring medical review, consultation, and approval requiring a medical signature on medication orders. Our review focused on prescribing, which as per our definition is much broader than issuing a prescription.
The role of non‐medical prescribers in secondary care settings may involve supporting acute or chronic care by prescribing in a timely way medication on admission, discharge, or where there is a specialist need, e.g. total parenteral nutrition. Specialist outpatient clinics managed by non‐medical health professionals may exist in either the primary or secondary care setting, e.g. for the management of hypertension, lipids, diabetes, and pain. In primary care settings, prescribing may be undertaken for acute or chronic conditions by nurses or other healthcare providers caring for patients in their homes or through involvement with general practice teams, community health centres, mental health teams, or community pharmacies.
How the intervention might work
Non‐medical prescribing has developed as an accepted healthcare practice in a number of countries to improve access to healthcare, to better use the skills of doctors who can focus on more acute patient needs, to better use the skills of pharmacists, nurses and other health providers, to potentially reduce costs for achieving at least equivalent, if not better health outcomes for consumers, and to retain health workers by increasing job satisfaction (Department of Health 1999; Tonna 2007). While qualitative studies support non‐medical prescribing from a patient and practitioner perspective, robust evidence is still required for clinical, patient‐reported, and resource use outcomes. It is noted that where non‐medical prescribers are practising in collaborative teams, it may be difficult to apportion the impact of the non‐medical prescribing component to the primary and secondary outcomes of this review. Wider adoption of non‐medical prescribing practice in high‐income countries frequently faces local regulatory hurdles and opposition from the medical community which has raised concerns about professional autonomy, patient safety, the diagnostic competency of non‐medical prescribers, and costs (Cooper 2008). Evidence that patient outcomes arising from non‐medical prescribing are as effective as those from medical prescribing would provide a basis for policy‐makers to support wider implementation of this practice.
Why it is important to do this review
It is important for health practitioners and policy‐makers to understand the evidence existing for non‐medical prescribing in order to address access or health workforce needs. This information will also guide future decision making with regards to implementing or expanding non‐medical prescribing.
Potential beneficiaries of the findings include:
policy‐makers seeking to use workforce resources more efficiently;
policy‐makers seeking to meet a clinical need;
consumers seeking greater choice and easier access to medicines;
non‐medical health professionals seeking to better utilise their skills and/or extend their scope of practice; and
medical staff seeking to focus on patients with the greatest medical need.
Despite a gradual rolling out of reforms, the evidence for the potential benefits of non‐medical prescribing from well‐controlled trials involving a wide range of health professionals requires identification, synthesis, and evaluation. Several narrative reviews of the non‐medical prescribing literature have been undertaken (Kay 2004; Tonna 2007), and the British government commissioned two evaluations covering supplementary and independent prescribing (Bissell 2008; Latter 2010).
A Cochrane Review on substitution of doctors by suitably trained nurses in primary care found that trained nurses can produce as high a quality of care and as good health outcomes with no appreciable difference between doctors and nurses in resource utilisation outcomes associated with prescribing (Laurant 2005). The review was limited to nurses in the primary care setting as first contact or ongoing care for undifferentiated patients.
A further Cochrane Review found a single RCT of pharmacist‐managed drug therapy (Nkansah 2010), including the prescribing of drugs versus physician medication management (Hawkins 1979). However, we assessed the study to be of low‐quality, leaving open the question of whether the delivery of patient‐targeted services by pharmacists improves patient outcomes compared to other health professionals.
The Driscoll 2015 Cochrane Review of nurse‐led titration of drug therapy for people with heart failure, found that participants in the nurse‐led group were less likely to be admitted to hospital or to die. More participants reached the maximum drug dose in the nurse‐led titration group compared to titration of doses by primary care physicians. The certainty of evidence that nurse‐led titration reduced hospitalisations was graded as high and the certainty of evidence regarding the proportion of participants reaching optimal dose was graded as low. However, in the majority of studies the influence of medical supervision on nurse‐dose titration (prescribing) was unclear.
Against this background, we systematically identified, reviewed, and updated the evidence from controlled studies and uncontrolled studies on the clinical, patient‐reported and resource use outcomes of non‐medical prescribing in primary and secondary care settings. This review considered any adverse effects of non‐medical prescribing which may be clinical (e.g. deterioration in care or incidence of adverse drugs reactions), patient‐reported (e.g. decreased satisfaction), or resource‐related (e.g. increased treatment costs).
The review covered healthcare providers undertaking non‐medical prescribing, spanning primary and secondary care settings, and considered acute and chronic prescribing situations.
Objectives
To assess the clinical, patient‐reported, and resource use outcomes of non‐medical prescribing for managing acute and chronic health conditions in primary and secondary care settings compared with medical prescribing (usual care).
Methods
Criteria for considering studies for this review
Types of studies
We included studies of patients or health professionals or healthcare settings using the definitions of designs outlined in the Cochrane Effective Practice and Organisation of Care (EPOC) Group checklist (Cochrane EPOC Group 2013a). We included randomised controlled trials (RCTs) and cluster‐RCTs, one controlled trial where investigators had allocated participants to the different groups that were being compared using a method that is not random, but where at least two groups with interventions were followed, and one controlled before‐and‐after (CBA) study with at least two intervention sites and two control sites. We did not find either interrupted time series (ITS) studies nor qualitative studies linked to quantitative studies using qualitative analysis methods.
Types of participants
Healthcare providers who are not medical doctors, undertaking prescribing including, nurses, optometrists, pharmacists, physician assistants, and other allied health professionals or categories not specifically mentioned whose roles meet our definition of non‐medical prescribing.
Setting
We included studies based in any primary or secondary care setting where non‐medical prescribing occurred.
Types of interventions
We included studies involving health providers other than medical doctors undertaking prescribing according to our definition of prescribing. We excluded studies limited to the supply function of pharmacists, including over‐the‐counter products and studies involving the supply function of lay health workers.
We included the following six comparisons for non‐medical prescribing.
Non‐medical prescribing versus medical prescribing in acute care.
Non‐medical prescribing versus medical prescribing in chronic care.
Non‐medical prescribing versus medical prescribing in secondary care.
Non‐medical prescribing versus medical prescribing in primary care.
Comparisons between different non‐medical prescriber groups.
Non‐medical healthcare providers with formal prescribing training versus those without formal prescribing training.
Types of outcome measures
The studies included in the review reported a wide variety of outcome measures. We only included studies with objective measures of patient clinical outcomes. Non‐inferiority was regarded as a positive outcome where a non‐medical prescribing outcome was at least as good as the comparator. We excluded studies with only a qualitative component in order to maintain the clinical focus of the review.
Primary outcomes
Clinical outcomes
Patient outcomes
We used standard outcome measures covering health and well‐being, including physiological measures of treatment such as systolic blood pressure, glycated haemoglobin, and low‐density lipoprotein. Outcomes were divided into dichotomous and continuous outcomes.
We also considered the following outcomes.
Proportion of prescribers, medical and non‐medical, appropriately adhering to practice guidelines.
Proportion of patients demonstrating medication adherence.
Proportion of patients and items appropriately prescribed or deprescribed.
Patient satisfaction, where measured by a validated tool as part of an effectiveness study.
Non‐medical prescriber versus medical prescriber waiting time to care.
Non‐medical prescribers adversely affecting the health outcomes of patients through medication errors, prescribing errors, adverse events, wrong diagnoses or treatment, increased hospitalisations, or representations for medical care.
Secondary outcomes
Patient‐reported outcomes
We considered patient‐reported outcomes without clinician interpretation of their knowledge requirements, daily functioning, and health‐related quality of life.
Non‐medical prescriber outcomes
Where present, we also reported non‐medical prescriber outcomes of job satisfaction, skills utilisation, education needs, and workload effects.
Resource use outcomes
Medical time saved by non‐medical prescribers.
Non‐medical prescriber versus medical prescriber prescription volume and cost, patient out‐of‐pocket expenses, service costs, and deprescribing rate and cost.
Increased resource use for providing the intervention and for providing subsequent care such as hospitalisations, emergency department visits, and outpatient visits.
Search methods for identification of studies
Electronic searches
We searched the following databases.
Cochrane Central Register of Controlled Trials (CENTRAL, including the Effective Practice and Organisation of Care (EPOC) Group Specialised Register; 2016, Issue 6), in the Cochrane Library (Wiley).
Cochrane Methodology Register, the Cochrane Library; 2012, Issue 3 (Wiley).
Cochrane Database of Systematic Reviews (CDSR), the Cochrane Library; 2016, Issue 7.
Database of Abstracts and Reviews of Effects (DARE), the Cochrane Library; 2015, Issue 2 (Wiley).
Health Technology Assessment Database, the Cochrane Library; 2016, Issue 2 (Wiley).
NHS Economic Evaluation Database, the Cochrane Library; 2015, Issue 2 (Wiley).
MEDLINE (1946 to 19 July 2016), (Epub Ahead of Print, In‐Process & Other Non‐Indexed Citations, Ovid MEDLINE(R) Daily and Ovid MEDLINE(R) 1946 to 19 July 2016) (OvidSP).
Embase (OvidSP) (1980 to 18 July 2016).
PsycINFO (OVID) (1806 to July Week 2, 2016).
Cumulative Index to Nursing and Allied Health Literature (CINAHL) (EBSCOhost) (1980 to 19 July 2016).
The MEDLINE search strategy as illustrated in Appendix 1 was developed by the Cochrane Effective Practice and Organisation of Care (EPOC) Group Information Specialist in consultation with the authors. We translated it for other databases using appropriate syntax and vocabulary for those databases. We employed the Cochrane Highly Sensitive Search Strategy (sensitivity‐ and precision‐maximizing version, 2008 revision) to identify randomised trials, and the Cochrane EPOC Group methodology filter to identify non‐randomised studies. We managed search results using reference management software and removed duplicates before screening was undertaken. We also searched the Cochrane Database of Systematic Reviews (CDSR) and the Database of Abstracts of Reviews of Effects (DARE) for related systematic reviews.
Searching other resources
Grey literature
We conducted a grey literature search to identify studies not indexed in the databases listed above. We used the following sources.
OpenGrey (www.opengrey.eu).
Grey Literature Report by the New York Academy of Medicine (www.greylit.org).
Agency for Healthcare Research and Quality (AHRQ) (www.ahrq.gov).
Trial registries
We searched the following registries.
The Word Health Organization (WHO) International Clinical Trials Registry Platform (ICTRP) search portal (apps.who.int/trialsearch).
ClinicalTrials.gov (clinicaltrials.gov).
The corresponding search terms and numbers of results are reported.
Other resources
We screened individual journals and conference proceedings (via handsearching).
We reviewed reference lists of all included studies, relevant systematic reviews; reference lists of other publications.
We contacted authors of relevant studies or reviews when necessary to clarify reported published information or to seek unpublished results or data.
We contacted researchers with expertise relevant to the review topic/EPOC interventions.
We conducted cited reference searches for all included studies in citations indices.
Data collection and analysis
Selection of studies
We merged the search results through the use of a reference management software and removed duplicate records. Two review authors (GW, JG) then independently assessed the titles and abstracts of the search results to evaluate their potential eligibility, and discussed the relevance of articles to the topic. The two review authors were not responsible for the selection of studies they were involved in or associated with. Neutral members of the review team were responsible for assessing the eligibility of each study for inclusion in the review. We retrieved the full‐text of all remaining relevant papers and the two review authors assessed these full‐text articles independently, based on the review's inclusion criteria.
We included a 'Characteristics of excluded studies' table in the review. This table included studies that appear to meet the inclusion criteria but were eventually excluded, and we reported the reasons for exclusion (e.g. not a RCT, only one intervention and/or control site for a CBA study, absence of non‐medical prescriber autonomy). If there was uncertainty or disagreement, consensus was reached by discussion with other review authors. We corresponded with authors of included studies if necessary to obtain further information in order to assess compliance with eligibility and confirm data. Within the review, we mapped the flow of information of identified, included, and excluded studies by depicting them in a PRISMA flow diagram (Moher 2009) (Figure 1).
1.
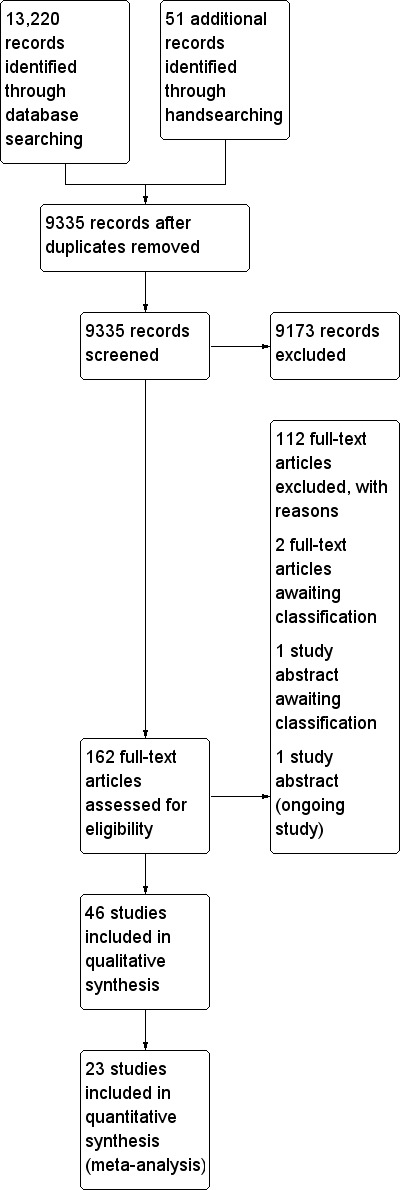
Study flow diagram.
Data extraction and management
We adapted a standard data extraction form based on the Cochrane EPOC Group's data collection checklist (Cochrane EPOC Group 2013a). We designed and assessed the form to suitably extract data on the characteristics of each study, including study design, study participants, the interventions and comparators, outcomes and follow‐up periods, funding source, and interest declarations. Four review authors (GW, JG, DS, KM) independently extracted study characteristics and the outcome data outlined above. We checked the data against each other. If there was uncertainty or disagreement, we reached consensus by discussion or in the presence of an adjudicating third review author, if necessary. We contacted study authors to obtain any missing information. If a study was reported in more than one publication, we extracted the data from all publications into separate data collection forms before combining them.
Assessment of risk of bias in included studies
Two review authors (GW, JG) independently assessed the risk of bias of included studies, with any disagreements resolved by consensus with a third review author (KM). We used the Cochrane EPOC Group nine‐point criteria for RCTs, non‐RCTs, and CBA studies (Cochrane EPOC Group 2015).
Allocation sequence generation.
Allocation concealment.
Baseline outcome measurements.
Baseline characteristics.
Incomplete outcome data.
Knowledge of allocated interventions.
Protection against contamination.
Selective outcome reporting.
Other risks of bias.
We did not find any ITS studies, but we will assess future studies using the seven standard Cochrane EPOC Group criteria for ITS studies (Cochrane EPOC Group 2015).
Intervention independent of other changes.
Prespecified effect shape.
Intervention unlikely to affect data collection.
Blinding.
Incomplete outcome data.
Selective outcome reporting.
Other bias.
We rated each component and categorised it in a 'Risk of bias' table as 'low risk', 'unclear risk', or 'high risk', as described in the Cochrane Handbook for Systematic Reviews of Interventions (Higgins 2011). We documented for each included study a summary assessment of the risk of bias.
Measures of treatment effect
We recorded and reported measures of effect in the same way investigators reported them. We performed all analyses using Cochrane's statistical software, Review Manager 5 (RevMan 2014), and recorded data in the form of a table included in the Cochrane EPOC Group's data extraction template (Cochrane EPOC Group 2013b). For continuous variables, we reported mean differences (MDs) with 95% confidence intervals (CIs) between the intervention and comparison groups. We used a standardised mean difference (SMD) with 95% CI for the same continuous variable measured with different scales. For dichotomous outcomes, we calculated the risk difference (RD) with 95% CI. We planned to calculate the risk ratio (RR), again with 95% CI.
Unit of analysis issues
We assessed whether an appropriate adjustment had been made for clustering in RCTs and CBA studies to avoid unit of analysis errors. If there were insufficient data for re‐analysis, we attempted to correct such errors by contacting study authors to obtain additional data. Determining the intracluster correlation coefficient from additional data or like studies allows adjustment of clustering by inflating the standard error. Where re‐analysis was not possible we reported the point estimate without a standard error or CI and the P value was annotated 're‐analysed'.
Dealing with missing data
We applied the 'Risk of bias' criteria to exclude studies with a high risk of missing data, as they pose serious threats to validity (Higgins 2011). Where appropriate, we contacted study authors for further information. If this was not possible, we reported the number of participants lost to follow‐up. Imputing missing data was only considered when continuous outcomes were reported without measures of variance. We followed the principles of intention‐to‐treat analysis as far as possible.
Assessment of heterogeneity
We found that the range of healthcare settings, differing non‐medical prescribers, differing clinical conditions being managed, and variation in study designs lead to clinical, methodological, and statistical heterogeneity. Assessment of these differences informed the analysis and determined whether results could be statistically combined in a meta‐analysis. The review team made this decision on a consensus basis. We assessed statistical heterogeneity by using the Chi2 test to assess if differences in results are compatible with chance alone using P < 0.10. We quantified statistical heterogeneity using the I2 statistic, as appropriate. We determined that heterogeneity might not be important between 0% and 40%, 30% to 60% represented moderate heterogeneity, 50% to 90% substantial heterogeneity, and 75% to 100% considerable heterogeneity (Higgins 2011).
Assessment of reporting biases
We assessed the risk of publication bias based on the information in the 'Risk of bias' tables and constructed funnel plots for the outcomes of systolic blood pressure and low‐density lipoprotein.
Data synthesis
We used a structured synthesis approach to analyses. After consideration of the small‐study effects of many included studies we used a fixed‐effect model for meta‐analysis and compared outcomes with a random‐effects model. For quantitative synthesis we used Review Manager 5 for statistical analysis (RevMan 2014). Where we could not combine data for a meta‐analysis due to inconsistency of reporting measures, or when it was not applicable to use the average effect across studies of an intervention, we reported in this plain language summaries as appropriate. We included key data elements such as explanatory factors, results, effects, and certainty of evidence in a table for each category of interventions.
Summary of findings
We used a 'Summary of findings' table and GRADEpro GDT software to record results, outcomes, and outcome risks in our structured synthesis (GRADEpro GDT 2014). In addition, we used the five GRADE study considerations (study limitations, consistency of effort, imprecision, indirectness, and publication bias) to assess the certainty of the body of evidence and summarise our confidence in the effects of the interventions by outcome across studies (Atkins 2004). We included the following outcomes in the 'Summary of findings' table: systolic blood pressure, glycated haemoglobin, low‐density lipoprotein, medication adherence, patient satisfaction, adverse events, and health‐related quality of life. We justified all decisions to down‐ or upgrade the certainty of evidence using footnotes, and we made comments to aid the reader's understanding of the review where necessary.
Subgroup analysis and investigation of heterogeneity
Differences in healthcare settings, non‐medical prescriber types, clinical conditions being managed, and study designs informed the assessments of methodological and statistical heterogeneity.
Explanatory variables or effect modifiers which may have influenced the size of intervention effects included the level of prescriber education, study location, patient condition being treated, and adherence to therapy and practice guidelines. The degree of non‐medical prescribing autonomy within and across subgroups may have explained differences in outcomes and limited the applicability of findings.
For consistency across studies, we presented data as subgroups for the clinical outcomes of systolic blood pressure, glycated haemoglobin, and low‐density lipoprotein at six and 12 months. We presented quality of life measures (SF‐36 and SF‐12) as subgroups of physical component and mental component scores.
In considering the type of intervention, we did not undertake a meta‐analysis comparing algorithm prescribing to more autonomous prescribing on clinical outcomes due to considerable heterogeneity.
There were insufficient studies to compare outcomes from different non‐medical prescriber settings e.g. secondary care versus primary care.
Variability in education standards made it difficult to compare non‐medical prescriber subgroups.
Sensitivity analysis
We undertook a sensitivity analysis comparing meta‐analyses outcomes using fixed‐effect and random‐effects analyses for the three clinical surrogate markers of disease: systolic blood pressure; glycated haemoglobin; and low‐density lipoprotein (Table 2). The effect modifier of clustering in RCTs on systolic blood pressure at six months was tested by removing these trials from the meta‐analysis (Margolis 2013 at six months; Khunti 2007 and Margolis 2013 at 12 months; Analysis 1.2; Analysis 1.3). We did not undertake a sensitivity analysis excluding unclear or high risk of bias studies due to the similar risk of bias elements existing within the outcome categories.
1. Fixed‐effect outcomes versus random‐effects for clinical surrogate markers.
| Outcome or subgroup | Fixed‐effect estimate | Random‐effects estimate |
| 1.1 Systolic blood pressure (mmHg) | ‐5.85 (‐6.76 to ‐4.94) | ‐6.59 (‐8.48 to ‐4.71) |
| 1.1.1 6 months | ‐6.76 (‐8.24 to ‐5.27) | ‐7.34 (‐11.09 to ‐3.60) |
| 1.1.2 12 months | ‐5.31 (‐6.46 to ‐4.16) | ‐5.91 (‐7.71 to ‐4.10) |
| 1.2 HbA1c (%) | ‐0.55 (‐0.74 to ‐0.36) | ‐0.55 (‐0.76 to ‐0.35) |
| 1.2.1 HbA1c (6 months) | ‐0.42 (‐0.75 to ‐0.09) | ‐0.45 (‐0.09 to ‐0.01) |
| 1.2.2 HbA1c (12 months) | ‐0.62 (‐0.85 to ‐0.38) | ‐0.62 (‐0.85 to ‐0.38) |
| 1.3 LDL (mmol/L) | ‐0.23 (‐0.28 to ‐0.17) | ‐0.22 (‐0.42 to ‐0.02) |
| 1.3.1 LDL (6 months) | ‐0.25 (‐0.34 to ‐0.17) | ‐0.13 (‐0.39 to 0.12) |
| 1.3.2 LDL (12 months) | ‐0.21 (‐0.29 to ‐0.14) | ‐0.3 (‐0.62 to 0.02) |
LDL: low‐density lipoprotein
1.2. Analysis.
Comparison 1 Non‐medical prescribing group versus usual care, Outcome 2 HbA1c (%).
1.3. Analysis.

Comparison 1 Non‐medical prescribing group versus usual care, Outcome 3 Low‐density lipoprotein (LDL) mmol/L.
Results
Description of studies
See: Characteristics of included studies; Characteristics of excluded studies; Characteristics of studies awaiting classification; Characteristics of ongoing studies.
Results of the search
The database search yielded 13,220 titles. We found 51 additional studies through handsearching. After removing duplicates, we screened 9335 studies and reviewed 162 full‐text articles. We excluded 112 studies that did not meet the inclusion criteria and recorded our reasons for exclusion. We included 46 studies (37,337 participants). Of these, 44 were randomised controlled trials (RCTs), including six cluster‐RCTs (Fairall 2008; Heisler 2012; Khunti 2007; Margolis 2013; Moher 2001; Pagaiya 2005), one controlled trial (Denver 2003), and one controlled before‐and‐after (CBA) study (Thompson 1984). Three studies are awaiting classification (Barton 2013; Neilson 2015; Tsuyuki 2014), and one study is ongoing (Mikuls 2015). Refer to Figure 1 for PRISMA diagram.
Included studies
Non‐medical prescribing studies were included where the health professional (other than a medical practitioner) undertook a high level of autonomous prescribing. This included medication initiation, dosage change, or cessation of medication (with or without guidance from established protocols and guidelines).
Participants
Non‐medical prescribing versus medical prescribing was practised by nurses in 26 studies with 28,621 participants (Ansari 2003; Aubert 1998; Barr Taylor 2003; Becker 2005; DeBusk 1994; Denver 2003; Einhorn 1978; Fairall 2008; Fischer 2012; Hill 2003; Houweling 2009; Houweling 2011; Ishani 2011; Khunti 2007; Klingberg‐Allvin 2015; Kuethe 2011; Litaker 2003; Logan 1979; MacMahon Tone 2009; Moher 2001; New 2003; Pagaiya 2005; Rudd 2004; Spitzer 1974; Tobe 2006; Wallymahmed 2011), and by pharmacists in 20 studies with 8716 participants (Bruhn 2013; Chenella 1983; Choe 2005; Cohen 2011; Ellis 2000; Finley 2003; Heisler 2012; Hirsch 2014; Hunt 2008; Jaber 1996; Magid 2013; Margolis 2013; Marotti 2011; McAlister 2014; Taveira 2010; Taveira 2011; Thompson 1984; Tsuyuki 2015; Tsuyuki 2016; Vivian 2002).
The health professionals delivering the interventions were pharmacists or nurses with varying degrees of formal or informal training. We did not find any studies where other non‐medical health professionals, such as physician assistants undertook prescribing roles. Nurse prescribing was undertaken in the majority of studies by reference to algorithms. While nurses exercised independence in prescribing by algorithm, physicians were usually available for consultation for issues beyond the scope of the algorithm, or for more complex cases or for periodic review.
Pharmacist prescribing was generally undertaken in a more autonomous way, with more reliance on clinical judgement and guidelines rather than restrictive algorithms. This broader practice scope was supported through collaborative practice agreements in the USA and independent or supplementary prescribing in the UK. In addition to their defined prescribing autonomy, non‐medical prescribers in several studies had limits placed on additional prescribing, and required medical prescribing or approval for dose acceleration (Tobe 2006), management of conditions outside the focus of care (Finley 2003; Litaker 2003; New 2003; Taveira 2011; Vivian 2002), and initiation of new drugs (Barr Taylor 2003; DeBusk 1994; New 2003; Rudd 2004).
Excluding the cluster‐RCTs, nine studies had less than 100 patients, seven studies had more than 100 and less than 200 patients, 16 studies had more than 200 and less than 500 patients, five studies had between 500 to 800 patients, and three studies included over 1000 patients. There were six cluster‐RCTs: Fairall 2008, 31 clinics, cohort one 9252 patients, cohort two 6231 patients; Heisler 2012, 16 primary care teams at five medical centres, 4100 patients; Khunti 2007, 20 primary care practices, 1316 patients; Margolis 2013, 16 primary care clinics, 450 patients; Moher 2001, 21 general practices, 1906 patients; Pagaiya 2005, 18 nurse‐led health centres, 3960 patients.
Setting
Four nurse prescribing studies (14,921 participants) were undertaken in low‐ and middle‐income settings within Colombia, South Africa, Uganda, and Thailand (Einhorn 1978; Fairall 2008; Klingberg‐Allvin 2015; Pagaiya 2005). The remainder of studies were undertaken in the high‐income countries, of Australia (1), Canada (6), Ireland (1), Netherlands (3), UK (6), and USA (25). Forty‐two studies were based in ambulatory care settings, including primary care clinics, medical centres, general practices, community pharmacies, and hospital outpatient clinics. Two studies were located in secondary care settings (Chenella 1983; Marotti 2011). One study was set in the workplace (Logan 1979), and one in an aged care setting (Thompson 1984).
Interventions
Pharmacist and nurse interventions were often multifaceted, with prescribing being one element of a complex management approach. For example, in diabetes care, patient education, self‐care, diet, exercise, and follow‐up were factors influencing outcomes, as well as the prescribing of medications.
Outcomes
The majority of studies involved the management of one or more chronic diseases (heart failure, hypertension, diabetes, dyslipidaemias) and risk factors for disease recurrence such as stroke (McAlister 2014), and acute myocardial infarction or heart failure (DeBusk 1994; Khunti 2007). Studies outside of these areas included the management of chronic pain (Bruhn 2013), family planning (Einhorn 1978), HIV treatment (Fairall 2008), incomplete abortion (Klingberg‐Allvin 2015), depression (Finley 2003), and asthma in children, which was the only paediatric study (Kuethe 2011).
Non‐medical clinician collaborative care approaches with physicians (Litaker 2003), or community health workers (Becker 2005; Hill 2003), and interventions with telemonitoring (Magid 2013; Margolis 2013), added to the complexity of determining specific non‐medical prescribing outcomes.
The following 21 studies had a more direct relationship between non‐medical prescribing and the outcome markers of the disease or condition: Ansari 2003 (heart failure); Bruhn 2013 (chronic pain); Chenella 1983 (anticoagulation); Denver 2003 (blood pressure); Fairall 2008 (HIV medications); Hirsch 2014 (blood pressure); Houweling 2009 and Houweling 2011 (glycaemia, blood pressure, lipids); Hunt 2008 (blood pressure); Ishani 2011 (glycaemia, blood pressure, lipids); Jaber 1996 (glycaemia, blood pressure, lipids); Klingberg‐Allvin 2015 (incomplete abortion); Logan 1979 (blood pressure); MacMahon Tone 2009 (glycaemia, blood pressure, lipids); McAlister 2014 (blood pressure, lipids); Marotti 2011 (regular medications); Thompson 1984 (medications in the geriatric setting); Tsuyuki 2015 (blood pressure); Tsuyuki 2016 (glycaemia, blood pressure, lipids); Vivian 2002 (blood pressure); and Wallymahmed 2011 (glycaemia, blood pressure, lipids).
Excluded studies
We excluded studies if the study design did not meet the EPOC criteria for a RCT, controlled clinical trial, CBA or ITS. We excluded studies where we judged that the non‐medical health professional did not have a significant degree of autonomy in their prescribing practice, and prescribing required medical review, consultation, or authorisation.
Risk of bias in included studies
The risk of bias assessment for included studies is presented in the 'Risk of bias' tables, under each study in the section Characteristics of included studies. The risk of bias results are presented in a graphical form in Figure 2.
2.
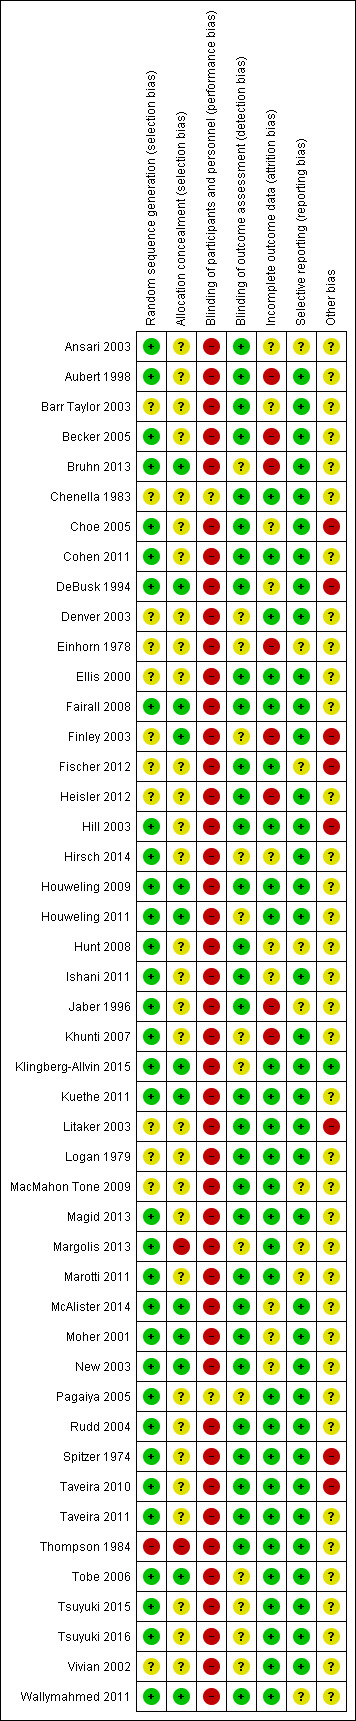
'Risk of bias' summary: review authors' judgements about each risk of bias item for each included study.
Allocation
Thirty‐three of 46 studies (72%) adequately described the random sequence generation and we considered them to be at low risk of bias. Allocation concealment was undertaken in 13 studies (28%), unclear in 31 studies (67%) and with no concealment in two studies (Margolis 2013; Thompson 1984).
Blinding
Blinding of both participants and personnel could not be achieved through the study design in 44 of the 46 included studies. In the Chenella 1983 study it was unclear whether patients would be aware that the pharmacist had undertaken anticoagulation dose determinations, and in the Pagaiya 2005 study, whether the intervention group nurses had undertaken additional training and were using guidelines. Objective clinical outcomes in studies requiring laboratory measures such as glycated haemoglobin and low‐density lipoprotein were coded as blinded outcome assessment. In seven studies, blinded assessment of blood pressure was undertaken (Hill 2003; Hunt 2008; Logan 1979; Magid 2013; McAlister 2014; Moher 2001; Rudd 2004). Where blood pressure assessment was not clear or undertaken by study investigators, we judged this to be an unclear outcome assessment. Ansari 2003 used an independent research assistant to assess β‐blocker use in heart failure.
Incomplete outcome data
Loss to follow‐up of 20% or more in either the intervention or control arms occurred in 14 studies (Aubert 1998; Becker 2005; Bruhn 2013; Choe 2005; Einhorn 1978; Finley 2003; Heisler 2012; Hirsch 2014; Hunt 2008; Ishani 2011; Jaber 1996; McAlister 2014; Moher 2001; New 2003).
Selective reporting
The funnel plots of systolic blood pressure revealed a degree of asymmetry, demonstrating a possible publication bias from an absence of published negative intervention studies. The funnel plot of low‐density lipoprotein studies was asymmetrical, with heterogeneity a consideration.
Other potential sources of bias
The majority of studies had a degree of confounding either by the multifactorial intervention (which made it difficult to distinguish the influence of non‐medical prescribing on outcomes) or by unclear prescribing autonomy or medical influence. The six cluster‐RCTs appropriately accounted for the cluster design.
Effects of interventions
See: Table 1
See: Table 1 for the main comparisons; systolic blood pressure, glycated haemoglobin, low‐density lipoprotein, adherence, adverse events, patient satisfaction, and quality of life.
We had planned to analyse the six comparisons listed in the Types of interventions section, however we only found studies for the following two comparisons: non‐medical prescribing in acute care (secondary care); and non‐medical prescribing in chronic care (primary/ambulatory care).
Non‐medical prescribing in acute care (secondary care)
Primary Outcomes
Studies involving non‐medical prescribing interventions were often characterised by degrees of confounding, including the presence of multiple interventions, patient comorbidities, study duration, differing levels of non‐medical prescriber training, and unclear influences from medical prescribers. However, while recognising these complexities and limitations, care involving non‐medical prescribers resulted in improvements or similar effectiveness to usual care for a range of clinical outcomes and surrogate disease markers.
We found two studies (438 participants) where non‐medical prescribing was practised in an acute/secondary care setting (Chenella 1983; Marotti 2011).
1. Systolic blood pressure
Outcome not reported.
2. Glycated haemoglobin
Outcome not reported.
3. Low‐density lipoprotein
Outcome not reported.
4. Proportion of prescribers, medical and non‐medical, appropriately adhering to practice guidelines
Pharmacist prescribers adjusted anticoagulant therapy, as well as an experienced physician, in the independent management of anticoagulation therapy for inpatients. There were no significant differences between groups for mean heparin and warfarin doses, partial thromboplastin time, days to reach therapeutic levels, or mean prescribed and simulated heparin doses (Chenella 1983; Table 3).
2. Outcomes of studies not included in meta‐analyses.
| Study | Patient group | Comparison | Outcome |
| Bruhn 2013 | Chronic pain | To compare the effectiveness of pharmacist medication review with or without pharmacist prescribing with standard care | Compared with baseline the Chronic Pain Grade improved in prescribing arm 47.7% (21/44; P = 0.003) and review arm 38.6% (17/44; P = 0.001) but not TAU 31.3% (15/48; ns) SF‐12 mental component score showed no effect for prescribing or review arms and deterioration in TAU arm. Hospital Anxiety and Depression scores improved in prescribing arm for depression (P = 0.022) and anxiety (P = 0.007) and between groups (P = 0.022 and P = 0.045 respectively). |
| Chenella 1983 | Anticoagulation | Pharmacist versus physician independent management of anticoagulant therapy for inpatients | There were no differences between groups for mean heparin and warfarin doses, partial thromboplastin time, days to reach therapeutic levels, mean prescribed and simulated heparin doses. |
| Choe 2005 | Type 2 diabetes | Pharmacist case management versus usual medical care | Patients in the pharmacist case managed group received greater reductions in HbA1c (2.1% vs 0.9%, P = 0.03). Three of five process measures were conducted more frequently in the intervention group than control group. LDL measurement (100% vs 85.7%, P = 0.02), retinal examination (97.3% vs 74.3%, P = 0.004), monofilament foot screening, (92.3% vs 62.9%, P = 0.002). |
| Einhorn 1978 | Family planning | Family planning services provided by nurses versus physicians | Nurses' clients were as equally as successful as physicians in continuing contraceptive use and preventing pregnancy. Nurses were less likely than physicians to provide patients on their first visit with IUDs, prescribe oral contraceptives, or sterilisation. Nurses were more likely to give temporary prescriptions than physicians until the next visit (25% vs 16%, P < 0.001) for reasons including possible pregnancy and patients not menstruating. |
| Ellis 2000 | Dyslipidaemia | Clinical pharmacists providing pharmaceutical care in addition to usual medical care versus usual medical care | The absolute change in total cholesterol (17.7 vs 7.4 mg/dL, P = 0.028) and LDL (23.4 vs 12.8 mg/dL, P = 0.042) was greater in the intervention than control group. |
| Fairall 2008 | HIV | Prescribing of antiretroviral treatment by nurses versus doctors | Cohort 1 ‐ not receiving antiretrovirals. Time to death did not differ (HR 0.94, 95% CI 0.76 to1.15). Cohort 2 ‐ received antiretrovirals for at least six months. Viral load suppression 12 months after enrolment was equivalent in intervention and control. Risk difference 1.1% (95% CI ‐2.4 to 4.6). |
| Finley 2003 | Depression | Collaborative care model of clinical pharmacists providing drug therapy management and treatment follow‐up versus usual care | Clinical improvements noted in both groups but not significant. Intervention group had higher drug adherence at six months (67% vs 48%; OR 2.17, 95% CI 1.04 to 4.51; P = 0.038) |
| Fischer 2012 | Lipid control in diabetes | Algorithm‐driven telephone care by nurses as an adjunct to usual care versus usual care | The percentage of patients with an LDL < 100 mg/dL increased from 52% to 58.5% in the intervention group and decreased from 55.6% to 46.7% in the control group (P < 0.01). The intervention did not affect glycaemic and BP outcomes |
| Heisler 2012 | Blood pressure control in diabetes | A pharmacist‐led intervention (Adherence and Intensification of Medications) in patients with diabetes and poor BP control versus usual care | The mean systolic BP decrease from 6 months before to 6 months after the 14‐month intervention was not different (8.9 mmHg decline in the intervention arm and 9.0 mmHg decline in the control arm). There was no difference in the mean HbA1c and LDL levels between groups after the end of the intervention period (examining 12 months). At the end of the first quarter after activation, there was a significantly greater drop in systolic BP in the intervention group versus control, 9.7 mmHg vs 7.2 mmHg; MD 2.4 mmHg (95% CI 1.5 to 3.4 P < 0.001). |
| Houweling 2011 | Type 2 diabetes | Primary care nurse management of type two diabetes versus management by GPs | After 14 months between‐group differences for reduction in HbA1c, BP, and lipid profile were not significant. Mean systolic and diastolic BPs were lower in both groups. Most process indicators were significantly better in the nurse care group. More patients were satisfied with their care in the nurse group however the physical component of the SF‐26 was better in the GP group. |
| Ishani 2011 | Cardiovascular risk factors in diabetes | Nurse case management versus usual care to improve hypertension, hyperglycaemia, and hyperlipidaemia in veterans with diabetes | A greater number of patients in the nurse case management had all three measures under control (21.9% vs 10.1%, P < 0.01). A greater number of intervention group participants achieved individual treatment goals. HbA1c < 8% (73.7% vs 65.8% P = 0.04), BP < 130/80 mmHg (45% versus 25.4%, P < 0.01) but not for LDL < 100 mg/dL (57.6% vs 55.4%, P = 0.61). |
| Jaber 1996 | Non‐insulin dependent diabetes | Pharmacists providing pharmaceutical care versus physicians | Improvement was seen in glycated haemoglobin in the intervention group at 4 months (9.2% ± 2.1 vs 12.1% ± 3.7, P = 0.003), and fasting plasma glucose (8.5 ± 2.3 vs 11.0 ± 3.9 mmol/L, P = 0.015). There was little or no change within or between groups for BP, lipid profile, renal function, weight, or quality of life measures. |
| Klingberg‐Allvin 2015 | Women with signs of incomplete abortion | Midwives diagnosing and treating incomplete abortion with misoprostol compared to physicians | 452 (95.8%) women in the midwife group and 467 (96.7%) in the physician group had complete abortion. The model risk difference for midwife versus physician group was ‐0.8% (95% CI ‐2.9 to 1.4) falling within the predefined equivalence range (‐4% to 4%). |
| Kuethe 2011 | Children with asthma | Non‐inferiority of care provided by a hospital‐based specialised asthma nurse versus a GP or paediatrician | The corrected daily dose of inhaled corticosteroids as well as the percentage of children prescribed long‐acting beta agonists/inhaled corticosteroids was not significantly different between groups at one and two years. |
| Logan 1979 | Hypertension | Treatment of hypertension in the workplace by nurses versus treatment in the community by the family doctor | Patients in the nurse group were more likely to be put on antihypertensive medications (94.7% vs 62.7%, P < 0.001), to reach goal BP in the first six months (48.5 vs 27.5%, P < 0.001) and to take drugs prescribed (67.6 vs 49.1%, P < 0.005). |
| Marotti 2011 | Postoperative patients | Pharmacist medication history and supplementary prescribing versus pharmacist medication history versus usual care | The marginal mean number of missed doses per patient was 3.21 (95% CI 2.89 to 3.52) in the control group, which was reduced in the pharmacist prescribing group 1.07 (95% CI 0.90 to 1.25, P = 0.002) but not in the pharmacist history group 3.30 (95% CI 2.98 to 3.63). The number of medications charted at an incorrect dose or frequency was reduced in the pharmacist history group. The pharmacist prescribing group had less dose errors than the pharmacist history group (P = 0.004). |
| Moher 2001 | Secondary prevention of coronary heart disease in primary care | Audit group verus GP recall group versus nurse recall group (disease register and patient recall to nurse‐led clinic) | Little or no difference occurred in assessment between the nurse and GP recall group. Mean BP, total cholesterol, cotinine levels varied little between groups as did prescribing of hypotensive and lipid‐lowering agents. Prescribing of antiplatelet drugs was higher in the nurse recall group vs GP recall group, MD 8% (95% CI 1% to 15%, P = 0 .031). |
| Pagaiya 2005 | Primary care nurses | Education and implementation of prescribing and clinical guidelines by nurses in rural health centres versus usual nurse care | Antibiotic prescribing in children 0 to 5 years for respiratory tract infections fell, (42% at baseline to 27% at follow‐up, control 27% to 30%, P = 0.022). Guidelines had no effect on prescribing antibiotics for diarrhoea but oral rehydration prescribing increased. Diazepam prescribing for adults fell, (intervention 17% to 10%, control 21% to 18%, P = 0.029). |
| Spitzer 1974 | Patients attending primary care | Nurse practitioners versus physicians plus conventional nurse in primary care | Similar mortality experience, no differences in physical functioning capacity, social or emotional function. Quality of care similar. In 510 prescriptions, an adequate rating was given to 75% of conventional group and 71% in the nurse practitioner group, probably leading to little difference between groups. |
| Taveira 2010 | Type 2 diabetes | A pharmacist‐led Veterans affairs Multidisciplinary Education and Diabetes Intervention for Cardiac risk reduction (VA‐MEDIC) plus usual care versus usual care | After four months there was a difference (P < 0.05) in the percentage of VA‐MEDIC patients versus controls in attaining target goals for systolic BP < 130 mmHg and HbA1c < 7% but not lipid control or tobacco use. |
| Thompson 1984 | Drug therapy in a geriatric setting | Drug therapy prescribing and patient care management by clinical pharmacists versus usual care | The clinical pharmacist group probably had a lower number of deaths (P = 0.05), a higher number of patients being discharged to lower levels of care (P = 0.03) and a lower average number of drugs per patient (P = 0.04). |
| Tsuyuki 2016 | Patients with cardiovascular risk factors associated with hypertension, diabetes, dyslipidaemia and smoking | Community pharmacist care versus usual care | At 3 months the intervention group patients had greater improvements in LDL cholesterol (‐ 0.2 mmol/L, P < 0.001, systolic BP (‐9.37 mmHg, P < 0.001), glycosylated haemoglobin (‐0.92%, P < 0.001) and smoking cessation (20.2%, P < 0.002). |
BP: blood pressure CI: confidence interval GP: general practitioner HbA1c: glycated haemoglobin HR: hazard ratio IUD: inter uterine device LDL: low‐density lipoprotein MD: mean difference OR: odds ratio TAU: treatment as usual
5. Proportion of patients demonstrating medication adherence
Outcome not reported.
6. Proportion of patients and items appropriately prescribed or deprescribed
Preoperative medication history taking and prescribing by a pharmacist improved the accuracy of medication documentation and significantly reduced missed doses of regular medication for elective surgical patients. The marginal mean number of missed doses per patient was 3.21 (95% confidence interval (CI) 2.89 to 3.52) in the control group, which was significantly reduced in the pharmacist prescribing group 1.07 (95% CI 0.90 to 1.25; P = 0.002) (Marotti 2011; Table 3).
7. Patient satisfaction, where measured by a validated tool as part of an effectiveness study
Outcome not reported.
8. Non‐medical prescriber versus medical prescriber waiting time to care
Outcome not reported.
9. Non‐medical prescribers adversely affecting the health outcomes of patients through medication errors, prescribing errors, adverse events, wrong diagnoses or treatment, increased hospitalisations, or representations for medical care
Chenella 1983 reported no patients had major bleeding but four patients in the pharmacist prescriber group had minor bleeding (one patient had a bleeding facial laceration on admission but a normal prothrombin time). One patient in the physician prescriber group died, after receiving heparin and warfarin for a stroke in evolution, but there was no evidence of bleeding.
Secondary Outcomes
Patient‐reported outcomes
1. Health‐related quality of life
Outcome not reported.
Non‐medical prescriber outcomes
1. Job satisfaction, skills utilisation, education needs, and workload effects
Outcome not reported.
Resource‐use outcomes
1. Medical time saved by non‐medical prescribers
Outcome not reported.
2. Non‐medical prescriber versus medical prescriber prescription volume and cost, patient out‐of‐pocket expenses, service costs, deprescribing rate, and cost
There was little or no difference in amount of anticoagulant drugs prescribed by pharmacists compared to a physician (Chenella 1983; Table 3).
3. Increased resource use for providing the intervention and for providing subsequent care such as hospitalisations, emergency department visits, and outpatient visits.
Outcome not reported.
Non‐medical prescribing in chronic care (primary/ambulatory care)
We included 40 studies in this comparison. We included ambulatory care clinics for chronic disease management located with secondary care hospitals in this subgroup (Denver 2003; Houweling 2009; Jaber 1996; Kuethe 2011; MacMahon Tone 2009; McAlister 2014; New 2003). Two studies were undertaken in the community pharmacy setting (Tsuyuki 2015; Tsuyuki 2016,).
Meta‐analyses were undertaken for systolic blood pressure, glycated haemoglobin, and low‐density lipoprotein using the fixed‐effect method for outcomes at six and 12 months (Figure 3; Figure 4; Figure 5). These studies were skewed toward either nurse or pharmacist prescribers, namely, systolic blood pressure at six months (3 nurse studies, 8 pharmacist studies), systolic blood pressure at 12 months (10 nurse studies, 2 pharmacist studies), glycated haemoglobin at six months (1 nurse study, 2 pharmacist studies) glycated haemoglobin at 12 months (6 nurse studies, 0 pharmacist studies), low‐density lipoprotein at six months (4 nurse studies, 2 pharmacist studies), low‐density lipoprotein at 12 months (7 nurse studies, 0 pharmacist studies).
3.
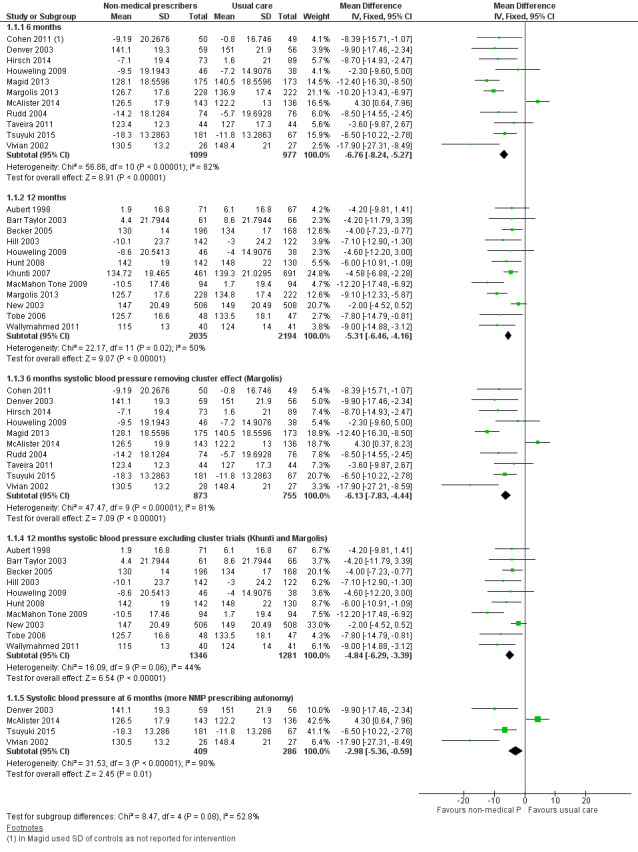
Forest plot of comparison: 1 Non‐medical prescribing group versus usual care, Outcome: 1.2 Systolic blood pressure mmHg.
4.
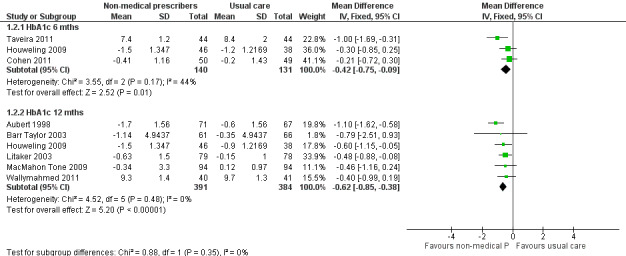
Forest plot of comparison: 1 Non‐medical prescribing group versus usual care, Outcome: 1.1 HbA1c (%).
5.
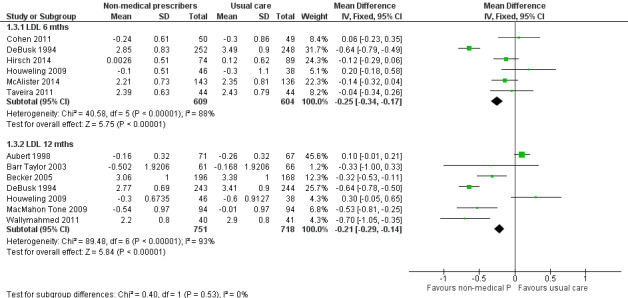
Forest plot of comparison: 1 Non‐medical prescribing group versus usual care, Outcome: 1.3 Low‐density lipoprotein (LDL) mmol/L.
Moderate or considerable heterogeneity was evident in all subgroups apart from the glycated haemoglobin 12‐month subgroup for which heterogeneity might not be important given an I2 = 0%. While the degree of heterogeneity provides a caution, studies which contained non‐medical prescribing as an intervention component showed improvement in three surrogate markers of disease; systolic blood pressure, glycated haemoglobin, and low‐density lipoprotein.
A single study compared pharmacist case management versus the active control of nurse‐led case management and feedback to primary care physicians for medication adjustment in the secondary prevention after minor stroke (McAlister 2014). Improvements in both systolic blood pressure and low‐density lipoprotein guideline targets were observed in both the pharmacist group (43.4%) and nurse‐led group (30.9%) after six months (absolute difference 12.5%, P = 0.03). Multivariable analyses confirmed the greater attainment of targets in the pharmacist group (adjusted odds ratio (OR) 2.31, 95% CI 1.29 to 4.2; P = 0.005, adjusted for age, comorbidities, sex, smoking status, and waist circumference). Both groups had similar reductions in systolic blood pressure during the trial and the overall result was driven by a higher proportion of patients meeting low‐density lipoprotein targets in the pharmacist‐led group versus the nurse‐led group (51.1% versus 33.8%, P = 0.003).
Primary Outcomes
1. Systolic blood pressure
Eleven ambulatory care studies (2076 participants) reporting systolic blood pressure at six months showed a mean difference (MD) favouring the non‐medical prescribing group compared to usual care of ‐6.76 mmHg (95% CI ‐8.24 to ‐5.27; Analysis 1.1), but there was considerable heterogeneity (I2 = 82%, overall effect P < 0.00001) (Cohen 2011; Denver 2003; Hirsch 2014; Houweling 2009; Magid 2013; Margolis 2013; McAlister 2014; Rudd 2004; Taveira 2011; Tsuyuki 2015; Vivian 2002). At 12 months, 12 ambulatory care studies (4229 participants) showed a MD favouring the non‐medical prescribing group of ‐5.31 mmHg (95% CI ‐6.46 to ‐4.16; Analysis 1.1) with moderate heterogeneity (I2 = 50%, overall effect P < 0.00001) (Aubert 1998; Barr Taylor 2003; Becker 2005; Hill 2003; Houweling 2009; Hunt 2008; Khunti 2007; MacMahon Tone 2009; Margolis 2013; New 2003; Tobe 2006; Wallymahmed 2011). The test for subgroup differences was not significant (I2 = 56.3%, P= 0.13) (Figure 3).
1.1. Analysis.
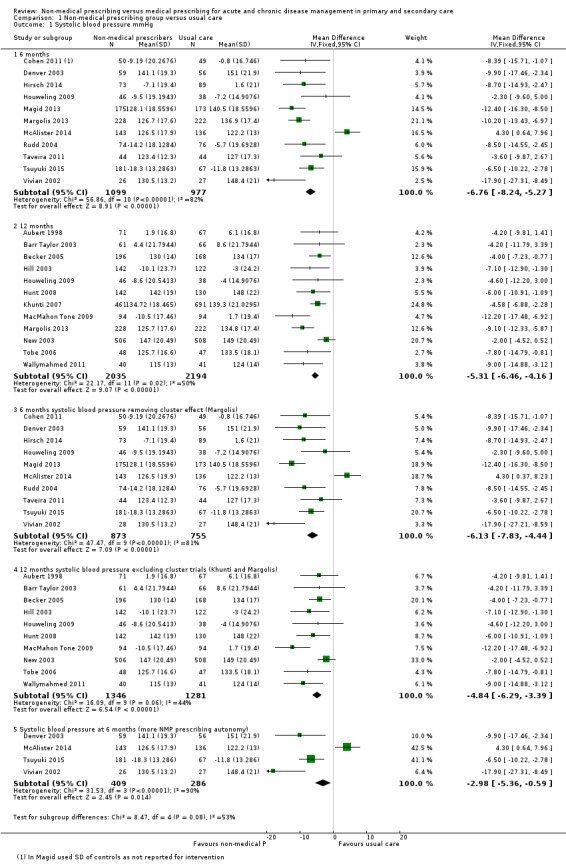
Comparison 1 Non‐medical prescribing group versus usual care, Outcome 1 Systolic blood pressure mmHg.
The systolic blood pressure effect estimate at six months for the fixed‐effect model was MD ‐6.76 mmHg, 95% CI ‐8.24 to ‐5.27 compared to the random‐effects estimate (MD ‐7.34 mmHg, 95% CI ‐11.09 to ‐3.60). At 12 months the respective comparison was MD ‐5.31 mmHg, 95% CI ‐6.46 to ‐4.16 versus MD ‐5.91 mmHg, 95% CI ‐7.71 to ‐4.10 (Table 2). There was a moderate‐certainty of evidence (Table 1).
Excluding the cluster‐RCT at six months (Margolis 2013), the effect estimate was MD ‐6.13 mmHg, 95% CI ‐7.83 to ‐4.44; 10 studies, 1628 participants (Analysis 1.1.3). Excluding the cluster‐RCTs at 12 months (Khunti 2007; Margolis 2013), the effect estimate was MD ‐4.84 mmHg, 95% CI ‐6.29 to ‐3.39; 10 studies, 2627 participants (Analysis 1.1.4).
The subgroup analysis of four studies (695 participants) where non‐medical prescribers demonstrated a higher level of prescribing autonomy in the control of systolic blood pressure showed: fixed‐effect MD ‐2.98 mmHg, 95% CI ‐5.36 to ‐0.59; P = 0.01, compared with a random‐effects model MD ‐6.78 mmHg, 95% CI ‐15.38 to 1.81; P = 0.12, with considerable heterogeneity I2 = 90% (Analysis 1.1.5; Figure 3).
2. Glycated haemoglobin
For glycated haemoglobin, three ambulatory care studies at six months demonstrated a MD favouring the non‐medical prescribing group of ‐0.42% (95% CI ‐0.75 to ‐0.09; 271 participants; Analysis 1.2) with moderate heterogeneity (I2 = 44%, overall effect P < 0.01) (Cohen 2011; Houweling 2009; Taveira 2011). At 12 months, six ambulatory care studies managing glycated haemoglobin showed a MD favouring the non‐medical prescribing group of ‐0.62% (95% CI ‐0.85 to ‐0.38; 775 participants) with minimal heterogeneity (I2 = 0%, overall effect P < 0.00001; Analysis 1.2) (Aubert 1998; Barr Taylor 2003; Houweling 2009; Litaker 2003; MacMahon Tone 2009; Wallymahmed 2011). The test for subgroup differences was not significant (I2 = 0%, P = 0.35; Figure 4). For fixed‐effect versus random‐effects estimates refer to Table 2. There was a high‐certainty of evidence (Table 1; Table 2).
3. Low‐density lipoprotein
Six ambulatory care studies (1213 participants) for low‐density lipoprotein management at six months showed a MD favouring the non‐medical prescribing group of ‐0.25 mmol/L (95% CI ‐0.34 to ‐0.17), but these studies demonstrated considerable heterogeneity (I2 = 88%, overall effect P < 0.00001; Analysis 1.3) (Cohen 2011; DeBusk 1994; Hirsch 2014; Houweling 2009; McAlister 2014; Taveira 2011). At 12 months the MD favouring the non‐medical prescribing group in seven ambulatory care studies was ‐0.21 mmol/L (95% CI ‐0.29 to ‐0.14; 7 studies, 1469 participants; Analysis 1.3). The studies demonstrated considerable heterogeneity (I2 = 93%; overall effect P < 0.00001) (Aubert 1998; Barr Taylor 2003; Becker 2005; DeBusk 1994; Houweling 2009; MacMahon Tone 2009; Wallymahmed 2011). The test for subgroup differences was not significant (I2 = 0%, P = 0.53; Figure 5). There was moderate‐certainty of evidence (Table 1; Table 2).
Further exploration of the high heterogeneity in the six‐month low‐density lipoprotein study was undertaken by examining the differences in pharmacist and nurse prescribing. It was found that heterogeneity might not be important in the four pharmacist studies (629 participants) (MD ‐0.09, 95% CI ‐0.20 to 0.02; I2= 0%; Analysis 1.4), which did not yield a significantly different overall effect (P = 0.1). Considerable heterogeneity existed in the two nursing studies (584 participants) (MD ‐0.52, 95% CI ‐0.67 to ‐0.38; I2 = 94%; Analysis 1.4), with a significant overall effect (P < 0.00001). The test for overall effect for both subgroups had considerable heterogeneity and was significant (I2 = 88%, P < 0.00001). The subgroup differences showed very high heterogeneity and were significant (I2 = 95.6%, P < 0.00001). For fixed‐effect versus random‐effects estimates refer to Table 2.
1.4. Analysis.
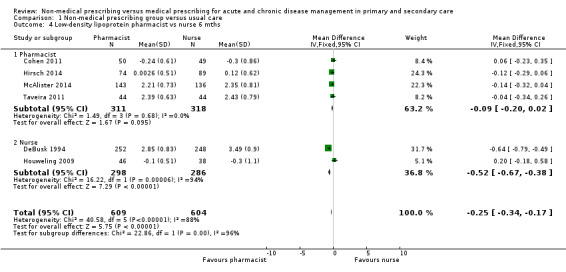
Comparison 1 Non‐medical prescribing group versus usual care, Outcome 4 Low‐density lipoprotein pharmacist vs nurse 6 mths.
4. Proportion of prescribers, medical and non‐medical, appropriately adhering to practice guidelines
Adherence to practice guidelines was difficult to quantify across studies. Intervention group prescribing was usually aimed at treating a target based on approved therapeutic guidelines. Usual care prescribing may have been based on supplied guidelines, education, or an assumed knowledge of current guidelines.
5. Proportion of patients demonstrating medication adherence (Analysis 1.5 and 1.6)
Medication adherence was assessed in 10 studies using a number of approaches including Morisky Medication Adherence Scale, medication possession ratio, patient report, pill count, electronic drug event monitoring, and pharmacy medication refill information (Table 4). Medication adherence was reported as high in intervention and usual care groups across studies. There was probably little or no difference between groups in six studies (Bruhn 2013; Cohen 2011; Finley 2003; Hunt 2008; Magid 2013; Vivian 2002), and an improved outcome favouring the intervention group in two studies (Logan 1979; Rudd 2004). The study by Margolis 2013 found an improved outcome favouring the intervention group at six months, but no difference between groups at 12 and 18 months. Medication adherence outcomes could not be assessed in the study by Hirsch 2014.
3. Primary outcome ‐ medication adherence.
| Study | Medication adherence measure | Outcome |
| Bruhn 2013 | Morisky Medication Adherence Scale | Assessed adherence at baseline with patients in both groups reporting full adherence. |
| Cohen 2011 | Medication possession ratios | The medication possession ratio (total days' supply of medication divided by total number of expected medication intake days) used in this study found little or no difference between the pharmacist prescribing arm and usual care, even though more medications were prescribed in the pharmacist arm. Adherence was high and ranked above 80%. |
| Finley 2003 | Medication possession ratios | Determined the medication possession ratio from computerised prescription refill records. Full drug adherence was defined as a medication possession ratio value of 0.83 or more during the six‐month follow‐up. Medication possession ratios at three and six months were probably not different between intervention and control arms even though patients in the intervention group were more likely to change antidepressants. An additional measure, the Health Plan Employer Data Information Set guidelines for successful antidepressant treatment, showed there was little or no difference between groups in compliance with the early phase of treatment, but there was a significant difference in compliance in the intervention group continuation phase. |
| Hunt 2008 | Morisky Medication Adherence Scale |
Reported no differences at study end in the proportions of subjects reporting high medication adherence. There was an improvement in adherence with the groups from baseline to study end. Adherence did not predict goal attainment. |
| Hirsch 2014 | Not described | Non‐adherence was identified in five of 33 patients with drug therapy problems at baseline, one of 12 patients at six months and one of four patients at nine months. |
| Logan 1979 | Patient claim and pill counts | High adherence was judged if patients claimed to be taking their medication as instructed and 80% or more of drugs prescribed were consumed as determined by pill counts. In the nurse intervention group patients were more adherent than the control group. |
| Magid 2013 | Medication possession ratios | Little or no difference between groups in the mean medication possession ratio adherence score over the six‐month study. |
| Margolis 2013 | Morisky Medication Adherence Scale |
Reported adherence measured by the Morisky scale modified for blood pressure medications. Adherence to antihypertensive medications at six months increased in the pharmacist intervention telemonitoring group but decreased in the usual care group. There was probably no difference between groups at 12 and 18 months. |
| Rudd 2004 | Electronic drug event monitor | The drug event monitor provided the average number of days on which patients took the correct number of doses prescribed. While adherence was high in both groups, the nurse‐managed patient group had higher adherence than usual care. |
| Vivian 2002 | Patient self‐reporting and drug refill information from the pharmacy | Non‐adherence was judged as missing more than three doses a week or pharmacy records indicated a failure to refill drugs within two weeks after the scheduled refill date. Little or no difference in adherence between or within the two groups at baseline or the end of the study was found. Over 90% of patients in both groups indicated they took their drugs as directed. The study was underpowered to detect a significant difference in adherence. |
A meta‐analysis was undertaken for four studies (Cohen 2011; Finley 2003; Magid 2013; Rudd 2004), with adherence data captured as continuous variables with an outcome probably favouring the intervention group, standardised mean difference (SMD) 0.15 (95% CI 0.00 to 0.30; 700 participants, overall effect P = 0.05) and moderate heterogeneity I² = 38% (Analysis 1.5). Four studies (935 participants) with dichotomous adherence data (Hunt 2008; Logan 1979; Margolis 2013; Vivian 2002), showed little adherence difference (risk difference (RD) 0.06, 95% CI ‐0.00 to 0.12; P = 0.05) and moderate heterogeneity I2 = 67% (Analysis 1.6). There was a moderate‐certainty of evidence (Table 1; Table 2).
1.5. Analysis.
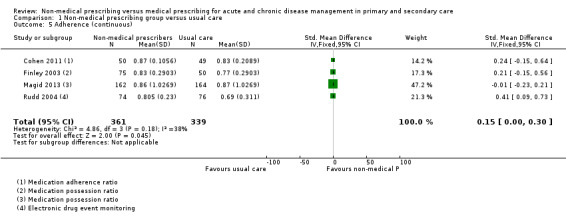
Comparison 1 Non‐medical prescribing group versus usual care, Outcome 5 Adherence (continuous).
1.6. Analysis.
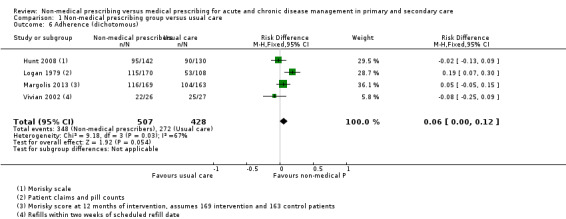
Comparison 1 Non‐medical prescribing group versus usual care, Outcome 6 Adherence (dichotomous).
6. Proportion of patients and items appropriately prescribed or deprescribed
In the aged care setting the pharmacist prescribed 2.2 fewer drugs per patient than medical colleagues, comparing before‐and‐after study periods (Thompson 1984). Tsuyuki 2015 reported community pharmacist prescribers discontinued 76 antihypertensive drugs in 181 intervention group patients compared to 15 antihypertensive drugs being discontinued in 67 usual care group patients.
7. Patient satisfaction, where measured by a validated tool as part of an effectiveness study
Patient satisfaction was reported in 14 studies (7514 participants) (Table 5). Validated tools assessing the overall satisfaction with care were included in six studies, namely, diabetes care (Houweling 2009; Houweling 2011), hypertension care (Hunt 2008), clinical pharmacist care (Hirsch 2014), and general care (Litaker 2003; Margolis 2013). The majority of satisfaction surveys were not referenced or were locally developed. Some aspects important in the prescribing process were covered in overall satisfaction assessments, e.g. the quantity and quality of contact (Finley 2003; Houweling 2011; Margolis 2013). The locally developed satisfaction survey by Bruhn 2013 focused on the prescribing intervention. Patients were generally positive about the pharmacist prescribing service, 85% (39/46) were totally satisfied, while 9% (4/44) would have preferred to see their general practitioner (GP). Overall, there was a moderate‐certainty of evidence (Table 1; Table 2). Studies looking at medical provider satisfaction with non‐medical prescribers were limited in number and scope (Barr Taylor 2003; Bruhn 2013), but generally positive.
8. Non‐medical prescriber versus medical prescriber waiting time to care
Outcome not reported.
9. Non‐medical prescribers adversely affecting the health outcomes of patients through medication errors, prescribing errors, adverse effects, wrong diagnoses or treatment, increased hospitalisations, or representations for medical care
Adverse events were reported in 18 of the 46 studies (18,400 participants) (Table 6). There was probably little or no difference in adverse events between the intervention and usual care groups in nine studies (Ansari 2003; Aubert 1998; Fairall 2008; Ishani 2011; Klingberg‐Allvin 2015; Kuethe 2011; Spitzer 1974; Taveira 2011; Tobe 2006), with a probable increase in adverse events in the usual care group in two studies (New 2003; Thompson 1984). We are uncertain whether the intervention has an effect on adverse events in the remaining studies due to limited data reporting. The relationship between increased medication use in intervention groups and adverse events remains uncertain. Overall, there was a low‐certainty of evidence between the intervention and adverse events (Table 1; Table 2).
5. Primary outcome ‐ adverse events.
| Study | Adverse event |
| Ansari 2003 | There was little or no difference in the proportions of patients between control (provider education), nurse facilitator and provider/patient notification for hospitalisations and emergency room visits. There were few deaths with the higher number (7) in the control group which had more patients on haemodialysis, two of whom died. |
| Aubert 1998 | There appeared little or no difference between intervention and usual care groups for severe low blood glucose events at baseline and during the study period. Mean weight gain differences from insulin treatment in each group or mean weight loss differences with oral agents showed little or no difference. |
| Chenella 1983 | Reported no patients had major bleeding, but four patients in the pharmacist prescriber group had minor bleeding (one laceration before hospital). One patient in physician prescriber group died, after receiving heparin and warfarin for a stroke in evolution but there was no evidence of bleeding. |
| DeBusk 1994 | The first year mortality was 3.4% in usual care and 4.1% in the intervention group. However, a longer study is required to show a difference, namely, 2 years plus a 5‐ to 10‐year follow‐up. |
| Fairall 2008 | The time to death did not differ between primary care nurses and doctors initiating therapy. |
| Hirsch 2014 | Pharmacists identified two adverse drug reactions from 33 drug therapy problems at baseline, two from 12 at six months and none at nine months. |
| Ishani 2011 | Adverse events were similar between groups, with no participants withdrawing from the study due to an adverse event, and there was no difference in the rate of hospitalisation or death between the groups. |
| Jaber 1996 | Reported 17 hypoglycaemic reactions in the intervention group and two in the control group. All were considered mild to moderate. The difference was possibly related to increased training in recognition, documentation, and questioning in the intervention group. Three patients were hospitalised, two in the control and one in the intervention group, and these appear unrelated to treatment. |
| Klingberg‐Allvin 2015 | In treating incomplete abortion bleeding, the same or less than normal menstrual cycle was probably not different between the intervention midwife and usual care physician groups. There was little difference in pain after treatment as assessed by a visual analogue scale. 30 (6%) of women reported unscheduled visits in the midwife group and 18 (4%) in the physician group. Reasons included vaginal bleeding and abdominal pain. Reported side‐effects after treatment were similar in both groups (nausea, vomiting, abdominal pain, chills, and fever). |
| Kuethe 2011 | There were no differences between groups (general practitioner, paediatrician, asthma nurse) with respect to the number of severe asthma exacerbations as expressed by the number of prednisolone courses. |
| MacMahon Tone 2009 | Forty drug‐related adverse events occurred in the intensive intervention group as compared to 10 in the standard group. While the adverse events are known for the drugs in question no further comment was offered. |
| McAlister 2014 | Reported few clinical events at six months in a pharmacist‐led intervention for secondary prevention after ischaemic stroke. There were nine cardiovascular events and no deaths in the pharmacist group versus eight cardiovascular events and one death in the nurse‐led group. |
| Margolis 2013 | There were 60 adverse events in usual care and 49 in the telemonitoring group; most events were non‐cardiac hospitalisations. There were two allergic reactions to blood pressure medication in the usual care group, six events in the telemonitoring group related to hypotension, dizziness, loss of consciousness which compared to one in the usual care group, four events in usual care related to hypertension versus one in the intervention group. |
| New 2003 | In patients randomised to specialist nurse‐led clinics for blood pressure control, lipid control or both, there were less deaths in the intervention group (25, (3.2%) versus 36 (5.7%) in the usual care group) odds ratio 0.55 (95% confidence interval 0.32 to 0.92) P = 0.02. |
| Spitzer 1974 | During the 12‐month experimental period, there were four deaths in the nurse practitioner group and 18 in the conventional care group. There was probably little or no difference in the crude death rate between groups. |
| Taveira 2011 | There were no diabetes‐related admissions or deaths for either group during the six‐month study. |
| Thompson 1984 | The pharmacist prescribing group in a geriatric setting may have had a slightly lower 12‐month mortality than usual care (3/67 versus 10/72, P = 0.05). |
| Tobe 2006 | The incidence of adverse events probably did not differ between the intervention (home care nurse group) and control (primary care physician group) in First Nations people with diabetes and hypertension. Ten patients in the intervention group and seven in the control group required admission to hospital for adverse events. |
10. Other surrogate outcome markers
Studies of surrogate outcome markers not included in the meta‐analyses reported either probable improvements favouring the intervention over usual care (Choe 2005; Ellis 2000; Fischer 2012; Logan 1979); little difference in outcome (Houweling 2011; Moher 2001); or uncertainty of outcome, with surrogate markers showing a combination of probable improvements or little difference in outcomes (Heisler 2012; Ishani 2011; Taveira 2010; Table 3).
Secondary outcomes
Patient‐reported outcomes
1. Health‐related quality of life
Quality of life measures reflected general non‐medical prescriber care compared to usual care. We combined physical and mental component scores for the Short Form‐12 (SF‐12) and Short Form‐36 (SF‐36) in a meta‐analysis. Eight studies (2385 participants) were included in the physical component meta‐analysis (Bruhn 2013; Cohen 2011; Houweling 2011; Hunt 2008; Khunti 2007; Litaker 2003; Margolis 2013; Vivian 2002); six studies (2246 participants) contributed to the mental component meta‐analysis (Cohen 2011; Houweling 2011; Hunt 2008; Khunti 2007; Litaker 2003; Margolis 2013). The physical subgroups showed a small effect (MD 1.17, 95% CI 0.16 to 2.17, P = 0.02) favouring intervention, with low heterogeneity, I² = 17% (Analysis 1.7). The mental component subgroup did not show an effect difference (P = 0.25) with a MD of 0.58 (95% CI ‐0.40 to 1.55) with moderate heterogeneity, I² = 66% (Analysis 1.7). There was no significant difference between the subgroups (P = 0.41) where heterogeneity might not be a factor, I2 = 0%.
1.7. Analysis.

Comparison 1 Non‐medical prescribing group versus usual care, Outcome 7 Health‐related quality of life.
Across studies, various quality of life measures generally demonstrated little difference between intervention and control groups (Table 7). There was a moderate‐certainty of evidence (Table 1; Table 2).
6. Secondary outcome ‐ quality of life.
| Study | Measures | Outcome |
| Aubert 1998 | Four generic quality of life measures from the Behavioural Risk Factor Surveillance System |
Intervention and control groups reported improved perception of health status after 12 months, but intervention patients were twice as likely to report this. |
| Barr Taylor 2003 | SF‐36, the Duke Activity Status Index for QoL, and the BDI for depression | Little or no differences for any of the variables, but an improved mood for both groups was found. |
| Bruhn 2013 | SF‐12, HUI, CPG, and HADS‐D | No one measure was seen as the primary outcome. In the prescribing arm there was a within‐arm improvement for CPG intensity and disability effect size subscales and between arms on the intensity subscale but not the disability subscale. There was a within‐arm improvement in overall CPG in the prescribing and review arms but not the TAU arm. The SF‐12 and HADS‐D showed deterioration in the TAU arm. Compared with baseline, patients had an improved CPG in the prescribing and review arms but not the TAU arm. The SF‐12 physical score difference showed no effect in prescribing or review arms but improvement in the TAU arm. SF‐12 mental score showed no effect in prescribing or review arms and deterioration in the TAU arm. HADS‐D scores within the prescribing arm showed improvement for depression and anxiety which were also significant between groups. |
| Cohen 2011 | SF‐36 for Veterans | Little or no change in quality of life scores over 6 months. |
| Finley 2003 | The Brief Inventory for depressive symptoms and Work and Social Disability Scale | Liitle or no difference at 6 months between intervention and control groups. |
| Houweling 2009 | SF‐36 and the revised version of the Type 2 Diabetes Symptom Checklist to measure the presence and perceived burden of diabetes‐related symptoms | Little or no differences over 12 months between groups in either survey. |
| Houweling 2011 | SF‐36 and the revised version of the Type 2 Diabetes Symptom Checklist to measure the presence and perceived burden of diabetes‐related symptoms | In the control group there were little or no differences between baseline and follow‐up SF‐36 measures, however in the practice nurse intervention group there were differences in physical functioning, role physical, vitality, and the physical component score. Little or no differences were seen in the QoL results over time between the two groups except for the physical component score which was lower in the intervention group. After 14 months responses to the revised Type 2 Diabetes Symptom Checklist revealed little or no differences between groups. |
| Hunt 2008 | SF‐36 | Little or no difference except in the general health domain with scores higher in the control group. |
| Jaber 1996 | Health Status Questionnaire version 2 derived from the SF‐36 | Little or no difference between or within groups. |
| Khunti 2007 | SF‐36, Seattle Angina Questionnaire and LVD‐36 questionnaire | Differences favouring the intervention group were found in the SF‐36 for physical functioning, general health, vitality, social functioning, and mental health. Seattle Angina Questionnaire scores in patients with angina were significantly better for intervention patients compared to controls for exertional capacity and borderline differences were found for angina frequency and QoL. There was little or no difference in any of the SF‐36 health status domains or LVD‐36 scores for patients with a confirmed diagnosis of left ventricular diastolic dysfunction. |
| Litaker 2003 | SF‐12 Diabetes Quality of Life |
Little or no difference between groups in either measure at study end. |
| McAlister 2014 | Self‐related health using a Likert scale The EQ‐5D as an index of health |
Little or no difference between the pharmacist‐ and nurse‐led groups in participants overall self‐related health. |
| Margolis 2013 | SF‐12 | Little or no differences between groups. |
| Moher 2001 | Dartmouth COOP charts EuroQol scores | Little or no or clinically important differences between groups for any dimension. |
| Spitzer 1974 | Not described | Patients in the nurse practitioner and usual care groups had similar values at baseline and study end for physical, emotional, and social function. |
| Taveira 2011 | Change from baseline in depression symptoms by the PHQ‐9 | Even though no pharmacologic treatments for depression symptoms were offered as part of the intervention, the mean change in PHQ‐9 scores was probably not different for intervention and standard care participants. |
| Vivian 2002 | SF‐36 | Little or no significant differences either between or within the two groups from baseline to study end, although patients in the control group reported more bodily pain . |
BDI: Beck Depression Index CPG: Chronic Pain Grade EQ‐5D: EuroQol five dimensions questionnaire HADS‐D: Hospital Anxiety and Depression Scale HUI: Health Utilities Index LVD‐36: Left Ventricular Dysfunction PHQ‐9: Patient Health Questionnaire‐9 QoL: quality of life SF‐12: Short‐Form‐12 SF‐36: Short‐Form‐36 TAU: treatment as usual
Non‐medical prescriber outcomes
1. Job satisfaction, skills utilisation, education needs, and workload effects
Outcome not reported.
Resource use outcomes
1. Medical time saved by non‐medical prescribers
Outcome not reported.
2. Non‐medical prescriber versus medical prescriber prescription volume and cost, patient out‐of‐pocket expenses, service costs, deprescribing rate, and cost
Medication use, including medication amount, medication type, medication dosing, medication frequency, and medication cost was higher in 14 non‐medical prescribing groups (7092 participants) compared to usual care (Ansari 2003; Cohen 2011; Denver 2003; Heisler 2012; Houweling 2009; Hunt 2008; Logan 1979; MacMahon Tone 2009; Magid 2013; Margolis 2013; Rudd 2004; Taveira 2010; Taveira 2011; Tsuyuki 2015). Little difference in medication use was reported in two studies (Chenella 1983; Vivian 2002) (137 participants), and a variable outcome was reported in six studies (7924 participants) (Einhorn 1978; Hirsch 2014; McAlister 2014; Moher 2001; Pagaiya 2005; Wallymahmed 2011). (Table 8).
7. Secondary outcome ‐ resource use.
| Medication and related therapy | |
| Study | Outcome |
| Ansari 2003 | β‐blocker use was higher in the nurse facilitator group with two‐thirds of patients either initiated or up‐titrated on β‐blockers versus fewer than one‐third of patients in the other two study arms (control provider education and provider/patient notification). |
| Chenella 1983 | Little or no difference in amount of anticoagulant drugs prescribed by pharmacists compared to a physician. |
| Cohen 2011 | More patients in the pharmacist prescribing arm were prescribed diuretics and sulphonylureas compared to usual care. Overall there was an increase in the number of medications prescribed by pharmacists for hypertension, diabetes, and cholesterol from baseline to six months, but little or no change in the usual care arm. |
| Denver 2003 | In nurse‐led clinic for hypertension management in diabetics at six months there were increased changes in the proportions of patients receiving new prescriptions for calcium channel blockers and thiazide diuretics as intensification therapy. The median number of drugs per patient increased in the intervention group compared to conventional primary care. |
| Einhorn 1978 | In a family medicine clinic in Bogota, nurses were less likely than physicians to provide intrauterine devices, prescribe oral contraceptives, and sterilisation on the patient's first visit. Nurses were more likely than physicians to provide temporary prescriptions and defer intrauterine devices and contraceptive measures if the patient on their first visit was not menstruating or believed to be pregnant. |
| Heisler 2012 | Observational cohort results taken six months following the quarter start date showed intervention patients had more blood pressure medication changes. |
| Hirsch 2014 | Pharmacists identified at least one hypertension drug therapy problem in 33/73 (45.2%) patients at baseline requiring additional therapy in 14/33 (42.4%) and dosage increases in 11/33 (33.3%). |
| Houweling 2009 | The nurse specialist in diabetes prescribed significantly more antihypertensive agents and the internist (doctor control) prescribed more cholesterol‐lowering agents. |
| Hunt 2008 | The mean number of antihypertensive medications per patient and use of generic antihypertensive agents was higher in the intervention group. |
| Logan 1979 | Patients in the nurse‐managed group were more likely to be put on antihypertensive medications, prescribed more than two pills per day, and to be on more than one antihypertensive medication. |
| MacMahon Tone 2009 | There were more intervention intensive group patients on three or more antihypertensive drugs (at the study beginning more patients in the standard care group were on three or more antihypertensive agents). At the end of the study more patients with dyslipidaemia in the intensive group were receiving statin therapy. More patients in the intervention group were on aspirin antiplatelet therapy at the end of the study. |
| McAlister 2014 | The median number of antihypertensive medications taken at six months was probably not different in the pharmacist‐ and nurse‐led groups. There was a difference favouring pharmacists in maximal dosing of angiotensin‐converting enzyme inhibitors or angiotensin receptor blockers at six months, but not the percentage of patients using these drugs. |
| Magid 2013 | In patients completing the six‐month visit, there were more intervention patients that had an antihypertensive medication added to their regimen and a dose increased for existing medication, than usual care patients. There was an increase in the usage of specific antihypertensive drugs. |
| Margolis 2013 | There were increases in the mean number of antihypertensive medication classes at 6, 12, and 18 months in the intervention group compared to baseline and compared to usual care. |
| Moher 2001 | There was minimal change in prescribing antihypertensive drugs in the three groups. All groups increased prescribing of lipid‐lowering drugs but there was little or no difference between groups. There was an increase of 10% more patients’ prescribed antiplatelet treatment in the nurse recall group versus the audit group and 8% more in the nurse recall group versus the general practitioner recall group. |
| Pagaiya 2005 | In examining the effects of training and guidelines on prescribing by nurses, the mean change in antibiotic prescribing for all patients showed little or no difference. The mean change for antibiotic prescribing for respiratory infections in children (0 to 5 years) fell. No change was detected in prescribing antibiotics for diarrhoea. There was a mean fall in diazepam prescribing in the intervention group. |
| Rudd 2004 | In the nurse management patient group at six months there was an increased number and variety of antihypertensive medications and an increased number of medication changes than in the usual care group. |
| Taveira 2010 | The intervention arm group (VA‐MEDIC) had greater dose titrations of antihypertensive medications, insulin, statins, and niacin compared to the usual care arm. |
| Taveira 2011 | Intervention arm participants (VA‐MEDIC‐D) had more dose increases or initiation of any antihypertensive agents and more dose increases or initiation of antihyperglycaemic agents. There was little or no difference in the initiation or dose titration of any antihyperlipidaemic agent or antidepressants. |
| Thompson 1984 | The average number of drugs prescribed per patient was lower in the pharmacist group compared to the physician group. The number of drugs was reduced by an average of 2.2 drugs per patient from the pre‐study to the study year. The practice of clinical pharmacists prescribing drug therapy under physician supervision has the potential to save the healthcare system USD 70,000 per 100 skilled nursing facility beds. |
| Tsuyuki 2015 | In the pharmacist prescribing arm proportionally more new antihypertensive agents were initiated, more dose changes occurred, more antihypertensives were discontinued, and more patients were prescribed low‐dose aspirin and a statin than in the usual care group. |
| Vivian 2002 | There was little or no difference in the type of antihypertensives prescribed to intervention and control patients during the study. |
| Wallymahmed 2011 | Compared with baseline there were more patients in both groups taking antihypertensive medications but this difference was probably only important in the nurse‐led intervention group. |
| Healthcare visits, health resources, and associated costs | |
| Ansari 2003 | There was no difference in hospitalisations and emergency room visits between the three groups of control (provider education), nurse facilitator, and provider/patient notification. |
| Aubert 1998 | Hospital admissions were rare and did not differ between the intervention and usual care groups. ED visits did not differ between groups or from baseline. No hospital or ED visits were related to diabetes. The average number of outpatient visits during the study was similar. The nurse managed a case load of 71 patients, but it was estimated that a 300 patient case load could be managed. |
| Barr Taylor 2003 | There was no change in health utilisation (physician visits, ED visits, days of hospitalisation) for the year before and after the intervention and between groups. |
| Choe 2005 | In reporting process measures for the clinical pharmacist’s case management of patients there was a difference between pharmacist intervention and control in the frequency of low‐density lipoprotein measurements, retinal examinations, and monofilament foot examinations but not glycated haemoglobin measurement or urine albumin screen. |
| Cohen 2011 | Over six months there were a higher number of primary care visits in the usual care arm; an average 1.65 visits per patient versus 1.56 in the intervention arm. It was suggested the difference in the higher number of primary care visits may offset the intervention cost. |
| DeBusk 1994 | The nursing time spent in the year after myocardial infarction was nine hours per patient; a per patient cost of USD 500 which included the nurse salary, office costs, and other associated costs. This compared with cardiac rehabilitation programmes in the San Francisco Bay area costing USD 1800 to USD 2700 to participate for three months. |
| Ellis 2000 | In investigating the impact of clinical pharmacist interventions in patients with dyslipidaemia there was little or no difference in physician or nurse visits between control and the intervention patients at 12 months. At 12 months the intervention group had more pharmacist visits than the control group. There were little or no difference in costs for hospitalisations, clinic visits, laboratory costs, drug costs, and costs of lipid therapy between groups. The intervention group had a USD 370 greater difference per patient in total costs which was probably not important and approximately 5% of total costs. |
| Fairall 2008 | In the cohort of patients not yet receiving antiretroviral therapy there was little or no difference in clinic visits with a nurse but clinic visits with a doctor were probably higher in the intervention group. In the cohort of patients who had already received at least six months of antiretroviral therapy clinic visits with a nurse probably higher in the intervention group. Economic data from the study is the subject of further analysis by Barton 2013 (see Studies awaiting classification). |
| Finley 2003 | Although the collaborative care model experienced a decrease in the total number of primary care visits, the between‐group difference was probably not important. ED visits increased more in the usual care group but this was probably not important and neither was the difference in utilisation of psychiatric services. The institutional cost of drugs, the cost of antidepressants and the cost of psychotropic drugs overall was higher in the intervention group, but this was not important. |
| Fischer 2012 | Hospital admissions (while trending to fewer admissions) in the nurse intervention group showed little or no difference to the control group. Nurse case management was not associated with a significant difference in the number of outpatient or ED visits. There was a decrease in total costs in the nurse telephone intervention group comparing the period before and after randomisation. In contrast, there was an increase for the same comparison in the control group. Similar results were seen with hospitalisation and ED costs which were lower in the intervention group. There was probably not an intervention effect on outpatient costs. The difference in average per patient cost between the intervention group (USD 6600) and control group (USD 9033) of USD 2433 was important. The control group had higher baseline hospitalisation rates and total costs cautioning interpretation of the result. |
| Heisler 2012 | Little or no difference in health services utilisation (hospitalisations, primary care visits, ED visits) between intervention and control patients during the 14‐month study of blood pressure control through a clinical pharmacist outreach programme in diabetic patients. |
| Hirsch 2014 | The pharmacist collaborative group (PharmD‐PCP MTM) had fewer primary care physician visits during the intervention period than did the usual care group. The mean total combined visits of primary care physician and pharmacist was not greater in the PharmD‐PCP MTM group than in usual care. |
| Houweling 2009 | There was a lower number of visits in the NSD group compared with standard care but not in the duration of visits. Significantly more patients were referred back to their GP by the NSD when meeting treatment goals. Personnel and laboratory costs were lower in the intervention group than the control group. The average per month increase in medication costs between the groups was probably not important apart from the cholesterol‐lowering medications. The average time saving per internist was 61.4 minutes (meaning the internist could supervise 11 patients with the NSD in the time he/she could treat one patient). |
| Houweling 2011 | The mean number of visits and duration of visits was higher in the practice nurse intervention group than the control group. |
| Hunt 2008 | The total number of clinic visits (physician plus pharmacist) was higher in the intervention arm compared to the control arm. The number of physician visits was lower in the intervention arm. |
| Ishani 2011 | Little or no difference in the hospitalisation rate between intervention and control groups. |
| Kuethe 2011 | In testing the non‐inferiority of asthma care in children with stable asthma provided by a hospital‐based specialised asthma nurse versus a GP or paediatrician, there was little or no differences between the groups for medication, school absence or parental work absence after two years. There was little or no difference in unplanned visits and no hospital admissions during the study. |
| Litaker 2003 | Medium number of outpatient visits were higher for the team based intervention patients. Average personnel costs for one year's treatment were significantly higher in the intervention group (USD 134.68 vs USD 93.70, P < 0.001). |
| Magid 2013 | There was little or no difference in the mean number of outpatient clinic visits, total number of ED visits, and hospitalisations between the two groups. The intervention group probably had a higher number of email and telephone encounters. |
| Margolis 2013 | Over 12 months in the telemonitoring intervention group all 228 patients used a mean of 11.4 ± 3.9 pharmacist visits lasting a mean of 34.2 minutes and 217 used telemonitoring services with a mean of 9.8 ± 2.5 months of use. It was estimated direct programme costs would total USD 1350 per patient. |
| Spitzer 1974 | A reported five per cent drop in gross practice revenue was explained by the absence of billing for services provided by the nurse practitioner. Billing for unsupervised practice was not permitted in Ontario at the time of the study. During the trial year the services rendered by the nurse practitioner were worth approximately USD 16,000 of which almost 50% was for unsupervised practice. |
| Taveira 2011 | There was little or no differences in primary carer visits, use of ED services for all cause visits, diabetes‐related ED visits or hospital admission rates. |
| Thompson 1984 | There was little or no difference in the average length of stay or hospitalisations although the latter trended lower in the pharmacist group. Differences favouring the pharmacist group were found in the rate of discharge to home or to a lower level of care. |
| Vivian 2002 | Little or no differences between intervention and control groups in appointments with the primary care provider during the 6 months of the study. |
ED: emergency department GP: general practitioner NSD: nurse specialised in diabetes
Costs relating to prescription volume, patient out‐of‐pocket expenses, and deprescribing rate were not reported.
3. Increased resource use for providing the intervention and for providing subsequent care such as hospitalisations, emergency department visits, and outpatient visits
Twenty‐five studies (22,590 participants) reported resource use, including hospital admissions, emergency department visits, outpatient visits, primary care visits, physician visits, pharmacists’ visits, examinations, and staff and laboratory costs (Table 8). Due to the heterogeneity of resource use across studies and the measures used to record resource use, meta‐analysis was confined to a limited number of studies of emergency department visits (RD 0.01, 95% CI ‐0.02 to 0.03) and hospitalisation (RD ‐0.01, 95% CI ‐0.03 to 0.01) comparing the non‐medical prescribing group to usual care. There was no statistical difference between study groups for these parameters (P = 0.52 and P = 0.51, respectively) in the meta‐analysis (Analysis 1.8). There appeared to be little difference in hospitalisations, emergency department visits, and outpatient visits between intervention versus control groups across the studies.
1.8. Analysis.

Comparison 1 Non‐medical prescribing group versus usual care, Outcome 8 Health facility resource use.
Non‐medical prescribing in other settings
Two studies were undertaken in other settings. Logan 1979 described a study of blood pressure control by nurses in the workplace compared to usual medical care. Patients in the nurse group were more likely to be put on antihypertensive medications (94.7% versus 62.7%, P < 0.001), to reach blood pressure goals in the first six months (48.5 versus 27.5%, P < 0.001) and to take drugs prescribed (67.6 versus 49.1%, P < 0.005). Thompson 1984 reported on pharmacist prescribing in a geriatric setting. The clinical pharmacist group probably had a lower number of deaths (P = 0.05), a higher number of patients being discharged to lower levels of care (P = 0.03) and a lower average number of drugs per patient (P = 0.04) (Table 3).
Four studies were undertaken in low‐ and middle‐income country settings. Einhorn 1978 evaluated nurse management versus usual doctor care of family planning and prescribing oral contraceptives. While differences in patient management occurred, the outcomes of continuing oral contraceptive use and preventing pregnancy were probably not different. As outlined, Fairall 2008 evaluated task shifting of antiretroviral therapy from doctors to primary care nurses. The intervention improved survival slightly in patients not yet taking antiretrovirals with CD4 counts of 201 to 350 cells per µL but resulted in little difference in patients with higher cell counts. There was little or no difference in viral load suppression between patient groups for patients already taking antiretrovirals at enrolment. Klingberg‐Allvin 2015 compared treatment of incomplete abortion with misoprostol by physicians and midwives at district level in Uganda and found the diagnosis and treatment of incomplete abortion by midwives equally safe and effective as when provided by physicians. In the study by Pagaiya 2005, educational intervention with guidelines for nurses probably improved antibiotic prescribing for acute respiratory tract infections and the prescribing of diazepam. There was probably no difference in the prescribing of antibiotics for diarrhoea, and it is uncertain whether diabetes care improved because the certainty of evidence is low.
Discussion
Summary of main results
The overall findings suggest that non‐medical prescribing practised with varying but high degrees of autonomy and with collaborative support, can deliver comparable outcomes to usual medical care prescribing. However, these results must be interpreted with a degree of caution, recognising the variation in non‐medical prescribing practice reported within studies and the complex interplay of factors affecting outcomes. There are a limited number of well‐designed randomised controlled trials (RCTs) evaluating the specific prescribing outcomes of non‐medical prescribers.
Meta‐analyses examining surrogate markers of disease with the fixed‐effect method demonstrated interventions with a non‐medical prescribing component decreased systolic blood pressure at six months by ‐6.76 mmHg, and at 12 months by ‐5.31 mmHg. The fixed‐effect estimates gave a more conservative estimate of effect than the random‐effects estimate for systolic blood pressure ( ‐7.34 mmHg and ‐5.91 mmHg, respectively). There was little difference between fixed‐ and random‐effects outcomes for glycated haemoglobin at six months (‐0.42% versus ‐0.45%, respectively) and at 12 months (‐0.62% versus ‐0.62%, respectively). Reductions in low‐density lipoprotein demonstrated variable results using fixed‐ and random‐effects at six months (‐0.25 mmol/L versus ‐0.13 mmol/L, respectively), and 12 months (‐0.21 mmol/L versus ‐0.30 mmol/L, respectively). However, all studies apart from those assessing glycated haemoglobin at 12 months demonstrated moderate to considerable heterogeneity. Removal of the two cluster‐RCTs for systolic blood pressure reduced the fixed‐effect difference by 0.63 mmHg at six months and 0.47 mmHg at 12 months.
Clinical findings of interventions with non‐medical prescribing components outside the meta‐analyses showed equivalence or benefit compared to usual care (Table 3). Medication adherence was measured in less than a quarter (22%) of studies. Where adherence was measured, there was either no difference between study groups or a small improvement in intervention groups. More regular contact by the non‐medical prescriber with intervention patients compared to usual care may be a confounding factor. For example, in the telemonitoring of blood pressure study by Margolis 2013, which demonstrated improved medication adherence at six months, there was regular telephone support from the intervention pharmacist every two weeks until blood pressure control was sustained for six weeks. Contact then reduced to monthly contact for six months which may account for little or no difference in medication adherence at 12 and 18 months. A meta‐analysis of four studies with continuous adherence data favoured the non‐medical prescriber group with minimal heterogeneity.
In studies reporting adverse events, there was either little difference between intervention and usual care groups or insufficient information to determine if differences occurred. In two studies, more deaths were reported in the usual care group versus the intervention group (New 2003; Thompson 1984).
The meta‐analysis of the quality of life measures (SF‐12 and SF‐36 scores at 12 months) probably showed a small improvement favouring the intervention. A variety of other quality of life measures (used in the remaining studies and not included in the meta‐analysis) generally demonstrated little difference between the intervention and usual care groups. In assessing quality of life effects, consideration must be given to the effect of the multifaceted nature of many interventions beyond the non‐medical prescribing component.
Patient satisfaction data were reported in 14/46 (30%) of studies and focused on the care patients received from the non‐medical health professional as a whole, with little specific comparative evidence of satisfaction with the prescribing element of care. Bruhn 2013 obtained a high patient satisfaction rating of 85% (39/46) with the pharmacist service involving prescribing and education in the management of chronic pain. Two studies included results of small samples of medical provider satisfaction with non‐medical providers, which were generally positive, but they raised respective concerns about time commitments to intervention patients and the cost‐effectiveness of non‐medical prescribers (Barr Taylor 2003; Bruhn 2013).
A wide variety of measures of resource use were reported in 37/46 (80%) of studies. In the majority of studies reporting medication use, non‐medical prescribers initiated and prescribed more drugs, titrated drugs to a higher dose, and used a greater variety of drugs than usual care medical prescribers in treating chronic disease. In the aged care setting, the pharmacist prescribed fewer drugs than medical colleagues (Thompson 1984). There was little difference in hospitalisations, emergency department visits, and outpatient visits between intervention versus usual care groups across the studies.
Non‐medical prescribers had varying levels of prescriber training, determined by country or setting, and no studies were found comparing different levels of non‐medical prescriber training and outcomes.
Overall completeness and applicability of evidence
The majority of studies were from high‐income countries with the greater proportion, 25 of 46 studies emanating from the USA. While the results of this review are more applicable in Western countries, the four studies involving non‐medical prescribing nurses in low‐ and middle‐income countries demonstrated safe and effective outcomes compared to usual care, and provide an opportunity for further study in the application of non‐medical prescribing. It is unclear why more studies meeting inclusion criteria did not originate from the UK where legislative change and formal training requirements have allowed independent prescribing by nurses and pharmacists since 2006. Chronic disease management was the focus of most studies with only two studies undertaken in the acute inpatient secondary care setting (Chenella 1983; Marotti 2011).
No studies reported comparisons between non‐medical prescribers in both arms of the study.
In only 19 studies could a more defined non‐medical prescribing role with less confounding elements provide a clearer effect on outcomes. Pharmacists were judged to have more autonomy in their prescribing roles than nurses, who relied more heavily on algorithms to adjust medications. The degree of prescribing autonomy within study designs was guided by local legislative controls and healthcare organisation policies and practices.
Formal training as a requirement to prescribe was limited. Independent pharmacist prescribers in the Bruhn 2013 UK study were required to complete a course of approved study and have registration with the General Pharmaceutical Council as independent prescribers. In Alberta Canada, pharmacists in the Tsuyuki studies were required to undergo an assessment process when applying for the authorisation to prescribe (Tsuyuki 2015; Tsuyuki 2016). In other studies, prescribing permissions were granted through collaborative practice agreements for pharmacists in the USA, and varying degrees of specific on‐the‐job training for the disease or condition of focus. Prescribers frequently had advanced practice qualifications, for example, in diabetes management, and a number of years of experience in ambulatory chronic disease care. Prescribing of oral contraceptives was within the remit of family planning nurses in Bogota, Colombia (Einhorn 1978). Local training was provided to nurses in South Africa covering antiretroviral drug prescribing, drug effects and side‐effects, and the use of algorithmic clinical practice guidelines (Fairall 2008). Midwives in Uganda underwent a five‐day training programme covering incomplete abortion and treatment with misoprostol (Klingberg‐Allvin 2015). Nurses in health centres in Thailand prescribed antibiotics for children and diazepam for adults without additional education and guideline support, which was the focus of the study (Pagaiya 2005).
The heterogeneity of educational requirements for non‐medical prescribers across studies did not allow a pooled assessment of outcomes, but within individual studies the education level did not appear to influence the outcome.
Local trial protocols, which included additional collaborative medical support for the non‐medical prescriber, were aimed at ensuring safe practice.
Most excluded studies were before‐and‐after studies and there remains a need for further large, well‐controlled trials, where the prescribing component can be clearly associated with an outcome, and the degree of prescribing autonomy is clearly defined.
Mikuls 2015 is an ongoing study (see Characteristics of ongoing studies). We are waiting for further information from one study that is reported as an abstract (Tsuyuki 2014). We have placed this study in Characteristics of studies awaiting classification and we will incorporate this study in a future review update. Two further studies, assessing economic impacts, are awaiting assessment (Barton 2013; Neilson 2015). We made the pragmatic decision that these two studies will be incorporated in the update of this review, so as to avoid delaying the publication of the current version of this review.
Quality of the evidence
We evaluated the certainty of the body of evidence for seven outcomes according to the GRADE system.
We graded the certainty of evidence for systolic blood pressure at 12 months as moderate due to considerations of serious inconsistency (finding considerable heterogeneity), the multifaceted nature of interventions, and variable prescribing autonomy. We found high levels of certainty of evidence for the outcome of glycated haemoglobin at 12 months. There were low levels of certainty of evidence for low‐density lipoprotein due to serious inconsistency (finding considerable heterogeneity), multifaceted interventions, and variable prescribing autonomy. We graded medication adherence at moderate‐certainty of evidence due to serious risk of bias (high risk of performance bias) and variable adherence reporting measures. We graded the certainty of evidence around adverse event reporting as low due to indirectness, as the range of adverse events may not be related to the intervention, and selective outcome reporting with adverse events not being reported in many studies. We graded the certainty of evidence for patient satisfaction as moderate due to indirectness in measuring the prescribing component of care, the variability of measures used, and the consideration that some measures were not validated. We graded the health‐related quality of life measures as moderate, considering that within the quality of life outcomes it is difficult to distinguish the contribution non‐medical prescribing made to the outcome versus the other components of care.
The certainty of the body of evidence provides support that there is probably no difference in outcomes between non‐medical and medical prescribers. Specific outcomes may be improved by non‐medical prescribers working within collaborative care arrangements in a range of settings.
Potential biases in the review process
Differing terminologies for non‐medical prescribing across countries may have limited the number of studies found. In addition, we made judgements on the degree of prescribing autonomy for non‐medical prescribers in included studies.
Agreements and disagreements with other studies or reviews
The findings of this review are generally consistent with the findings of other reviews. Meta‐analyses of studies involving pharmacist and nurse‐led care may include studies involving medication management, medication reconciliation, medication education, treatment monitoring, treatment support, and lifestyle advice. Medication management is a broad term that may or may not include a prescribing component. Subgroup analysis of studies involving either independent prescribing, prescribing or dosage adjustment by protocol or algorithm have demonstrated benefit over usual care. Findings of improvements in clinical markers and heterogeneity accord with our findings. In a meta‐analysis, Santschi 2014 reported pharmacist interventions improved blood pressure compared to usual care, but due to the large heterogeneity between studies the effect size varied widely, and it was difficult to determine the most effective intervention. A range of pharmacist interventions were found to reduce systolic blood pressure, but possibly not diastolic blood pressure (Machado 2007). A limitation for both studies was the quality of the studies included in the analyses. In a systematic review of the effects of nurse prescribing, Gielen 2014 reviewed 35 studies including 10 RCTs and one controlled clinical trial. All but five studies had a high risk of bias, but tentative conclusions were that nurses prescribed in a similar way to doctors with few differences in health outcomes, quality of care, and patient satisfaction. Clark 2010 found nurse‐led interventions required an algorithm to improve blood pressure control compared to usual care, and there was some evidence of improved outcomes by nurse prescribers outside the UK. In reviewing 72 RCTs of interventions to control blood pressure in patients with hypertension, Glynn 2010 included 12 studies of nurse‐led or pharmacist‐led care to improve blood pressure control. While the results were significantly heterogeneous, the effects were favourable and warranted further investigation in larger trials. The Hypertension Detection and Follow‐Up study was cited for providing evidence of the importance of a multifaceted intervention in blood pressure control, which consisted of an organised system of regular review and vigorous antihypertensive drug therapy (Hypertension 1979).
In chronic disease management, nurses successfully titrated medications by protocol for diabetes, hypertension, and hyperlipidaemia within a team approach.There were limited descriptions of the interventions and protocols used for studies in the meta‐analysis (Shaw 2014). Greer 2016 found pharmacist‐led chronic disease management was similar to usual care for resource use, and may improve goals for glycaemia, blood pressure, and cholesterol, but there is uncertainty whether clinical outcomes are improved.
In a review of the effects of pharmacist‐provided non‐dispensing services on patient outcomes, health service utilisation, and costs in low‐ and middle‐income countries, Pande 2013 reported on the outcomes of pharmacist interventions that involved counselling, education, and advice. There were small improvements in clinical outcomes (blood pressure, blood glucose, lipids, peak expiratory flow) and quality of life scores, however, the certainty of the evidence was graded as low. Health service utilisation and medication costs were reduced, but again the certainty of the evidence was graded as low. In a review of the effect of outpatient pharmacists' non‐dispensing roles on patient outcomes and prescribing patterns, Nkansah 2010 found that most of the 43 studies included in their review supported the role of pharmacists in medication/therapeutic management as one of a number of interventions to improve clinical outcomes.
It is often difficult to distinguish the specific outcomes of non‐medical prescribing in reported studies and reviews, and the degree of influence on prescribing by physicians where team care arrangements exist. Driscoll 2015, in a review of nurse‐led titration of drug therapy for people with heart failure, found that participants in the nurse‐led group were less likely to be admitted to hospital or to die. More participants reached the maximum drug dose in the nurse‐led group compared to titration of doses by primary care physicians. However we assessed a high level of autonomy in prescribing in only one of the seven reported studies (Ansari 2003).
In a review of substitution of doctors by nurses in primary care, Laurant 2005 found that the quality of care and health outcomes are similar for nurses and doctors, but it is not known if nurse substitution decreases doctors' workload. Nurses tended to provide more health advice and achieve higher levels of patient satisfaction compared to doctors. Nurses' higher use of resources, for example, ordering more tests, may offset savings in lower salary costs.
Authors' conclusions
Implications for practice.
Non‐medical prescribers practising in a variety of settings and with varying but high levels of prescribing autonomy, can achieve comparable outcomes in the management of chronic disease and preventive healthcare. Non‐medical prescribers can deliver comparable outcomes for systolic blood pressure, glycated haemoglobin, low‐density lipoprotein, medication adherence, patient satisfaction, and general quality of life. The certainty of evidence in studies reporting adverse events and resource use make it difficult to determine the impact of non‐medical prescribing compared to medical prescribing for these outcome measures. Pharmacists and nurses are able to deliver comparable prescribing outcomes with varying levels of undergraduate, postgraduate, and specific on‐the‐job training. Non‐medical prescribers frequently have medical support available, if needed, and where these circumstances exist, a collaborative approach appears the preferred model of care. Non‐medical prescribers across a range of different settings in low‐, medium‐ and high‐income countries may be able to meet the growing burden of chronic disease, or where doctor shortages or scarce health resources exist.
Implications for research.
It is frequently difficult within collaborative care models to distinguish specific outcomes that can be related to the non‐medical prescribing component of care. There is a need for trials to more effectively control the variables around non‐medical prescribing to truly determine its effect compared to usual medical prescribing care. Outcomes should be clearly defined, studies should facilitate meta‐analysis, and more effectively quantify adverse prescribing events. Further studies on patient satisfaction using validated tools are required to identify satisfaction with the prescribing component of care. There were many parameters of resource use in the included studies, with few studies capturing comparative drug costs of non‐medical prescribing versus usual care medical prescribing. The cost of doctors' time saved and whether this time is transferred to more acute patient care should be quantified in future studies. Therefore, there is a need for cost‐effectiveness analysis of a range of non‐medical prescribing interventions. Well‐controlled studies are also required in the acute secondary care setting to establish the effect of non‐medical prescribing roles on medical workload, resource use, patient flow, and safety. Due to the limited number of studies in low‐ and middle‐income countries, further well‐controlled trials are required in such settings.
Feedback
Non‐medical prescribing versus medical prescribing for acute and chronic disease management in primary and secondary care, 4 October 2017
Summary
For the secondary outcome 'quality of life', the abstract states that there is a ‘difference favouring usual care for the physical component score (MD 1.17, 95% CI 0.16 to 2.17)’. However, when examining analysis 1.7 and the text, it appears that this difference is in favour of the intervention.
I do not have any affiliation with or involvement in any organisation with a financial interest in the subject matter of my comment.
Bert Avau (bert.avau@cochrane.be) Affiliation: Cochrane Belgium
Reply
Thank you for bringing this oversight to our attention. I have corrected the Abstract and clarified the 'quality of life' statement in the Discussion.
Contributors
Greg Weeks
What's new
| Date | Event | Description |
|---|---|---|
| 9 October 2017 | Amended | Correction of a factual error (see Feedback comment). |
| 9 October 2017 | Feedback has been incorporated | Feedback incorporated and responded. |
Acknowledgements
Within the Cochrane Effective Practice and Organisation of Care (EPOC) Group, we would like to thank Paul Millar, Information Specialist, for assistance in developing the search strategy; Gillian Leng (Contact Editor); Clare Dooley (Assistant Managing Editor); Emma Tavender (Managing Editor); Luke Vale (Economics Editor), Kristoffer Yunpeng Ding (Statistical Editor), and Arash Rashidian (Editor). In addition, we thank Neal Maskey (Peer Referee), and Heather Maxwell (Copy‐Editor).
Appendices
Appendix 1. Search strategies
MEDLINE: (OVID: Epub Ahead of Print, In‐Process & Other Non‐Indexed Citations, Ovid MEDLINE(R) Daily and Ovid MEDLINE(R) 1946 to Present)
| No. | Search terms | Results |
| 1 | ((non‐medical or non‐medico) adj3 prescrib*).ti,ab. | 122 |
| 2 | (prescribing adj3 autonomy).ti,ab. | 16 |
| 3 | ((non‐physician? or non‐professional? or non‐clinician) adj3 (prescribing or prescriber? or prescription? or "prescribed by")).ti,ab. | 9 |
| 4 | ((prescribing adj2 (independen* or collaborat*)) or independent prescriber?).ti,ab. | 166 |
| 5 | ((delegat* adj10 prescribing) or (extend* adj3 prescrib* role?)).ti,ab. | 10 |
| 6 | (task? adj2 (shift or shifting or substitution) adj10 (prescribing or prescriber?)).ti,ab. | 4 |
| 7 | (prescrib* adj3 (autonomy or autonomous* or responsibilit* or authority or right?)).ti,ab. | 483 |
| 8 | (prescription? adj3 (autonomy or autonomous* or responsibilit* or authority or right?)).ti,ab. | 203 |
| 9 | ((nurse or nurses or nursing staff or non‐clinician or non‐physician? or allied health) and pharmacotherapy).ti. | 8 |
| 10 | ((nurse or nurses) and prescrib*).ti. | 581 |
| 11 | ((role adj3 (change or substitut*)) and (prescriber? or prescribing)).ti,ab. | 12 |
| 12 | ((task? adj2 (shift or shifting or substitution)) and (prescribing or prescriber?)).ti,ab. | 10 |
| 13 | ((allied health or ambulance or chiropractor? or counsel?or? or dental assistant? or emergency vehicle? or emergency worker? or health* worker? or midwife? or midwives or non‐clinical or non‐professional? or nurse or nurses or nursing staff or paramedic? or pharmacist? or physical therapist? or physician? assistant? or physician? extender? or physiotherapist? or podiatrist? or psychologist?) adj3 (prescribing or prescriber?)).ti,ab. | 1309 |
| 14 | ((allied health or ambulance or chiropractor? or counsel?or? or dental assistant? or emergency vehicle? or emergency worker? or health* worker? or midwife? or midwives or nurse or nurses or paramedic? or pharmacist? or physical therapist? or physician? assistant? or physiotherapist? or podiatrist? or psychologist?) adj3 prescription?).ti,ab. | 484 |
| 15 | ((allied health or ambulance or chiropractor? or counsel?or? or dental assistant? or emergency vehicle? or emergency worker? or health* worker? or midwife? or midwives or nurse or nurses or paramedic? or pharmacist? or physical therapist? or physician? assistant? or physiotherapist? or podiatrist? or psychologist?) adj3 ((adjust* or alter* or chang* or decision* or manage? or management or managing) adj2 (dosage? or dose))).ti,ab. | 28 |
| 16 | drug prescriptions/nu | 250 |
| 17 | (pharmacist? and pharmacotherapy).ti. | 37 |
| 18 | ((nurse or nurses or nursing staff or pharmacist?) adj4 (pharmaceutical care or drug therapy)).ti,ab. | 453 |
| 19 | supplementary prescribing.ti,ab. | 65 |
| 20 | (prescrib* adj2 team?).ti,ab. | 34 |
| 21 | or/1‐20 | 3199 |
| 22 | allied health personnel/ or community health workers/ or emergency medical technicians/ or home health aides/ or exp nurses' aides/ or pharmacists' aides/ or physical therapists/ or exp physician assistants/ or infection control practitioners/ or exp nurses/ or exp nursing staff/ or pharmacists/ | 169253 |
| 23 | *allied health personnel/ or *community health workers/ or *emergency * medical technicians/ or *home health aides/ or exp *nurses' aides/ or *pharmacists' aides/ or *physical therapists/ or exp *physician assistants/ or *infection control practitioners/ or exp *nurses/ or exp *nursing staff/ or *pharmacists/ | 125515 |
| 24 | (chiropractor? or counsel?or? or dental assistant? or emergency vehicle? or emergency worker? or health* worker? or midwife? or midwives or nonphysician? or non‐physician? or nurse or nurses or paramedic? or pharmacist? or physical therapist? or physician? assistant? or physiotherapist? or podiatrist? or psychologist?).ti. | 127735 |
| 25 | ((chiropractor? or counsel?or? or dental assistant? or emergency vehicle? or emergency worker? or health* worker? or midwife? or midwives or nonphysician? or non‐physician? or nurse or nurses or paramedic? or pharmacist? or physical therapist? or physician? assistant? or physiotherapist? or podiatrist? or psychologist?) adj5 ((role? adj2 (chang* or new or newly)) or (responsibilit* adj3 (chang* or increas* or new or newly)))).ab. | 531 |
| 26 | (pharmacist‐led or pharma* initiated or ((driven or lead or led) adj2 pharmacist?)).ti. | 186 |
| 27 | (prescribing adj3 (authority or right?)).ti,ab. | 174 |
| 28 | (taskshifting or task shifting).ti,ab. | 490 |
| 29 | (delegat* adj3 (authority or responsibility)).ti,ab. | 431 |
| 30 | ((nurse or nurses or nursing staff or non‐clinician or non‐physician? or allied health or pharmacist?) adj4 pharmacotherapy).ti. | 19 |
| 31 | or/22,24‐30 | 241275 |
| 32 | or/23‐30 | 203924 |
| 33 | (prescribing or prescriber? or (prescription? adj3 (issue? or issuing or writing))).ti. | 11531 |
| 34 | prescribing role?.ab. | 48 |
| 35 | (prescrib* adj3 (autonomy or autonomous* or responsibilit* or authority or right?)).ti,ab. | 483 |
| 36 | drug prescriptions/ | 23816 |
| 37 | *prescriptions/ | 1601 |
| 38 | prescriptions/ and (dt or tu or th).fs. | 848 |
| 39 | electronic prescribing/ | 727 |
| 40 | drug dosage calculations/ | 1474 |
| 41 | (pharmacist‐led or pharma* initiated or ((driven or lead or led) adj2 pharmacist?)).ti. | 186 |
| 42 | medication therapy management/ | 1017 |
| 43 | drug therapy/ | 29114 |
| 44 | or/33‐43 | 62802 |
| 45 | (randomized controlled trial or controlled clinical trial).pt. or randomized.ab. or placebo.ab. or clinical trials as topic.sh. or randomly.ab. or trial.ti. | 1052813 |
| 46 | exp animals/ not humans.sh. | 4278331 |
| 47 | 45 not 46 | 970722 |
| 48 | intervention?.ti. or (intervention? adj6 (clinician? or collaborat* or community or complex or design* or doctor? or educational or family doctor? or family physician? or family practitioner? or financial or gp or general practice? or hospital? or impact? or improv* or individuali?e? or individuali?ing or interdisciplin* or multicomponent or multi‐component or multidisciplin* or multi‐disciplin* or multifacet* or multi‐facet* or multimodal* or multi‐modal* or personali?e? or personali?ing or pharmacies or pharmacist? or pharmacy or physician? or practitioner? or prescrib* or prescription? or primary care or professional* or provider? or regulatory or regulatory or tailor* or target* or team* or usual care)).ab. | 214965 |
| 49 | (pre‐intervention? or preintervention? or "pre intervention?" or post‐intervention? or postintervention? or "post intervention?").ti,ab. | 15010 |
| 50 | (hospital* or patient?).hw. and (study or studies or care or health* or practitioner? or provider? or physician? or nurse? or nursing or doctor?).ti,hw. | 805167 |
| 51 | demonstration project?.ti,ab. | 2205 |
| 52 | (pre‐post or "pre test*" or pretest* or posttest* or "post test*" or (pre adj5 post)).ti,ab. | 85551 |
| 53 | (pre‐workshop or post‐workshop or (before adj3 workshop) or (after adj3 workshop)).ti,ab. | 811 |
| 54 | trial.ti. or ((study adj3 aim?) or "our study").ab. | 829782 |
| 55 | (before adj10 (after or during)).ti,ab. | 412287 |
| 56 | ("quasi‐experiment*" or quasiexperiment* or "quasi random*" or quasirandom* or "quasi control*" or quasicontrol* or ((quasi* or experimental) adj3 (method* or study or trial or design*))).ti,ab,hw. | 122912 |
| 57 | ("time series" adj2 interrupt*).ti,ab,hw. | 1675 |
| 58 | (time points adj3 (over or multiple or three or four or five or six or seven or eight or nine or ten or eleven or twelve or month* or hour? or day? or "more than")).ab. | 12505 |
| 59 | pilot.ti. | 51018 |
| 60 | pilot projects/ | 95776 |
| 61 | (clinical trial or controlled clinical trial or multicenter study).pt. | 678009 |
| 62 | (multicentre or multicenter or multi‐centre or multi‐center).ti. | 37054 |
| 63 | random*.ti,ab. or controlled.ti. | 923482 |
| 64 | (control adj3 (area or cohort? or compare? or condition or design or group? or intervention? or participant? or study)).ab. not (controlled clinical trial or randomized controlled trial).pt. | 501700 |
| 65 | evaluation studies as topic/ or prospective studies/ or retrospective studies/ | 1116849 |
| 66 | (utili?ation or programme or programmes).ti. | 63922 |
| 67 | (during adj5 period).ti,ab. | 343205 |
| 68 | ((strategy or strategies) adj2 (improv* or education*)).ti,ab. | 24701 |
| 69 | "comment on".cm. or review.pt. or (review not "peer review*").ti. or randomized controlled trial.pt. | 3369192 |
| 70 | (rat or rats or cow or cows or chicken? or horse or horses or mice or mouse or bovine or animal?).ti. | 1466364 |
| 71 | exp animals/ not humans.sh. | 4278331 |
| 72 | (or/48‐68) not (or/69‐71) | 3355572 |
| 73 | review.pt. and (systematic.ti,ab. or (medline or embase or cinahl or (search adj2 literature)).ab.) | 126775 |
| 74 | (((systematic or literature) adj2 review) or (metaanalysis or meta‐analysis)).ti. | 128866 |
| 75 | or/73‐74 | 201679 |
| 76 | 21 and 75 | 96 |
| 77 | 21 | 3199 |
| 78 | (and/31,44) not 21 | 3174 |
| 79 | (and/32,44) not 21 | 2345 |
| 80 | (or/77‐78) and 47 | 418 |
| 81 | (and/72,77) not 80 | 1144 |
| 82 | (and/72,79) not (or/80‐81) | 904 |
| 83 | or/80‐82 | 2930820 |
Embase: (OVID: 1974 to 2016 July 18)
| No. | Search terms | Results |
| 1 | ((non‐medical or non‐medico) adj3 prescrib*).ti,ab. | 202 |
| 2 | (prescribing adj3 autonomy).ti,ab. | 17 |
| 3 | ((non‐physician? or non‐professional? or non‐clinician) adj3 (prescribing or prescriber? or prescription? or "prescribed by")).ti,ab. | 12 |
| 4 | ((prescribing adj2 (independen* or collaborat*)) or independent prescriber?).ti,ab. | 294 |
| 5 | ((delegat* adj10 prescribing) or (extend* adj3 prescrib* role?)).ti,ab. | 16 |
| 6 | (task? adj2 (shift or shifting or substitution) adj10 (prescribing or prescriber?)).ti,ab. | 7 |
| 7 | (prescrib* adj3 (autonomy or autonomous* or responsibilit* or authority or right?)).ti,ab. | 634 |
| 8 | (prescription? adj3 (autonomy or autonomous* or responsibilit* or authority or right?)).ti,ab. | 275 |
| 9 | ((nurse or nurses or nursing staff or non‐clinician or non‐physician? or allied health) and pharmacotherapy).ti. | 8 |
| 10 | ((nurse or nurses) and prescrib*).ti. | 631 |
| 11 | ((role adj3 (change or substitut*)) and (prescriber? or prescribing)).ti,ab. | 13 |
| 12 | ((task? adj2 (shift or shifting or substitution)) and (prescribing or prescriber?)).ti,ab. | 13 |
| 13 | ((allied health or ambulance or chiropractor? or counsel?or? or dental assistant? or emergency vehicle? or emergency worker? or health* worker? or midwife? or midwives or non‐clinical or non‐professional? or nurse or nurses or nursing staff or paramedic? or pharmacist? or physical therapist? or physician? assistant? or physician? extender? or physiotherapist? or podiatrist? or psychologist?) adj3 (prescribing or prescriber?)).ti,ab. | 1981 |
| 14 | ((allied health or ambulance or chiropractor? or counsel?or? or dental assistant? or emergency vehicle? or emergency worker? or health* worker? or midwife? or midwives or nurse or nurses or paramedic? or pharmacist? or physical therapist? or physician? assistant? or physiotherapist? or podiatrist? or psychologist?) adj3 prescription?).ti,ab. | 875 |
| 15 | ((allied health or ambulance or chiropractor? or counsel?or? or dental assistant? or emergency vehicle? or emergency worker? or health* worker? or midwife? or midwives or nurse or nurses or paramedic? or pharmacist? or physical therapist? or physician? assistant? or physiotherapist? or podiatrist? or psychologist?) adj3 ((adjust* or alter* or chang* or decision* or manage? or management or managing) adj2 (dosage? or dose))).ti,ab. | 57 |
| 16 | (Pharmacist? and pharmacotherapy).ti. | 69 |
| 17 | ((nurse or nurses or nursing staff or pharmacist?) adj4 (pharmaceutical care or drug therapy)).ti,ab. | 865 |
| 18 | supplementary prescribing.ti,ab. | 160 |
| 19 | (prescrib* adj2 team?).ti,ab. | 76 |
| 20 | or/1‐19 | 4881 |
| 21 | *paramedical personnel/ | 6549 |
| 22 | *health auxiliary/ | 1946 |
| 23 | *rescue personnel/ | 3445 |
| 24 | *health care personnel/ | 21228 |
| 25 | *nursing assistant/ | 2303 |
| 26 | *pharmacist/ | 19633 |
| 27 | *physiotherapist/ | 2406 |
| 28 | *physician assistant/ | 3005 |
| 29 | *infection control practitioner/ | 64 |
| 30 | *nurse/ | 38162 |
| 31 | *nursing staff/ | 40664 |
| 32 | (chiropractor? or counsel?or? or dental assistant? or emergency vehicle? or emergency worker? or health* worker? or midwife? or midwives or nonphysician? or non‐physician? or nurse or nurses or paramedic? or pharmacist? or physical therapist? or physician? assistant? or physiotherapist? or podiatrist? or psychologist?).ti. | 140823 |
| 33 | ((chiropractor? or counsel?or? or dental assistant? or emergency vehicle? or emergency worker? or health* worker? or midwife? or midwives or nonphysician? or non‐physician? or nurse or nurses or paramedic? or pharmacist? or physical therapist? or physician? assistant? or physiotherapist? or podiatrist? or psychologist?) adj5 ((role? adj2 (chang* or new or newly)) or (responsibilit* adj3 (chang* or increas* or new or newly)))).ab. | 615 |
| 34 | (pharmacist‐led or pharma* initiated or ((driven or lead or led) adj2 pharmacist?)).ti. | 512 |
| 35 | (prescribing adj3 (authority or right?)).ti,ab. | 235 |
| 36 | (taskshifting or task shifting).ti,ab. | 598 |
| 37 | (delegat* adj3 (authority or responsibility)).ti,ab. | 515 |
| 38 | ((nurse or nurses or nursing staff or non‐clinician or non‐physician? or allied health or pharmacist?) adj4 pharmacotherapy).ti. | 33 |
| 39 | or/21‐38 | 227062 |
| 40 | (prescribing or prescriber? or (prescription? adj3 (issue? or issuing or writing))).ti. | 16097 |
| 41 | prescribing role?.ab. | 67 |
| 42 | (prescrib* adj3 (autonomy or autonomous* or responsibilit* or authority or right?)).ti,ab. | 634 |
| 43 | *prescription/ | 29366 |
| 44 | electronic prescribing/ | 1762 |
| 45 | (pharmacist‐led or pharma* initiated or ((driven or lead or led) adj2 pharmacist?)).ti. | 512 |
| 46 | dose calculation/ | 15815 |
| 47 | (pharmacist‐led or pharma* initiated or ((driven or lead or led) adj2 pharmacist?)).ti. | 512 |
| 48 | medication therapy management/ | 5551 |
| 49 | *drug therapy/ | 237743 |
| 50 | or/40‐49 | 296543 |
| 51 | 39 and 50 | 5491 |
| 52 | 20 or 51 | 8629 |
| 53 | (randomized controlled trial or controlled clinical trial).pt. or randomized.ab. or placebo.ab. or clinical trials as topic.sh. or randomly.ab. or trial.ti. | 983986 |
| 54 | exp animals/ not humans.sh. | 21901597 |
| 55 | 53 not 54 | 92533 |
| 56 | (pre‐intervention? or preintervention? or "pre intervention?" or post‐intervention? or postintervention? or "post intervention?").ti,ab. | 20205 |
| 57 | (hospital* or patient?).hw. and (study or studies or care or practitioner? or provider? or nurse? or nursing).ti,hw. | 1880520 |
| 58 | demonstration project?.ti,ab. | 2599 |
| 59 | (pre‐post or "pre test*" or pretest* or posttest* or "post test*" or (pre adj5 post)).ti,ab. | 132459 |
| 60 | (pre‐workshop or post‐workshop or (before adj3 workshop) or (after adj3 workshop)).ti,ab. | 1192 |
| 61 | trial.ti. or ((study adj3 aim?) or "our study").ab. | 1183792 |
| 62 | (before adj10 (after or during)).ti,ab. | 536118 |
| 63 | (time points adj3 (over or multiple or three or four or five or six or seven or eight or nine or ten or eleven or twelve or month* or hour? or day? or "more than")).ab. | 17449 |
| 64 | (multicentre or multicenter or multi‐centre or multi‐center).ti. | 53877 |
| 65 | random*.ti,ab. or controlled.ti. | 1167281 |
| 66 | (control adj3 (area or cohort? or compare? or condition or design or group? or intervention? or participant? or study)).ab. | 765606 |
| 67 | ((evaluation or prospective or retrospective) adj study).ti,ab. | 301843 |
| 68 | (utili?ation or programme or programmes).ti. | 81121 |
| 69 | (during adj5 period).ti,ab. | 447256 |
| 70 | ((strategy or strategies) adj2 (improv* or education*)).ti,ab. | 30888 |
| 71 | *experimental design/ or *pilot study/ or quasi experimental study/ | 12917 |
| 72 | ("quasi‐experiment*" or quasiexperiment* or "quasi random*" or quasirandom* or "quasi control*" or quasicontrol* or ((quasi* or experimental) adj3 (method* or study or trial or design*))).ti,ab. | 139839 |
| 73 | ("time series" adj2 interrupt*).ti,ab. | 1776 |
| 74 | or/56‐73 | 5174080 |
| 75 | (rat or rats or cow or cows or chicken? or horse or horses or mice or mouse or bovine or animal?).ti. | 1668853 |
| 76 | (exp animals/ or exp invertebrate/ or animal experiment/ or animal model/ or animal tissue/ or animal cell/ or nonhuman/) and (human/ or normal human/ or human cell/) | 17413581 |
| 77 | (exp animals/ or exp invertebrate/ or animal experiment/ or animal model/ or animal tissue/ or animal cell/ or nonhuman/) not 76 | 5958092 |
| 78 | 74 not (or/75,77) | 4475264 |
| 79 | 52 and 55 | 58 |
| 80 | 52 and 53 | 512 |
| 81 | 52 and 78 | 4744 |
| 82 | 80 or 81 | 4751 |
The Cochrane Library (Wiley)
| No. | Search terms | Results |
| #1 | ((non‐medical or non‐medico) near/3 prescrib*):ti,ab,kw | 4 |
| #2 | (prescribing near/3 autonomy*):ti,ab,kw | 0 |
| #3 | ((non‐physician* or non‐professional* or non‐clinician) near/3 (prescribing or prescriber* or prescription* or "prescribed by")):ti,ab,kw | 0 |
| #4 | ((prescribing near/2 (independen* or collaborat*)) or independent prescriber*):ti,ab,kw | 17 |
| #5 | ((delegat* near/10 prescribing) or (extend* near/3 prescrib* role*)):ti,ab,kw | 3 |
| #6 | (task* near/2 (shift or shifting or substitution) near/10 (prescribing or prescriber*)):ti,ab,kw | 0 |
| #7 | (prescrib* near/3 (autonomy or autonomous* or responsibilit* or authority or right*)):ti,ab,kw | 14 |
| #8 | (prescription* near/3 (autonomy or autonomous* or responsibilit* or authority or right*)):ti,ab,kw | 7 |
| #9 | ((nurse or nurses or nursing staff or non‐clinician or non‐physician* or allied health) and pharmacotherapy):ti,ab,kw | 78 |
| #10 | ((nurse or nurses) and prescrib*):ti,ab,kw | 345 |
| #11 | ((role near/3 (change or substitut*)) and (prescriber* or prescribing)):ti,ab,kw | 2 |
| #12 | ((task* near/2 (shift or shifting or substitution)) and (prescribing or prescriber*)):ti,ab,kw | 0 |
| #13 | ((allied health or ambulance or chiropractor* or counsel*or* or dental assistant* or emergency vehicle* or emergency worker* or health* worker* or midwife* or midwives or non‐clinical or non‐professional* or nurse or nurses or nursing staff or paramedic* or pharmacist* or physical therapist* or physician* assistant* or physician* extender* or physiotherapist* or podiatrist* or psychologist*) near/3 (prescribing or prescriber*)):ti,ab,kw | 79 |
| #14 | ((allied health or ambulance or chiropractor* or counsel*or* or dental assistant* or emergency vehicle* or emergency worker* or health* worker* or midwife* or midwives or nurse or nurses or paramedic* or pharmacist* or physical therapist* or physician* assistant* or physiotherapist* or podiatrist* or psychologist*) near/3 prescription*):ti,ab,kw | 106 |
| #15 | ((allied health or ambulance or chiropractor* or counsel*or* or dental assistant* or emergency vehicle* or emergency worker* or health* worker* or midwife* or midwives or nurse or nurses or paramedic* or pharmacist* or physical therapist* or physician* assistant* or physiotherapist* or podiatrist* or psychologist*) near/3 ((alter* or chang* or decision* or manage* or management or managing) near/2 (dosage* or dose))):ti,ab,kw | 1 |
| #16 | (pharmacist* and pharmacotherapy):ti,ab,kw | 63 |
| #17 | ((nurse or nurses or nursing staff or pharmacist*) near/4 (pharmaceutical care or drug therapy)):ti,ab,kw | 184 |
| #18 | supplementary prescribing:ti,ab,kw | 21 |
| #19 | (prescrib* near/2 team*):ti,ab,kw | 3 |
| #20 | {or #1‐#19} | 804 |
CINAHL (EBSCOHost)
| No. | Search terms | Results |
| S1 | (MH "Prescriptive Authority") | 4,232 |
| S2 | TX (prescrib* N3 (autonomy or autonomous* or responsibilit* or authority or right?)) | 513 |
| S3 | TX (prescribed* N3 (autonomy or autonomous* or responsibility* or authority or right?)) | 11 |
| S4 | TX non‐physician prescribing | 2 |
| S5 | TX supplementary prescribing | 152 |
| S6 | TX ((role N3 (change or substitut*)) and (prescriber? or prescribing)) | 40 |
| S7 | TX ((task? N2 (shift or shifting or substitution)) and (prescribing or prescriber?)) | 2 |
| S8 | TI (prescribing or prescriber? or (prescription? N3 (issue? or issuing or writing))) | 5,729 |
| S9 | TI (((nurse or nurses or nursing staff or pharmacist?) N4 (pharmaceutical care or drug therapy))) OR AB (((nurse or nurses or nursing staff or pharmacist?) N4 (pharmaceutical care or drug therapy))) | 80 |
| S10 | TI dose calculation OR AB dose calculation | 171 |
| S11 | TI ((prescribing N3 (authority or right?))) OR AB ((prescribing N3 (authority or right?))) | 165 |
| S12 | TI ((taskshifting or task shifting)) OR AB ((taskshifting or task shifting)) | 154 |
| S13 | TI ((delegat* N3 (authority or responsibility))) OR AB ((delegat* N3 (authority or responsibility))) | 128 |
| S14 | S1 OR S2 OR S3 OR S4 OR S5 OR S6 OR S7 OR S8 OR S9 OR S10 OR S11 OR S12 OR S13 | 9,013 |
PsycINFO (OVID: 2002 to July Week 2 2016)
| No. | Search terms | Results |
| 1 | ((non‐medical or non‐medico) adj3 prescrib*).ti,ab. | 41 |
| 2 | (prescribing adj3 autonomy).ti,ab. | 3 |
| 3 | ((non‐physician? or non‐professional? or non‐clinician) adj3 (prescribing or prescriber? or prescription? or "prescribed by")).ti,ab. | 3 |
| 4 | ((prescribing adj2 (independen* or collaborat*)) or independent prescriber?).ti,ab. | 50 |
| 5 | ((delegat* adj10 prescribing) or (extend* adj3 prescrib* role?)).ti,ab. | 3 |
| 6 | (task? adj2 (shift or shifting or substitution) adj10 (prescribing or prescriber?)).ti,ab. | 1 |
| 7 | (prescrib* adj3 (autonomy or autonomous* or responsibilit* or authority or right?)).ti,ab. | 116 |
| 8 | (prescription? adj3 (autonomy or autonomous* or responsibilit* or authority or right?)).ti,ab. | 49 |
| 9 | ((nurse or nurses or nursing staff or non‐clinician or non‐physician? or allied health) and pharmacotherapy).ti. | 1 |
| 10 | ((nurse or nurses) and prescrib*).ti. | 126 |
| 11 | ((role adj3 (change or substitut*)) and (prescriber? or prescribing)).ti,ab. | 7 |
| 12 | ((task? adj2 (shift or shifting or substitution)) and (prescribing or prescriber?)).ti,ab. | 4 |
| 13 | ((allied health or ambulance or chiropractor? or counsel?or? or dental assistant? or emergency vehicle? or emergency worker? or health* worker? or midwife? or midwives or non‐clinical or non‐professional? or nurse or nurses or nursing staff or paramedic? or pharmacist? or physical therapist? or physician? assistant? or physician? extender? or physiotherapist? or podiatrist? or psychologist?) adj3 (prescribing or prescriber?)).ti,ab. | 282 |
| 14 | ((allied health or ambulance or chiropractor? or counsel?or? or dental assistant? or emergency vehicle? or emergency worker? or health* worker? or midwife? or midwives or nurse or nurses or paramedic? or pharmacist? or physical therapist? or physician? assistant? or physiotherapist? or podiatrist? or psychologist?) adj3 prescription?).ti,ab. | 104 |
| 15 | ((allied health or ambulance or chiropractor? or counsel?or? or dental assistant? or emergency vehicle? or emergency worker? or health* worker? or midwife? or midwives or nurse or nurses or paramedic? or pharmacist? or physical therapist? or physician? assistant? or physiotherapist? or podiatrist? or psychologist?) adj3 ((adjust* or alter* or chang* or decision* or manage? or management or managing) adj2 (dosage? or dose))).ti,ab. | 0 |
| 16 | (pharmacist? and pharmacotherapy).ti. | 2 |
| 17 | ((nurse or nurses or nursing staff or pharmacist?) adj4 (pharmaceutical care or drug therapy)).ti,ab. | 23 |
| 18 | supplementary prescribing.ti,ab. | 28 |
| 19 | (prescrib* adj2 team?).ti,ab. | 9 |
| 20 | or/1‐19 | 572 |
| 21 | allied health personnel/ | 524 |
| 22 | emergency services/ | 4695 |
| 23 | health personnel/ | 11311 |
| 24 | nurses/ | 15736 |
| 25 | pharmacists/ | 983 |
| 26 | physical therapists/ or physical therapy/ | 1830 |
| 27 | physician assistant.tw. | 165 |
| 28 | nursing/ or psychiatric nurses/ | 15532 |
| 29 | (chiropractor? or counsel?or? or dental assistant? or emergency vehicle? or emergency worker? or health* worker? or midwife? or midwives or nonphysician? or non‐physician? or nurse or nurses or paramedic? or pharmacist? or physical therapist? or physician? assistant? or physiotherapist? or podiatrist? or psychologist?).ti. | 20233 |
| 30 | ((chiropractor? or counsel?or? or dental assistant? or emergency vehicle? or emergency worker? or health* worker? or midwife? or midwives or nonphysician? or non‐physician? or nurse or nurses or paramedic? or pharmacist? or physical therapist? or physician? assistant? or physiotherapist? or podiatrist? or psychologist?) adj5 ((role? adj2 (chang* or new or newly)) or (responsibilit* adj3 (chang* or increas* or new or newly)))).ab. | 171 |
| 31 | (pharmacist‐led or pharma* initiated or ((driven or lead or led) adj2 pharmacist?)).ti. | 20 |
| 32 | (prescribing adj3 (authority or right?)).ti,ab. | 39 |
| 33 | (taskshifting or task shifting).ti,ab. | 142 |
| 34 | (delegat* adj3 (authority or responsibility)).ti,ab. | 113 |
| 35 | ((nurse or nurses or nursing staff or non‐clinician or non‐physician? or allied health or pharmacist?) adj4 pharmacotherapy).ti. | 2 |
| 36 | (prescribing or prescriber? or (prescription? adj3 (issue? or issuing or writing))).ti. | 1417 |
| 37 | prescribing role?.ab. | 15 |
| 38 | (prescrib* adj3 (autonomy or autonomous* or responsibilit* or authority or right?)).ti,ab. | 116 |
| 39 | prescription privileges/ or prescription drugs/ | 3059 |
| 40 | "prescribing (drugs)"/ | 2279 |
| 41 | (pharmacist‐led or pharma* initiated or ((driven or lead or led) adj2 pharmacist?)).ti. | 20 |
| 42 | drug dosages/ or drug therapy/ | 75700 |
| 43 | (pharmacist‐led or pharma* initiated or ((driven or lead or led) adj2 pharmacist?)).ti. | 20 |
| 44 | or/1‐19 | 572 |
| 45 | or/21‐31 | 53127 |
| 46 | or/32‐43 | 79154 |
| 47 | 45 and 46 | 1731 |
| 48 | 44 or 47 | 2009 |
Data and analyses
Comparison 1. Non‐medical prescribing group versus usual care.
| Outcome or subgroup title | No. of studies | No. of participants | Statistical method | Effect size |
|---|---|---|---|---|
| 1 Systolic blood pressure mmHg | 21 | Mean Difference (IV, Fixed, 95% CI) | Subtotals only | |
| 1.1 6 months | 11 | 2076 | Mean Difference (IV, Fixed, 95% CI) | ‐6.76 [‐8.24, ‐5.27] |
| 1.2 12 months | 12 | 4229 | Mean Difference (IV, Fixed, 95% CI) | ‐5.31 [‐6.46, ‐4.16] |
| 1.3 6 months systolic blood pressure removing cluster effect (Margolis) | 10 | 1628 | Mean Difference (IV, Fixed, 95% CI) | ‐6.13 [‐7.83, ‐4.44] |
| 1.4 12 months systolic blood pressure excluding cluster trials (Khunti and Margolis) | 10 | 2627 | Mean Difference (IV, Fixed, 95% CI) | ‐4.84 [‐6.29, ‐3.39] |
| 1.5 Systolic blood pressure at 6 months (more NMP prescribing autonomy) | 4 | 695 | Mean Difference (IV, Fixed, 95% CI) | ‐2.98 [‐5.36, ‐0.59] |
| 2 HbA1c (%) | 8 | Mean Difference (IV, Fixed, 95% CI) | Subtotals only | |
| 2.1 HbA1c 6 mths | 3 | 271 | Mean Difference (IV, Fixed, 95% CI) | ‐0.42 [‐0.75, ‐0.09] |
| 2.2 HbA1c 12 mths | 6 | 775 | Mean Difference (IV, Fixed, 95% CI) | ‐0.62 [‐0.85, ‐0.38] |
| 3 Low‐density lipoprotein (LDL) mmol/L | 11 | Mean Difference (IV, Fixed, 95% CI) | Subtotals only | |
| 3.1 LDL 6 mths | 6 | 1213 | Mean Difference (IV, Fixed, 95% CI) | ‐0.25 [‐0.34, ‐0.17] |
| 3.2 LDL 12 mths | 7 | 1469 | Mean Difference (IV, Fixed, 95% CI) | ‐0.21 [‐0.29, ‐0.14] |
| 4 Low‐density lipoprotein pharmacist vs nurse 6 mths | 6 | 1213 | Mean Difference (IV, Fixed, 95% CI) | ‐0.25 [‐0.34, ‐0.17] |
| 4.1 Pharmacist | 4 | 629 | Mean Difference (IV, Fixed, 95% CI) | ‐0.09 [‐0.20, 0.02] |
| 4.2 Nurse | 2 | 584 | Mean Difference (IV, Fixed, 95% CI) | ‐0.52 [‐0.67, ‐0.38] |
| 5 Adherence (continuous) | 4 | 700 | Std. Mean Difference (IV, Fixed, 95% CI) | 0.15 [0.00, 0.30] |
| 6 Adherence (dichotomous) | 4 | 935 | Risk Difference (M‐H, Fixed, 95% CI) | 0.06 [‐0.00, 0.12] |
| 7 Health‐related quality of life | 8 | Mean Difference (IV, Fixed, 95% CI) | Subtotals only | |
| 7.1 Physical component (SF12 or 36) | 8 | 2385 | Mean Difference (IV, Fixed, 95% CI) | 1.17 [0.16, 2.17] |
| 7.2 Mental component (SF‐12 or 36) | 6 | 2246 | Mean Difference (IV, Fixed, 95% CI) | 0.58 [‐0.40, 1.55] |
| 8 Health facility resource use | 5 | Risk Difference (M‐H, Fixed, 95% CI) | Subtotals only | |
| 8.1 Emergency Department visits | 3 | 4626 | Risk Difference (M‐H, Fixed, 95% CI) | 0.01 [‐0.02, 0.03] |
| 8.2 Hospitalisations | 5 | 4870 | Risk Difference (M‐H, Fixed, 95% CI) | ‐0.01 [‐0.03, 0.01] |
Characteristics of studies
Characteristics of included studies [ordered by study ID]
Ansari 2003.
| Methods | Randomised controlled trial | |
| Participants | San Francisco Veterans Affairs Medical Center, San Francisco, USA Patients receiving primary care for CHF who met the Framingham criteria for CHF and had a left ventricular ejection fraction ≤ 45% or moderate or severe left ventricular systolic dysfunction on their latest evaluation and no contraindications to β‐blockers 74 health professionals randomised to one of three groups Group 1 Health professionals provided education on initiation and up‐titration of β‐blockers Group 2 Nurse facilitator group Group 3 Provider and patient notification on β‐blocker therapy Patients 169 randomised (51 control, 54 nurse facilitator, 64 provider/patient notification) Health professional delivering intervention ‐ study nurse practitioner who with other providers received substantial education on the use of β‐blockers in heart failure |
|
| Interventions | PATIENTS The nurse practitioner assumed responsibility for initiating, titrating, and stabilising appropriate CHF patients on β‐blockers to target or maximum tolerated dose |
|
| Outcomes | PATIENTS Proportion of patients who were initiated or up‐titrated and maintained on β‐blockers Proportion of patients reaching target doses of β‐blockers Adverse events ‐ hospitalisations, emergency room visits, deaths RESOURCE USE Hospitalisations, emergency room visits Drug use |
|
| Notes | Median follow‐up 12 months. | |
| Risk of bias | ||
| Bias | Authors' judgement | Support for judgement |
| Random sequence generation (selection bias) | Low risk | "A stratified randomisation using computer‐generated, random numbers." |
| Allocation concealment (selection bias) | Unclear risk | Allocation concealment was not reported. |
| Blinding of participants and personnel (performance bias) All outcomes | High risk | All patients and health professionals were aware of the group allocation. |
| Blinding of outcome assessment (detection bias) All outcomes | Low risk | "An independent research assistant assessed the use of beta‐blocker therapy." |
| Incomplete outcome data (attrition bias) | Unclear risk | Incomplete outcome data were not reported. Intention‐to‐treat. |
| Selective reporting (reporting bias) | Unclear risk | Specific adverse drug‐related events were not reported. |
| Other bias | Unclear risk | Degree of supervision of two cardiologists, although nurse practitioner assumed responsibility for β‐blocker therapy. |
Aubert 1998.
| Methods | Randomised controlled trial | |
| Participants | Two primary care clinics within the Jacksonville Health Care Group, Jacksonville, Florida, USA Patients with diabetes mellitus (type 1 or 2) Patients 138, (71 in nurse case management, 67 usual care) Health professional delivering intervention ‐ registered nurse with 14 years of clinical experience and certified diabetes educator trained to follow a set of detailed management algorithms under direction of a family care physician and an endocrinologist who were responsible for diabetes management decisions No unit of analysis errors |
|
| Interventions | PATIENTS To compare diabetes control in patients receiving nurse case management versus usual care Nurse‐led management at baseline, 2 weeks and quarterly, telephone calls weekly (insulin) or 2‐weekly (oral agents, diet/exercise) Patients referred to 5 week,12‐hour multidisciplinary diabetes education programme PROVIDER Twice‐weekly meeting with physicians to review patient progress, medication adjustments, and other issues Medication adjustments or changes were communicated to the patients' primary care physician |
|
| Outcomes | PATIENTS Change in HbA1c at 12 months Fasting glucose Fasting lipids Serum creatinine Weight Health‐related quality of life (Behavioural Risk Factor Surveillance System, BRFSS) Adverse events RESOURCE USE Hospital admissions Emergency department visits Outpatient visits |
|
| Notes | 12‐month study. A complex intervention, not just prescribing and not just nurses involved e.g. dieticians. | |
| Risk of bias | ||
| Bias | Authors' judgement | Support for judgement |
| Random sequence generation (selection bias) | Low risk | Patients randomly assigned in blocks based on a 1:1 allocation ratio and a block size of three. |
| Allocation concealment (selection bias) | Unclear risk | No details provided. |
| Blinding of participants and personnel (performance bias) All outcomes | High risk | Not feasible with study design. |
| Blinding of outcome assessment (detection bias) All outcomes | Low risk | Laboratory measures. Unclear if the quality of life questionnaire was influenced by the group to which the patients were randomised. |
| Incomplete outcome data (attrition bias) | High risk | Total attrition 38/138 (27.5%) at 12 months, exact numbers in each group not stated but stated 'patients lost to follow‐up did not significantly differ by treatment group.' Two intention‐to‐treat analyses. |
| Selective reporting (reporting bias) | Low risk | All outcomes reported. |
| Other bias | Unclear risk | Influence of collaborative meetings with physicians on outcomes unclear. Increased loss to follow‐up of younger patients in the intervention group. |
Barr Taylor 2003.
| Methods | Randomised controlled trial | |
| Participants | Kaiser Permanente Medical Center Santa Clara California, USA Patients with long‐standing diabetes, one or more major comorbid conditions, HbA1c > 10% Patients 169, (intervention 84, usual medical care 85) Health professional delivering intervention ‐ nurse care managers who had extensive experience in managing lipids and hypertension and attended several days training on local protocols for diabetes and cholesterol. They also attended diabetes group classes and shadowed diabetes case managers and physicians treating diabetes No unit of analysis errors |
|
| Interventions | PATIENTS The nurse reviewed the patients' medical, lifestyle, and psychosocial status, performed a foot examination, recorded BP, pulse and developed a self‐management plan for the patient. Patients attended group classes (1‐2 hrs) once a week for 4 weeks. Telephone follow‐up calls reviewed patient goals, medication use, symptoms, glucose monitoring, BP monitoring, and self‐management. Calls were made before the fourth group session and at 5, 8, 12, 16, 20, 28, 36, 44 weeks. The nurses used treatment algorithms to titrate the patients medications for diabetes, cholesterol and hypertension. The primary care physician was called if new medication was indicated or to report any unusual findings. |
|
| Outcomes | PATIENTS HbA1c Lipids (total cholesterol, LDL, HDL, triglycerides) Fasting glucose BP (systolic BP, diastolic BP) Microalbuminuria BMI Psychosocial (Duke Activity Status Index and the SF‐36 health survey) Depression (Beck Depression Index) Satisfaction RESOURCE USE Number of physician visits PROCESS Percentage with foot exam, dilated eye exam, flu shot, pneumovax PROVIDER Satisfaction |
|
| Notes | 12‐month study Does not permit an analysis of the specific need for various intervention components. |
|
| Risk of bias | ||
| Bias | Authors' judgement | Support for judgement |
| Random sequence generation (selection bias) | Unclear risk | Patients were randomised, method of random sequence generation not described. |
| Allocation concealment (selection bias) | Unclear risk | Method of concealment not described. |
| Blinding of participants and personnel (performance bias) All outcomes | High risk | Not feasible with study design. |
| Blinding of outcome assessment (detection bias) All outcomes | Low risk | Laboratory values low risk. Unclear if questionnaire completion can be biased by the group allocation. |
| Incomplete outcome data (attrition bias) | Unclear risk | Attrition ‐ 14/85 (16.5%) usual care,17/84 (20%) nurse‐managed. Analysis on patients completing the study. |
| Selective reporting (reporting bias) | Low risk | Predefined outcomes reported (apart from urinalysis). |
| Other bias | Unclear risk | Patient and physician satisfaction surveys not validated surveys. |
Becker 2005.
| Methods | Cluster‐randomised controlled trial | |
| Participants | Ten Baltimore Hospitals, USA Black 30‐59 year‐old siblings with no known CHD, (systolic BP ≥ 140 or diastolic BP ≥ 90 mmHg, cholesterol ≥ 3.37 mmol/L or current smoking) of a proband with CHD aged < 60 years Patients 364, (community‐based care 196, "enhanced" primary care 168) Health professional delivering intervention ‐ nurse practitioner and community health worker |
|
| Interventions | PATIENTS Community‐based care versus "enhanced" primary care (control) to reduce CHD risk Patients randomised to community‐based care received care from a nurse practitioner in a non‐clinical site with an exercise room. BP, pharmacotherapy and compliance were assessed. A community health worker provided dietary counselling, smoking cessation and exercise counselling. Progress was reviewed by the study physician twice monthly. Changes in pharmacotherapy were communicated to the primary care physician who treated conditions outside the risk factors and were asked not to change risk factor medication. Decisions on how to apply the guidelines were within the full purview of the nurse practitioner. Prescriptions for risk factor therapy were provided free at any pharmacy. Telephone monitoring was available. The enhanced primary care group received the same risk specific materials and free risk factor pharmacotherapy. |
|
| Outcomes | PATIENTS changes in LDL Systolic BP and diastolic BP 10‐year Framingham risk scores for CHD Lifestyle (dietary fats, sweets, smoking) |
|
| Notes | 12‐month study. Randomised at family level. | |
| Risk of bias | ||
| Bias | Authors' judgement | Support for judgement |
| Random sequence generation (selection bias) | Low risk | Computer‐generated randomisation schema. |
| Allocation concealment (selection bias) | Unclear risk | Not specified. |
| Blinding of participants and personnel (performance bias) All outcomes | High risk | Not feasible with the study design. |
| Blinding of outcome assessment (detection bias) All outcomes | Low risk | Laboratory values low. BP by nurse practitioner (not blinded). |
| Incomplete outcome data (attrition bias) | High risk | Intention‐to‐treat, Attrition 27% community‐based care, 26% enhanced primary care 12 months. |
| Selective reporting (reporting bias) | Low risk | None evident. |
| Other bias | Unclear risk | Application of guidelines rested with nurse practitioner but multifactorial intervention with effect of prescribing on outcomes unclear. |
Bruhn 2013.
| Methods | Randomised controlled trial (exploratory) | |
| Participants | Six general practices with prescribing pharmacists in Grampian (3) and East Anglia (3), UK Patients over 18 years with chronic pain, living in their own houses and who had received two or more acute prescriptions and/or one repeat prescription in the last 120 days for an analgesic and or an non‐steroidal anti‐inflammatory drug Patients 196, (70 pharmacist medication review with face‐to‐face prescribing, 63 pharmacist medication review and feedback to GP, 63 treatment as usual) Health professional delivering intervention ‐ prescribing and review arms were supplementary or independent prescribing pharmacists who also undertook a 2‐day course updating them on pain management No unit of analysis errors |
|
| Interventions | PATIENTS To compare the effectiveness of pharmacist medication review with or without pharmacist prescribing with standard care for patients with chronic pain Prescribing arm ‐ medication and pain diary review, pharmaceutical care plan agreed, prescribing of medications Review arm ‐ medication review focused on pain‐related prescription medications and pharmaceutical care plan detailing recommended medication changes for the GP Treatment as usual ‐ standard general practice care |
|
| Outcomes | PATIENTS SF‐12 v2 general health and functioning scale Health Utilities Index, (HUI3) health status and health‐related quality of life Clinical Practice Guidelines pain severity scale Health Anxiety and Depression Scale (HADS) Patient satisfaction PROVIDERS Semi‐structured interviews with staff |
|
| Notes | Exploratory 6‐month trial and no power calculation done. | |
| Risk of bias | ||
| Bias | Authors' judgement | Support for judgement |
| Random sequence generation (selection bias) | Low risk | Telephone randomisation service with a random number allocation which ensured allocation concealment. The allocation was 1:1:1. |
| Allocation concealment (selection bias) | Low risk | Telephone randomisation service with a random number allocation which ensured allocation concealment. |
| Blinding of participants and personnel (performance bias) All outcomes | High risk | No blinding of participants due to the nature of the intervention. |
| Blinding of outcome assessment (detection bias) All outcomes | Unclear risk | Unclear if questionnaire completion by patients can be biased according to the group to which they were randomised. Outcome measures self‐reported. |
| Incomplete outcome data (attrition bias) | High risk | 3 months attrition. Prescribing group 24.3% (17/70), review 15.9% (10/63), treatment as usual 12.7% (8/63). 6 months attrition 28.6% (20/70), 23.8%(15/63), 14.3% (9/63), respectively. |
| Selective reporting (reporting bias) | Low risk | Predefined outcome measures reported. |
| Other bias | Unclear risk | Recruitment rate 14% (196/1397) and only 25% of eligible patients entered the trial. Unclear if patient satisfaction questionnaire validated. HADS is a screening tool, but used to classify people by severity of depression and anxiety. |
Chenella 1983.
| Methods | Randomised controlled trial | |
| Participants | A general hospital inpatient unit, Los Angeles County‐University of Southern California Medical Center, USA Hospital patients referred to the anticoagulant service by their primary physicians Patients 81, (42 in the pharmacist prescriber group, 39 in the physician prescriber group) Health professional delivering intervention ‐ 7 certified pharmacist prescribers. Each prescribing pharmacist had a minimum of six months clinical experience treating patients with anticoagulants and had undergone a certification process. one physician undertook the physician prescribing. Practice ‐1 No unit of analysis errors |
|
| Interventions | PATIENTS Pharmacist versus physician independent management of anticoagulant therapy of inpatients Patients in the pharmacist prescriber group had a pharmacist write daily heparin and warfarin dosage adjustments which were administered to the patients. The physician independently monitored laboratory results for the pharmacist patient group and simulated heparin and warfarin doses. In the physician group roles were reversed. Pharmacists and physician recorded dosage adjustments in a blinded fashion. Interaction between pharmacist and physician and vice‐versa if clinical safety a concern. |
|
| Outcomes | PATIENTS Heparin dosage (units/24 hours) Warfarin dosage (mg) Partial thromboplastin time (sec) Number of days to achieve therapeutic proconversion and prothrombin Adverse events |
|
| Notes | Study period 5 months. | |
| Risk of bias | ||
| Bias | Authors' judgement | Support for judgement |
| Random sequence generation (selection bias) | Unclear risk | Randomisation process not reported. Patients were randomised to one of two treatment groups. |
| Allocation concealment (selection bias) | Unclear risk | Method of concealment not reported. Protocol not located. |
| Blinding of participants and personnel (performance bias) All outcomes | Unclear risk | Patients probably blinded. Pharmacists and physician not blinded. |
| Blinding of outcome assessment (detection bias) All outcomes | Low risk | Laboratory measures of anticoagulation. Unclear method of reporting adverse events. |
| Incomplete outcome data (attrition bias) | Low risk | All 81 consecutive hospitalised patients had results reported. |
| Selective reporting (reporting bias) | Low risk | All predefined outcomes reported. |
| Other bias | Unclear risk | Familiarity and interaction of physician and pharmacist may have influenced results. |
Choe 2005.
| Methods | Randomised controlled trial | |
| Participants | A university affiliated ambulatory care clinic, USA Patients with poorly controlled type 2 diabetes (HbA1c 8% or above) Patients 80, (41 intervention, 39 control patients) Single practice Health professional delivering intervention ‐ one pharmacist who was already established as a pharmacotherapy consultant at the clinic. All therapeutic recommendations were discussed with the primary care physician before significant therapy alterations. Medication management protocols provided guidance. Some autonomy of prescribing No unit of analysis issues |
|
| Interventions | PATIENTS Pharmacist case management versus usual medical care A clinical pharmacist provided evaluation and modification of pharmacotherapy, self‐management diabetes education and reinforcement of diabetes complications, screening processes through clinic visits and telephone follow‐up |
|
| Outcomes | PATIENTS HbA1c PROCESS Rates of diabetes process measures ‐ HbA1c and LDL measurement, dilated retinal examination, urine microalbuminuria screening or use of ACE inhibitors, monofilament testing |
|
| Notes | Follow‐up HbA1c measurement was 13.6 months for intervention group and 14.9 months for control group. | |
| Risk of bias | ||
| Bias | Authors' judgement | Support for judgement |
| Random sequence generation (selection bias) | Low risk | Hand drawing of lots, zero control, 1 for intervention, stratified into 4 groups based on baseline HbA1c. |
| Allocation concealment (selection bias) | Unclear risk | Method of concealment not described. |
| Blinding of participants and personnel (performance bias) All outcomes | High risk | Patients, providers and case managers were not blinded to the intervention. |
| Blinding of outcome assessment (detection bias) All outcomes | Low risk | Objective laboratory outcome measures. |
| Incomplete outcome data (attrition bias) | Unclear risk | Outcome measures obtained for 81% of patients, attrition 5/41 (12%) intervention,10/39 (26%) control. Data imputed. |
| Selective reporting (reporting bias) | Low risk | Expected outcomes reported. |
| Other bias | High risk | Unclear level of autonomous prescribing practice. i.e. some autonomy in decision making versus a great deal of autonomy to make medication adjustments. Physicians could discuss non‐intervention cases with the pharmacist. |
Cohen 2011.
| Methods | Randomised controlled trial | |
| Participants | Ambulatory care clinic, Providence Veterans Affairs Medical Center, Providence Rhode Island, USA Patients were veterans with type 2 diabetes and cardiovascular risk factors. HbA1c > 7%, LDL > 2.59 mmol/L (or > 1.81 mmol/L for those with coronary artery disease), and BP > 130/80 mmHg documented in last 6 months Patients 99, (50 intervention, 49 control) Health professional delivering intervention ‐ pharmacists (number not reported) with prescribing privileges No unit of analysis errors |
|
| Interventions | PATIENTS A complex multiprofessional intervention (pharmacist, nurse, dietician etc) with pharmacist prescribing activity a small part of the intervention versus standard care Regular visits to primary care provider plus 4 once‐weekly 2‐hour sessions followed by 5 monthly booster sessions with 4‐6 participants. Educational component for first hour by multidisciplinary team covering chronic conditions and complications and recommendations on care. Session delivered by pharmacist, dietician, nurse, physical therapist. Second hour intervention delivered by a clinical pharmacist (nationally certified diabetes educator or a Rhode Island certified diabetes outpatient educator) that aimed to achieve behavioural change. Medication regimens were modified as required by the pharmacist. Individual assistance with exercise /diet was available after 4 weekly sessions. |
|
| Outcomes | PATIENTS Change in proportion of participants achieving target glycaemic and cardiac risk factor goals as recommended by the ADA (systolic BP < 130 mmHg, LDL < 100 mg/dL (2.59 mmol/L), HbA1c < 7%), absolute change from baseline for health‐related quality of life, SF‐36 for Veterans (VR‐36) Assessment of perceived competence Summary of Diabetes Self‐Care Activities Medication adherence PROCESS Prescribed medicines RESOURCE USE Primary care provider visits |
|
| Notes | 6‐month study. Complex multifactorial intervention and cannot relate findings solely to pharmacist prescribing activity. |
|
| Risk of bias | ||
| Bias | Authors' judgement | Support for judgement |
| Random sequence generation (selection bias) | Low risk | 'randomised controlled trial', participants assigned to intervention or standard primary care on a 1:1 ratio. |
| Allocation concealment (selection bias) | Unclear risk | Not described. |
| Blinding of participants and personnel (performance bias) All outcomes | High risk | Not feasible with study design. |
| Blinding of outcome assessment (detection bias) All outcomes | Low risk | Objective outcome laboratory results. Unclear if provider undertaking BP readings was blinded. Unclear if questionnaire completion by patients can be biased according to the group to which they were randomised. |
| Incomplete outcome data (attrition bias) | Low risk | 103 patients randomised, 4 participants withdrew consent, one standard care, 3 intervention. These were not included in the analysis. 3 patients died during the study, 2 in intervention, 1 standard care and included in analysis. |
| Selective reporting (reporting bias) | Low risk | Expected outcomes reported. |
| Other bias | Unclear risk | LDL significantly lower in intervention arm at baseline. Multifactorial intervention with effect of prescribing on outcomes unclear. |
DeBusk 1994.
| Methods | Randomised controlled trial | |
| Participants | 5 Kaiser Permanente Medical centres in San Francisco Bay area, USA Men and women aged 70 years or younger hospitalised for acute myocardial infarction. Patient enlisted on hospital day 3 or when stabilised Patients 585, (intervention 293, usual medical care 292) Health professional delivering the intervention ‐ programme nurses who participated in 80 hours of training by specialists in cardiology, psychiatry, lipid therapy, nutrition and nursing practice. Training focused on exercise testing, and training, diet, drug management of hyperlipidaemia, smoking cessation and psychosocial interventions. Lipid drug therapy by algorithm. |
|
| Interventions | PATIENTS Effectiveness of physician‐directed nurse‐managed home‐based case management for coronary risk factor modification versus usual medical care. In addition to usual care, patients were encouraged to monitor health habits (self‐reports) and set subgoals. Patients ‐ After discharge, follow‐up by nurse initiated telephone contacts, computer‐generated progress reports and visits to the nurse. Nursing effort involved 9 hours per patient in the first year covering lifestyle, lipid‐lowering drug therapy (2.5 hours) and liaison. Changes in drug therapy at 120, 150, and 180 days based on response. Nurses could change a drug dosage or discontinue a drug but required permission from the primary care physician to add a new drug. Nurses provided detailed counselling on drug therapy. |
|
| Outcomes | PATIENTS Smoking cessation Nutritional management Lipid‐lowering therapy Exercise training Adverse events |
|
| Notes | 12‐month study. | |
| Risk of bias | ||
| Bias | Authors' judgement | Support for judgement |
| Random sequence generation (selection bias) | Low risk | Randomly assigned using a computer programme, done centrally. |
| Allocation concealment (selection bias) | Low risk | Nurses notified of assignments by telephone from co‐ordinating centre staff. |
| Blinding of participants and personnel (performance bias) All outcomes | High risk | Not feasible with study design. |
| Blinding of outcome assessment (detection bias) All outcomes | Low risk | Laboratory measures low risk. Unclear risk of nurse manager influence on other outcome assessments (smoking cessation, nutrition, exercise). |
| Incomplete outcome data (attrition bias) | Unclear risk | Dropouts at 12 months, intervention 11.6%, usual care 15.4%, reasons given. |
| Selective reporting (reporting bias) | Low risk | None apparent. |
| Other bias | High risk | Influence on prescribing by primary care physician for new drugs and telephone consultations from lipid specialist and senior nurse co‐ordinator. |
Denver 2003.
| Methods | Controlled trial | |
| Participants | Outpatient nurse‐led clinic, Whittington Hospital North Islington, London, UK Adult patients with type 2 diabetes and BP ≥ 140/80 mmHg, in receipt of BP treatment and without any serious or life‐threatening conditions Patients 120, (nurse‐led clinic 60, conventional primary care 60) Health professional delivering intervention ‐ hypertension nurse No unit of analysis errors |
|
| Interventions | PATIENTS Effectiveness of a nurse‐led hypertension clinic versus conventional primary care in general practice on lowering BP in type 2 diabetic patients with uncontrolled hypertension at risk of cardiovascular disease. Nurse‐led clinic patients were seen monthly for 3 months and then 6‐weekly for 3 months. At each visit BP was measured and compliance with the drug regimen reviewed (based on agreed guidelines). Advice on healthy living was provided and side‐effects of existing antihypertensive treatment discussed. Intervention focused on intensifying antihypertensive treatment. Hypertension nurses and primary care physicians used the same guidelines. The nurse could initiate treatment changes (drug titration or new drug added).New prescriptions were provided by attending physicians. Patients in both groups reviewed by the nurse at six months and baseline measures repeated. |
|
| Outcomes | PATIENTS Change in systolic BP Lipids (total cholesterol, HDL, total triglycerides) HbA1c Urinary albumin excretion Serum creatinine Changes in absolute stroke and CHD risk scores |
|
| Notes | 6‐month study Influence of attending physician on prescribing unclear Multifactorial intervention. Importance of changing treatment to achieve target BP |
|
| Risk of bias | ||
| Bias | Authors' judgement | Support for judgement |
| Random sequence generation (selection bias) | Unclear risk | Three investigators independently assessed and randomly referred patients from their clinic. Patients were then allocated to conventional primary care or nurse‐led clinic on an alternate basis. |
| Allocation concealment (selection bias) | Unclear risk | Allocation concealment not specified. |
| Blinding of participants and personnel (performance bias) All outcomes | High risk | Not feasible with study design. |
| Blinding of outcome assessment (detection bias) All outcomes | Unclear risk | Laboratory measures low. BP ‐ high as nurse measured intervention group BP at each visit and both groups at 6 months. Unclear if CHD and stroke risk scoring influenced by provider. |
| Incomplete outcome data (attrition bias) | Low risk | Intention‐to‐treat analysis, low attrition 4/60 conventional primary care, 1/60 nurse‐led clinic. |
| Selective reporting (reporting bias) | Low risk | Predefined outcomes reported. |
| Other bias | Unclear risk | Influence of attending physician on prescribing. |
Einhorn 1978.
| Methods | Randomised controlled trial | |
| Participants | Profamilia (Colombian Association for Family Welfare) central clinic, Bogota, Colombia New clients seeking contraceptive services Clients 1532, (physician 769, nurse 763) Health professional delivering intervention ‐ family planning nurses Practice ‐ 1 No unit of analysis issues |
|
| Interventions | CLIENTS Family planning services provided by nurses versus physicians Prescription of oral contraceptives Insertion of intrauterine devices (IUD) Breast, pelvic, vaginal, and abdominal examinations Treatment of cervico‐vaginitis |
|
| Outcomes | CLIENTS Unwanted pregnancy Side‐effects PROCESS Method prescribed to client at first and next visit Incidence of interim method prescriptions Deferment of IUD insertions Changing of methods by provider Number and reason for clinic revisits |
|
| Notes | 6‐month study. | |
| Risk of bias | ||
| Bias | Authors' judgement | Support for judgement |
| Random sequence generation (selection bias) | Unclear risk | During a six‐week period clients attending the clinic were randomly assigned to either a physician group or a family planning nurse group. Method of sequence generation unclear. |
| Allocation concealment (selection bias) | Unclear risk | Concealment not explained. |
| Blinding of participants and personnel (performance bias) All outcomes | High risk | Not feasible with study design. |
| Blinding of outcome assessment (detection bias) All outcomes | Unclear risk | Not explained. |
| Incomplete outcome data (attrition bias) | High risk | 36.3% of clients had no revisits. No details of number recruited. |
| Selective reporting (reporting bias) | Unclear risk | Outcomes stated are rather vague. |
| Other bias | Unclear risk | Bias related to sex, all nurses female and most physicians male. |
Ellis 2000.
| Methods | Randomised controlled trial | |
| Participants | Nine Veterans Affairs medical centres (VMAC), USA (subanalysis using data from the IMPROVE study) VAMC patients at high risk for drug‐related adverse events who had a diagnosis of dyslipidaemia at baseline in the IMPROVE study High risk if three or more of the following: 5 or more drugs, 12 or more doses/day, 4 or more drug changes in the previous year, 3 or more concurrent diseases, history of noncompliance, treatment with drugs requiring therapeutic monitoring. Patients 437, (208 intervention group, 229 control group) Health professional delivering intervention ‐ 78 ambulatory care clinical pharmacists No unit of analysis errors |
|
| Interventions | PATIENTS Clinical pharmacists providing pharmaceutical care in addition to usual medical care versus usual medical care in the management of dyslipidaemia. Pharmacists adjusted drug regimens to improve care and disease control and identify and prevent drug‐related problems. Pharmacists followed patients until outcome goals achieved. Each clinical pharmacist was to practice according to the defined scope of practice in the institution. Depending on the site and scope of practice drug therapy could be adjusted and laboratory tests ordered. Collaboration with physicians varied. Pharmacists determined frequency of follow‐up appointments but patients were to be seen at least 3 times, baseline, 6 months, 12 months. |
|
| Outcomes | PATIENTS The percentage of patients achieving guideline LDL goals RESOURCE USE Cost estimation of pharmacist versus usual care for hospitalisations, clinic visits, all drugs, lipid agents, laboratory Healthcare visits |
|
| Notes | Pharmacists managed entire pharmaceutical care needs rather than just managing dyslipidaemia. | |
| Risk of bias | ||
| Bias | Authors' judgement | Support for judgement |
| Random sequence generation (selection bias) | Unclear risk | Potential participants for the IMPROVE study were randomised by the central co‐ordinating centre at the University of Colorado Health Science Center. This study analysed only patients with a diagnosis of dyslipidaemia at baseline therefore randomisation was not conducted strictly for patients with lipid disorders. |
| Allocation concealment (selection bias) | Unclear risk | Concealment process not stated. |
| Blinding of participants and personnel (performance bias) All outcomes | High risk | Not feasible with study design. |
| Blinding of outcome assessment (detection bias) All outcomes | Low risk | Objective outcome laboratory and cost measure. |
| Incomplete outcome data (attrition bias) | Low risk | Intention‐to‐treat analysis used. |
| Selective reporting (reporting bias) | Low risk | Predefined outcomes reported. |
| Other bias | Unclear risk | Effect on patient management of close collaboration between pharmacists and physicians at some sites unclear. |
Fairall 2008.
| Methods | Cluster‐randomised controlled trial | |
| Participants | 31 primary care antiretroviral clinics, (16 intervention, 15 control) Free State Province South Africa Cohort 1. Adults ≥ 16 years with CD4 counts of 350 cells per μL or less who were not receiving antiretroviral therapy ‐ 5390 patients enrolled for intervention, 3862 control Cohort 2 . Adults who had received antiretroviral therapy for at least six months and were being treated at enrolment. 3029 intervention patients, 3202 control Healthcare professional delivering intervention ‐ prescribing nurses who received at least four educational outreach training sessions about antiretroviral therapy prescribing and side‐effects with guidelines and algorithms (PALSA PLUS) to start and monitor patients on antiretroviral therapy and identify those needing referral to a doctor |
|
| Interventions | PATIENTS Prescribing of antiretroviral treatment by nurses versus doctors Training delivered and trial co‐ordinator visited every intervention clinic to establish a team responsible for support of decentralised care (phase 1). Nurses assumed responsibility for prescribing antiretroviral therapy for patients already receiving treatment (phase 2). Nurses began to initiate antiretroviral therapy for eligible patients (phase 3) Equivalence trial ‐ nurse‐led antiretroviral therapy would be as effective in maintenance of viral suppression as doctor‐led treatment |
|
| Outcomes | PATIENTS Cohort 1: Primary outcome Time to death from enrolment Secondary outcomes Measures of health status (changes in weight, CD4 cell counts, viral loads, hospital admissions, inpatient days) Indicators of quality of care (antiretroviral therapy initiation, time from enrolment to start of antiretroviral therapy, detection of tuberculosis, co‐trimoxazole provision, programme retention 1 year after enrolment, baseline CD4 cell count in patients who started antiretroviral therapy, clinic consultations with nurses and doctors) Cohort 2: Primary outcome Proportion with undetectable viral loads (< 400 copies/mL) 12 months after enrolment Secondary outcomes Measures of health status (time to death censored 12‐18 months after enrolment, changes in weight and CD4 cell counts, hospital admissions, inpatient days) Indicators of quality of care (programme retention, diagnosis of tuberculosis, co‐trimoxazole provision, switching of antiretroviral therapy regimens, clinic consultations with doctors and nurses) |
|
| Notes | 12‐18 month follow‐up. Equivalence trial. | |
| Risk of bias | ||
| Bias | Authors' judgement | Support for judgement |
| Random sequence generation (selection bias) | Low risk | Clinics and their patients were randomly assigned. Within each stratum clinics were randomly assigned to intervention and control according to sequences of random numbers in a random number table (even for control, odd for intervention). |
| Allocation concealment (selection bias) | Low risk | Trial statistician undertook randomisation before trial started. |
| Blinding of participants and personnel (performance bias) All outcomes | High risk | Patients and clinicians could not be masked to group assignment. |
| Blinding of outcome assessment (detection bias) All outcomes | Low risk | Register of deaths and laboratory values. All interim analysis was blind but data analysts were not masked after the database was locked for final analysis. |
| Incomplete outcome data (attrition bias) | Low risk | Data for primary outcomes available for 94% of participants. Intention‐to‐treat analysis. |
| Selective reporting (reporting bias) | Low risk | Predefined outcomes reported. |
| Other bias | Unclear risk | Control group unintentionally favoured by Governement programme to improve access to doctors during the trial. Hesitency of nurses to initiate antiretroviral therapy when they had the option to refer to doctors (only a quarter of patients who started antiretroviral therapy had treatment initiated by nurses) |
Finley 2003.
| Methods | Randomised controlled trial | |
| Participants | Kaiser Permanente Medical Center, San Rafael, California, USA Patients who were members of the health maintenance organisation had just started antidepressant therapy for depressive symptoms and referred to the protocol by their primary care provider. Patients 125, (75 intervention, 50 control) Health professional delivering intervention ‐ two clinical pharmacists. Both had doctor of pharmacy degrees with several years of direct patient care. One was board certified as a psychiatric pharmacy who mentored the other investigator during a 2‐month training period. |
|
| Interventions | PATIENTS Collaborative care model of clinical pharmacists providing drug therapy management and treatment follow‐up versus usual care. Pharmacist care manager undertook a 30‐minute intake interview to assess severity of psychopathology, identify potential stressors and other predisposing factors. Medical, psychiatric, and drug therapy histories recorded and whether any exclusion criteria were present. Patient education undertaken. Pharmacists could prescribe ancillary drugs e.g. for sleep and titrate antidepressant drugs but if a change in antidepressant drug was indicated approval from the primary care provider was required. If changes to the antidepressant regimen were warranted the pharmacists communicated this recommendation to the provider. The designated psychiatric mentor met with the clinical pharmacists each week and was available for consultation. Pharmacy care managers made follow‐up telephone calls to patients at weeks 1, 2, 4, 10, 16. Patients had clinic visits at weeks 6 and 24. |
|
| Outcomes | PATIENTS Adherence to antidepressant drug therapy Clinical and functional severity (Brief Inventory for Depressive Symptoms (BIDS) and Work and Social Disability Scale) Patient satisfaction RESOURCE USE Change in all clinic or emergency department visits Drug costs PROVIDERS Experience and satisfaction of primary care providers |
|
| Notes | 6‐month study | |
| Risk of bias | ||
| Bias | Authors' judgement | Support for judgement |
| Random sequence generation (selection bias) | Unclear risk | Participants were randomly assigned to the collaborative care model or back to usual care in a 3:2 ratio (sequence generation not described). |
| Allocation concealment (selection bias) | Low risk | The investigators opened a sealed envelope that determined study group assignment. |
| Blinding of participants and personnel (performance bias) All outcomes | High risk | Participants and providers aware of study group assignments. |
| Blinding of outcome assessment (detection bias) All outcomes | Unclear risk | Unclear if questionnaires completed by patients can be biased according to the group to which they were randomised. |
| Incomplete outcome data (attrition bias) | High risk | Clinical outcome surveys incomplete or not available. control 26/50 (52%), intervention 21/75 (28%). Patient satisfaction survey attrition high, control 17/50 (34%), intervention 16/75 (21%). Provider satisfaction attrition 12/30 (40%) |
| Selective reporting (reporting bias) | Low risk | Predefined outcomes reported. |
| Other bias | High risk | High female population (85% intervention, 84% control). Physican practices may have improved after establishing the clinical pharmacy services. Unclear if patient and provider satisfaction surveys were validated surveys. Effect of USD 20 reimbursement for returning surveys. Influence of the psychiatric mentor on prescribing unclear. |
Fischer 2012.
| Methods | Randomised controlled trial | |
| Participants | Community health centre ‐ Denver Health's Westside Family Health Center (Westside Clinic) Denver, Colorado, USA Patients aged > 17 years with diabetes with at least two visits in the past year (Latino ethnicity 59%, African America 21%) Patients 762, (381 intervention, 381 control) Health professional delivering intervention ‐ 3 nurses sharing role No unit of analysis errors |
|
| Interventions | PATIENTS An algorithm‐driven telephone care by nurses as an adjunct to usual care versus usual care to improve lipid control in patients with diabetes. Nurses independently checked laboratory results and initiated and titrated lipid therapy over the telephone with a 2‐week follow‐up call to assess side‐effects and a 6‐week call to recheck lipids after medication changes. Nurses also promoted behavioural change through motivational interviewing and self‐management techniques. The nurses used algorithms for glycaemic and BP control and vaccinations. The nurse used pre‐printed prescriptions signed by the physician who offered educational and management support. |
|
| Outcomes | PATIENTS Proportion of patients with an LDL less than 100 mg/dL (2.59 mmol/L) Proportion of patients with cardiovascular disease and an LDL < 70 mg/dL (1.8 mmol/L) Percentage of patients with HbA1c < 7 mg/dL Percentage of patients with BP < 130/80 mmHg RESOURCE USE Hospital inpatient admissions Emergency department visits Outpatient visits Average hospital charges per patient |
|
| Notes | 20‐month study but unclear time points for measurements. | |
| Risk of bias | ||
| Bias | Authors' judgement | Support for judgement |
| Random sequence generation (selection bias) | Unclear risk | This randomised controlled trial but no detail on sequence generation. |
| Allocation concealment (selection bias) | Unclear risk | Allocation concealment not specified. |
| Blinding of participants and personnel (performance bias) All outcomes | High risk | Not feasible with study design. |
| Blinding of outcome assessment (detection bias) All outcomes | Low risk | Laboratory measures low risk. Investigators doing analysis were not blinded to control versus intervention groups. |
| Incomplete outcome data (attrition bias) | Low risk | Intention‐to‐treat analysis. Missing data on medication analysis, side‐effects, adherence due to incomplete data base. Nurse unable to contact 65/381 (17%) intervention patients. |
| Selective reporting (reporting bias) | Unclear risk | Some secondary outcome detail not reported e.g. post‐intervention BP, HbA1c. |
| Other bias | High risk | Baseline differences ‐ higher rate of cardiovascular disease and insulin use in control group, higher percentage of females in intervention group. Nurses interacted with control patients. No data provided on the input of physician champion to decision making, changing prescriptions etc. |
Heisler 2012.
| Methods | Cluster‐randomised controlled trial | |
| Participants | Sixteen primary care teams at 5 medical centres (3 Veterans Affairs (VA) and 2 Kaiser Permanente (KP)), USA Eight intervention primary care teams (1797 patients), 8 usual care primary care teams (2303 patients) |
|
| Interventions | PATIENTS A pharmacist‐led intervention (Adherence and Intensification of Medications) in patients with diabetes and poor BP control versus usual care Pharmacists used electronic prescribing and clinical data systems to reach out to patients with uncontrolled hypertension and either poor refill adherence or insufficient medication intensification in response to high BP. Supported by up‐to‐date medication refill information pharmacists delivered tailored adherence counselling by use of motivational interviewing and medication management with follow‐up once a behaviour or pharmacological change was made Health professional delivering the intervention ‐ five clinical pharmacists, two part‐time (2 full‐time equivalent at KP and 2 full‐time equivalent at VA). Pharmacists undertook a 3‐day interactive training focusing on motivational interviewing and the study protocol, procedures and the medication management tool (MMT). Fidelity was assessed during the intervention. A booster session occurred six months into the intervention with feedback on one or more telephone encounters by an expert in motivational interviewing Pharmacist encounters were offered at 3‐month intervals (0, 3, 6, 9, 12 months) Encounters took place at the clinic or by phone. At intake the pharmacist assessed adherence, explored barriers to adherence, discussed BP, HbA1c, LDL levels, explored goals, set a short‐term action step if there were barriers to adherence. If no adherence problems the pharmacist could make BP medication changes by using site approved algorithms Clinical pharmacists copied the patient's primary care physician on medication changes. Pharmacists consulted or referred back to the primary care physician those patients requiring more than 3 antihypertensive medications Patients were eligible for discharge when medication adherence issues had been addressed and target BP reached or the patient was on maximum tolerated medications |
|
| Outcomes | PATIENTS Relative change in systolic BP from 6 months preceding to 6 months after the 14‐month intervention Shorter‐term changes in BP RESOURCE USE Hospitalisations, primary care visits, emergency room visit PROCESS Proportion of patients with BP medication changes |
|
| Notes | High performing setting with at least 80% BP control Randomisation 2‐stage cluster sampling ‐ first team clusters at each site were selected and then primary care teams within the 5 sites were randomly assigned to treatment versus control. 16 primary care teams were randomly assigned for 8 intervention, and 8 control teams, 2+2 at three sites, 1+1 at two sites In the second stage, participants within each team were randomly sampled for activation by a priority order for outreach. |
|
| Risk of bias | ||
| Bias | Authors' judgement | Support for judgement |
| Random sequence generation (selection bias) | Unclear risk | Not reported. |
| Allocation concealment (selection bias) | Unclear risk | Not reported. |
| Blinding of participants and personnel (performance bias) All outcomes | High risk | Not feasible with study design. |
| Blinding of outcome assessment (detection bias) All outcomes | Low risk | Laboratory values low risk. Systolic BP came from the sites usual clinical care electronic database (excluded BP by Adherence and Intensification of Medications pharmacists). |
| Incomplete outcome data (attrition bias) | High risk | Intention‐to‐treat analysis ‐ all contacted patients included in the analysis. In the intervention arm only 53% of participants had a pharmacist encounter. |
| Selective reporting (reporting bias) | Low risk | Predefined outcomes reported. |
| Other bias | Unclear risk | Multifactorial intervention with effect of prescribing on outcomes unclear. |
Hill 2003.
| Methods | Randomised controlled trial | |
| Participants | Outpatient General Clinical Research Center, Johns Hopkins, Baltimore, USA Hypertensive urban African American men aged 21 to 54 with systolic BP ≥ 140 mmHg or diastolic BP ≥ 90 mmHg on or off hypertensive medication Patients 309 (157 intensive intervention, 152 less intensive) Health professional delivering intervention ‐ nurse practitioner/community health worker/physician |
|
| Interventions | PATIENTS A more intensive comprehensive and individualised educational‐behavioural‐pharmacological intervention by a nurse practitioner/community health worker/physician team versus a less intensive education and referral intervention in the community. Nurse practitioner visits every 1‐3 months. Men in the more intensive group received free medication from the nurse practitioner who made therapeutic decisions including medication titration in accordance with a protocol based on JNC‐V1 guidelines. The community health worker made at least one home visit and assisted with support referrals. The physician was available for consultation. Therapy further individualised with primary providers (where present) |
|
| Outcomes | PATIENTS Changes at 36 months in: BP Left ventricular mass Serum creatinine Socio‐demographic and behavioural risk factors (items from National Health Interview Survey and Hill‐Bone Compliance Scale) RESOURCE USE Healthcare utilisation by asking if there was a provider for hypertension and whether they were on antihypertensive medication |
|
| Notes | 36‐month study. | |
| Risk of bias | ||
| Bias | Authors' judgement | Support for judgement |
| Random sequence generation (selection bias) | Low risk | Computer‐generated randomisation. |
| Allocation concealment (selection bias) | Unclear risk | Not described. |
| Blinding of participants and personnel (performance bias) All outcomes | High risk | Not feasible with study design. |
| Blinding of outcome assessment (detection bias) All outcomes | Low risk | Personnel blinded to group assignment for BP and left ventricular mass. Laboratory measures. |
| Incomplete outcome data (attrition bias) | Low risk | 70% follow‐up at 12, 24, 36 months. |
| Selective reporting (reporting bias) | Low risk | Predefined outcomes reported. |
| Other bias | High risk | Multifaceted intervention by team. Unclear influence on prescribing of nurse practitioner by physicians. Medications free to the more intensive intervention group. |
Hirsch 2014.
| Methods | A randomised controlled trial | |
| Participants | University of California‐San Diego general internal medical clinic, USA Patients drawn form the electronic medical record of 10 primary care physicians who were ≥ 18 years with uncontrolled hypertension ( ≥ 140/90 mmHg or ≥ 130/≥ 80 mmHg if diabetic) on current treatment with at least one antihypertensive medication and had continuous active status with the clinic Patients 166 (75 intervention group, 91 usual care) Health provider delivering intervention ‐ two clinical pharmacists with a Doctor of Pharmacy degree, at least one year of pharmacy practice residency training and at least 7 years experience in ambulatory care Practice ‐ 1 No unit of analysis errors |
|
| Interventions | PATIENTS Pharmacist‐managed BP control of hypertensive patients by the PharmD‐primary care physician medication management team versus usual care The clinical practice protocol allowed the pharmacist to independently initiate, adjust or discontinue treatment with antihypertensive medications. A physician was available for consultation Number of interventions ‐ four 30‐minute pharmacist visits (baseline 3, 6, 9 months) and as needed, independent of primary care physician visits |
|
| Outcomes | PATIENTS Systolic BP (change at 6 months) Percentage of patients at BP goal Change in diastolic BP LDL and HDL cholesterol Patient satisfaction using the 22‐item Pharmacist Service Questionnaire PROCESS Number and types of medication changes Number and types of antihypertensive drug therapy problems |
|
| Notes | Patients received USD 22 for each pharmacist visit, USD 25 for the 9‐month visit. | |
| Risk of bias | ||
| Bias | Authors' judgement | Support for judgement |
| Random sequence generation (selection bias) | Low risk | Patients were randomly assigned via a computer‐generated random sequence. A random subset of usual care patients was selected for retrospective chart review (process unclear). |
| Allocation concealment (selection bias) | Unclear risk | Concealment not described. |
| Blinding of participants and personnel (performance bias) All outcomes | High risk | Not feasible with study design. Primary care physicians had patients in both groups. |
| Blinding of outcome assessment (detection bias) All outcomes | Unclear risk | Pharmacist measured BP at each study visit. |
| Incomplete outcome data (attrition bias) | Unclear risk | After enrolment 11/75 (15%) of intervention group lost at 6 months, 23/75 (31%) of intervention group lost at 9 months versus 91/91 in usual care. 19 intervention patients returned to primary care physicians with measured data included. |
| Selective reporting (reporting bias) | Low risk | Predefined outcomes reported. |
| Other bias | Unclear risk | Baseline Intervention group younger, lower Charlson comorbidity index, more likely to be male, and lower total number of medications. Payment of patients for pharmacist visit. |
Houweling 2009.
| Methods | Randomised controlled trial | |
| Participants | Diabetes outpatient clinics of two hospitals, Isala Clinics, Zwolle and Bethesda General Hospital, Hoogeveen, the Netherlands Patients with type 2 diabetes referred by GPs Patients 93 (intervention 50, standard care 43) Health professional delivering intervention ‐ nurse specialising in diabetes trained to follow a detailed treatment and management protocol aimed at optimising glycaemia, BP, and lipids. Protocols allowed nurse specialising in diabetes to prescribe medication and order laboratory tests, initiate therapy with 14 medications and change doses for 30 medications |
|
| Interventions | PATIENTS Secondary care management of diabetes by supervised nurses versus medical care |
|
| Outcomes | PATIENTS Mean decrease in HbA1c from baseline to one year BP Total cholesterol LDL LDL/HDL Proportion of patients meeting targets Health‐related quality of life SF‐36 Diabetes‐related symptoms (Diabetes Symptom Checklist‐type 2, DSC‐type 2) Patient satisfaction (Patient Evaluation of the Quality of Diabetes Care, PEQD) RESOURCE USE Healthcare consumption Costs |
|
| Notes | In some cases the protocol specified consultation with medical internist. 12‐month study. |
|
| Risk of bias | ||
| Bias | Authors' judgement | Support for judgement |
| Random sequence generation (selection bias) | Low risk | Population randomised with sequential numbers in closed envelopes with even numbers assigned to the intervention group and odd numbers to control. |
| Allocation concealment (selection bias) | Low risk | Non‐transparent closed envelopes. |
| Blinding of participants and personnel (performance bias) All outcomes | High risk | Not feasible with study design. |
| Blinding of outcome assessment (detection bias) All outcomes | Low risk | Laboratory measures (low risk). Independent medical investigator saw patients at baseline, 6 months, 12 months. Unclear if completion of questionnaires can be biased according to randomisation group. |
| Incomplete outcome data (attrition bias) | Low risk | Attrition‐low: intervention group 4/50 (8%), standard care 5/43 (12%). SF‐36 4/84, 4/84 satisfaction survey. Data analysis excludes lost to follow‐up. |
| Selective reporting (reporting bias) | Low risk | Predefined outcomes reported. |
| Other bias | Unclear risk | Unclear impact of consultation of nurse specialising in diabetes with internist as per protocol. |
Houweling 2011.
| Methods | Randomised controlled trial | |
| Participants | A primary care group general practice with five GPs, north‐east region of the Netherlands Patients with type 2 diabetes mellitus, on medication and whose HbA1c levels had been measured in the last three years Patients 230 (intervention 116, GP 114) Health professional delivering intervention ‐ practice nurses (primarily 2) who received one week of training on a detailed treatment and management protocol aimed at optimising glucose, BP, lipids, eye and foot care. Practice nurses could prescribe 14 different medications, adjust doses for 30 medications, order laboratory tests, adjust doses but not order insulin |
|
| Interventions | PATIENTS Primary care nurse management of type two diabetes versus management by GPs |
|
| Outcomes | PATIENTS HbA1c (mean decrease after 14 months) BP Cholesterol and cholesterol/HDL ratio Health‐related quality of life (SF‐36) Diabetes‐related symptoms (DSC‐type 2) Patient satisfaction (PEQD) PROCESS Proportion of patients achieving target ranges of glycaemic control (HbA1c below 7.5% and 8.5%) BP below 14/90 mmHg Opthalmologist referrals Measures for feet at risk Referral to internist for starting insulin Proportion with drug intensification RESOURCE Healthcare consumption |
|
| Notes | 14‐month study. | |
| Risk of bias | ||
| Bias | Authors' judgement | Support for judgement |
| Random sequence generation (selection bias) | Low risk | Population randomised by two independent medical investigators using sequential numbers in closed envelopes with even numbers assigned to the intervention group and odd numbers to control group. |
| Allocation concealment (selection bias) | Low risk | Non‐transparent closed envelopes. |
| Blinding of participants and personnel (performance bias) All outcomes | High risk | Not feasible by study design. |
| Blinding of outcome assessment (detection bias) All outcomes | Unclear risk | Laboratory measures (low risk). BP not blinded (high risk). Unclear if completion of questionnaires can be biased according to randomisation group. |
| Incomplete outcome data (attrition bias) | Low risk | Low lost to follow‐up ‐ practice nurse intervention group 14/116 (12%), GP usual care 10/114 (9%). Data analysis excludes lost to follow‐up. |
| Selective reporting (reporting bias) | Low risk | Outcomes outlined in methods reported. Patient satisfaction results summarised. |
| Other bias | Unclear risk | Mean number of visits in practice nurse group 6.1 versus 2.8 in the GP group (P < 0.001). Visits also longer. |
Hunt 2008.
| Methods | Randomised controlled trial | |
| Participants | Nine community‐based primary care clinics (Providence Primary Care Research Network), Oregon, USA Patients with hypertension and uncontrolled BP Patients 463 (pharmacist arm 230, usual care 233) Health professional delivering intervention ‐ 5 pharmacy practitioners with a post‐baccalaureate doctor of pharmacy degree, 1‐2 years ambulatory medicine residency training and was board certified in pharmacotherapy |
|
| Interventions | PATIENTS Pharmacists participating in the active management of hypertension in the primary care office according to collaborative treatment protocols versus usual care Pharmacists reviewed the participants' medications and lifestyle habits, assessed vital signs, screened for adverse drug reactions, identified barriers to adherence, provided education, optimised the antihypertensive regimen and scheduled follow‐up appointments. Antihypertensive regimen optimisation included alterations to titrate the dose of an existing medication, add a new agent, switch a medication or consolidate antihypertensive therapy. The pharmacist had access to the patients' medical record as well as to the primary care physician to discuss the hypertension treatment plan or other medical issues |
|
| Outcomes | PATIENTS Difference in mean systolic and diastolic BP between team‐based care and usual care Proportion achieving BP goal attainment (< 140/90 mmHg) Self‐management knowledge and behaviour (internally designed) Medication adherence (Morisky scale) Home BP monitoring Quality of life (Medical Outcomes Study SF‐36) Satisfaction (six healthcare and five specific hypertension domain questions) RESOURCE UTILISATION Clinic visits to primary care physician and pharmacist in intervention and control arms PROCESS Antihypertensive use |
|
| Notes | 12‐month study. Did not need to consult physician to change medications. |
|
| Risk of bias | ||
| Bias | Authors' judgement | Support for judgement |
| Random sequence generation (selection bias) | Low risk | Participants randomly assigned with equal allocation and without restriction to intervention or control using a computer‐generated random sequence. |
| Allocation concealment (selection bias) | Unclear risk | Not specified. |
| Blinding of participants and personnel (performance bias) All outcomes | High risk | Not feasible with study design. |
| Blinding of outcome assessment (detection bias) All outcomes | Low risk | At study‐end BP was assessed by registered nurses blinded to the participants randomisation allocation. |
| Incomplete outcome data (attrition bias) | Unclear risk | Intention‐to‐treat analysis. 191 participants (41%) withdrew after randomisation 88/230 (38.3%) intervention, 103/233 (44.2%) usual care but groups comparable ‐ 142 pharmacist, 130 usual care. Reasons discussed. Only factor associated with higher withdrawal rate was enrolment in commercial insurance. |
| Selective reporting (reporting bias) | Unclear risk | Predefined outcomes reported. |
| Other bias | Unclear risk | Physcians in this study cared for patients in both groups and co‐signed the chart note following every pharmacist‐patient interaction. Six control patients also received a pharmacist consultation (at primary care physician request). This may bias toward null hypothesis. Control patients were also offered a number of active interventions e.g. mailed educational material, appointment prompts, physician prompts where BP elevated. |
Ishani 2011.
| Methods | Randomised controlled trial | |
| Participants | Minneapolis VA Health Care System, Minneapolis, Minnesota, USA Diabetic veterans who had BP > 140/90 mmHg, HbA1c > 9%, or LDL > 100 mg/dL Patients 556 (278 intervention, 278 usual care) Health professional delivering intervention ‐ nurse case managers who made adjustments to medications according to protocols established for the study |
|
| Interventions | PATIENTS To determine whether nurse case management with a therapeutic algorithm could effectively improve rates of control for hypertension, hyperglycaemia and hyperlipidaemia compared with usual care among veterans with diabetes. Intervention group patients in collaboration with the study nurse established lifestyle goals, were provided with home BP monitors and had medications adjusted. The nurse case managers contacted patients initially two‐weekly, decreasing as targets were reached to review and adjust therapy |
|
| Outcomes | PATIENTS Percentage of patients with control of all three cardiovascular risk factors (BP < 130/80 mmHg, LDL < 100 mg/dL, HbA1c < 8%) Percentage of individuals achieving individual treatment goals Change in absolute values for BP, LDL, HbA1c between groups at one year |
|
| Notes | 12‐month study. | |
| Risk of bias | ||
| Bias | Authors' judgement | Support for judgement |
| Random sequence generation (selection bias) | Low risk | Randomisation according to a computer‐generated randomisation schedule with a block size of six. |
| Allocation concealment (selection bias) | Unclear risk | Allocation concealment not specified. |
| Blinding of participants and personnel (performance bias) All outcomes | High risk | Not feasible with study design. |
| Blinding of outcome assessment (detection bias) All outcomes | Low risk | Laboratory measures low risk. Unclear risk around independence and blinding to study group of those performing final BP measurement. |
| Incomplete outcome data (attrition bias) | Unclear risk | Intention‐to‐treat analysis. Attrition at final visit: intervention 55/278 (20%), usual care 70/278 (25%). |
| Selective reporting (reporting bias) | Low risk | Not evident. |
| Other bias | Unclear risk | Nineteen patients included who were randomised in error as a value for entry did not exceed the threshold. |
Jaber 1996.
| Methods | Randomised controlled trial | |
| Participants | General internal medicine clinic, Detroit Receiving Hospital, University Health Center, Detroit, USA Urban African‐American patients with non‐insulin dependant diabetes mellitus (NIDDM) Patients 39 (17 intervention, 22 controls) Health professional delivering intervention ‐ a pharmacist delegated full prescribing authority under an approved hyperglycaemic agents protocol No unit of analysis errors |
|
| Interventions | PATIENTS Pharmacists providing pharmaceutical care versus physicians Diabetes‐related management aspects were solely provided by a pharmacist including pharmacotherapeutic evaluation and dosage adjustments, individualised education on diabetes and its complications, training on the recognition and treatment of hypoglycaemia and hyperglycaemia, medication counselling, instructions on dietary regulation and an exercise plan, training for self‐monitoring of blood glucose. Weekly follow‐up until target glycaemia control then 2‐4 weekly visits |
|
| Outcomes | PATIENTS Fasting plasma glucose HbA1c BP Serum creatinine Creatinine clearance Microalbumin to creatinine ratio Lipids (total cholesterol, triglycerides, HDL, LDL) Quality of life (Health Status Questionnaire V2 derived from the SF‐36) Patient compliance Adverse events PROCESS Medication use |
|
| Notes | 4‐month study. | |
| Risk of bias | ||
| Bias | Authors' judgement | Support for judgement |
| Random sequence generation (selection bias) | Low risk | Eligible patients were assigned to an intervention or control group in a randomised, parallel design fashion. |
| Allocation concealment (selection bias) | Unclear risk | Allocation concealment not explained. |
| Blinding of participants and personnel (performance bias) All outcomes | High risk | Not feasible with study design. |
| Blinding of outcome assessment (detection bias) All outcomes | Low risk | Laboratory values low risk. Unclear if questionnaire results can be biased by the group allocation. |
| Incomplete outcome data (attrition bias) | High risk | Attrition: 6/23 (26%) intervention group dropped out or were discharged. Reasons provided. |
| Selective reporting (reporting bias) | Unclear risk | Predefined outcomes reported. |
| Other bias | Unclear risk | Multifactorial intervention with effect of prescribing on outcomes unclear. |
Khunti 2007.
| Methods | Cluster‐randomised controlled trial | |
| Participants | Twenty primary care practices with 53 GPs, Leicester, UK Patients with CHD, CHF or both Patients 1316. Intervention 608 (final cases included 505 ‐ CHD 461, heart failure 147, confirmed left ventricular systolic dysfunction 51, excluded 103). Controls 708 (final cases included ‐ 658, CHD 691, heart failure 215, confirmed left ventricular systolic dysfunction 75, excluded 50) Health professional delivering intervention ‐ two specialist nurses trained in the management of CHD and CHF No unit of analysis errors |
|
| Interventions | PATIENTS Specialist nurse care versus usual care by the healthcare team in the control practices for secondary prevention of CHD and CHF Nurse intervention included patient assessment, confirmation of diagnosis by investigations, medication management and titration, home visits for house bound patients and liaison between primary and secondary care |
|
| Outcomes | PATIENTS The proportion of patients with a history of myocardial infarction receiving a beta‐blocker in patients with CHD a recorded serum cholesterol < 5 mmol/L in the previous year The proportion of patients with left ventricular systolic dysfunction being treated with an ACE inhibitor Quality of life (SF‐36) Seattle Angina Questionnaire Left Ventricular Dysfunction Questionnaire (LVD‐36) PROCESS CHD ‐ BMI, BP control CHF ‐ proportion of patients with a presumed diagnosis of CHF having an echocardiogram, proportion of patients having confirmation or rejection of the diagnosis of left ventricular systolic dysfunction by an echocardiogram Medication use ‐ secondary prevention, appropriate left ventricular systolic dysfunction medications |
|
| Notes | Practices matched as closely as possible for size, number of GP partners, measure of deprivation, teaching and training status. Control group practices provided the same open access echocardiography and access to the secondary care cardiology clinic as the intervention group. 12‐month study. It is difficult to determine which facet or facets of a complex multifactorial intervention led to improvements in care. |
|
| Risk of bias | ||
| Bias | Authors' judgement | Support for judgement |
| Random sequence generation (selection bias) | Low risk | Randomisation procedure used computer‐generated case control pairs. Pairing of GP practices based on list size, number of GPs, Jarman deprivation indicator, teaching and training status. |
| Allocation concealment (selection bias) | Unclear risk | Not practical. |
| Blinding of participants and personnel (performance bias) All outcomes | High risk | Not feasible with study design. |
| Blinding of outcome assessment (detection bias) All outcomes | Unclear risk | Unclear if questionnaire responses and some secondary prevention measures were biased by the group allocation. Low risk with laboratory and process measures. Data extracted by trained nurse data collectors. |
| Incomplete outcome data (attrition bias) | High risk | Attrition ‐ intervention 103/608, control 50/708. Intention‐to‐treat analysis of 1163 patients, 505 intervention, 658 control and of these: 39/505 intervention and 15/658 control patients did not complete trial per protocol (reasons provided); higher attrition rate in the intervention group. |
| Selective reporting (reporting bias) | Low risk | Predefined outcomes reported. |
| Other bias | Unclear risk | Multifactorial intervention with effect of prescribing on outcomes unclear. |
Klingberg‐Allvin 2015.
| Methods | Randomised controlled trial | |
| Participants | Women with signs of first trimester incomplete abortion at six healthcare facilities in six districts in rural, peri‐urban and urban settings in central Uganda Patients 1010, midwife group 506, physician group 504 Health professional delivering the intervention ‐ midwives involved in post‐abortion care at the facilities and who underwent a five day training module focusing on diagnosing incomplete abortion, treatment with misoprostol, manual vacuum aspiration, contraceptive methods and counselling |
|
| Interventions | PATIENTS Clinical assessment and treatment with misoprostol by a physician or midwife Provision of analgesics (ibuprofen or paracetamol) and oral antibiotics according to national guidelines for post‐abortion care |
|
| Outcomes | PATIENTS Abortion not needing surgical intervention within 14‐28 days after initial treatment |
|
| Notes | ||
| Risk of bias | ||
| Bias | Authors' judgement | Support for judgement |
| Random sequence generation (selection bias) | Low risk | Computer random number generator to generate a list of codes with each code linked to one of the two study groups. |
| Allocation concealment (selection bias) | Low risk | Sequentially numbered opaque sealed envelopes used. |
| Blinding of participants and personnel (performance bias) All outcomes | High risk | Not feasible with study design. |
| Blinding of outcome assessment (detection bias) All outcomes | Unclear risk | Unclear if research assistants who were midwives measured primary and secondary outcomes and treated patients. |
| Incomplete outcome data (attrition bias) | Low risk | Low exclusion, 11 of 1010 women excluded after randomisation. Low loss to follow‐up. Per protocol and intention‐to‐treat population almost identical. |
| Selective reporting (reporting bias) | Low risk | Not evident. |
| Other bias | Low risk | Larger loss to follow‐up in the midwife group, but the difference with the physician group was small. |
Kuethe 2011.
| Methods | Randomised controlled trial (three arms, non‐inferiority design) | |
| Participants | Large general hospital and 18 GPs' practices in Noord Brabant, the Netherlands Children 6‐16 years old with moderate stable asthma using inhaled corticosteroid for at least 9 months prior to study Patients 107 (45 from general practice, 62 from hospital practice randomised in 3 arms to GP 37, paediatrician 34, asthma nurse 36) Health professional delivering intervention ‐ hospital‐based specialised asthma nurse No unit of analysis errors |
|
| Interventions | PATIENTS To test non‐inferiority of care by a specialised asthma nurse versus standard care (GP or paediatrician) Nurse used guidelines of the Dutch Paediatric Association with support from a paediatrician at any time |
|
| Outcomes | PATIENTS Lung function tests including ‐ airway hyper‐responsiveness ( PD20), FENO FEV1 Asthma control ‐ Asthma Control Questionnaire Exacerbations PROCESS Medication use ‐ dose, % use of long‐acting beta agonists/inhaled corticosteroid RESOURCE USE Planned visits Unplanned visits School absence Parental absence from work |
|
| Notes | Two‐year follow‐up. The asthma nurse could consult the paediatrician at all times (15 (42%) of asthma nurse participants required a consultation with a paediatrician). Extra emergency visits as required. |
|
| Risk of bias | ||
| Bias | Authors' judgement | Support for judgement |
| Random sequence generation (selection bias) | Low risk | Randomised computer‐generated list (stratified by type of treating physician before recruitment). |
| Allocation concealment (selection bias) | Low risk | Sealed numbered envelopes with designated follow‐up arms. |
| Blinding of participants and personnel (performance bias) All outcomes | High risk | Not feasible with study design. |
| Blinding of outcome assessment (detection bias) All outcomes | Low risk | Lung function parameters low risk but no mention of blinding assessors. Unclear if completion of questionnaire can be biased by group randomisation. |
| Incomplete outcome data (attrition bias) | Low risk | Attrition at 2 years ‐ GP 2/37, paediatrician 1/34, asthma nurse 3/36 (explanation provided). |
| Selective reporting (reporting bias) | Low risk | Predefined outcomes reported. |
| Other bias | Unclear risk | GPs with a special interest in paediatric asthma selected. Results may differ from an unselected sample of GPs. Consultations with paediatricians influence on outcomes. Unclear medical influence on nurse prescribing. |
Litaker 2003.
| Methods | Randomised controlled trial | |
| Participants | Department of General Internal Medicine, Cleveland Clinic Foundation (a tertiary care teaching hospital) Ohio, USA Patients with mild or moderate hypertension and type 2 diabetes without end‐organ complications Patients 157 (nurse practitioner ‐ physician team 79 versus usual care (primary care physician) 78) Health professional delivering intervention ‐ nurse practitioner with training on use of treatment algorithms. Issues outside algorithms discussed with primary care physician |
|
| Interventions | PATIENTS Chronic disease management involving nurse practitioner‐physician versus primary care physician Use of treatment algorithms, patient education on self‐management, monitoring and feedback primarily by nurse practitioner |
|
| Outcomes | PATIENTS HbA1c HDL Satisfaction with care Health‐related quality of life ‐ Health Survey Short Form (SF‐12) Diabetes quality of life, PROCESS Preventive care (vaccinations, foot, eye exams) Patient education (e.g. smoking cessation, weight control, adherence) RESOURCE USE Costs for personnel involved in management Time spent |
|
| Notes | 12‐month study. Team management beneficial effect on HDL. Effect on diabetic control disappeared 12 months after study completion. Study terminated at 16 months. Multifactorial intervention. | |
| Risk of bias | ||
| Bias | Authors' judgement | Support for judgement |
| Random sequence generation (selection bias) | Unclear risk | Not described. |
| Allocation concealment (selection bias) | Unclear risk | Not described. |
| Blinding of participants and personnel (performance bias) All outcomes | High risk | Not feasible with study design. |
| Blinding of outcome assessment (detection bias) All outcomes | Low risk | Laboratory values. BP assessment not blinded. Unclear if group allocation affected survey results. |
| Incomplete outcome data (attrition bias) | Low risk | Not evident. |
| Selective reporting (reporting bias) | Low risk | Predefined outcomes reported. |
| Other bias | High risk | Physicians involved in 216 (40%) of nurse practitioner visits. Influence of physician on prescribing unclear. |
Logan 1979.
| Methods | Randomised controlled trial | |
| Participants | Government or industry workplaces, Metropolitan Toronto, Canada Volunteers with untreated hypertension Patients 457 (232 worksite care by nurse, 225 regular care by family physician) Health professional delivering intervention ‐ two experienced nurses who were taught to treat hypertension according to a standard protocol. Nurses were allowed to prescribe and change drug therapy at the worksite without prior physician approval. Every week patient charts were reviewed at the hospital with the supervising physician No unit of analysis errors |
|
| Interventions | PATIENTS Treatment of hypertension in the workplace by nurses versus treatment in the community by the family doctor Nurses saw their patients every two weeks if diastolic BP was 105 mmHg or higher or every month if less until target goal reached. Visits were then lengthened to two to three months |
|
| Outcomes | PATIENTS Reduction in diastolic BP to less than 90 mmHg if entry BP > 95 mmHg or reduction in BP of at least 6 mmHg if entry diastolic BP of 95 mmHg or less Medication compliance |
|
| Notes | 6‐month study. Comparing an intervention, not just prescribing versus standard care. |
|
| Risk of bias | ||
| Bias | Authors' judgement | Support for judgement |
| Random sequence generation (selection bias) | Unclear risk | Eligible participants stratified for age, sex, diastolic BP and site of work and randomised within strata but no details of sequence generation given. |
| Allocation concealment (selection bias) | Unclear risk | Details not provided. |
| Blinding of participants and personnel (performance bias) All outcomes | High risk | Not feasible with study design. |
| Blinding of outcome assessment (detection bias) All outcomes | Low risk | BP ‐ work evaluations at 6 months were done by a specially trained BP technician who was unaware of group allocation. Insufficient information given on compliance questionnaire. Pill count at home cannot be 'unobtrusive'. |
| Incomplete outcome data (attrition bias) | Low risk | Explanation provided, dropouts or not having a 6‐month assessment ‐ worksite care by nurse 26/232, regular care 21/225. Intention‐to‐treat. |
| Selective reporting (reporting bias) | Low risk | Predefined outcomes reported. |
| Other bias | Unclear risk | Unclear whether weekly chart review by supervising physician had any influence on outcomes. Standard group measured less frequently. |
MacMahon Tone 2009.
| Methods | Randomised controlled trial | |
| Participants | Hospital‐based diabetes service, Beaumont Hospital, Dublin, Ireland Patients with type 2 diabetes and one additional cardiovascular risk factor (smoking, persistent microalbuminuria or previously diagnosed macrovascular disease). Total cholesterol > 4.8 mmol/L or LDL > 2.6 mmol/L or BP > 130/80 mmHg or both. Patients were recruited if over 30 years, treated with diet, oral hypoglycaemic agents or treated with oral hypoglycaemic agents for at least 1 year prior to commencing insulin Patients 200 (intensive nurse‐led 101, standard care 99) Health professional delivering intervention ‐ nurse with 5 years experience as a diabetes nurse specialist and a higher diploma in diabetes |
|
| Interventions | PATIENTS Intensive nurse‐led clinic versus standard diabetes management (annual review) in achieving recommended vascular risk reduction targets in patients with type 2 diabetes. Patients seen every 2‐3 months and annual review in the diabetes clinic At each visit lifestyle advice was reinforced (diet, weight reduction, exercise, alcohol consumption, smoking cessation). Patient feedback on achieving targets. Mediactions were titrated in response to BP, blood glucose readings, and biochemical results |
|
| Outcomes | PATIENTS BP Total cholesterol LDL HDL Triglycerides HbA1c Weight Smoking Adverse events PROCESS Antihypertensive use Aspirin prescribing |
|
| Notes | One‐year study. Difficult to evaluate which single intervention or combination of interventions responsible for risk reduction. |
|
| Risk of bias | ||
| Bias | Authors' judgement | Support for judgement |
| Random sequence generation (selection bias) | Unclear risk | Standard randomisation table used. Patients randomised on the basis of the date of presentation for their first visit and last digit of their hospital number. |
| Allocation concealment (selection bias) | Unclear risk | Not reported. |
| Blinding of participants and personnel (performance bias) All outcomes | High risk | Not feasible with study design. |
| Blinding of outcome assessment (detection bias) All outcomes | Low risk | Laboratory values low risk. BP not reported as blinded. |
| Incomplete outcome data (attrition bias) | Low risk | Low attrition 7/101, 5/99. |
| Selective reporting (reporting bias) | Unclear risk | Predefined outcomes reported. |
| Other bias | Unclear risk | Confounding factors ‐ intensive education and more regular reviews. Multifactorial intervention with effect of prescribing on outcomes unclear. |
Magid 2013.
| Methods | Randomised controlled trial | |
| Participants | Ten Kaiser Permanente Colorado primary care clinics, USA Adults 18 to 79 years with a diagnosis of hypertension and their two most recent clinic BP readings were above goal, systolic BP ≥ 140 mmHg or diastolic BP ≥ 90mmHg (systolic BP ≥ 130 mmHg or diastolic BP ≥ 80 mmHg for DM or chronic kidney disease), were prescribed ≤ 3 antihypertensive medications, had a primary care provider at one of the 10 participating clinics and had access to a computer and Internet Patients 348 (175 intervention, 173 usual care) Health professional delivering intervention ‐ clinical pharmacy specialist (at least one at each clinic) No unit of analysis errors |
|
| Interventions | PATIENTS A pharmacist‐led Heart360 Web enabled home BP monitoring (HBPM) verus usual care in patients with uncontrolled hypertension Both groups received the same educational material Clinical pharmacist reviewed current BP medications, provided counselling on lifestyle changes and adjusted or changed antihypertensive medications as needed. Patients measured and uploaded BP into web‐based monitoring programme 3 times per week. The clinical pharmacy specialist reviewed home BP measurements and adherence, made medication adjustments (initiate, change, adjust doses, order laboratory tests), communicated with patients via telephone or secure email. Medication changes were notified to the primary care physician |
|
| Outcomes | PATIENTS Proportion of patients who attained their goal BP at 6 months Change in systolic and diastolic BP between baseline and 6 months Patient satisfaction Adherence PROCESS Change in antihypertensive medication intensity Ease of system use RESOURCE USE Clinic visits, emergency department visits, hospitalisations, telephone encounters, email encounters |
|
| Notes | ||
| Risk of bias | ||
| Bias | Authors' judgement | Support for judgement |
| Random sequence generation (selection bias) | Low risk | A random allocation sequence was computer‐generated using stratified randomisation with an allocation ratio of 1:1. |
| Allocation concealment (selection bias) | Unclear risk | The sequence was concealed from the patient until the baseline visit. Concealment from investigators not described. |
| Blinding of participants and personnel (performance bias) All outcomes | High risk | Blinding not feasible with study design. Patients self‐reported BP. Intervention and usual care patients could be treated by the same physician and may have treated usual care patients more aggressively. Primary care physicians consulted pharmacists for 22 usual care patients. |
| Blinding of outcome assessment (detection bias) All outcomes | Low risk | BP at 6 months taken by a research assistant blinded to study group assignment using baseline measurement protocol. Baseline measurement by clinic nurse. |
| Incomplete outcome data (attrition bias) | Low risk | Intention‐to‐treat analysis of randomised patients and estimates made for data of 22 missing patients 9/173 usual care (5%), 13/175 (7%) intervention. |
| Selective reporting (reporting bias) | Low risk | Predefined outcomes reported. |
| Other bias | Unclear risk | Trend to higher mean baseline BP in intervention group. |
Margolis 2013.
| Methods | Cluster‐randomised controlled trial | |
| Participants | Sixteen primary care clinics (Health Partners Medical Group), Minneapolis‐St Paul, Minnesota, USA Patients with uncontrolled BP (≥ 140/90 mmHg or ≥ 130/80 mmHg if diabetic or chronic kidney disease was present) Patients 450 adults (8 clinics telephone intervention 228, 8 clinics usual care 222) Health professional delivering intervention ‐ 4 doctoral pharmacists with 8 hours formal training on the study protocol and observed conducting a telephone visit on two occasions. Clinical practice agreements allowed pharmacists to prescribe and change antihypertensive therapy within specified parameters |
|
| Interventions | PATIENTS Home BP telemonitoring with pharmacist case management of BP versus usual care Patients were instructed to transmit at least 6 BP measurements weekly. During the first 6 months patients and pharmacists met every 2 weeks via telephone until BP was sustained for 6 weeks then reduced to monthly. During intervention months 7 to 12, telephone visits occurred every 2 months. After 12 months telemonitoring was discontinued and patients' care was returned to their primary care physician with no support from a study pharmacist During telephone visits pharmacists emphasised lifestyle change, and medication adherence. They assessed and adjusted antihypertensive drug therapy based on an algorithm using the percentage of home BP readings meeting goal ( ≥ 75% no change, ≤ 75% treatment intensification). If the patient experienced adverse effects the dose would be lowered or drugs switched. Usual care could include referral by the primary care physician to a pharmacist for medication management |
|
| Outcomes | PATIENTS Control of systolic BP to less than 140 mmHg and diastolic BP to less than 90 mmHg at 6 and 12 months (< 130/80 mmHG in patients with diabetes or chronic kidney disease) Change in BP Quality of life (Medical Outcomes Study Short Form‐12 V2) Self‐efficacy for measuring BP Patient satisfaction (six items from the Consumer Assessment of Healthcare Providers and Systems adult survey v4) BP control at 18 months Adherence (Morisky scale) Safety and adverse effects (hospitalisations, emergency department visits, urgent care, same day medical visits for BP problems, hypotension, fainting, loss of consciousness and allergic reactions) PROCESS Medication use (number and type) RESOURCE USE Programme costs per patient |
|
| Notes | 12‐month intervention and 6 months follow‐up. | |
| Risk of bias | ||
| Bias | Authors' judgement | Support for judgement |
| Random sequence generation (selection bias) | Low risk | Cluster‐randomisation (clinics matched by size and clinic BP control at baseline). |
| Allocation concealment (selection bias) | High risk | Not possible to conceal. |
| Blinding of participants and personnel (performance bias) All outcomes | High risk | Not feasible with study design after randomisation. |
| Blinding of outcome assessment (detection bias) All outcomes | Unclear risk | At 6, 12, 18 months research staff were not blinded to study group but trained to treat both groups identically. Record of medication events reviewed independently. |
| Incomplete outcome data (attrition bias) | Low risk | Low attrition at follow‐up visits 6 months, 90% telemonitoring, 89% usual care. 12 months 86% both groups. 18 months 82% both groups. |
| Selective reporting (reporting bias) | Unclear risk | Predefined outcomes reported. |
| Other bias | Unclear risk | Difficult to distinguish effect of telemonitoring from pharmacist case management. Participants generally well‐educated with higher‐income levels (not representative of broader community). |
Marotti 2011.
| Methods | Randomised controlled three arm parallel‐group trial | |
| Participants | John Hunter Hopsital. New South Wales. Australia Elective surgical patients taking regular medications with a postoperative stay of one night or more Patients 357 (control 118, pharmacist medication history 119, pharmacist medication history and prescribing 120) Healthcare delivering intervention ‐ pharmacist |
|
| Interventions | PATIENTS Pharmacist medication history and supplementary prescribing versus pharmacist medication history versus usual care to determine whether the number of missed doses of regular medication was significantly different between the three arms The pharmacist medication history in both groups was taken at the time of admission on the day of surgery. In the supplementary prescribing group the pharmacist prescribed the patients' regular medicines on the inpatient medication chart (without medical review). Local protocols guided which medications were to be withheld and for how long for each type of surgery |
|
| Outcomes | PATIENTS Reduction in the number of medication doses missed inappropriately during the inpatient stay The number of medications charted at an incorrect dose The number of medications charted at an incorrect frequency The number of missed doses postoperatively of significant medications (beta blockers, HMG‐CoA reductase inhibitors, antiplatelets, anticoagulants) |
|
| Notes | Training/experience not stated, numbers of pharmacists not specified. 5‐month study. | |
| Risk of bias | ||
| Bias | Authors' judgement | Support for judgement |
| Random sequence generation (selection bias) | Low risk | Patients were randomised via a computer‐generated list. |
| Allocation concealment (selection bias) | Unclear risk | List held by an independent investigator. |
| Blinding of participants and personnel (performance bias) All outcomes | High risk | Not feasible with study design. |
| Blinding of outcome assessment (detection bias) All outcomes | Low risk | Outcome measures were collected after discharge by an independent technician (retrospective chart review and patient records). |
| Incomplete outcome data (attrition bias) | Low risk | Cancelled surgery or lost to follow‐up: control 9/118, pharmacist medication history 10/119, pharmacist medication history and supplementary prescribing 8/120. Intention‐to‐treat analysis. Patients who had surgery cancelled had no postoperative data and were excluded from part of the analysis. |
| Selective reporting (reporting bias) | Unclear risk | Predefined outcomes reported. |
| Other bias | Unclear risk | Post‐discharge taking of the medication history over the phone in the control group may have resulted in medications being omitted from the medication history. Reasons were not collected for missed doses (potentially missing appropriate reasons). |
McAlister 2014.
| Methods | Randomised controlled trial | |
| Participants | Stroke prevention clinics Edmonton, Alberta, Canada Patients older than 18 years who had an ischaemic stroke or transient ischaemic attack confirmed by a stroke specialist at one of 3 stroke prevention clinics Patients 279 (pharmacist intervention 143, nurse control 136) Health professional delivering intervention ‐ 4 pharmacists ‐ no standardised training but similar career stage |
|
| Interventions | PATIENTS Nurse‐led case management from a stroke prevention clinic i.e. screening, monthly visits, and feedback to primary care physician (the control) versus pharmacist‐led case management with active prescribing (intervention) Pharmacists saw patients monthly for 6 months. Pharmacists performed same tasks as nurses in the control arm as well as initiating or titrating antihypertensive and or lipid‐lowering therapy using treatment algorithms and targets. The nurse in the control arm saw patients monthly and provided lifestyle advice (exercise, low‐salt diet, smoking cessation, medication adherence) and checked BP and LDL |
|
| Outcomes | PATIENTS The proportion of participants at 6 months who attained optimal BP & lipid control (systolic BP < 140 mmHG & fasting LDL ≤ 2 mmol/L) Mortality Self‐reported adherence BMI Smoking status Quality of life (EQ‐5D) Disability (Modified Rankin score) Overall self‐rated health Overall rating of health satisfaction Physical activity Adverse events PROCESS Medication (changes, numbers, type) |
|
| Notes | 6‐month study. | |
| Risk of bias | ||
| Bias | Authors' judgement | Support for judgement |
| Random sequence generation (selection bias) | Low risk | Randomisation was done centrally by use of computer‐generated random numbers with variable‐sized block randomisation stratified by stroke prevention clinic to preserve allocation concealment. |
| Allocation concealment (selection bias) | Low risk | Secure Internet‐based allocation method that ensures allocation concealment from research personnel. |
| Blinding of participants and personnel (performance bias) All outcomes | High risk | Not feasible with study design. All participants and nurses/pharmacists/doctors aware of treatment groups. |
| Blinding of outcome assessment (detection bias) All outcomes | Low risk | The primary and secondary outcomes collected and analysed in an independent and blinded manner by research personnel who were not involved in the patient's care and blinded to patient's randomisation group and baseline measurements. Laboratory measurements independently analysed. |
| Incomplete outcome data (attrition bias) | Unclear risk | 31/143 (22%) excluded form intervention versus 9/136 (7%) from control (reasons provided) but unlikely to bias result as similar numbers remained in the trial, 130 intervention and 136 nurse control. Intention‐to‐treat analysis. Bias toward the null hypothesis as data for 225/279 patients. |
| Selective reporting (reporting bias) | Low risk | Predefined outcomes reported. |
| Other bias | Unclear risk | Multifactorial intervention with effect of prescribing on outcomes unclear. |
Moher 2001.
| Methods | Cluster‐randomised controlled trial | |
| Participants | 21 general practices, Warwickshire, England Practice level randomisation 7 audit, 7 GP recall, 7 nurse recall Patients aged 55 to 75 with established CHD Patients at final audit 1906 (559 audit, 682 GP recall, 665 nurse recall) Health professional delivering intervention ‐ nurse in the nurse recall arm who received education to implement guidelines for secondary prevention |
|
| Interventions | PATIENTS Assessing three different methods of promoting secondary prevention of CHD in primary care Audit group (audit of notes and summary feedback to primary healthcare team) versus GP recall group (disease register and systematic recall to GP) versus nurse recall group (disease register and patient recall to nurse‐led clinic). Agreed clinic protocol for secondary prevention. |
|
| Outcomes | PATIENTS 3 risk factors (BP target, cholesterol, smoking status) BP > 140 mmHg systolic BP or > 90 mmHg diastolic BP Cholesterol ≥ 5.5 mmol/L Continine levels Quality of life (Dartmouth COOP charts, EuroQol scores) PROCESS Prescribing (antihypertensives, lipid‐lowering drugs, antiplatelet drugs) |
|
| Notes | 18‐month study. | |
| Risk of bias | ||
| Bias | Authors' judgement | Support for judgement |
| Random sequence generation (selection bias) | Low risk | Randomisation based on computer‐generated random numbers. |
| Allocation concealment (selection bias) | Low risk | Randomisation was carried out under observation of a statistician blind to the identity of the practice. |
| Blinding of participants and personnel (performance bias) All outcomes | High risk | Not feasible with study design. |
| Blinding of outcome assessment (detection bias) All outcomes | Low risk | Laboratory values and BP carried out by a research nurse blind to allocation group and no previous involvement. |
| Incomplete outcome data (attrition bias) | Unclear risk | Attrition at follow‐up. Proprtions adequately assessed: nurse recall 85% (556/665), GP recall 76% (521/682) audit group, audit group 52% (293/559). |
| Selective reporting (reporting bias) | Low risk | Not apparent. |
| Other bias | Unclear risk | Unclear autonomy of nurse prescribing in nurse recall group. |
New 2003.
| Methods | Randomised controlled trial | |
| Participants | Hope Hospital, Salford, UK Patients with diabetes and raised BP (≥ 140/80 mmHg) or raised total cholesterol (≥ 5.0 mmol/L) or both. Patients were receiving shared care with their GP and Hope Hospital for their annual diabetes review Patients 1407 (nurse hypertension clinic 506, usual care 508, nurse hyperlipidaemia clinic 345, usual care 338) Health professional delivering intervention ‐ two nurse specialists, trained to degree level and previous experience of managing diabetes, hypertension and dyslipidaemia and patient education. Local training by clinicians |
|
| Interventions | PATIENTS Independent specialist nurse‐led clinics (one for hypertension, one for hyperlipidaemia) versus usual care Patients were randomised to receive the hypertension or hypercholesterolaemia interventions separately and patients with both were randomised to one intervention and were a control for the other Nurses provided lifestyle advice, and titration of drug therapies according to local guidelines. Patients attended nurse‐led clinics every 4‐6 weeks until targets were achieved. Lifestyle modifications were reinforced and medications titrated according to response. The specialist nurse discussed patients who required additional medications with the doctor who initiated additional therapy when appropriate. The protocol forbade the nurse from managing the other intervention e.g. cholesterol in the BP arm |
|
| Outcomes | PATIENTS The odds ratio of achieving targets in hypertension and hyperlipidaemia attributable to the specialist nurse‐led intervention Cholesterol control BP control Adverse events ‐ mortality |
|
| Notes | 12‐month study | |
| Risk of bias | ||
| Bias | Authors' judgement | Support for judgement |
| Random sequence generation (selection bias) | Low risk | Remote randomisation service. Separate randomisation's for each condition. |
| Allocation concealment (selection bias) | Low risk | Fully concealed process. Emailed randomisation to respective nurses. |
| Blinding of participants and personnel (performance bias) All outcomes | High risk | Not feasible with study design. |
| Blinding of outcome assessment (detection bias) All outcomes | Low risk | Data abstracted at 1‐year by staff blinded to allocation. Laboratory measurement low risk. |
| Incomplete outcome data (attrition bias) | Unclear risk | BP clinic attrition 99/506 (19.6%) usual care 132/508 (26%). Lipid clinic 34/345 (9.8%), usual care 41/338 (12%). Intention‐to‐treat. |
| Selective reporting (reporting bias) | Low risk | None apparent. |
| Other bias | Unclear risk | Nurse discussed additional therapies with doctor who initiated them when appropriate. |
Pagaiya 2005.
| Methods | Cluster‐randomised controlled trial | |
| Participants | Eighteen nurse‐led health centres in Khon Kaen, Thailand Practice ‐ 18, matched pairs, 9 intervention, 9 control, 220 patients per centre Health centre unit of allocation and analysis |
|
| Interventions | PROVIDERS Education and implementation of prescribing and clinical guidelines by nurses in rural health centres versus usual nurse care Intervention centres received an initial 3‐day training course around four clinical guidelines. For children ‐ acute respiratory infections and diarrhoea, for adults ‐ diazepam prescribing and management of diabetes mellitus. Training strategies were lectures, group discussions, role‐play and presentations. Educational outreach visits by nurse supervisors occurred 3‐4 months after training. Each visit lasted 1.5‐2 hours with discussion on use of the guidelines, problems, adequacy of drugs and equipment. Random auditing and feedback followed |
|
| Outcomes | PROCESS Antibiotic prescribing Diazepam prescribing Prescribing costs per patient PATIENT Management of diabetes |
|
| Notes | 6‐month study. Analysis adjusted for clustering effect. |
|
| Risk of bias | ||
| Bias | Authors' judgement | Support for judgement |
| Random sequence generation (selection bias) | Low risk | Eighteen nurse‐led health centres were matched and sent to the second author blind to the identity of the health centres, to allocate at random into nine intervention and nine control centres using random number tables. |
| Allocation concealment (selection bias) | Unclear risk | Randomisation per centre. Author could not foresee allocation using random number tables. The choice of intervention sites was concealed from health centre staff. |
| Blinding of participants and personnel (performance bias) All outcomes | Unclear risk | While the intervention site was concealed from staff they would have been aware through training that they were an intervention site and this may have affected performance. Similarly control centres would be aware of their status. |
| Blinding of outcome assessment (detection bias) All outcomes | Unclear risk | Random selection of patient records but unclear who undertook the assessment. |
| Incomplete outcome data (attrition bias) | Low risk | Data reported for all centres. |
| Selective reporting (reporting bias) | Low risk | Not evident. |
| Other bias | Unclear risk | Diabetes management outcome ‐ limited data. |
Rudd 2004.
| Methods | Randomised controlled trial | |
| Participants | Two primary care medical clinics, Kaiser Permanente Mountain View Clinic and Primary Care Clinics of the Standford University Medical Center, California, USA Patients with hypertension eligible for drug therapy (threshold 150 mmHg systolic BP, 95 mmHg diastolic BP or both) Patients 150 (usual care plus nurse management intervention 74, usual care 76) Health professional delivering intervention ‐ nurse |
|
| Interventions | PATIENTS Nurse‐managed home‐based management of hypertension versus usual care Nurse care manager counselled intervention patients on use of automated BP device and reporting, drug adherence and recognition of side‐effects. Printed material provided. Follow‐up phone contacts 1 week and 1, 2, 4 months. Patients could phone the nurse with questions or concerns. Patients monitored their BP twice a day The nurse used standardised algorithms to modulate drug therapy based on patients' reports of home BP. The nurse contacted the physician to obtain permission to initiate any new BP drug but could change medication dosage. When 80% of home BP reading achieved 130/85 mmHg over 2 weeks no further changes to drug therapy were made. The cardiologist could be consulted by phone about problematic cases |
|
| Outcomes | PATIENTS Change in BP from baseline to 6‐month visit Adherence PROCESS BP medication use (number, variety, changes) Frequency of drug changes |
|
| Notes | 6‐month study. | |
| Risk of bias | ||
| Bias | Authors' judgement | Support for judgement |
| Random sequence generation (selection bias) | Low risk | Randomisation using computer‐generated assignment. |
| Allocation concealment (selection bias) | Unclear risk | Not specified. |
| Blinding of participants and personnel (performance bias) All outcomes | High risk | Not feasible with study design. |
| Blinding of outcome assessment (detection bias) All outcomes | Low risk | At 3 and 6 months a research assistant blinded to group assignment measured clinic BP and interviewed patients about medications taken. |
| Incomplete outcome data (attrition bias) | Low risk | 8 patients (6%) in usual care group and 5 patients (4%) in the intervention group were classed as dropouts at 6 months. Reasons provided. |
| Selective reporting (reporting bias) | Low risk | None apparent. |
| Other bias | Unclear risk | Effect of medical advice and approval of new drugs on BP and nurse prescribing. Reported < 5% of treatment decisions required telephone discussions with the physician. |
Spitzer 1974.
| Methods | Randomised controlled trial | |
| Participants | Two family practices, Ontario, Canada Families 1598 (4325 members), nurse practitioner group 540 families (1529 members), conventional group 1058 families (2769 members) Health professional delivering intervention ‐ two nurse practitioners who attended special training conducted by the schools of nursing and medicine at McMaster University to become co‐practitioners |
|
| Interventions | PATIENTS Nurse practitioners versus physicians plus conventional nurse in primary care |
|
| Outcomes | PATIENTS Quality of care (assessing 10 indicator conditions and the manner in which 13 common drugs were prescribed) Health status Satisfaction with health service Deaths PROVIDERS Clinical judgement (management of ten indicator conditions and prescribing of 13 common drugs) Clinician activities PROCESS Practice activities RESOURCE USE Financial performance |
|
| Notes | 12‐month experimental period (12‐month follow‐up). | |
| Risk of bias | ||
| Bias | Authors' judgement | Support for judgement |
| Random sequence generation (selection bias) | Low risk | Eligible families were stratified by practice of origin and randomly allocated in a ratio of 2:1. |
| Allocation concealment (selection bias) | Unclear risk | Concealment not specified. |
| Blinding of participants and personnel (performance bias) All outcomes | High risk | No feasible with study design. |
| Blinding of outcome assessment (detection bias) All outcomes | Low risk | Interviewers and data gatherers divorced from experimental participant. |
| Incomplete outcome data (attrition bias) | Low risk | Attrition ‐ only seven families out of 1598 eligible families refused their assignment (two conventional, five nurse practitioner group). |
| Selective reporting (reporting bias) | Low risk | Predefined outcomes reported. |
| Other bias | High risk | Doctors involved in high percentage of nurse practitioner visits. Unclear effects on prescribing. |
Taveira 2010.
| Methods | Randomisd controlled trial | |
| Participants | Ambulatory care clinic ‐ Providence Veterans Affairs Medical Center, Rhode Island, USA Veterans 18 years or older with type 2 diabetes with HbA1c between 7% and 9% within the last 6 months and willing to participate and discuss their diabetes and cardiac risk factors in a group setting Patients 109 (58 intervention, 51 usual care) Health professional delivering intervention ‐ clinical pharmacist who completed one year of postdoctoral pharmacy practice residency as well as certification in diabetes education and physical assessment and underwent 6 months of clinic‐based internist‐supervised pharmacologic management of diabetes, dyslipidaemia, and hypertension) No unit of analysis errors |
|
| Interventions | PATIENTS A pharmacist‐led Veterans affairs Multidisciplinary Education and Diabetes Intervention for Cardiac risk reduction (VA‐MEDIC) plus usual care versus usual care VA‐MEDIC consisted of 4 weekly 2‐hour sessions in a classroom setting with 4 to 8 participants. Family and friends could attend. Each session consisted of two parts. Part 1: Education session of 40‐60 minutes provided by nurse, nutritionist, physical therapist or pharmacist focused on 1 or 2 diabetes self‐care behaviours. Part 2: A behavioural and pharmacologic intervention of 60‐80 minutes conducted by a clinical pharmacist who treated hypertension, dyslipidaemia & tobacco use. Medication titration based on algorithms |
|
| Outcomes | PATIENTS Percentage of patients attaining target goals for HbA1c (< 7%), BP (systolic BP < 130 mmHg, diastolic BP < 80 mmHg), non‐HDL cholesterol < 3.4 mmol/L, LDL cholesterol < 2.6 mmol/L, smoking cessation Self‐care behaviours PROCESS Medication changes |
|
| Notes | Data obtained from the electronic medical record at 4 months. Small number of smokers. |
|
| Risk of bias | ||
| Bias | Authors' judgement | Support for judgement |
| Random sequence generation (selection bias) | Low risk | Participants were assigned to intervention arm or standard care using a simple coin toss randomisation. |
| Allocation concealment (selection bias) | Unclear risk | Method of concealment not described. |
| Blinding of participants and personnel (performance bias) All outcomes | High risk | Not feasible with study design. |
| Blinding of outcome assessment (detection bias) All outcomes | Low risk | Outcome group: no blinding but physiological outcomes unlikely to be influenced by lack of blinding. |
| Incomplete outcome data (attrition bias) | Low risk | Intention‐to‐treat analysis. Low attrition 6/64 intervention (9%) and 3/44 (7%) standard care withdrew. Data on self‐care behaviours not formally collected. |
| Selective reporting (reporting bias) | Low risk | Predefined outcomes reported. |
| Other bias | High risk | Self‐care behaviours survey not validated. Population white male Veterans. Limited duration of 4‐week intervention and 4‐month follow‐up. Multifactorial intervention with effect of prescribing on outcomes unclear. |
Taveira 2011.
| Methods | Randomised controlled trial | |
| Participants | Ambulatory care clinic ‐ Providence Veterans Affairs Medical Center, Rhode island, USA Veterans with type 1 and type 2 diabetes with HbA1c > 6.5% within the last 6 months and concomitant depression as defined by the International Classification of Diseases (ICD) codes 311, 296.2 and 296.3 who were willing to participate and discuss their diabetes and cardiovascular risk factors in a group setting and able to provide written informed consent Patients 86 (44 intervention, 42 standard care) Zero type 1 diabetic patients recruited Health professional delivering intervention ‐ a clinical pharmacist who had at least 1 year of ambulatory care/clinical training experience and was certified in diabetes education at state or national level |
|
| Interventions | PATIENTS Veterans Affiars Multidisciplinary Education in Diabetes and Intervention in for Cardiac Risk Reduction in Depression (VA‐MEDIC‐D) plus standard care versus standard care VA‐MEDIC‐D consisted of participants attending 4 once‐weekly sessions of 2 hours followed by 5 monthly booster 90‐minute group sessions held in a classroom with 4‐6 participants. Family friends could attend Each session consisted of two parts. Part 1: Standardised education session of 40‐60 minutes by a nurse, nutritionist, clinical pharmacist focusing on 1 or 2 self‐care behaviours e.g. goals for healthy eating Part 2: Pharmacist conducted behavioural and pharmacologic intervention for hypertension, hyperlipidaemia, hyperglycaemia and tobacco use. 60‐80 minute sessions. A group assessment of daily self‐care activities was made and self‐care enhanced through group counselling. Individual risk report of laboratory tests and medication was reviewed and drugs initiated or titrated by the pharmacist according to established algorithms for BP, cholesterol, diabetes and tobacco cessation. The pharmacist undertook behavioural change goal setting. No changes were made for psychiatric medications |
|
| Outcomes | PATIENTS Change in the proportion of participants who attained a HbA1c < 7% at 6 months Proportion of participants who attained ADA guidelines for BP and fasting lipids and the absolute change in values Self‐care (Perceived Competence for Diabetes Scale PCDS) Adherence to self‐care behaviours (Summary of Diabetes Self‐Care Activities SDSCA) Change from baseline in depression symptoms (assessed by the Patient Health Questionnaire ‐PHQ9) even though depression treatment was not part of the intervention Deaths RESOURCE USE Emergency department visits and hospitalisations |
|
| Notes | Complex multifactorial intervention. 6‐month study. |
|
| Risk of bias | ||
| Bias | Authors' judgement | Support for judgement |
| Random sequence generation (selection bias) | Low risk | Participants were assigned to intervention arm or standard care using a simple coin toss randomisation. |
| Allocation concealment (selection bias) | Unclear risk | Method of concealment not described. |
| Blinding of participants and personnel (performance bias) All outcomes | High risk | Not feasible with study design. |
| Blinding of outcome assessment (detection bias) All outcomes | Low risk | No blinding of assessment but outcome (HbA1c), cholesterol unlikely to be influenced by lack of blinding. Unclear who measured BP. It is unclear if response to questionnaires were influenced by the group allocation. |
| Incomplete outcome data (attrition bias) | Low risk | Intention‐to‐treat analysis. 0/44 intervention and 2/44 standard care lost to follow‐up. |
| Selective reporting (reporting bias) | Low risk | Predefined outcomes reported. |
| Other bias | Unclear risk | Multifactorial intervention with effect of prescribing on outcomes unclear. |
Thompson 1984.
| Methods | Controlled before‐and‐after study | |
| Participants | A purposively selected skilled nursing facility, Los Angeles, USA Patients in a skilled nursing care facility with a length of stay > 2 months Patients, pre‐study year (treatment group 60, control group 75). Study year (pharmacist treatment group 67, control group 72) Health professional delivering intervention ‐ two clinical pharmacists who were University of Southern California School of Pharmacy faculty members with six or more years experience in clinical patient care. Each was trained in physical assessment and basic diagnostic skills |
|
| Interventions | PATIENTS Drug therapy prescribing and patient care management by clinical pharmacists versus usual care Each patient's medical, social, functional and drug history was reviewed. Physical assessment was performed. Appropriate laboratory tests ordered and physical assessment parameters determined. Medications were reviewed with the options of continuing present medications, making dose adjustments or entirely discontinuing or changing the type or class of medication. Patients were examined monthly. Supervising physician refrained from prescribing any medications, changing any of the clinical pharmacists orders or ordering any drug‐related laboratory tests |
|
| Outcomes | PATIENTS Deaths RESOURCE USE Average number of drugs per patients Discharge to lower level care Hospitalisations |
|
| Notes | 12‐month study. | |
| Risk of bias | ||
| Bias | Authors' judgement | Support for judgement |
| Random sequence generation (selection bias) | High risk | Participants could not be randomly assigned to treatment or control groups because of logistic limitations imposed by the organisation of medical care. Control and treatment patients were matched with no significant differences between the pre‐study year and study years for sex, age, length of stay, number of medications, diagnoses, discharge rate, hospitalisations, and mortality rate. |
| Allocation concealment (selection bias) | High risk | As above. |
| Blinding of participants and personnel (performance bias) All outcomes | High risk | Not feasible with study design. |
| Blinding of outcome assessment (detection bias) All outcomes | Low risk | Numerical counts with low risk of bias. |
| Incomplete outcome data (attrition bias) | Low risk | Data complete. |
| Selective reporting (reporting bias) | Low risk | Predefined outcomes reported. |
| Other bias | Unclear risk | Different physicians were involved in both groups and some improved treatment effects potentially due to the influence on and collaboration with prescribing pharmacist. |
Tobe 2006.
| Methods | Randomised controlled trial (open‐label study with 2 parallel groups) | |
| Participants | Battlefords Tribal Council Indian Health Services, Saskatchewan, Canada First Nations people 18 and older with existing hypertension (systolic BP ≥ 130 mmHg, diastolic BP ≥ 80 mmHg) and diabetes Patients 99 (intervention 50, control 49) ‐ included in analysis: 48 intervention, 47 control Healthcare professional delivering intervention ‐ home care nurse following a predefined treatment algorithm of pharmacologic antihypertensive therapy. Hypertension specialist consulted if BP not controlled or for accelerated titration No unit of analysis errors |
|
| Interventions | PATIENTS Community‐based treatment strategy implemented by home care nurses to control hypertension versus home care visits and follow‐up by primary care physicians Patients seen at baseline, 6 weeks, 3, 6, 9, 12 months |
|
| Outcomes | PATIENTS Difference between the groups in the change in systolic BP after 12 months All participants received healthy lifestyle classes Change in diastolic BP Change in urine albumin Adverse events |
|
| Notes | 12‐month study. | |
| Risk of bias | ||
| Bias | Authors' judgement | Support for judgement |
| Random sequence generation (selection bias) | Low risk | Randomisation used a permuted block design stratified by the seven reserves. |
| Allocation concealment (selection bias) | Low risk | Randomisation was performed by means of opaque sealed envelopes opened at the end of the baseline visit by the home care nurse in the presence of the physician and patient. |
| Blinding of participants and personnel (performance bias) All outcomes | High risk | Not feasible with study design. Randomisation opened in front of home care nurse, physician, patient. |
| Blinding of outcome assessment (detection bias) All outcomes | Unclear risk | BP taken by home care nurses. Low risk ‐ laboratory tests. |
| Incomplete outcome data (attrition bias) | Low risk | Intention‐to‐treat. 2 participants withdrew from both intervention and control groups (reasons provided and participants not included in analysis). Intervention analysis includes 1 lost to follow‐up and 3 stopped, control 2 lost to follow‐up and 3 stopped intervention. |
| Selective reporting (reporting bias) | Low risk | Predefined outcomes reported. |
| Other bias | Unclear risk | Unclear level of influence of the supervising hypertension specialist on nurse titration of medication. Both groups shared family physicians. |
Tsuyuki 2015.
| Methods | Randomised controlled trial | |
| Participants | Twenty‐three sites (community pharmacies, hospital outpatient clinics, primary care settings) in Alberta, Canada Community pharmacists (20), hospital pharmacists (2) primary care clinic pharmacists (6) Adults with uncontrolled BP as defined by Canadian Hypertension Education Program guidelines (140/90 mmHg for most and130/80 mmHg for those with diabetes) Patients 248 (181 intervention, 67 usual care) Healthcare professional delivering intervention ‐ pharmacists with authorisation to prescribe (Health Professions Act of Alberta) entailing a minimum of one year of practice experience and completion of an application process to demonstrate skills in patient assessment, judgement, care planning and follow‐up. Prescribing decisions required to be communicated to the patient's primary care physician. Pharmacists received training in BP assessment and treatment and had access to hypertension experts for consultation as required |
|
| Interventions | PATIENTS Pharmacist prescribing for community‐dwelling patients with uncontrolled hypertension versus usual care BP control by pharmacist care (assessment of and counselling about cardiovascular risk and BP control, review of antihypertensive medications and prescribing/titrating drug therapy, BP wallet record card, lifestyle advice, written information) |
|
| Outcomes | PATIENTS Change in systolic BP from base line to 6 months between intervention and usual care Change in diastolic BP Number of patients at Canadian Hypertension Education Program target RESOURCE USE Number of new antihypertensive medication starts Number of antihypertensive dose changes Number of antihypertensive drug changes Number of new prescriptions for aspirin and cholesterol‐lowering medications |
|
| Notes | 6‐month study. | |
| Risk of bias | ||
| Bias | Authors' judgement | Support for judgement |
| Random sequence generation (selection bias) | Low risk | Centralised secure website (EPICORE). |
| Allocation concealment (selection bias) | Unclear risk | Method of concealment not described. |
| Blinding of participants and personnel (performance bias) All outcomes | High risk | Not feasible with study design. |
| Blinding of outcome assessment (detection bias) All outcomes | Unclear risk | Performed by patients via automated device, study pharmacists requested to leave room. |
| Incomplete outcome data (attrition bias) | Low risk | While sample size of 340 in protocol was not reached due to funding limits this affected the remuneration substudy, not the main study with a priori sample size of 240. Attrition 26 (14%) intervention, 6 (9%) usual care. |
| Selective reporting (reporting bias) | Low risk | Not evident. |
| Other bias | Unclear risk | The usual care group received pharmacist education at the discretion of the pharmacist and BP measurement at three months in addition to usual medical care which may represent greater than usual care. Intervention patients were seen more frequently. Cluster‐randomisation not employed. Effect of fee for service. |
Tsuyuki 2016.
| Methods | Randomised controlled trial | |
| Participants | 723 patients who were at high risk of cardiovascular events in 56 community pharmacies in Alberta, Canada Adults with diabetes, chronic kidney disease, atherosclerotic vascular disease, primary prevention patients with multiple risk factors. Subjects had at least one uncontrolled risk factor, BP > 140/90 mmHg or > 130/80 mmHg if diabetic, LDL‐c > 2.0 mmol/L, HbA1c > 7% or current smoker Patients 723 (370 pharmacist intervention, 353 usual pharmacist/physician care) Healthcare professional delivering intervention ‐ community pharmacists prescribing within their scope of practice and undergoing an online training programme in cardiovascular risk reduction |
|
| Interventions | PATIENTS The pharmacist intervention group received a medication therapy management consultation comprising a patient assessment, laboratory assessment and individualised assessment with education. Pharmacists prescribed medications and ordered laboratory tests as per their scope of practice to achieve treatment targets. Patients received monthly follow‐up visits for three months |
|
| Outcomes | PATIENTS Change in risk for cardiovascular disease events at 3 months Improvement in LDL Improvement in systolic BP Improvement in HbA1c Improvement in smoking cessation |
|
| Notes | The study duration was 3 months. | |
| Risk of bias | ||
| Bias | Authors' judgement | Support for judgement |
| Random sequence generation (selection bias) | Low risk | Patients were randomised in a 1:1 ratio to intervention or usual care groups using a centralised secure website (EPICORE). |
| Allocation concealment (selection bias) | Unclear risk | Method of concealment not described. |
| Blinding of participants and personnel (performance bias) All outcomes | High risk | Not feasible with study design. |
| Blinding of outcome assessment (detection bias) All outcomes | Unclear risk | Low risk laboratory tests. Unclear risk with BP assessment. |
| Incomplete outcome data (attrition bias) | Low risk | Loss to follow‐up or withdrawals 2.8% usual care, 5.1% intervention group. |
| Selective reporting (reporting bias) | Low risk | Not evident. |
| Other bias | Unclear risk | Limited duration study of 3 months. |
Vivian 2002.
| Methods | Randomised controlled trial | |
| Participants | General medicine clinic for the management of hypertension at a Veterans Affairs Medical Center, Philadelphia, USA Patients over 18 years with a confirmed diagnosis of essential hypertension (systolic BP > 140 mmHg or diastolic BP > 90 mmHg), receiving antihypertensive drug therapy and BP > 140/90 mmHg), receiving all drugs from the VA Medical Center pharmacy and not receiving care at the pharmacist‐managed clinic Patients 56 (27 intervention, 29 control) Health professional delivering intervention ‐ one pharmacist Practice ‐ 1 No unit of analysis errors |
|
| Interventions | PATIENTS BP control in a pharmacist‐managed hypertension clinic versus traditional care from a primary care physician Patients were scheduled to meet monthly with the pharmacist who had prescribing authority to make appropriate changes in prescribed drugs, adjust dosages, and provide drug counselling in accordance with guidelines. The pharmacist did not make changes in other drugs that may affect BP. Primary care providers cared for comorbid conditions but could not change antihypertensive medication Control group ‐ care from traditional pharmacy services and primary care providers as needed (at least once a year) |
|
| Outcomes | PATIENTS BP Changes in compliance ‐ compliance evaluation survey Patient satisfaction Quality of life (Medical Outcomes Study Short Form‐36 survey) |
|
| Notes | Study period 6 months. | |
| Risk of bias | ||
| Bias | Authors' judgement | Support for judgement |
| Random sequence generation (selection bias) | Unclear risk | Sequence generation not described 'patients were randomly assigned'. |
| Allocation concealment (selection bias) | Unclear risk | Concealment process not described. |
| Blinding of participants and personnel (performance bias) All outcomes | High risk | Not feasible with study design. |
| Blinding of outcome assessment (detection bias) All outcomes | Unclear risk | Measurement of BP at start and end undertaken 'by a clinical pharmacist' (one of three). Patient completed surveys. Unclear effect of filling satisfaction forms in the pharmacy clinic and influence of group to which patient randomised. Compliance evaluation questionnaire not validated. |
| Incomplete outcome data (attrition bias) | Low risk | Low attrition. Two patients in the control group withdrew, 2/29, one in the intervention arm, 1/27. Reasons provided. No intention‐to‐treat analysis. |
| Selective reporting (reporting bias) | Low risk | All predefined outcomes reported. |
| Other bias | Unclear risk | Monthly follow‐up in intervention arm versus 'at least yearly' in the control arm. Most patients African Americans and all men. |
Wallymahmed 2011.
| Methods | Randomised controlled trial | |
| Participants | Diabetes Centre, Aintree University Hospitals, Liverpool, England Patients > 18 years with type 1 diabetes for at least 5 years, HbA1c ≥ 8%, and at least one other risk factor for the development of cardiovascular disease Patients 81 (nurse‐led group 40, routine group 41) Health professional delivering intervention ‐ single diabetes nurse consultant in an outpatient clinic No unit of analysis errors |
|
| Interventions | PATIENTS Nurse‐led cardiovascular risk reduction versus routine care with review by doctors in a diabetes clinic with follow‐up and referral to the multidisciplinary team for diabetes control problems. In nurse‐led management included lifestyle advice, information and advice on injection technique, and pharmacological interventions (glycaemic control, hypertension, lipids). Management was protocol driven on a 'treat to target' basis. Changes in medications were made by a letter to the GP with a copy to the patient. In usual care recommendations for initiation or changes to medication were communicated to the patients' GP. Patients were reviewed monthly for the first 6 months then 6‐monthly for 2 years. Review in the routine diabetic clinic occurred annually |
|
| Outcomes | PATIENTS (at baseline, 6, 12, and 24 months) HbA1c Lipids (total cholesterol, LDL, HDL) Serum creatinine Urinary albumin/creatinine ratio Weight BMI BP (systolic and diastolic BP) Daily insulin dose Medication ‐ nurse‐led group, serum creatinine and potassium (ACE inhibitors or angiotensin 2 receptor blockers), liver function tests for statins PROCESS Medication use |
|
| Notes | ||
| Risk of bias | ||
| Bias | Authors' judgement | Support for judgement |
| Random sequence generation (selection bias) | Low risk | Patients were randomised. |
| Allocation concealment (selection bias) | Low risk | Computer‐generated blind envelope system. |
| Blinding of participants and personnel (performance bias) All outcomes | High risk | Not feasible with study design. |
| Blinding of outcome assessment (detection bias) All outcomes | Low risk | Laboratory measures low risk. Provider measuring BP not reported. |
| Incomplete outcome data (attrition bias) | Low risk | 96.2% (78/81) completed the 2‐year study, low attrition 1/40 nurse‐led, 2/41 routine care. During the study non‐attendance was high, nurse‐led 22%, consultant routine care 26%, routine care by diabetes nursing service for glycaemic control 40%. |
| Selective reporting (reporting bias) | Unclear risk | Pedefined outcomes reported apart from 6‐month routine care data. |
| Other bias | Unclear risk | In routine care, initiation or changes to lipid‐lowering and antihypertensive medication were communicated by letter to the GP and may not have been actioned. Unclear detail of nurse prescribing method. Unclear influence on prescribing outcomes of multidisciplinary team and annual clinic review. |
ACE: angiotensin‐converting enzyme ADA: American Diabetes Association BMI: body mass index BP: blood pressure CD4: cluster of differentiation 4 CHD: coronary heart disease CHF: congestive heart failure DM: diabetes mellitus DSC: diabetes symptom checklist GP: general practitioner HbA1c: glycated haemoglobin HDL: high‐density lipoprotein LDL: low‐density lipoprotein PEQD: patients' evaluation of the quality of diabetes care SF‐12: 12 item Short Form health survey SF‐36: 36 item Short Form health survey
Characteristics of excluded studies [ordered by study ID]
| Study | Reason for exclusion |
|---|---|
| Adler 2004 | No pharmacist prescribing element. |
| Akrimi 2013 | Not RCT, CBA, or ITS. |
| Al Hamareneh 2013 | Does not meet CBA criteria. |
| Ala 2011 | Single centre non‐RCT. |
| Amariles 2012 | No non‐medical (pharmacist) prescribing element. |
| Anaya 2008 | Unclear medical input into pharmacist prescribing. Does not have three time point measurements before and after intervention. |
| Andrus 2007 | Retrospective chart review of pharmacist clinical interventions, single centre not randomised, no control group, not ITS. |
| Bajorek 2005 | Not randomised, no control group, reference to a historical control. |
| Bajorek 2016 | Pharmacists did not undertake a prescribing role. |
| Bebb 2007 | Unclear and varied use of prescribing algorithm by doctors and nurses. |
| Becker 1998 | Doctor wrote script. |
| Bellary 2008 | Medical consultation with non‐medical prescriber on prescribing changes. |
| Birchall 2011 | Not RCT, CBA, or ITS. |
| Blackberry 2014 | Medical role in prescribing decisions. |
| Blozik 2010 | No nurse prescribing. |
| Brook‐Barclay 2014 | No pharmacist prescribing role. |
| Bruggink‐Andre de la Porte 2007 | Physician and nurse proposed treatment. |
| Capoccia 2004 | Independence of non‐medical prescribing role by pharmacist unclear. |
| Carey 2008 | Not RCT, CBA, or ITS. |
| Carter 2001 | Unclear non‐medical prescribing role of pharmacist. |
| Carter 2008 | Pharmacist could not independently prescribe. |
| Carter 2015 | Even though a RCT the aim of this study was to test the effect of experiencing the intervention and then discontinuing it versus continuing the intervention. There was no control group that never received a pharmacist intervention, which is the basis for exclusion. |
| Cattell 2001 | Transcribing where medical staff primary decision maker. |
| Chantelois 2003 | Pharmacist discharge prescriptions reviewed, electronically co‐signed, edited, or cancelled by a physician. |
| Cheng 2014 | Review only. |
| Chiquette 1998 | Single site, not contemporaneous data collection. |
| Courtenay 2007 | Not RCT, CBA, or ITS. |
| Dawson 2012 | Not RCT, CBA, or ITS. |
| Dean 2014 | Medication prescription by doctors. |
| deClifford 2009 | Not RCT, CBA, or ITS and doctor signed prescription. |
| Dierick‐van Daele 2010 | Nurse had no authority to prescribe. |
| Driscoll 2014 | Cardiologist reviwed treatment and completed prescriptions. |
| Ginson 2000 | Physician signature required on pharmacist prescription. |
| Gray 1985 | Not RCT, CBA, or ITS. |
| Guder 2015 | Joint nurse and physician up‐titration of medication. |
| Hale 2013 | Medical signature required. |
| Hancock 2012 | Unclear nurse prescribing autonomy. Prescriptions managed within care home and associated general practice. |
| Harrison 2014 | Does not meet ITS criteria of three data points before and after intervention. |
| Hawkins 1979 | Pharmacist prescribing intervention unclear. Focus on compliance support rather than drug selection or change. |
| Hick 2001 | Non‐randomised pharmacist transcription. |
| Ho 2014 | No pharmacist prescribing. |
| Holland 2007 | No non‐medical (pharmacist) prescribing. |
| Hotu 2010 | No prescribing by health workers. |
| Irewall 2015 | Medical consultation on pharmacological management. |
| Irons 2002 | Non‐randomised study with mixed prescribers in control group. |
| Jacobs 2005 | Not RCT, CBA, or ITS. |
| Jameson 2010 | Primary care physician approved any changes in medication or therapy. Pharmacist could adjust insulin doses as needed. |
| Jennings 2012 | Descriptive study. |
| Jewell 1988 | Autonomy and method of nurse prescribing by algorithm not clear. |
| Jorstad 2013 | Unclear nurse prescribing autonomy. |
| Kinnersley 2000 | Nurse prescriptions signed by doctor. |
| Krein 2004 | Nurse practitioner's medication changes required approval by the primary care (medical) provider. |
| Kwan 2007 | Physician determined and signed medication orders. |
| Lin 2012 | No pharmacist prescribing element. |
| Logan 1983 | No nurse prescribing. |
| Lowey 2007 | No comparison group or period for pharmacist intervention. |
| Lowrie 2012 | Consulation by pharmacist with family doctor before medication changes. |
| Lowrie 2014 | No pharmacist prescribing role. |
| Ma 2010 | Retrospective single site study. |
| Martinez 2013 | Not RCT or CBA. |
| McAdam‐Marx 2012 | Not RCT, CBA, or ITS. |
| McCord 2006 | Non‐randomised study. Retrospective chart review. |
| McFadzean 2003 | Not RCT, CBA, or ITS. |
| McGhan 1983 | Non‐randomised study, no pre‐intervention for CBA. |
| McGowan 2008 | Pharmacist made treatment recommendations ‐ no prescribing. |
| Meulepas 2008 | CBA study with a delayed intervention in the control group. Extent of nurse prescribing and autonomy unclear. |
| Michalets 2015 | Does not meet CBA criteria. |
| Monyatsi 2012 | Cross‐sectional study of chart documentation. |
| Morello 2013 | Not RCT, CBA, or ITS. |
| Murphy 2010 | Not RCT, CBA, or ITS. |
| Neto 2011 | Unclear if any prescribing role by pharmacist. |
| Norman 2010 | Non‐randomised study, no pre‐intervention for CBA study. |
| O'Hare 2004 | Unclear medical and nursing use of prescribing algorithm. |
| Obreli‐Neto 2011 | No prescribing by pharmacist. |
| Omran 2013 | Unclear pharmacist prescribing role. |
| Omran 2015 | Pharmacist prescribing authorisation not evident. |
| Pape 2011 | No prescribing by pharmacist. |
| Payton 2011 | Not RCT, CBA, or ITS. |
| Reid 2005 | Not RCT, CBA, or ITS. |
| Rochester 2010 | Does not meet CBA or ITS criteria. |
| Rothman 2005 | All medication changes required the approval of the primary care proivider. |
| Rudd 2010 | Single centre retrospective medical record review. |
| Sadik 2005 | No pharmacist prescribing. |
| Samtia 2013 | No pharmacist prescribing role. |
| Sanne 2010 | Medical prescribing only. |
| Schneider 1982 | Shadow prescribing by pharmacist. |
| Scullin 2007 | Extent and outcomes of discharge transcribing role by pharmacists unclear. |
| Sease 2011 | Retrospective review. |
| Seng 2011 | No pharmacist prescribing. |
| Shum 2000 | Nurse prescriptions required medical signature. |
| Simpson 2011 | Physician authorised medication changes. |
| Sisk 2006 | Physician role in prescribing. |
| Solomon 1998 | Prescribing role in pharmaceutical care unclear. |
| Sonnex 2014 | Non‐randomised, not CBA or ITS. |
| Stafford 2011 | Not RCT, CBA, or ITS. |
| Stone 2010 | Adjustment of medications by nurse practitioner medically supervised. |
| Stromberg 2003 | Cardiologist consulted on changes to medications. |
| Tahaineh 2011 | Clinical pharmacist made prescribing recommendations to physicians. |
| Taveira 2006 | Does not meet ITS criteria. |
| Till 2003 | Retrospective analysis. |
| To 2011 | Not RCT, CBA, or ITS. |
| Vaisberg 2013 | Unclear pharmacist prescribing role. |
| Vasileff 2009 | Not RCT, CBA, or ITS. |
| Venning 2000 | Non‐medical prescribing nurses required doctor to sign prescriptions. |
| Verret 2012 | Patient self‐management versus usual care. |
| Voogdt‐Pruis 2011 | Nurses did not have direct prescribing rights. |
| Warrington 2012 | Does not meet CBA criteria. |
| Weigel 2012 | Not RCT, CBA, or ITS. |
| Wilson 2003 | Unclear degree of physician and pharmacist prescribing roles in intervention group. |
| Wittayanukorn 2013 | Non‐randomised study with no non‐medical prescribing. |
| Wood 2008 | No non‐medical prescribing. |
| Zimmerman 2014 | Non‐randomised, not CBA or ITS. |
CBA: controlled before‐and‐after ITS: interrupted time series RCT: randomised controlled trial
Characteristics of studies awaiting assessment [ordered by study ID]
Barton 2013.
| Methods | Cost‐effectiveness analysis alongside a pragmatic cluster‐randomised controlled trial in 31 primary care clinics (16 intervention, 15 controls) |
| Participants | HIV‐infected patients in South Africa. Cohort one: patients not yet receiving anti‐retroviral therapy. 5390 intervention patients, 3862 controls. Cohort 2: patients receiving at least six months antiretroviral therapy; 3029 intervention patients, 3202 controls |
| Interventions | Nurses who received at least four educational outreach training sessions about antiretroviral therapy prescribing and undertook initiation and represcribing of antiretroviral therapy versus usual medical care |
| Outcomes | A cost‐effectiveness study of nurse‐led versus doctor‐led antiretroviral treatment in South Africa was undertaken on data derived from Fairall 2008. Nurse‐led antiretroviral therapy was found to be associated with higher mean health service costs than doctor‐led care but the levels of uncertainty were high given the wide confidence intervals around the incremental costs and effects. There may have also been an underestimation of the benefit of the intervention. The increased costs were largely explained by more frequent clinic visits with longer consultations for intervention patients. Total nurse and doctor costs were higher for intervention patients in the two cohorts (those not receiving and those already receiving antiretroviral therapy). In the cohort not receiving antiretroviral therapy at enrolment the mean antiretroviral prescription costs were higher in the intervention group. |
| Notes |
Neilson 2015.
| Methods | Regression analysis of costs and effects using intention‐to‐treat and expected value of sample information |
| Participants | 125 patients with chronic pain and with complete resource use and SF‐6 dimension questionnaire data at baseline, three and six months |
| Interventions | Patients were randomised to either pharmacist medication review with face‐to‐face pharmacist prescribing or pharmacists medication review with feedback to general practitioner or treatment as usual |
| Outcomes | The differences in costs and effects in terms of QALYs associated with pharmacist prescribing and or review compared with treatment as usual in managing chronic pain in primary care was undertaken on data derived from Bruhn 2013. Adjusted mean cost differences per patient relative to treatment as usual were GBP 77 for prescribing (95% CI ‐82 to 237) and GBP 54 for review (95% CI ‐103 to 212). Pharmacist‐led interventions for chronic pain appeared more costly and provide similar QALYs. The estimates were imprecise due to the small size of the pilot trial. |
| Notes |
Tsuyuki 2014.
| Methods | Randomised controlled trial |
| Participants | 99 adult patients from 14 community pharmacies in Alberta, Canada with uncontrolled dyslipidaemia (as defined by the 2009 Canadian Dyslipidaemia Guidelines) |
| Interventions | Pharmacist prescribing versus usual pharmacist, physician care. Follow‐up at 6, 12, 18, and 24 weeks |
| Outcomes | Unadjusted proportion of patients achieving LDL‐c target was higher in the intervention group (43% versus 18%, P < 0.007) and the intervention group had a greater reduction in LDL‐c (1.59 mmol/L, SE 0.15 mmol/L versus 0.42 mmol/L, SE 0.1, P < 0.0001) |
| Notes |
CI: confidence interval LDL‐c: low‐density lipoprotein QALYs: quality‐adjusted‐life‐years SE: standard error SF‐6: Short Form‐6
Characteristics of ongoing studies [ordered by study ID]
Mikuls 2015.
| Trial name or title | A pragmatic cluster‐randomised controlled trial of an automated, pharmacy‐based intervention to optimise allopurinol therapy in gout |
| Methods | Cluster‐randomised controlled trial of 103 clusters comparing pharmacist‐led interventions versus usual care An expert panel endorsed allopurinol treatment algorithms for pharmacist‐led interventions to adjust allopurinol dosing |
| Participants | Patients 441 intervention, 810 usual care Patients with gout receiving new allopurinol prescriptions |
| Interventions | Dose titration to treat to target to achieve and maintain a serum urate ≤ 6.0 mg/dL |
| Outcomes | |
| Starting date | July 2014 |
| Contact information | Ted R Mikuls, University of Nebraska Medical Center, Omaha, NE |
| Notes | Ongoing study |
Differences between protocol and review
The interventions in acute and secondary care were combined, as were interventions in chronic and primary care.
The fixed‐effect model for meta‐analyses was compared to the random‐effects model.
Secondary outcomes: Deleted: 'Differential effects across advantaged and disadvantaged populations based on place of residence or socio‐economic status'.
Secondary outcomes: 'Patient‐reported outcomes' replaced the term 'humanistic outcomes' and appears before resource use.
Dealing with missing data: Added: 'Imputing missing data was only considered when continuous outcomes were reported without measures of variance'.
Assessment of heterogeneity: Added: 'We determined that heterogeneity might not be important between 0% and 40%, 30% to 60% represented moderate heterogeneity, 50% to 90% substantial heterogeneity, and 75% to 100% considerable heterogeneity'.
Measures of treatment effect: Deleted: 'For ITS studies, we will report regression analysis with time trends before and after the intervention. If possible we will re‐analyse data for ITS studies where there is inappropriate analysis or reporting of results using the methods described in Ramsay 2003'.
Unit of analysis issues: Deleted: 'We will re‐analyse inappropriately designed ITS studies using time‐series regression and report a statistical comparison of time trends with a minimum of three data points before and after the intervention'.
We revised the database list to reflect current availability and coverage of the resources available at the time of update. The search methods meet the current MECIR criteria.
Contributions of authors
Greg Weeks (GW) and Johnson George (JG) devised the study and prepared the protocol and review which was reviewed by Derek Stewart (DS) and Katie MacLure (KM).
Sources of support
Internal sources
-
Faculty of Pharmacy and Pharmaceutical Sciences Centre for Medicine Use and Safety, Monash University (Parkville Campus) 381 Royal Parade, Parkville VIC 3052, Australia.
Library and facilities support
External sources
The Australian Satellite of the Effective Practice and Organisation of Care (EPOC) Group receive funding from the National Health and Medical Research Council (NHMRC), Australia.
Declarations of interest
The authors are researchers in the area of non‐medical prescribing. While their studies may be referenced in the review Background, it is unlikely they will meet inclusion criteria for studies to be included in the review.
GW: none known.
JG: Dr George is a chief investigator on investigator‐initiated research grants or grant applications supported by Pfizer Australia, Boehringer‐Ingelheim, and Australian Lung Foundation. These organisations had no involvement in the design of those studies, analysis of data, or publications resulting from those studies.
KM: none known.
DS: none known.
Edited (no change to conclusions), comment added to review
References
References to studies included in this review
Ansari 2003 {published data only}
- Ansari M, Shlipak MG, Heidenreich PA, Ostaeyen D, Pohl EC, Browner WS, et al. Improving guideline adherence. A randomized trial evaluating strategies to increase β‐blocker use in heart failure. Circulation 2003;107(22):2799‐804. [DOI] [PubMed] [Google Scholar]
Aubert 1998 {published data only}
- Aubert RE, Herman WH, Waters J, Moore W, Sutton D, Peterson BL, et al. Nurse case management to improve glycaemic control in diabetic patients in a health maintenance organisation. Annals of Internal Medicine 1998;29:605‐12. [DOI] [PubMed] [Google Scholar]
Barr Taylor 2003 {published data only}
- Barr Taylor C, Houston Miller N, Reilly KR, Greenwald G, Cunning D, Deeter A, et al. Evaluation of a nurse‐care management system to improve outcomes in patients with complicated diabetes. Diabetes Care 2003;26:1058‐63. [DOI] [PubMed] [Google Scholar]
Becker 2005 {published data only}
- Becker DM, Yanek LR, Johnson WR, Garrett D, Moy TF, Reynolds SS, et al. Impact of a community‐based multiple risk factor intervention on cardiovascular risk in black families with a history of premature coronary disease. Circulation 2005;111:1298‐304. [DOI] [PubMed] [Google Scholar]
Bruhn 2013 {published data only}
- Bruhn H, Bond CM, Elliott AM, Hannaford PC, Lee AJ, McNamee P, et al. Pharmacist‐led management of chronic pain in primary care: Results from a randomised controlled exploratory trial. BMJ Open 2013;3:2013. [DOI] [PMC free article] [PubMed] [Google Scholar]
Chenella 1983 {published data only}
- Chenella FC, Klotz TA, Gill MA, Kern JW, McGhan WF, Paulson YJ, et al. Comparison of physician and pharmacist management of anticoagulant therapy of inpatients. American Journal of Hospital Pharmacy 1983;40:1642‐5. [PubMed] [Google Scholar]
Choe 2005 {published data only}
- Choe HM, Mitrovich S, Dubay D, Hayward RA, Krein SL, Vijan S. Proactive case management of high‐risk patients with type 2 diabetes mellitus by a clinical pharmacist: a randomized controlled trial. American Journal of Managed Care 2005;11:253‐60. [PubMed] [Google Scholar]
Cohen 2011 {published data only}
- Cohen LB, Taveira TH, Khatana SA, Dooley AG, Pirraglia PA, Wu WC. Pharmacist‐led shared medical appointments for multiple cardiovascular risk reduction in patients with type 2 diabetes. Diabetes Educator 2011;37:801‐12. [DOI] [PubMed] [Google Scholar]
DeBusk 1994 {published data only}
- DeBusk RF, Houston Miller N, Superko R, Dennis CA, Thomas RJ, Lew HT, et al. A case‐management system for coronary risk factor modification after acute myocardial infarction. Annals of Internal Medicine 1994;120:721‐9. [DOI] [PubMed] [Google Scholar]
Denver 2003 {published data only}
- Denver EA, Barnard M, Woolfson RG, Earle KA. Management of uncontrolled hypertension in a nurse‐led clinic compared with conventional care for patients with type 2 diabetes. Diabetes Care 2003;26:2256‐60. [DOI] [PubMed] [Google Scholar]
Einhorn 1978 {published data only}
- Einhorn RF, Trias M. Differences between physicians and nurses in providing family planning services: Findings from a Bogota clinic. Studies in Family Planning 1978;9(2):35‐8. [PubMed] [Google Scholar]
Ellis 2000 {published data only}
- Ellis SL, Carter BL, Malone DC, Billups SJ, Okano GJ, Valuck RJ, et al. Clinical and economic impact of ambulatory care clinical pharmacists in management of dyslipidemia in older adults: The IMPROVE Study. Pharmacotherapy 2000;20(12):1508‐16. [DOI] [PubMed] [Google Scholar]
Fairall 2008 {published data only}
- Fairall L, Bachmann MO, Lombard C, Timmerman V, Uebel K, Zwarenstein M, et al. Task shifting of antiretroviral treatment from doctors to primary‐care nurses in South Africa (STRETCH): a pragmatic, parallel, cluster‐randomised trial. Lancet 2012;380:889‐98. [DOI] [PMC free article] [PubMed] [Google Scholar]
Finley 2003 {published data only}
- Finley PR, Rens HR, Pont JT, Gess SL, Louie C, Bull SA, et al. Impact of a collaborative care model on depression in a primary care setting: a randomized controlled trial. Pharmacotherapy 2003;23:1175‐85. [DOI] [PubMed] [Google Scholar]
Fischer 2012 {published data only}
- Fischer HH, Eisert SL, Everhart RM, Durfee MJ, Moore SL, Soria S, et al. Nurse‐run, telephone‐based outreach to improve lipids in people with diabetes. American Journal of Managed Care 2012;18(2):77‐84. [PubMed] [Google Scholar]
Heisler 2012 {published data only}
- Heisler M, Hofer TP, Schmittdiel JA, Selby JV, Klamerus ML, Bosworth HB, et al. Improving blood pressure control through a clinical pharmacist outreach program in patients with diabetes mellitus in 2 high‐performing health systems. Circulation 2012;125:2863‐72. [DOI] [PMC free article] [PubMed] [Google Scholar]
Hill 2003 {published data only}
- Hill MN, Han HR, Dennison CR, Kim MT, Roary MC, Blumenthal RS, et al. Hypertension care and control in undeserved urban African American men: Behavioural and physiological outcomes at 36 months. American Journal of Hypertension 2003;16:906‐13. [DOI] [PubMed] [Google Scholar]
Hirsch 2014 {published data only}
- Hirsch JD, Steers N, Adler DS, Kuo GM, Morello CM, Lang M, et al. Primary care‐based pharmacist‐physician collaborative medication‐therapy management of hypertension: A randomized, pragmatic trial. Clinical Therapeutics 2014;36(9):1244‐54. [DOI] [PMC free article] [PubMed] [Google Scholar]
Houweling 2009 {published data only}
- Houweling ST, Kleefstra N, Hateren KJJ, Kooy A, Groenier KH, Vergert E, et al. Diabetes specialist nurse as main care provider for patients with type 2 diabetes. Journal of Medicine 2009;67(7):279‐84. [PubMed] [Google Scholar]
Houweling 2011 {published data only}
- Houweling ST, Kleefstra N, Hateren KJJ, Groenier KH, Meyboom‐de Jong B, Bilo HJG. Can diabetes management be safely transferred to practice nurses in a primary care setting? A randomised controlled trial. Journal of Clinical Nursing 2011;20:1264‐72. [DOI] [PubMed] [Google Scholar]
Hunt 2008 {published data only}
- Hunt JS, Siemienczuk J, Pape G, Rozenfeld Y, MacKay J, LeBlanc BH, et al. A randomised controlled trial of team‐based care: Impact of physician‐pharmacist collaboration on uncontrolled hypertension. Journal of General Internal Medicine 2008;23(12):1966‐72. [DOI] [PMC free article] [PubMed] [Google Scholar]
Ishani 2011 {published data only}
- Ishani A, Greer N, Taylor BC, Kubes L, Cole P, Atwood M, et al. Effect of nurse case management compared with usual care on controlling cardiovascular risk factors in patients with diabetes. Diabetes Care 2011;34:1689‐94. [DOI] [PMC free article] [PubMed] [Google Scholar]
Jaber 1996 {published data only}
- Jaber LA, Halapy H, Fernet M, Tummalapalli S, Diwakaran H. Evaluation of a pharmaceutical care model on diabetes management. Annals of Pharmacotherapy 1996;30:238‐43. [DOI] [PubMed] [Google Scholar]
Khunti 2007 {published data only}
- Khunti K, Stone M, Paul S, Baines J, Gisborne L, Farooqi A, et al. Disease management programme for secondary prevention of coronary heart disease and heart failure in primary care: a cluster randomised controlled trial. Heart 2007;93:1398‐405. [DOI] [PMC free article] [PubMed] [Google Scholar]
Klingberg‐Allvin 2015 {published data only}
- Klingberg‐Allvin M, Cleeve A, Atuhairwe S, Tumwesigye NM, Faxelid E, Byamugisha J, et al. Comparison of treatment of incomplete abortion with misoprostol by physicians and midwives at district level in Uganda: a randomised controlled equivalence trial. Lancet 2015;385:2392‐8. [DOI] [PubMed] [Google Scholar]
Kuethe 2011 {published data only}
- Kuethe M, Vaessen‐Verberne A, Mulder P, Bindels P, Aalderen W. Paediatric asthma outpatient care by asthma nurse, paediatrician or general practitioner: randomised controlled trial with two‐year follow‐up. Primary Care Respiratory Journal 2011;20(1):84‐91. [DOI] [PMC free article] [PubMed] [Google Scholar]
Litaker 2003 {published data only}
- Litaker D, Mion LC, Planavsky L, Kippes C, Mehta N, Frolkis J. Physician‐nurse practitioner teams in chronic disease management: the impact on costs, clinical effectiveness, and patients' perception of care. Journal of Interprofessional Care 2003;17(3):223‐7. [DOI] [PubMed] [Google Scholar]
Logan 1979 {published data only}
- Logan AG, Milne BJ, Achber C, Campbell WP, Haynes RB. Work‐site treatment of hypertension by specially trained nurses. A controlled trial. Lancet 1979;2:1175‐8. [DOI] [PubMed] [Google Scholar]
MacMahon Tone 2009 {published data only}
- MacMahon Tone J, Agha A, Sherlock M, Finucane F, Tormey W, Thompson CJ. An intensive nurse‐led, multi‐interventional clinic is more successful in achieving vascular risk reduction targets than standard diabetes care. International Journal of Medical Science 2009;178:179‐86. [DOI] [PubMed] [Google Scholar]
Magid 2013 {published data only}
- Magid DJ, Olson KL, Billups SJ, Wagner NM, Lyons EE, Kroner A. A pharmacist‐led American Heart Association Heart360 web‐enabled home blood pressure monitoring program. Circulation Cardiovascular Quality and Outcomes 2013;6(2):157‐63. [DOI] [PubMed] [Google Scholar]
Margolis 2013 {published data only}
- Margolis KL, Asche SE, Bergdall AR, Dehmer SP, Groen SE, Kadrmas HM, et al. Effect of home blood pressure telemonitoring and pharmacist management on blood pressure control: a cluster randomized clinical trial. JAMA 2013;310(1):46‐56. [DOI] [PMC free article] [PubMed] [Google Scholar]
Marotti 2011 {published data only}
- Marotti SB, Kerridge RK, Grimer MD. A randomised controlled trial of pharmacist medication histories and supplementary prescribing on medication errors in postoperative medications. Anaesthesia and Intensive Care 2011;39(6):1064‐70. [DOI] [PubMed] [Google Scholar]
McAlister 2014 {published data only}
- McAlister FA, Majumdar SR, Padwal RS, Fradette M, Thompson A, Buck B, et al. Case management for blood pressure and lipid level control after minor stroke: PREVENTION randomized controlled trial. Canadian Medical Association Journal 2014;186:577‐84. [DOI] [PMC free article] [PubMed] [Google Scholar]
Moher 2001 {published data only}
- Moher M, Yudkin P, Wright L, Turner R, Fuller A, Schofield T, et al. Cluster randomised controlled trial to compare three methods of promoting secondary prevention of coronary heart disease in primary care. BMJ 2001;322:1‐7. [DOI] [PMC free article] [PubMed] [Google Scholar]
New 2003 {published data only}
- New JP, Mason JM, Freemantle N, Teasdale S, Wong LM, Bruce NJ, et al. Specialist nurse‐led intervention to treat and control hypertension and hyperlipidaemia in diabetes (SPLINT). Diabetes Care 2003;26:2250‐5. [DOI] [PubMed] [Google Scholar]
Pagaiya 2005 {published data only}
- Pagaiya N, Garner P. Primary care nurses using guidelines in Thailand: a randomized controlled trial. Tropical Medicine & International Health 2005;10(5):471‐7. [DOI] [PubMed] [Google Scholar]
Rudd 2004 {published data only}
- Rudd R, Houston Miller N, Kaufman J, Kraemer HC, Bandura A, Greenwald G, et al. Nurse management for hypertension. American Journal of Hypertension 2004;17:921‐7. [DOI] [PubMed] [Google Scholar]
Spitzer 1974 {published data only}
- Spitzer WO, Sackett DL, Sibley JC, Roberts RS, Gent M, Kerigin DJ, et al. The Burlington randomized trial of the nurse practitioner. New England Journal of Medicine 1974;290:251‐6. [DOI] [PubMed] [Google Scholar]
Taveira 2010 {published data only}
- Taveira T, Friedmann PD, Cohen LB, Dooley AG, Khatana SAM, Pirraglia PA, et al. Pharmacist‐led group medical appointment model in type 2 diabetes. Diabetes Educator 2010;36(1):109‐17. [DOI] [PubMed] [Google Scholar]
Taveira 2011 {published data only}
- Taveira TH, Dooley AG, Cohen LB, Khatana SA, Wu WC. Pharmacist‐led group medical appointments for the management of type 2 diabetes with comorbid depression in older adults. Annals of Pharmacotherapy 2011;45:1346‐55. [DOI] [PubMed] [Google Scholar]
Thompson 1984 {published data only}
- Thompson JF, McGhan WF, Ruffalo RL, Cohen DA, Adamcik B, Segal JL. Clinical pharmacists prescribing drug therapy in a geriatric setting: outcome of a trial. Journal of the American Geriatrics Society 1984;32:154‐9. [DOI] [PubMed] [Google Scholar]
Tobe 2006 {published data only}
- Tobe S, Pylypchuk G, Wentworth J, Kiss A, Szalai JP, Perkins N, et al. Effect of nurse‐directed hypertension treatment among First Nations people with existing hypertension and diabetes mellitus: the Diabetes Risk Evaluation and Microalbuminuria (DREAM 3) randomised controlled trial. Canadian Medical Association Journal 2006;174(9):1267‐71. [DOI] [PMC free article] [PubMed] [Google Scholar]
Tsuyuki 2015 {published data only}
- Tsuyuki RT, Houle SKD, Charrois TL, Kolber MR, Rosenthal MM, Lewanczuk R, et al. A randomized trial of the effect of pharmacist prescribing on improving blood pressure in the community. The Alberta clinical trial in optimizing hypertension (RxACTION). Circulation 2015;132(2):93‐100. [DOI] [PubMed] [Google Scholar]
Tsuyuki 2016 {published data only}
- Tsuyuki RT, Al Hamarneh YN, Jones CA, Hemmelgarn BR. The effectiveness of pharmacist interventions on cardiovascular risk. The multicenter randomized controlled RxEACH trial. Journal of the American College of Cardiology 2016;67(24):2846‐54. [DOI] [PubMed] [Google Scholar]
Vivian 2002 {published data only}
- Vivian EM. Improving blood pressure control in a pharmacist‐managed hypertension clinic. Pharmacotherapy 2002;22(12):1533‐40. [DOI] [PubMed] [Google Scholar]
Wallymahmed 2011 {published data only}
- Wallymahmed ME, Morgan C, Gill GV, MacFarlane IA. Nurse‐led cardiovascular risk factor intervention leads to improvements in cardiovascular risk targets and glycaemic control in people with Type 1 diabetes when compared with routine diabetes clinic attendance. Diabetic Medicine 2011;28:373‐9. [DOI] [PubMed] [Google Scholar]
References to studies excluded from this review
Adler 2004 {published data only}
- Adler DA, Bungay KM, Wilson IB, Pei Y, Supran S, Peckham E, et al. The impact of a pharmacist intervention on 6‐month outcomes in depressed primary care patients. General Hospital Psychiatry 2004;26(3):199‐209. [DOI] [PubMed] [Google Scholar]
Akrimi 2013 {published data only}
- Akrimi S, Lasrado M. Nurse‐led heart failure clinic as an effective strategy for patient review and up‐titration of heart failure medication within primary care. European Journal of Heart Failure 2013;12 Suppl 1:S1‐380. [Google Scholar]
Ala 2011 {published data only}
- Ala L, Bird D, Barry R, Rathbone N. Maintenance of INR consistency during the initiation of warfarin. Nurse Prescribing 2011;9:599‐601. [Google Scholar]
Al Hamareneh 2013 {published data only}
- Al Hamarneh YN, Charrois T, Lewanczuk R, Tsuyuki RT. Pharmacist intervention for glycaemic control in the community (the RxINGstudy). BMJ Open 2013;3:e003154. [DOI: 10.1136/bmjopen-2013-003154] [DOI] [PMC free article] [PubMed] [Google Scholar]
Amariles 2012 {published data only}
- Amariles P, Sabater‐Hernandez D, Garcia‐Jimenez E, Rodriguez‐Chamorro MA, Prats‐Mas R, Marin‐Magan F, et al. Effectiveness of Dader Method for pharmaceutical care on control of blood pressure and total cholesterol in outpatients with cardiovascular disease or cardiovascular risk: EMDADER‐CV randomized controlled trial. Journal of Managed Care Pharmacy 2012;18(4):311‐23. [DOI] [PMC free article] [PubMed] [Google Scholar]
Anaya 2008 {published data only}
- Anaya JP, Rivera JO, Lawson K, Garcia J, Luna J Jr, Ortiz M. Evaluation of pharmacist‐managed diabetes mellitus under a collaborative drug therapy agreement. American Journal of Health‐System Pharmacy 2008;65:1841‐5. [DOI] [PubMed] [Google Scholar]
Andrus 2007 {published data only}
- Andrus MR, Clark DB. Provision of pharmacotherapy services in a rural nurse practitioner clinic. American Journal of Health‐System Pharmacy 2007;64:294‐7. [DOI] [PubMed] [Google Scholar]
Bajorek 2005 {published data only}
- Bajorek BV, Krass I, Ogle SJ, Duguid MJ, Shenfield GM. Optimizing the use of antithrombotic therapy for atrial fibrillation in older people: a pharmacist‐led multidisciplinary intervention. Journal of the American Geriatrics Society 2005;53:1912‐20. [DOI] [PubMed] [Google Scholar]
Bajorek 2016 {published data only}
- Bajorek B. Implementation and evaluation of a pharmacist‐led hypertension management service in primary care: outcomes and methodological challenges. Pharmacy Practice 2016;14:723. [DOI] [PMC free article] [PubMed] [Google Scholar]
Bebb 2007 {published data only}
- Bebb C, Kendrick D, Coupland C, Madeley R, Stewart J, Brown K, et al. A cluster randomised controlled trial of the effect of a treatment algorithm for hypertension in patients with type 2 diabetes. British Journal of General Practice 2007;57:136‐43. [PMC free article] [PubMed] [Google Scholar]
Becker 1998 {published data only}
- Becker DM, Raqueno JV, Yook RM, Kral BG, Blumenthal RS, Moy TF, et al. Nurse‐mediated cholesterol management compared with enhanced primary care in siblings of individuals with premature coronary disease. Archives of Internal Medicine 1998;158:1533‐9. [DOI] [PubMed] [Google Scholar]
Bellary 2008 {published data only}
- Bellary S, O'Hare JP, Raymond NT, Gumber A, Mughal S, Szczepura A, et al. Enhanced diabetes care to patients of south Asian ethnic origin (the United Kingdom Asian Diabetes Study): a cluster randomised controlled trial. Lancet 2008;371:1769‐76. [DOI] [PubMed] [Google Scholar]
Birchall 2011 {published data only}
- Birchall A, Barnett D, Buckley N, Drewry K, O'Toole L, Al‐Mohammad A. Optimum or maximum, that is the question: A retrospective analysis of pharmacological therapy achieved in a hospital based, nurse led heart failure clinic. European Heart Journal 2011;32(Suppl 1):4410. [Google Scholar]
Blackberry 2014 {published data only}
- Blackberry ID, Furler JS, Ginnivan LE, Manski‐Nankervis J‐A, Jenkins A, Cohen N, et al. An exploratory trial of basal and prandial insulin initiation and titration for type 2 diabetes in primary care with adjunct retrospective continuous glucose monitoring: INITIATION study. Diabetes Research and Clinical Practice 2014;106:247‐55. [DOI] [PubMed] [Google Scholar]
Blozik 2010 {published data only}
- Blozik E, Born AM, Stuck AE, Benninger U, Gillmann G, Clough‐Gorr KM. Reduction of inappropriate medications among older nursing‐home residents: a nurse‐led, pre/post‐design, intervention study. Drugs & Aging 2010;27(12):1009‐17. [DOI] [PubMed] [Google Scholar]
Brook‐Barclay 2014 {published data only}
- Brook‐Barclay L, Delaney CL, Scicchitano M, Quinn S, Spark JI. Pharmacist influence on prescribing in peripheral arterial disease (PIPER). Vascular Medicine 2014;19:118‐24. [DOI] [PubMed] [Google Scholar]
Bruggink‐Andre de la Porte 2007 {published data only}
- Bruggink‐Andre de la Porte PWF, Lok DJA, Veldhuisen DJ, Wijngaarden J, Cornel JH, Zuithoff NPA, et al. Added value of a physician‐and‐nurse‐directed heart failure clinic: results from the Deventer‐Alkmaar heart failure study. Heart 2007;93:819‐25. [DOI: 10.1136/hrt.2006.095810] [DOI] [PMC free article] [PubMed] [Google Scholar]
Capoccia 2004 {published data only}
- Capoccia KL, Boudreau DM, Blough DK, Ellsworth AJ, Clark DR, Stevens NH, et al. Randomized trial of pharmacist interventions to improve depression care and outcomes in primary care. American Journal of Health‐System Pharmacy 2004;61:364‐72. [DOI] [PubMed] [Google Scholar]
Carey 2008 {published data only}
- Carey N, Courtenay M, James J, Hills M, Roland J. An evaluation of a Diabetes Specialist Nurse prescriber on the system of delivering medicines to patients with diabetes. Journal of Clinical Nursing 2008;17:1635‐44. [DOI] [PubMed] [Google Scholar]
Carter 2001 {published data only}
- Carter BL, Malone DC, Billups SJ, Valuck RJ, Barnette DJ, Sintek CD, et al. Interpreting the findings of the IMPROVE study. American Journal of Health‐System Pharmacy 2001;58(14):1330‐7. [DOI] [PubMed] [Google Scholar]
Carter 2008 {published data only}
- Carter BL, Bergus GR, Dawson J, Farris KB, Doucette WR, Chrischilles EA, et al. A cluster randomized trial to evaluate physician/pharmacist collaboration to improve blood pressure control. Journal of Clinical Hypertension 2008;10:260‐71. [DOI] [PMC free article] [PubMed] [Google Scholar]
Carter 2015 {published data only}
- Carter BL, Vander Weg MW, Parker CP, Goedken CC, Richardson KK, Rosenthal GE. Sustained blood pressure control following discontinuation of a pharmacist intervention for Veterans. Journal of Clinical Hypertension 2015;17:9. [DOI: 10.1111/jch.12577] [DOI] [PMC free article] [PubMed] [Google Scholar]
Cattell 2001 {published data only}
- Cattell R, Conroy C, Sheikh A. Pharmacist integration into the discharge process: A qualitative and quantitative impact assessment. International Journal of Pharmacy Practice 2001;9:59‐64. [Google Scholar]
Chantelois 2003 {published data only}
- Chantelois EP, Suzuki NT. A pilot program comparing physician‐ and pharmacist‐ordered discharge medications at a Veterans Affairs medical center. American Journal of Health‐System Pharmacy 2003;60:1652‐6. [DOI] [PubMed] [Google Scholar]
Cheng 2014 {published data only}
- Cheng JWM, Cooke‐Ariel H. Pharmacists' role in the care of patients with heart failure: Review and future evolution. Journal of Managed Care Pharmacy 2014;20:206‐13. [DOI] [PMC free article] [PubMed] [Google Scholar]
Chiquette 1998 {published data only}
- Chiquette, E, Amato MG, Bussey HI. Comparison of an anticoagulation clinic with usual medical care. Archives of Internal Medicine 1998;158:1641‐7. [DOI] [PubMed] [Google Scholar]
Courtenay 2007 {published data only}
- Courtenay M, Carey N, James J, Hills M, Roland J. An evaluation of a specialist nurse prescriber on diabetes in‐patient service delivery. Practical Diabetes International 2007;24:69‐74. [Google Scholar]
Dawson 2012 {published data only}
- Dawson T, Godley P, Tabor TA, Suh K, Megan C. Diabetes medication management program: Impact of pharmacists on management of oral hypoglycemic medications. Annual Meeting of the American College of Clinical Pharmacy, ACCP; 2012 Oct 21‐24; Hollywood (FL), United States. 2012:32‐e274.
Dean 2014 {published data only}
- Dean SC, Kerry SM, Khong TK, Kerry SR, Oakeshott P. Evaluation of a specialist nurse‐led hypertension clinic with consultant backup in two inner city general practices: randomized controlled trial. Family Practice 2014;31(2):172‐9. [DOI] [PubMed] [Google Scholar]
deClifford 2009 {published data only}
- deClifford JM, Lam SS, Leung BK. Evaluation of a pharmacist‐initiated E‐script transcription service for discharged patients. Journal of Pharmacy Practice and Research 2009;39:39‐42. [Google Scholar]
Dierick‐van Daele 2010 {published data only}
- Dierick‐van Daele AT, Steuten LM, Metsemakers JF, Derckx EW, Spreeuwenberg C, Vrijhoef HJ. Economic evaluation of nurse practitioners versus GPs in treating common conditions. British Journal of General Practice 2010;60:e28‐35. [DOI] [PMC free article] [PubMed] [Google Scholar]
Driscoll 2014 {published data only}
- Driscoll A, Srivastava P, Toia D, Gibcus J, Hare DL. A nurse‐led up titration clinic improves chronic heart failure optimisation of beta‐adrenergic receptor blocking therapy in patients with CHF ‐ a randomized controlled trial. BMC: Research Notes 2014;7:668. [DOI: 10.1186/1756-0500-7-668] [DOI] [PMC free article] [PubMed] [Google Scholar]
Ginson 2000 {published data only}
- Ginson SH, Malmberg C, French DJ. Impact on vaccination rates of a pharmacist‐initiated influenza and pneumococcal vaccination program. Canadian Journal of Hospital Pharmacy 2000;53:270‐5. [Google Scholar]
Gray 1985 {published data only}
- Gray DR, Garabedian‐Ruffalo SM, Chretien SD. Cost‐justification of a clinical pharmacist‐managed anticoagulation clinic. Drug Intelligence and Clinical Pharmacy 1985;19:575‐80. [DOI] [PubMed] [Google Scholar]
Guder 2015 {published data only}
- Guder G, Stork S, Gelbrich G, Brenner S, Deubner N, Morbach C, et al. Nurse‐coordinated collaborative disease management improves the quality of guideline‐recommended heart failure therapy, patient‐reported outcomes, and left ventricular remodelling. European Journal of Heart Failure 2015;17:442‐52. [DOI: 10.1002/ejhf.252] [DOI] [PubMed] [Google Scholar]
Hale 2013 {published data only}
- Hale AR, Coombes ID, Stokes J, McDougall D, Whitfield K, Maycock E, et al. Perioperative medication management: expanding the role of the preadmission clinic pharmacist in a single centre, randomised controlled trial of collaborative prescribing. BMJ Open 2013;3(7):2013. [DOI] [PMC free article] [PubMed] [Google Scholar]
Hancock 2012 {published data only}
- Hancock HC, Close H, Mason JM, Murphy JJ, Fuat A, Belber M, et al. Feasibility of evidence‐based diagnosis and management of heart failure in older people in care: a pilot randomised controlled trial. BMC Geriatrics 2012;12:70‐80. [DOI] [PMC free article] [PubMed] [Google Scholar]
Harrison 2014 {published data only}
- Harrison J, Shaw JP, Harrison JE. Anticoagulation management by community pharmacists in New Zealand: an evaluation of a collaborative model in primary care. International Journal of Pharmacy Practice 2015;23(3):173‐81. [DOI] [PubMed] [Google Scholar]
Hawkins 1979 {published data only}
- Hawkins DW, Fiedler FP, Douglas HL, Eschbach RC. Evaluation of a clinical pharmacist in caring for hypertensive and diabetic patients. American Journal of Hospital Pharmacy 1979;36:1321‐5. [PubMed] [Google Scholar]
Hick 2001 {published data only}
- Hick HL, Deady PE, Wright DJ, Silcock J. The impact of the pharmacist on an elective general surgery pre‐admission clinic. Pharmacy World & Science 2001;23(2):65‐9. [DOI] [PubMed] [Google Scholar]
Ho 2014 {published data only}
- Ho PM, Lambert‐Kerzner A, Carey EP, Fahdi IE, Bryson CL, Melnyk SD, et al. Multifaceted intervention to improve medication adherence and secondary prevention measures after acute coronary syndrome hospital discharge: a randomized clinical trial. JAMA Internal Medicine 2014;174(2):186‐93. [DOI: 10.10001/jamainternmed.1013.12944] [DOI] [PubMed] [Google Scholar]
Holland 2007 {published data only}
- Holland R, Brooksby I, Lenaghan E, Ashton K, Hay L, Smith R, et al. Effectiveness of visits from community pharmacists for patients with heart failure: HeartMed randomised controlled trial. BMJ 2007;334:1098. [DOI] [PMC free article] [PubMed] [Google Scholar]
Hotu 2010 {published data only}
- Hotu C, Bagg W, Collins J, Harwood L, Whalley G, Doughty R, et al. A community‐based model of care improves blood pressure control and delays progression of proteinuria, left ventricular hypertrophy and diastolic dysfunction in Maori and Pacific patients with type 2 diabetes and chronic kidney disease: a randomized controlled trial. Nephrology, Dialysis, Transplantation 2010;25(10):3260‐6. [DOI] [PubMed] [Google Scholar]
Irewall 2015 {published data only}
- Irewall AL, Ogren J, Bergstrom L, Laurell K, Soderstrom L, Mooe T. Nurse‐led, telephone‐based, secondary preventive follow‐up after stroke or transient ischemic attack improves blood pressure and LDL cholesterol: results from the first 12 months of the randomized controlled NAILED stroke risk factor trial. PLoS One 2015;10(10):e0139997. [DOI: 10.1371/journal.pone.0139997] [DOI] [PMC free article] [PubMed] [Google Scholar]
Irons 2002 {published data only}
- Irons BK, Lenz RJ, Anderson SL, Wharton BL, Habeger B, Anderson HG Jr. A retrospective cohort analysis of the clinical effectiveness of a physician‐pharmacist collaborative drug therapy management diabetes clinic. Pharmacotherapy 2002;22:1294‐300. [DOI] [PubMed] [Google Scholar]
Jacobs 2005 {published data only}
- Jacobs JT. Treatment of depressive disorders in split versus integrated therapy and comparisons of prescriptive practices of psychiatrists and advanced practice registered nurses. Archives of Psychiatric Nursing 2005;19:256‐63. [DOI] [PubMed] [Google Scholar]
Jameson 2010 {published data only}
- Jameson JP, Baty PJ. Pharmacist collaborative management of poorly controlled diabetes mellitus: a randomized controlled trial. American Journal of Managed Care 2010;16:250‐5. [PubMed] [Google Scholar]
Jennings 2012 {published data only}
- Jennings BT, McAdam Marx C. Implementation of a pharmacist‐managed diabetes program. American Journal of Health‐System Pharmacy 2012;69:1951‐3. [DOI] [PubMed] [Google Scholar]
Jewell 1988 {published data only}
- Jewell D, Hope J. Evaluation of a nurse‐run hypertension clinic in general practice. Practitioner 1988;232:484‐7. [PubMed] [Google Scholar]
Jorstad 2013 {published data only}
- Jorstad H, Birgelen C, Alings AMW, Liem A, Dantzig JM, Jaarsma W, et al. Effect of a nurse‐coordinated prevention programme on cardiovascular risk after an acute coronary syndrome: main results of the RESPONSE randomised trial. Heart 2013;99:1421‐30. [DOI] [PMC free article] [PubMed] [Google Scholar]
Kinnersley 2000 {published data only}
- Kinnersley P, Anderson E, Parry K, Clement J, Archard L, Turton P, et al. Randomised controlled trial of nurse practitioner versus general practitioner care for patients requesting 'same day' consultations in primary care. BMJ 2000;320:1043‐8. [DOI] [PMC free article] [PubMed] [Google Scholar]
Krein 2004 {published data only}
- Krein SL, Klamerus ML, Vijan S, Lee JL, Fitzgerald JT, Pawlow A, et al. Case management for patients with poorly controlled diabetes: a randomized trial. American Journal of Medicine 2004;116(11):732‐9. [DOI] [PubMed] [Google Scholar]
Kwan 2007 {published data only}
- Kwan Y, Fernandes OA, Nagge JJ, Wong GG, Huh J‐H, Hurn DA, et al. Pharmacist medication assessments in a surgical preadmission clinic. Archives of Internal Medicine 2007;167:1034‐40. [DOI] [PubMed] [Google Scholar]
Lin 2012 {published data only}
- Lin HW, Lin CH, Chang CK, Yu IW, Lin CC, Li TC, et al. PHP36 Economic, clinical and humanistic outcomes of a collaborative pharmacist‐physician medication therapy management service for polypharmacy elderly. Value in Health 2012;15(4):A24. [Google Scholar]
Logan 1983 {published data only}
- Logan AG, Milne BJ, Flanagan PT, Haynes RB. Clinical effectiveness and cost‐effectiveness of monitoring blood pressure of hypertensive employees at work. Hypertension 1983;5(6):828‐36. [DOI] [PubMed] [Google Scholar]
Lowey 2007 {published data only}
- Lowey A, Moore S, Norris C, Wright D, Silock J, Hammond P. The cost‐effectiveness of a pharmacist‐led treatment of cardiac risk in patients with type 2 diabetes. Pharmacy and World Science 2007;29:541‐5. [DOI] [PubMed] [Google Scholar]
Lowrie 2012 {published data only}
- Lowrie R, Mair FS, Greenlaw N, Forsyth P, Jhund PS, McConnachie A, et al. Pharmacist intervention in primary care to improve outcomes in patients with left ventricular systolic dysfunction. European Heart Journal 2012;33:314‐24. [DOI] [PubMed] [Google Scholar]
Lowrie 2014 {published data only}
- Lowrie R, Lloyd SM, McConnachie, Morrison J. A cluster randomised controlled trial of a pharmacist‐led collaborative intervention to improve statin prescribing and attainment of cholesterol targets in primary care. PLoS One 2014;9(11):e113370. [DOI: 10.1371/journal.pone.0113370] [DOI] [PMC free article] [PubMed] [Google Scholar]
Ma 2010 {published data only}
- Ma A, Chen DM, Chau FM, Saberi P. Improving adherence and clinical outcomes through an HIV pharmacist's interventions. AIDS Care 2010;22(10):1189‐94. [DOI] [PubMed] [Google Scholar]
Martinez 2013 {published data only}
- Martinez AS, Saef J, Paszczuk A, Bhatt‐Chugani H. Implementation of a pharmacist‐managed heart failure medication titration clinic. American Journal of Health‐System Pharmacy 2013;70:1070‐6. [DOI] [PubMed] [Google Scholar]
McAdam‐Marx 2012 {published data only}
- McAdam‐Marx C, Jennings BT, Dahal A, Gunning K. Pharmacist‐led diabetes collaborative drug therapy management program improves glycemic control in patients with uncontrolled type 2 diabetes treated with insulin. Annual Meeting of the American College of Clinical Pharmacy, ACCP; 2012 Oct 21‐24: Hollywood (FL), United States. 2012.
McCord 2006 {published data only}
- McCord AD. Clinical impact of a pharmacist‐managed diabetes mellitus drug therapy management service. Pharmacotherapy 2006;26:248‐53. [DOI] [PubMed] [Google Scholar]
McFadzean 2003 {published data only}
- McFadzean E, Isles C, Moffat J, Norrie J, Stewart D. Is there a role for a prescribing pharmacist in preventing prescribing errors in a medical admission unit?. Pharmaceutical Journal 2003;270:896‐9. [Google Scholar]
McGhan 1983 {published data only}
- McGhan WF, Stimmel GL, Hall TG, Gilman TM. A comparison of pharmacists and physicians on the quality of prescribing for ambulatory hypertensive patients. Medical Care 1983;21:435‐44. [DOI] [PubMed] [Google Scholar]
McGowan 2008 {published data only}
- McGowan N, Cockburn A, Strachan MWJ, Padfield PL, McKnight JA. Initial and sustained cardiovascular risk reduction in a pharmacist‐led diabetes cardiovascular risk clinic. British Journal of Diabetes and Vascular Disease 2008;8:34‐8. [Google Scholar]
Meulepas 2008 {published data only}
- Meulepas MA, Braspenning JCC, Grauw WJ, Lucas AEM, Wijkel D, Grol RPTM. Patient‐oriented intervention in addition to centrally organised checkups improves diabetic patient outcome in primary care. Quality and Safety in Health Care 2008;17:324‐8. [DOI] [PubMed] [Google Scholar]
Michalets 2015 {published data only}
- Michalets E, Creger J, Shillinglaw WR. Outcomes of expanded use of clinical pharmacist practitioners in addition to team‐based care in a community health system intensive care unit. American Journal of Health‐System Pharmacy 2015;72:47‐53. [DOI] [PubMed] [Google Scholar]
Monyatsi 2012 {published data only}
- Monyatsi G, Mullan PC, Phelps BR, Tolle MA, Machine EM, Gennari FF, et al. HIV management by nurse prescribers compared with doctors at a paediatric centre in Gaborone, Botswana. South African Medical Journal 2012;102:34‐7. [PMC free article] [PubMed] [Google Scholar]
Morello 2013 {published data only}
- Morello CM, Bechtold A, Hirsch JD. Clinical outcomes following discharge from a pharmacist‐led diabetes intense medical management clinic. Seventy‐third Scientific Session of the American Diabetes Association; 2013 June 21‐25; Chicago (IL), United States. 2013:62‐A314.
Murphy 2010 {published data only}
- Murphy G, Daly M, Ryan J, Shanahan F, Harney S, Michael M. Comparison of physician‐and nurse prescriber‐led dose adjustment of DMARD therapy in RA. American College of Rheumatology/Association of Rheumatology Health Professionals Annual Scientific Meeting ACR/ARHP 10; 2009 Oct 16‐21; Philadelphia (PA) United States. 2010:62.
Neto 2011 {published data only}
- Neto PR, Marusic S, Lyra Junior DP, Pilger D, Cruciol‐Souza JM, et al. Effect of a 36‐month pharmaceutical care program on the coronary heart disease risk in elderly diabetic and hypertensive patients. Journal of Pharmacy & Pharmaceutical Sciences 2011;14:249‐63. [DOI] [PubMed] [Google Scholar]
Norman 2010 {published data only}
- Norman IJ, Coster S, McCrone P, Sibley A, Whittlesea C. A comparison of the clinical effectiveness and costs of mental health nurse supplementary prescribing and independent medical prescribing: a post‐test control group study. BMC Health Services Research 2010;10:4. [DOI] [PMC free article] [PubMed] [Google Scholar]
O'Hare 2004 {published data only}
- O'Hare JP, Raymond NT, Mughal S, Dodd L, Hanif W, Ahmad Y, et al. Evaluation of delivery of enhanced diabetes care to patients of South Asian ethnicity: the United Kingdom Asian Diabetes Study (UKADS). Diabetic Medicine 2004;21:1357‐65. [DOI] [PubMed] [Google Scholar]
Obreli‐Neto 2011 {published data only}
- Obreli‐Neto PR, Guidoni CM, Oliveira Baldoni A, Pilger D, Cruciol‐Souza JM, Gaeti‐Franco WP, et al. Effect of a 36‐month pharmaceutical care program on pharmacotherapy adherence in elderly diabetic and hypertensive patients. International Journal of Clinical Pharmacy 2011;33:642‐9. [DOI] [PubMed] [Google Scholar]
Omran 2013 {published data only}
- Omran D, Majumdar SR, Johnson JA, Tsuyuki RT, Lewanczuk RZ, Guirguis LM, et al. Effect of adding pharmacists to primary care teams on medication management and adherence to achieve blood pressure control in patients with type 2 diabetes. Sixteenth Annual Canadian Diabetes Association/Canadian Society of Endocrinology and Metabolism Professional Conference and Annual Meetings; 2013 Oct 17‐19; Montreal (QC) Canada. 2013:37.
Omran 2015 {published data only}
- Omran D, Majumdar SR, Johnson JA, Tsuyuki RT, Lewanczuk RZ, Guirguis LM, et al. Pharmacists on primary care team: effect on antihypertensive medication management in patients with type 2 diabetes. Journal of the American Pharmacists Association 2015;55:265‐8. [DOI] [PubMed] [Google Scholar]
Pape 2011 {published data only}
- Pape GA, Hunt JS, Butler KL, Siemienczuk J, LeBlanc BH, Gillanders W, et al. Team‐based care approach to cholesterol management in diabetes mellitus: 2‐Year cluster randomized controlled trial. Archives of Internal Medicine 2011;171:1480‐6. [DOI] [PubMed] [Google Scholar]
Payton 2011 {published data only}
- Payton H, Jaques N, Lacey F, Marriott J. Evaluating the clinical impact of a pharmacist‐led diabetes outpatient clinic. Royal Pharmaceutical Society Conference; 2011 Sept 11‐12; London, United Kingdom. 2011:19.
Reid 2005 {published data only}
- Reid F, Murray P, Storrie M. Implementation of a pharmacist‐led clinic for hypertensive patients in primary care ‐ a pilot study. Pharmacy World Science 2005;27:202‐7. [DOI] [PubMed] [Google Scholar]
Rochester 2010 {published data only}
- Rochester CD, Leon N, Dombrowski R, Haines ST. Collaborative drug therapy management for initiating and adjusting insulin therapy in patients with type 2 diabetes mellitus. American Journal of Health‐System Pharmacy 2010;67:42‐8. [DOI] [PubMed] [Google Scholar]
Rothman 2005 {published data only}
- Rothman RL, Malone R, Bryant B, Shintani AK, Crigler B, Dewait DA, et al. A randomized trial of a primary care‐based disease management program to improve cardiovascular risk factors and glycated hemoglobin levels in patients with diabetes. American Journal of Medicine 2005;118:276‐84. [DOI] [PubMed] [Google Scholar]
Rudd 2010 {published data only}
- Rudd KM, Dier JG. Comparison of two different models of anticoagulation management services with usual medical care. Pharmacotherapy 2010;30(4):330‐8. [DOI] [PubMed] [Google Scholar]
Sadik 2005 {published data only}
- Sadik A, Yousif M, McElnay JC. Pharmaceutical care of patients with heart failure. British Journal of Clinical Pharmacology 2005;60:183‐93. [DOI] [PMC free article] [PubMed] [Google Scholar]
Samtia 2013 {published data only}
- Samtia AM, Rasool MF, Ranjha NM, Usman F, Javed I. A multifactorial intervention to enhance adherence to medications and disease‐related knowledge in type 2 diabetic patients in Southern Punjab, Pakistan. Tropical Journal of Pharmaceutical Research 2013;12:851‐6. [Google Scholar]
Sanne 2010 {published data only}
- Sanne I, Orrell C, Fox MP, Conradie F, Ive P, Zeinecker J, et al. Nurse versus doctor management of HIV‐infected patients receiving antiretroviral therapy (CIPRA‐SA): a randomised non‐inferiority trial. Lancet 2010;376:33‐40. [DOI] [PMC free article] [PubMed] [Google Scholar]
Schneider 1982 {published data only}
- Schneider PJ, Larrimer JN, Visconti JA, Miller WA. Role effectiveness of a pharmacist in the maintenance of patients with hypertension and congestive heart failure. Contemporary Pharmacy Practice 1982;5:74‐9. [PubMed] [Google Scholar]
Scullin 2007 {published data only}
- Scullin C, Scott MG, Hogg A, McElnay JC. An innovative approach to integrated medicines management. Journal of Evaluation in Clinical Practice 2007;13:781‐8. [DOI] [PubMed] [Google Scholar]
Sease 2011 {published data only}
- Sease JM, Blake EW, Gowan M, Shealy KM. Evaluation of anticoagulation management and chronic disease state control in a pharmacist‐run pharmacotherapy/anticoagulation clinic. Journal of Pharmacy Technology 2011;27:3‐8. [Google Scholar]
Seng 2011 {published data only}
- Seng Tan P, Thomas PT, Chua SS. Clinical outcomes of pharmacist‐managed diabetes clinic in Malaysia. Seventy‐first Scientific Sessions of the American Diabetes Association; 2011 June 24‐28; San Diego (CA), United States. 2011:60.
Shum 2000 {published data only}
- Shum C, Humphreys A, Wheeler D, Cochrane M‐A, Skoda S, Clement S. Nurse management of patients with minor illnesses in general practice: multicentre, randomised controlled trial. BMJ 2000;320:1038‐43. [DOI] [PMC free article] [PubMed] [Google Scholar]
Simpson 2011 {published data only}
- Simpson SH, Lewanczuk RZ, Majumdar SR, Spooner R, Tsuyuki RT, Johnson JA. Effect of adding pharmacists to primary care teams on blood pressure control in patients with type 2 diabetes. Diabetes Care 2011;34:20‐6. [DOI] [PMC free article] [PubMed] [Google Scholar]
Sisk 2006 {published data only}
- Sisk JE, Hebert PL, Horowitz CR, McLaughlin MA, Wang JJ, Chassin MR. Effects of nurse management on the quality of heart failure care in minority communities. Annals of Internal Medicine 2006;145:273‐83. [DOI] [PMC free article] [PubMed] [Google Scholar]
Solomon 1998 {published data only}
- Solomon DK, Portner TS, Bass GE, Gourley DR, Gourley GA, Holt JM, et al. Clinical and economic outcomes in the hypertension and COPD arms of a multicenter outcomes study. Journal of the American Pharmaceutical Association 1998;38:574‐85. [DOI] [PubMed] [Google Scholar]
Sonnex 2014 {published data only}
- Sonnex K, Murphy A. Pharmacist inclusion in the multi‐disciplinary team reduces hospital admissions due to COPD exacerbations. Health Services Research and Pharmacy Practice Conference, HSRPP; April 3‐4; Aberdeen, United Kingdom. 2014:22.
Stafford 2011 {published data only}
- Stafford L, Peterson GM, Bereznicki LRE, Jackson SL. Clinical outcomes of a pharmacist‐led post‐discharge warfarin management service. Eleventh National Conference on Anticoagulant Therapy; 2011 May 5‐7; Boston (MA), United States. 2011:31.
Stone 2010 {published data only}
- Stone RA, Rao RH, Sevick MA, Cheng C, Hough LJ, Macpherson DS, et al. Active care management supported by home telemonitoring in veterans with type 2 diabetes. Diabetes Care 2010;33(3):478‐84. [DOI] [PMC free article] [PubMed] [Google Scholar]
Stromberg 2003 {published data only}
- Stromberg A, Martensson J, Fridlund B, Levin L‐A, Karlsson JE, Dahlstrom U. Nurse‐led heart failure clinics improve survival and self‐care behaviour in patients with heart failure: results from a prospective, randomised trial. European Heart Journal 2003;24:1014‐23. [DOI: 10.1016/SO195-668X(03)00112-X] [DOI] [PubMed] [Google Scholar]
Tahaineh 2011 {published data only}
- Tahaineh L, Albsoul‐Younes A, Al‐Ashqar E, Habeb A. The role of a clinical pharmacist on lipid control in dyslipidemic patients in North of Jordon. International Journal of Clinical Pharmacy 2011;33:229‐36. [DOI] [PubMed] [Google Scholar]
Taveira 2006 {published data only}
- Taveira TH, Wu WC, Martin OJ, Schleinitz MD, Friedmann P, Sharma SC. Pharmacist‐led cardiac risk reduction model. Preventive Cardiology 2006;9:202‐8. [DOI] [PubMed] [Google Scholar]
Till 2003 {published data only}
- Till LT, Voris JC, Horst JB. Assessment of clinical pharmacist management of lipid‐lowering therapy in a primary care setting. Journal of Managed Care Pharmacy 2003;9:269‐73. [DOI] [PMC free article] [PubMed] [Google Scholar]
To 2011 {published data only}
- To L, Schillig JM, DeSmet BD, Kuriakose P, Szandzik EG, Kalus JS. Impact of a pharmacist‐directed anticoagulation service on the quality and safety of heparin‐induced thromobocytopenia management. Annals of Pharmacotherapy 2011;45:195‐200. [DOI] [PubMed] [Google Scholar]
Vaisberg 2013 {published data only}
- Vaisberg E, Moreno G, Tseng CH, Bell D, Clarke R, Wong S, et al. Managing your medication for education and daily support: The value of a clinical pharmacist in primary care practices to improve diabetes care. Thirty‐sixth Annual Meeting of the Society of General Internal Medicine, SGIM; 2013 April 24‐27; Denver (CO), United States. 2013:28‐S119.
Vasileff 2009 {published data only}
- Vasileff HM, Whitten LE, Pink JA, Goldsworthy SJ, Angley MT. The effect on medication errors of pharmacists charting medication in an emergency department. Pharmacy and World Science 2009;31:373‐9. [DOI] [PubMed] [Google Scholar]
Venning 2000 {published data only}
- Venning P, Durie A, Roland M, Roberts C, Leese B. Randomised controlled trial comparing cost effectiveness of general practitioners and nurse practitioners in primary care. BMJ (Clinical Research Ed) 2000;320:1048‐53. [DOI] [PMC free article] [PubMed] [Google Scholar]
Verret 2012 {published data only}
- Verret L, Couturier J, Rozon A, Saudrais‐Janecek S, St‐Onge A, Nguyen A, et al. Impact of a pharmacist‐led warfarin self‐management program on quality of life and anticoagulation control: a randomized trial. Pharmacotherapy 2012;32:871‐9. [DOI] [PubMed] [Google Scholar]
Voogdt‐Pruis 2011 {published data only}
- Voogdt‐Pruis HR, Ree JW, Gorgels AP, Beusmans GH. Adherence to a guideline on cardiovascular prevention: A comparison between general practitioners and practice nurses. International Journal of Nursing Studies 2011;48:798‐807. [DOI] [PubMed] [Google Scholar]
Warrington 2012 {published data only}
- Warrington L, Ayers P, Baldwin AM, Wallace V, Riche KD, Saulters R, et al. Implementation of a pharmacist‐led, multidisciplinary diabetes management team. American Journal of Health‐System Pharmacy 2012;69:1240‐5. [DOI] [PubMed] [Google Scholar]
Weigel 2012 {published data only}
- Weigel R, Feldacker C, Tweya H, Chiwoko J, Gumulira J, Phiri S. Nurse‐led antiretroviral treatment for HIV infected children: A comparative study from Lilongwe, Malawi. Annual Conference of the Royal College of Paediatrics and Child Health, RCPCH; 2012 May 22‐24; Glasgow, United Kingdom. 2012:97‐A45.
Wilson 2003 {published data only}
- Wilson SJ‐A, Wells PS, Kovacs MJ, Lewis GM, Martin J, Burton E, et al. Comparing the quality of oral anticoagulant management by anticoagulation clinics and by family physicians: A randomised controlled trial. Canadian Medical Association Journal 2003;169(4):293‐8. [PMC free article] [PubMed] [Google Scholar]
Wittayanukorn 2013 {published data only}
- Wittayanukorn S, Westrick SC, Hansen RA, Billor N, Braxton‐Lloyd K, Fox BI, et al. Evaluation of medication therapy management services for patients with cardiovascular disease in a self‐insured employer health plan. Journal of Managed Care Pharmacy 2013;19:385‐95. [DOI] [PMC free article] [PubMed] [Google Scholar]
Wood 2008 {published data only}
- Wood DA, Kotseva K, Connolly S, Jennings C, Mead A, Jones J, et al. Nurse‐coordinated multidisciplinary, family‐based cardiovascular disease prevention programme for patients with coronary heart disease and asymptomatic individuals at high risk of cardiovascular disease: a paired, cluster‐randomised controlled trial. Lancet 2008;371(9629):1999‐2012. [DOI] [PubMed] [Google Scholar]
Zimmerman 2014 {published data only}
- Zimmerman AW, Morello CM, Hirsch JD. Cost avoidance associated with a pharmacist‐CDE led diabetes intense medical management and education clinic. Seventy‐fourth Scientific Sessions of the American Diabetes Association; 2014 June 13‐17; San Francisco (CA), United States. 2014:63.
References to studies awaiting assessment
Barton 2013 {published data only}
- Barton GR, Fairall L, Bachmann MO, Uebel K, Timmerman V, Lombard C, et al. Cost‐effectiveness of nurse‐led versus doctor‐led antiretroviral treatment in South Africa: pragmatic cluster randomised trial. Tropical Medicine and International Health 2013;18(6):769‐77. [DOI] [PubMed] [Google Scholar]
Neilson 2015 {published data only}
- Neilson AR, Bruhn H, Bond CM, Elliott AM, Smith BH, Hannaford PC, et al. Pharmacist‐led management of chronic pain in primary care: costs and benefits in a pilot randomised controlled trial. BML Open 2015;5:e006874. [DOI: 10.1136/bmjopen-2014-006874] [DOI] [PMC free article] [PubMed] [Google Scholar]
Tsuyuki 2014 {published data only}
- Tsuyuki RT, Rosenthal MM, Pearson GJ. Improving dyslipidemia management in the community: A randomized trial of pharmacist prescribing, The RxACT study. Canadian Journal of Cardiology 2014;30(10):S118‐9. [DOI] [PMC free article] [PubMed] [Google Scholar]
References to ongoing studies
Mikuls 2015 {published data only}
- Mikuls TR, Cheetham TC, Rashid N, Levy GD, Kerimian A, Low KJ, et al. A pragmatic cluster‐randomized controlled trial of an automated, pharmacy‐based intervention to optimize allopurinol therapy in gout. Arthritis and Rheumatology 2015;67:Suppl 10. [Google Scholar]
Additional references
Atkins 2004
- Atkins D, Best D, Briss PA, Eccles M, Falck‐Ytter Y, Flottorp Y, et al. GRADE Working Group. Grading quality of evidence and strength of recommendations. BMJ 2004;328(7454):1490. [DOI] [PMC free article] [PubMed] [Google Scholar]
Bhanbhro 2011
- Bhanbhro S, Drennan VM, Grant R, Harrios R. Assessing the contribution of prescribing in primary care by nurses and professionals allied to medicine: a systematic review of literature. BMC Health Services Research 2011;11:330. [DOI] [PMC free article] [PubMed] [Google Scholar]
Bissell 2008
- Bissell P, Cooper R, Guillaume L, Anderson C, Avery A, Hutchinson A, et al. An evaluation of supplementary prescribing in nursing and pharmacy. Final report for the Department of Health. Research Report. University of Sheffield. www.shef.ac.uk/polopoly_fs/1.43225!/file/Supplementary_prescribing.pdf (accessed 3 November 2012).
Clark 2010
- Clark CE, Smith LFP, Taylor RS, Campbell JL. Nurse led interventions to improve control of blood pressure in people with hypertension: systematic review and meta‐analysis. BMJ 2010;341:c3995. [DOI: 10.1136/bmj.c3995] [DOI] [PMC free article] [PubMed] [Google Scholar]
Cochrane EPOC Group 2013a
- Cochrane Effective Practice and Organisation of Care Group. Cochrane Effective Practice and Organisation of Care (EPOC). Data collection form. EPOC Resources for review authors. Oslo: Norwegian Knowledge Centre for the Health Services; 2013. epoc.cochrane.org/sites/epoc.cochrane.org/files/uploads/13%20Data%20extraction%20and%20management%202013%2008%2012_1.pdf (accessed prior to 21 September 2016).
Cochrane EPOC Group 2013b
- Cochrane Effective Practice and Organisation of Care Group. Effective Practice and Organisation of Care (EPOC). Data extraction and management. EPOC Resources for review authors. Oslo: Norwegian Knowledge Centre for the Health Services; 2013. epoc.cochrane.org/sites/epoc.cochrane.org/files/uploads/13%20Data%20extraction%20and%20management%202013%2008%2012_1.pdf (accessed prior to 21 September 2016).
Cochrane EPOC Group 2015
- Cochrane Effective Practice and Organisation of Care Group. Effective Practice and Organisation of Care (EPOC). Suggested risk of bias criteria for EPOC reviews. EPOC Resources for review authors. Oslo: Norwegian Knowledge Centre for the Health Services; 2015. epoc.cochrane.org/sites/epoc.cochrane.org/files/uploads/14%20Suggested%20risk%20of%20bias%20criteria%20for%20EPOC%20reviews%202015%2009%2002.pdf (accessed prior to 21 September 2016).
Cooper 2008
- Cooper R, Guillaume L, Avery T, Anderson C, Bissell P, Hutchinson A, et al. Nonmedical prescribing in the United Kingdom Development and stakeholder Interests. Journal of Ambulatory Care Management 2008;31(3):244‐52. [DOI] [PubMed] [Google Scholar]
Department of Health 1999
- Department of Health. Review of prescribing, supply and administration of medicines (the Crown Report). webarchive.nationalarchives.gov.uk/20130107105354/http:/www.dh.gov.uk/prod_consum_dh/groups/dh_digitalassets/@dh/@en/documents/digitalasset/dh_4077153.pdf (accessed 3 November 2012).
Department of Health 2003
- Department of Health. Supplementary prescribing by nurses and pharmacists within the NHS in England. A guide for implementation. webarchive.nationalarchives.gov.uk/+/www.dh.gov.uk/en/Publicationsandstatistics/Publications/PublicationsPolicyAndGuidance/DH_4009717 (accessed 3 November 2012).
Department of Health 2006
- Department of Health. Improving patients' access to medicines: A guide to implementing nurse and pharmacist independent prescribing within the NHS in England. April 2006. webarchive.nationalarchives.gov.uk/+/www.dh.gov.uk/en/PublicationsandStatistics/Publications/PublicationsPolicyandGuidance/DH_4133743 (accessed 3 November 2012).
Driscoll 2015
- Driscoll A, Currey J, Tonkin A, Krum H. Nurse‐led titration of angiotensin converting enzyme inhibitors, beta‐adrenergic blocking agents, and angiotensin receptor blockers for people with heart failure with reduced ejection fraction. Cochrane Database of Systematic Reviews 2015, Issue 12. [DOI: 10.1002/14651858.CD009889.pub2] [DOI] [PMC free article] [PubMed] [Google Scholar]
Duckett 2005
- Duckett S. Health workforce design for the 21st century. Australian Health Review 2005;29(2):201‐10. [DOI] [PubMed] [Google Scholar]
Ellis 2006
- Ellis N, Robinson L, Brooks P. Task substitution: where to from here?. Medical Journal of Australia 2006;185(1):18‐9. [DOI] [PubMed] [Google Scholar]
Gielen 2014
- Gielen SC, Dekker J, Franke AL, Mistiaen P, Kroezen M. The effects of nurse prescribing: A systematic review. International Journal of Nusring Studies 2014;51:1048‐61. [DOI] [PubMed] [Google Scholar]
Glenton 2013
- Glenton C, Colvin CJ, Carlsen B, Swartz A, Lewin S, Noyes J, et al. Barriers and facilitators to the implementation of lay health worker programmes to improve access to maternal and child health: qualitative evidence synthesis. Cochrane Database of Systematic Reviews 2013, Issue 10. [DOI: 10.1002/14651858.CD010414.pub2] [DOI] [PMC free article] [PubMed] [Google Scholar]
Glynn 2010
- Glynn LG, Murphy AW, Smith SM, Schroeder K, Fahey T. Interventions used to improve control of blood pressure in patients with hypertension. Cochrane Database of Systematic Reviews 2010, Issue 3. [DOI: 10.1002/14651858.CD005182.pub4] [DOI] [PubMed] [Google Scholar]
GRADEpro GDT 2014 [Computer program]
- GRADE Working Group, McMaster University. GRADEpro GDT. Version accessed 1 August 2015. Hamilton (ON): GRADE Working Group, McMaster University, 2014.
Greer 2016
Health Workforce Australia 2013
- Health Workforce Australia. Health Professionals prescribing Pathway (HPPP) Project ‐Final Report. www.healthinfonet.ecu.edu.au/key‐resources/bibliography/?lid=26503 (accessed 30 November 2016).
Higgins 2011
- Higgins JP, Green S, editor(s). Cochrane Handbook for Systematic Reviews of Interventions Version 5.1.0 (updated March 2011). The Cochrane Collaboration, 2011. Available from handbook.cochrane.org.
Home Office 2012
- Home Office. Circular: nurse and pharmacist independent prescribing, 'mixing of medicines', possession authorities under patient group directions and personal exemption provisions for Schedule 4 Part II drugs. Home Office circular 009/2012. www.gov.uk/government/publications/nurse‐and‐pharmacist‐independent‐prescribing‐mixing‐of‐medicines‐possession‐authorities‐under‐patient‐group‐directions‐and‐personal‐exemption‐provisions‐for‐schedule‐4‐part‐ii‐drugs (accessed 12 January 2013).
Hooker 2006
- Hooker R. Physician assistants and nurse practitioners: the United States experience. Medical Journal of Australia 2006;185(1):4‐7. [DOI] [PubMed] [Google Scholar]
HWA 2013
- Health Workforce Australia 2013. Health Professionals Prescribing Pathway (HPPP) Project ‐ Final Report. www.healthinfonet.ecu.edu.au/key‐resources/bibliography/?lid=26503 (accessed 12 February 2014).
Hypertension 1979
- Hypertension Detection and Follow‐up Program Cooperative Group. Therapeutic control of blood pressure in the Hypertension Detection and Follow‐up Program. Hypertension Detection and Follow‐up Program Cooperative Group. Preventive Medicine 1979;8(1):2‐13. [DOI] [PubMed] [Google Scholar]
Kay 2004
- Kay OC, Brien JE. Pharmacist prescribing: review of the literature. Journal of Pharmacy Practice and Research 2004;34:300‐4. [Google Scholar]
Latter 2010
- Latter S, Blenkinsopp A, Smith A, Chapman S, Tinelli M, Gerard K, et al. Evaluation of nurse and pharmacist independent prescribing. Department of Health Policy Research Programme Project 016 0108. University of Southampton; Keele University, on behalf of Department of Health. www.eprints.soton.ac.uk/184777/ (accessed 3 November 2012).
Laurant 2005
- Laurant M, Reeves D, Hermens R, Braspenning J, Grol R, Sibbald B. Substitution of doctors by nurses in primary care. Cochrane Database of Systematic Reviews 2005, Issue 2. [DOI: 10.1002/14651858.CD001271.pub2] [DOI] [PubMed] [Google Scholar]
Law 2012
- Law M, Ma T, Fisher J, Sketris I. Independent pharmacist prescribing in Canada. Canadian Pharmacists Journal 2012;145(1):17‐23. [DOI] [PMC free article] [PubMed] [Google Scholar]
Law 2013
- Law AV, Gupta EK, Hess KM, Klotz RS, Le QA, Schwartzman E, et al. Collaborative pharmacy practice: an update. Integrated Pharmacy Research Practice 2013;2:1‐16. [Google Scholar]
Machado 2007
- Machado M, Bajcar J, Guzzo G, Einarson TR. Sensitivity of patient outcomes to pharmacist interventions. Part 11: Systematic review and meta‐analysis in hypertension management. Annals of Pharmacotherapy 2007;41(11):1770‐81. [DOI] [PubMed] [Google Scholar]
Moher 2009
- Moher D, Liberati A, Tetzlaff J, Altman DG, The PRISMA Group. Preferred reporting items for systematic reviews and meta‐analyses: The PRISMA Statement. BMJ 2009;339:2535. [PMC free article] [PubMed] [Google Scholar]
Nkansah 2010
- Nkansah N, Mostovetsky O, Yu C, Chheng T, Beney J, Bond CM, et al. Effect of outpatient pharmacists' non‐dispensing roles on patient outcomes and prescribing patterns. Cochrane Database of Systematic Reviews 2010, Issue 7. [DOI: 10.1002/14651858.CD000336.pub2] [DOI] [PMC free article] [PubMed] [Google Scholar]
NPC 2012
- National Prescribing Centre, National Institute for Health and Clinical Excellence. A single competency framework for all prescribers. www.associationforprescribers.org.uk/images/Single_Competency_Framework.pdf (accessed 30 October 2016).
NPS 2012
- National Prescribing Service MedicineWise. NPS: Better choices, Better health. Competencies required to prescribe medicines: putting quality use of medicines into practice. www.nps.org.au/__data/assets/pdf_file/0004/149719/Prescribing_Competencies_Framework.pdf (accessed 12 December 2012).
Pande 2013
- Pande S, Hiller JE, Nkansah N, Bero L. The effect of pharmacist‐provided non‐dispensing services on patient outcomes, health service utilisation and costs in low‐ and middle‐income countries. Cochrane Database of Systematic Reviews 2013, Issue 2. [DOI: 10.1002/14651858.CD010398] [DOI] [PMC free article] [PubMed] [Google Scholar]
Pharmacy Council NZ 2013
- Pharmacy Council of New Zealand. Pharmacist Prescribers. www.pharmacycouncil.org.nz/cms_display.php?sn=225&st=1&pg=1863 (accessed 26 December 2013).
Phillips 2008
- Phillips PA, Hughes CF. Clinical process redesign ‐ can the leopard change its spots?. Medical Journal of Australia 2008;188:S7‐8. [DOI] [PubMed] [Google Scholar]
RevMan 2014 [Computer program]
- Nordic Cochrane Centre, The Cochrane Collaboration. Review Manager 5 (RevMan 5). Version 5.3. Copenhagen: Nordic Cochrane Centre, The Cochrane Collaboration, 2014.
Santschi 2014
- Santschi V, Chiolero A, Colosimo AL, Platt RW, Taffe P, Burnier M, et al. Improving blood pressure control through pharmacist interventions: A meta‐analysis of randomized controlled trials. Journal of the American Heart Association 2014;3(2):e000718. [DOI: 10.1161/JAHA.113.000718] [DOI] [PMC free article] [PubMed] [Google Scholar]
Shaw 2014
- Shaw RJ, McDuffie JR, Hendrix CC, Edie A, Lindsey‐Davis L, Nagi A, et al. Effects of nurse‐managed protocols in the outpatient management of adults with chronic conditions. Annals of Internal Medicine 2014;161:113‐21. [DOI: 10.7326/M13-2567] [DOI] [PubMed] [Google Scholar]
Stewart 2010
- Stewart D, Cunningham S, Diack L, McCaig D, MacLure K, Bond C, et al. Prescribing Research Group, NHS Education for Scotland. Report: Exploring and evaluating pharmacist prescribing. www.openair.rgu.ac.uk/handle/10059/1939 (accessed 12 Jan 2013).
Thomas 2006
- Thomas J, Murtuza B, Lin Shu‐Wen, Yogesh P. Survey of pharmacist collaborative drug therapy management in hospitals. American Journal of Health‐System Pharmacy 2006;63:2489‐99. [DOI] [PubMed] [Google Scholar]
Tonna 2007
- Tonna AP, Stewart D, West B, McCaig D. Pharmacist prescribing in the UK ‐ a literature review of current practice and research. Journal of Clinical Pharmacy and Therapeutics 2007;32(6):545‐56. [DOI] [PubMed] [Google Scholar]
Weeks 2008
- Weeks GR, Marriott JL. Collaborative prescribing: Views of SHPA pharmacist members. Journal of Pharmacy Practice and Research 2008;38:271‐5. [Google Scholar]
Wheeler 2012
- Wheeler A, Crump K, Lee M, Li L, Patel A, Yang R, et al. Collaborative prescribing: a qualitative exploration of a role for pharmacists in mental health. Research in Social and Administrative Pharmacy 2012;8(3):179‐92. [DOI] [PubMed] [Google Scholar]
WHO 2012
- World Health Organization. World Health Statistics 2012. www.who.int/gho/publications/world_health_statistics/EN_WHS2012_Full.pdf. France, (accessed 10 Feb 2013).
Yuksel 2008
- Yuksel N, Eberhart G, Bungard TJ. Prescribing by pharmacists in Alberta. American Journal of Health‐System Pharmacy 2008;65:2126‐32. [DOI] [PubMed] [Google Scholar]
References to other published versions of this review
Weeks 2014
- Weeks G, George J, Maclure K, Stewart D. Non‐medical prescribing versus medical prescribing for acute and chronic disease management in primary and secondary care. Cochrane Database of Systematic Reviews 2014, Issue 7. [DOI: 10.1002/14651858.CD011227] [DOI] [PMC free article] [PubMed] [Google Scholar]