

SUMMARY
Optimal cell performance depends on cell size and the appropriate relative size, i.e. scaling, of the nucleus. How nuclear scaling is regulated and contributes to cell function is poorly understood, especially in skeletal muscle fibers, which are among the largest cells, containing hundreds of nuclei. Here we present a Drosophila in vivo system to analyze nuclear scaling in whole multinucleated muscle fibers, genetically manipulate individual components, and assess muscle function. Despite precise global coordination, we find that individual nuclei within a myofiber establish different local scaling relationships by adjusting their size and synthetic activity in correlation with positional/spatial cues. While myonuclei exhibit compensatory potential, even minor changes in global nuclear size scaling correlate with reduced muscle function. Our study provides the first comprehensive approach to unraveling the intrinsic regulation of size in multinucleated muscle fibers. These insights to muscle cell biology will accelerate the development of interventions for muscle diseases.
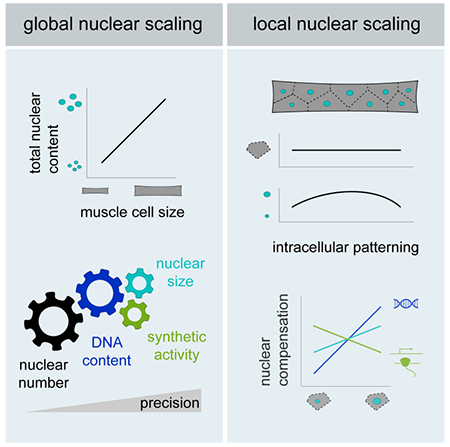
Graphical Abstract
eTOC Blurb
Muscle fibers are large multinucleated cells with remarkable size plasticity. Windner et al. investigate the relationship between muscle cell size and nuclear content. They show that cells contain a heterogeneous population of nuclei and explore mechanisms of nuclear coordination, as well as the functional consequences of scaling perturbations.
INTRODUCTION
The physical dimensions of a cell and the appropriate relative size of its organelles are essential for cell structure and function. Cell size and intracellular scaling relationships are established and actively maintained in a cell type-specific manner by integrating both extrinsic and intrinsic signals. Extrinsic size regulation includes systemic factors like nutrition, Insulin signaling, and hormones, which determine organ and overall body size by regulating cell numbers and sizes (Boulan et al., 2015; Penzo-Mendez and Stanger, 2015). Intrinsically, individual cells continuously assess their size in relation to their target size and adjust their growth and synthetic activity rates to optimize cell function (Amodeo and Skotheim, 2016; Chan and Marshall, 2012; Ginzberg et al., 2015). While the molecular mechanisms of systemic cell size regulation are rather well-characterized, less is known about the intrinsic side.
Intrinsic regulators of cell size include DNA content, nuclear size, and nuclear activity (Frawley and Orr-Weaver, 2015; Miettinen et al., 2014; Mukherjee et al., 2016). The amount of nuclear DNA shows a coarse correlation with cell size (e.g. diploid cardiomyocytes are smaller than polyploid ones); however, different diploid cell types within the same organism establish a wide variety of cell and nuclear sizes (Gillooly et al., 2015). In contrast, each cell type can be characterized by a specific ratio of nuclear to cytoplasmic volume (nuclear size scaling) (Conklin, 1912). The precise regulation of nuclear size affects DNA organization, transcriptional and translational processes, nuclear import and export, and transport/diffusion of products throughout the cytoplasm (Levy and Heald, 2012). Further, nuclear size scaling determines the concentration of nucleolar components inside the nucleus, which regulates the size of the nucleolus (Weber and Brangwynne, 2015). Nucleolar size closely correlates with Pol I transcription activity and ribosome biogenesis, and plays a crucial role in cell growth and size control (Brangwynne, 2013; Neumuller et al., 2013; Rudra and Warner, 2004). Studies using a variety of systems have indicated that size regulation of the nucleolus via nuclear size scaling could represent a crucial mechanism that couples cell size with nuclear synthesis and growth rates (Eaton et al., 2011; Ma et al., 2016). Thus, changes in nuclear and nucleolar size scaling provide information about the cell state, especially its synthetic activities and the metabolic demands of the cell. While nuclear and nucleolar sizes are routinely used as diagnostic indicator for a variety of disease states (Jevtić and Levy, 2014), the mechanisms that coordinate different cellular components and activities to establish and maintain specific cell sizes remain largely elusive.
Skeletal muscle fibers are one of the largest cell types and possess remarkable cell size plasticity. Individual cells develop and grow by fusion of myoblasts and can contain hundreds of nuclei distributed across the cell surface (Deng et al., 2017). Based on the limited synthetic capacity of a single nucleus and the physical limitations to cellular transport and diffusion, a longstanding hypothesis (known as myonuclear domain hypothesis) postulates that, each nucleus in a muscle syncytium only supplies its immediately surrounding cytoplasm with gene products (Hall and Ralston, 1989; Pavlath et al., 1989). Accordingly, studies using different model systems have suggested that muscle nuclei are positioned to minimize transport distances throughout the cytoplasm (Bruusgaard et al., 2003; Manhart et al., 2018). Across species, the number of myonuclei is considered the main determinant of overall muscle cell size, however, nuclear numbers vary depending on factors like muscle fiber type, activity, or age, indicating that the average size of the cytoplasmic domain associated with each nucleus is highly variable (Van der Meer et al., 2011). Further, differences exist within a muscle fiber in nuclear density and/or gene expression, particularly in nuclei adjacent to specialized sub-cellular structures like muscle attachment sites (myotendinous junctions, MTJs) and the motoneuron synapse (neuromuscular junction, NMJ) (Bruusgaard et al., 2003; B. Rosser and Bandman, 2003). While this suggests that muscle nuclei can adjust their synthetic activity dependent on cell size and functional demands (K. Gundersen, 2016; Murach et al., 2018a), it is still not clear how the contribution of individual nuclei to cell size is coordinated in a shared cytoplasmic space and whether nuclear size scaling plays a role in regulating muscle fiber size.
Diseases of the skeletal musculature are commonly associated with changes in nuclear positioning, nuclear sizes, and nuclear activities (Folker and Baylies, 2013; Malfatti and Romero, 2017; Schreiber and Kennedy, 2013), but how different muscle phenotypes result in reduced muscle function remains poorly understood. The size and the complexity of muscle tissue in vertebrates impose technical challenges that limit studies on fiber size and intracellular organization to tissue cross-sections or in vitro approaches. To provide a more comprehensive understanding of nuclear scaling relationships and the intrinsic regulation of cell size in multinucleated muscle fibers, we have developed a Drosophila in vivo system to quantify cell and nuclear parameters in fully differentiated muscle cells, genetically manipulate individual cellular components, and evaluate muscle function. This system allowed us to analyze nuclear scaling relationships on a global level (scaling of the cumulative nuclear content with total cell size) and a local level (scaling of individual nuclei with their surrounding cytoplasmic domain) and identify possible mechanisms of nuclear coordination and compensation within individual muscle fibers.
RESULTS
Drosophila larval body wall muscles allow for 2D quantification of cell and nuclear sizes
The body wall musculature of the Drosophila larva is a well-established system to investigate fundamental aspects of muscle cell biology in vivo (Demontis et al., 2013; Deng et al., 2017; Keshishian et al., 2003; Piccirillo et al., 2014). The musculature is comprised of 30 different muscles, which are arranged in the same stereotyped pattern in every abdominal hemisegment (Schulman et al., 2015). Each of these glycolytic muscles consists of only one multinucleated cell with distinct size, shape, and attachment sites, and is easily accessible in live or dissected preparations (Dobi et al., 2015). Here we focused on two muscles, Ventral Longitudinal muscles VL3 and VL4 (also known as muscles 6 and 7), which are flat rectangular cells with disc-shaped nuclei located on only one cell surface (Figures 1A and 1B). We compared 2D and 3D quantification of cell and nuclear sizes and found that volumes and areas are proportional due to the minimal and very consistent depth of VL muscle cells and nuclei. (Figures 1C-E and S1A-B). Thus, this system allows for accurate quantification of the size of whole muscle cells and their nuclei on z-projections of confocal stacks.
Figure 1. Quantification of cell and nuclear sizes in Drosophila larval body wall muscles.
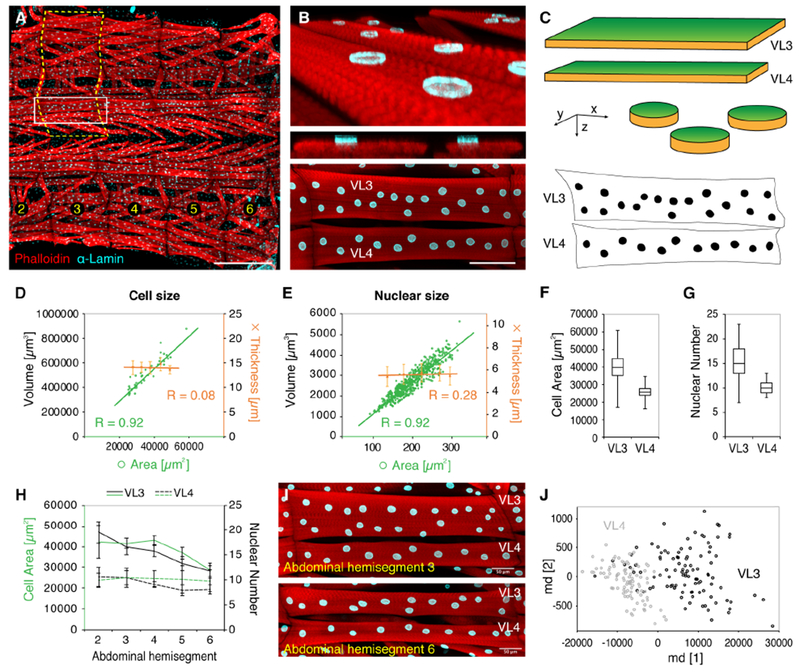
(A) Third instar Drosophila larval preparation showing skeletal muscles (red, phalloidin) and nuclei (cyan, α-Lamin) in bilateral abdominal hemisegments 2-6; anterior, left. Dashed line indicates one abdominal hemisegment; white box indicates Ventral Longitudinal (VL) muscles 3 and 4.
(B) 3D rendering (top), optical cross section (middle), and flattened confocal z-stack (bottom) of VL3 and VL4 muscles.
(C) Schematics of the geometric shapes of VL muscle cells (top) and nuclei (middle). Green areas are quantified after z-projection of confocal stacks. Bottom, binary image of VL muscles and nuclei shown in Figure 1B.
(D,E) Scatter plots comparing volume and thickness (orange) measurements with the area (green) of individual VL muscle cells (D) and nuclei (E). Linear regression curves and correlations coefficients (R) are indicated, error bars show standard deviation. n (cells) = 42, n (nuclei) = 572.
(F,G) Median VL3 and VL4 cell areas (F) and nuclear numbers (G). Boxes, 25/75 percentiles; whiskers, min/max values. nVL3 = 102, nVL4= 97. p<0.0001 (Student’s t test).
(H) VL3 (solid lines) and VL4 (dashed lines) muscle area (green) and nuclear number (black) plotted against the corresponding abdominal hemisegment of the larvae. Lines represent mean values; error bars show standard deviation. nVL3 = 102, nVL4 = 97.
(I) VL3 and VL4 muscles from different hemisegments within the same larva.
(J) Unsupervised multidimensional cluster analysis of VL muscles from 3 different genetic control backgrounds (w1118, Dmef2-GAL4; UAS-2xEGFP, Dmef2-GAL4;UAS-GFP RNAi, two experimental replicates each) using the following parameters: cell size, cell shape (aspect ratio), nuclear number, total nuclear area, axis level (abdominal hemisegment number). VL3 (black) and VL4 (gray) muscles form separate clusters with little overlap. See also Figure S1A. nVL3 = 102, nVL4 = 97.
Scale bars, 500 μm (A), 100μm (B), 50μm (I).
To assess the full range of VL muscle sizes at the end of larval development, we used carefully staged third instar larvae from three genetic control backgrounds (see Methods) and quantified VL3 and VL4 muscles at different positions along the anterior-posterior axis of each larva (abdominal hemisegments 2-6). On average, VL3 muscles were 65% bigger than VL4 muscles, with comparable sizes across individual larvae and genotypes (mean VL3: 39767 μm2, 15 nuclei; mean VL4: 25633 μm2, 10 nuclei; Figures 1F and 1G). Within each larva, VL3 muscle sizes and the cumulative area of the nuclei within each cell were significantly bigger in the anterior hemisegments 2-4 and approximated the size of VL4 muscles in more posterior hemisegments (Figure 1H, 1I and S1C). In contrast, VL4 cell and cumulative nuclear size were consistent along the anterior-posterior axis of the larvae (Figure 1H and S1C). In both VL muscles, the average number of nuclei per cell decreased from anterior to posterior (Figure S1C). Together, VL3 and VL4 muscles provided a significantly different, but overlapping, range of cell sizes and nuclear numbers. The different relationships of cell size parameters and nuclear number along the larval body axis further indicated that the number of nuclei may not be the best indicator for muscle cell size in VL muscle fibers.
To further validate our dataset, we performed unsupervised cluster analysis using the following parameters: cell area, cell shape (aspect ratio: length/width), cell position (abdominal hemisegment number), number of nuclei, and cumulative nuclear area. Clustering divided the data into two groups that did not show any bias for individual larvae, genotypes, or experimental replicates (Figure S1D), but clearly correspond to VL3 and VL4 muscles (Figure 1J). These analyses confirmed that, VL3 and VL4 muscles were comparable across larvae and genotypes, but inherently different when compared to each other.
Muscle nuclei collectively establish precise global scaling with cell size
To achieve a comprehensive characterization of nuclear scaling with regard to the size of multinucleated muscle fibers (global nuclear scaling), we took advantage of the natural variation of cell size parameters that we observed in wild-type VL muscles. In addition to cell areas and nuclear numbers, we quantified the cumulative nuclear DNA content (ploidy), the cumulative area of all nuclei, and the cumulative area of all nucleoli within each cell (Figures 2A-2G). All parameters showed linear scaling with cell size across VL muscle types, however, with different linear fits (Figures 2H-2K). During Drosophila development, fusion of diploid embryonic myoblasts initially sets the number of nuclei per muscle fiber. Subsequently endoreplication increases the DNA content within each nucleus to promote muscle growth in the larva (Demontis and Perrimon, 2009). Nuclear numbers ranged from 9-21 in VL3 and from 6-13 in VL4, with a considerable variation in cell sizes for every given number of nuclei (Figure 2H, correlation coefficient R=0.74). We independently assessed the DNA content in VL muscles by calculating ploidy numbers in muscle nuclei based on Hoechst fluorescence intensities in diploid muscle progenitor cells (AMPs, Figures 2B, 2D-G and S2A-B). On average, VL3 muscles contained a total of 614+/−153 copies, VL4 muscles a total of 386+/−96 copies of DNA. Notably, cells with the same number of nuclei contained different amounts of cumulative DNA content, resulting in improved linear scaling with cell area (Figure 2I, R=0.86). Compared to DNA content, the cumulative area of all nucleoli and nuclei showed further improved scaling with VL cell size (Figures 2J and 2K; R=0.88 and R= 0.90, respectively). Plotted on a log scale, cumulative nucleolar, cumulative nuclear and cell areas showed a linear scaling relationship (Figure S2C). Similar to DNA content, cells with the same number of nuclei established widely different cumulative nucleolar and nuclear sizes. These data showed that VL muscle fibers establish precise global nuclear scaling relationships despite variations in the number of their nuclei. Further, this suggested a high level of coordination among the nuclei contained within a cell.
Figure 2. Muscle nuclei establish precise global scaling with cell size.
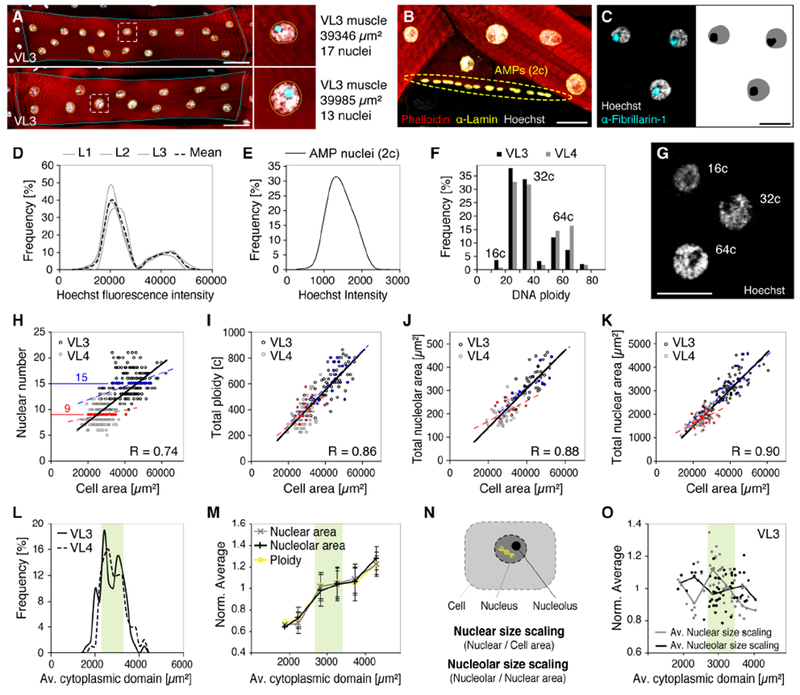
(A) VL3 muscles with similar areas but differences in nuclear number. Muscle cells (phalloidin, red), nuclei (Hoechst, gray) and nucleoli (α-Fibrillarin, cyan). Dashed lines highlight one nucleus each cell (right); nuclear size, DNA content, and nucleolar size are increased in the cell containing fewer nuclei (bottom).
(B) Staining of DNA (Hoechst, gray) in diploid (2c) adult muscle progenitors (AMPs, dashed oval) and polyploid VL muscle nuclei. Red, phalloidin; Yellow, Nucleus, α-Lamin.
(C) Left: labeling of nucleoli (α-Fibrillarin, cyan) and DNA (Hoechst, gray) in VL muscle nuclei. Right: binary image for quantification of areas.
(D) Histogram of DNA (Hoechst) fluorescence intensities in individual VL muscle nuclei from 3 individual larvae (L1-L3, gray). VL nuclei per larva n ≥ 100. Black dashed line represents mean.
(E) Histogram of Hoechst intensities in diploid (2c) adult muscle progenitors (AMPs). n = 90.
(F) Histogram of calculated DNA copy numbers (ploidy) for nuclei plotted in (A). Peaks correspond to nuclei containing 16, 32 or 64 copies (c) of DNA.
(G) Example VL nuclei containing different amounts of DNA (Hoechst). Ploidy numbers are indicated.
(H-K) Nuclear number (H; nVL3=102, nVL4=97), cumulative DNA copy number (c)(I; nVL3=67, nVL4=75), cumulative nucleolar area (J; nVL3=54, nVL4=54), and cumulative nuclear area (K; nVL3=102, nVL4=97) plotted against muscle cell area. Bold lines and correlations coefficients (R) indicate linear scaling across VL3 (black) and VL4 (gray) muscles. Dashed lines indicate individual linear regressions for VL3 (blue) and VL4 (red) muscles. Cells with the same number of nuclei, e.g. 9 (red) and 15 (blue), achieve different cell sizes, and vary in their cumulative amount of nuclear DNA, nucleolar sizes and nuclear sizes.
(L,M) Global size parameters as in (H-K) normalized by the number of nuclei per cell
(L) Histogram of mean cytoplasmic domain sizes (cell area/nuclear number) in VL3 and VL4 muscles, showing similar “optimal” cytoplasmic domain size in both VL muscles (green area).
(M) Mean ploidy (cumulative DNA content/nuclear number), mean nuclear area (cumulative nuclear area/nuclear number), and mean nucleolar area (cumulative nucleolar area/nuclear number) plotted against the mean cytoplasmic domain size. Green area corresponds to optimal cytoplasmic domain size as in (L). Error bars, SD.
(N) Schematic representation of nuclear size scaling and nucleolar size scaling.
(O) Nuclear size scaling and nucleolar size scaling plotted against the average size of the cytoplasmic domains within VL3 cells (for VL4, see Figure S2F). Note: highest nuclear scaling values are associated with optimal cytoplasmic domain sizes (green area), while smaller or larger domain sizes correlate with increased nucleolar scaling and proportionally smaller nuclei.
Scale bars, 50μm (A), 25μm (B,C,G).
To directly compare muscle fibers with varying nuclear numbers and analyze the relationships between DNA content and nuclear and nucleolar sizes, we normalized all global parameters by the number of nuclei per cell. Thereby we calculated the average size of the cytoplasmic domain per nucleus (cell area/nuclear number), the average DNA content per nucleus (cumulative DNA content/nuclear number), and the average size of nuclei and nucleoli (cumulative area/nuclear number). Average cytoplasmic domain sizes showed a similar distributions and range in VL3 and VL4 muscles (Figure 2L), suggesting a similar optimal cytoplasmic domain size (~ 3000 μm2) per nucleus in both VL muscles. In muscles with near-optimal cytoplasmic domain sizes, average DNA content (46c), average nuclear areas (187 μm2), and average nucleolar areas (41μm2) were similar. These parameters were reduced by ~20-30% in cells with smaller domain sizes and increased by ~20-30% in cells with larger domain sizes (Figure 2M). As muscle cells grow by adding DNA content, this stepwise growth pattern could reflect a stepwise increase in nuclear DNA via endoreplication.
To further investigate size scaling of nuclei and nucleoli, we determined the ratio of cumulative nuclear area per cell area (global nuclear size scaling) and the ratio of cumulative nucleolar per nuclear area (global nucleolar size scaling) (Figure 2N). On average, VL3 and VL4 muscles established significantly different global nuclear size scaling relationships, while global scaling of nucleoli to nuclei was similar in both muscles (Figures S2D and S2E). Given the function of the nucleolus in ribosome biogenesis and cell growth, proportionally larger nuclei and nucleoli in VL3 muscles indicated overall higher metabolic potential per nucleus. Strikingly, in both VL muscles, the relationship between nuclear and nucleolar scaling changed with absolute size, so that cells with near-optimal cytoplasmic domain sizes contained proportionally large nuclei and small nucleoli, while cells with smaller or larger cytoplasmic domain sizes contained proportionally small nuclei and large nucleoli (Figure 2O and S2F). This further indicated that muscle cells globally coordinate nuclear and nucleolar scaling to adjust nuclear synthetic activities dependent on DNA content and the average size of the cytoplasmic domains.
Together these data demonstrated that a variety of nuclear parameters scale with the size of multinucleated muscle fibers; however, similar to mononucleated/diploid cells, the cumulative size of all nuclei and nucleoli give the best prediction of muscle cell size. We propose that global nuclear scaling with VL muscle size is achieved in three steps: firstly, the number of nuclei sets a range of possible cell sizes; secondly, each cell during growth individually increases nuclear ploidies to maintain a stable scaling of cumulative of DNA content with cell size. Thirdly, the size of nuclei and nucleoli is continuously adjusted, to establish precise, cell type specific scaling with cell size, and allow for optimal cell function.
Nuclei distribute via a force balance and adjust their size based on spatial cues
The accuracy of global nuclear scaling in multinucleated VL muscles suggested that the nuclei contained within a cell are highly coordinated. We hypothesized that stable global scaling relationships are established via scaling of individual nuclei with their surrounding cytoplasmic domain (local nuclear scaling). To test this, we determined nuclear positions within each cell based on their centroids, and thus independent of their size (Figure 3A). In both VL muscles, the distances between nuclei (Nearest Neighbor Distances) were larger than expected for random distribution, confirming that nuclei are deliberately positioned (Figure S3A). Along the length of each fiber, nuclei were organized in rows, typically two rows in VL3 and one row in VL4 muscles (Figure 3B). However, in VL3 and VL4 muscles with the same geometric properties (cell dimensions, number of nuclei) the number and the position of rows were similar (Figure 3C), indicating that geometrical factors, rather than VL muscle type, dictate the nuclear patterns.
Figure 3. Nuclei are positioned via a force balance and individually adjust their sizes based on spatial cues.
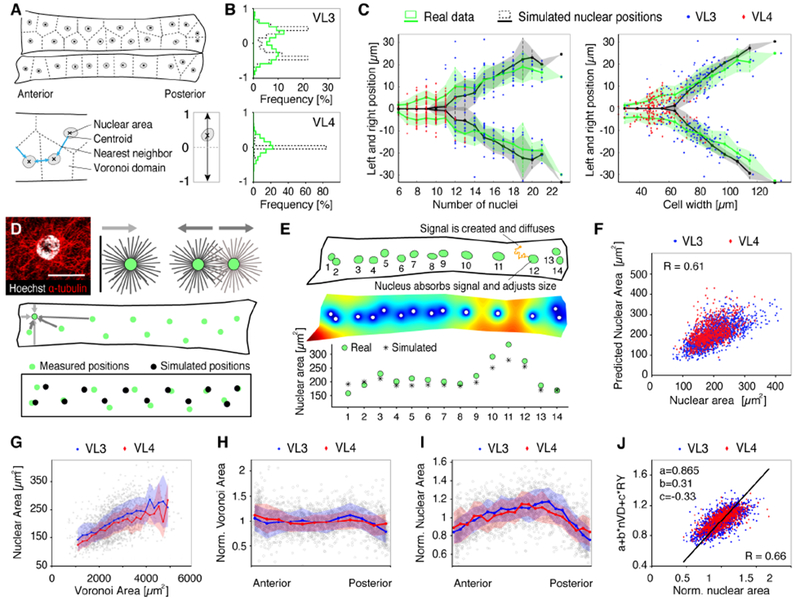
(A) Schematic representation of VL3 and VL4 muscles and nuclei, nuclear centroids, nearest neighbor distances (blue arrows) and cytoplasmic domain sizes (Voronoi tessellation, dashed lines).
(B) Histograms of relative nuclear positions along the short cell axis (A, bottom right). Real data (green lines) and simulated nuclear positions (dashed lines) show organization in one or two rows for each muscle type. For simulation details see methods.
(C) Nuclear positioning as a function of nuclear number (left) and cell width (right). For each cell the average position of all nuclei to either side of the cell midline was plotted (experimental data in green, simulated data in black). Thick lines and shaded regions show means, SD; each dot represents one cell (VL3 blue, VL4, red).
(D) Simulation of nuclear positioning. Top: VL nucleus (DNA, gray) and microtubule labeling (anti-a-tubulin, red) (left), and schematic representation of the potential mechanical pushing forces between nuclei and cell edges (middle) and between neighboring nuclei (right). Lines represent microtubules, green circles nuclei, arrows indicate the resulting forces. Middle: Cell outline (black) and nuclear positions (green circles) of one example VL3 cell. Arrows represent forces felt by the nucleus marked with a black outline from neighboring nuclei (dark gray arrows) and cell edges (light gray arrows). Arrow widths represents force strength. Bottom: For the example cell above, initial nuclear positions (measured, green circles) and final force-balanced positions (simulated, black circles) are shown. For simulation details see Suppl. Methods.
(E) Simulation of nuclear space-sensing. Top: Nuclear positions, sizes, and shapes (green discs, using fitted ellipses) of one example VL3 cell. The orange particle represents one modeled space-sensing molecule. Middle: Final distribution of the space-sensing molecule as simulated for the example cell above (blue=zero concentration, red=maximal concentration). Bottom: Measured and simulated nuclear areas for the example cell above. Nuclei are indexed from left to right as indicated at the top. For simulation details see Suppl. Methods.
(F) Scatter plot showing correlation of real nuclear areas with nuclear areas predicted by simulation of local size sensing. Inset (top) shows representative simulation result; colors indicate concentration of a hypothetical cytoplasmic molecule which is absorbed by each nucleus (white circles).
(G-J) Thick lines and shaded regions show means, SD; each dot represents one cell (VL3 blue, VL4, red).
(G) Linear correlation of nuclear areas with Voronoi domain areas (R=0.55, p<0.0001).
(H) Distribution of normalized Voronoi domain size (Voronoi Area*No. of Nuclei/Cell Area) along the cell length. Thick lines show averages, shaded regions correspond to standard deviation.
(I) Distribution of normalized nuclear areas (Nuclear Area*No. of Nuclei/Total Nuclear Area) along the cells showing largest nuclei in the cell middle. VL3 nuclei (mean+/−SD = 202+/− 55um) are larger than in VL4 nuclei (192+/−44um).
(J) Multiple Linear Regression showing that Voronoi area (nVD=normalized Voronoi Area) and nuclear position along the long cell axis (RY=absolute relative y-position, with 0=middle and 1=poles) give a good prediction of nuclear size (R=0.66, p<0.0001). Each dot represents one cell (VL3 blue, VL4, red).
Sample numbers: n (cells) = 200 (103 VL3, 97 VL4), n (nuclei) = 2477 (1579 VL3, 898 VL4).
In Drosophila and mammalian muscle fibers, nuclear positioning involves microtubules and motor proteins to generate mechanical forces (Folker and Baylies, 2013; G. G. Gundersen and Worman, 2013; Roman and Gomes, 2017). In larval VL3 and VL4 muscles, microtubules grow from the nuclear envelopes and form astral arrays surrounding each nucleus (Figures 3D and S3B) (Metzger et al., 2012; Volk, 2013; Rosen et al. in press). We hypothesized that these microtubule asters interact with each other and with the cell edges, potentially through microtubule-associated motors, and that these mechanical interactions position the nuclei (Figure 3D). We performed mathematical simulations to test whether such mechanical forces were sufficient to explain the nuclear positioning in VL3 and VL4 muscles (see Methods). In brief, we assumed that the nuclei interact with each other and with the cell edges via pair-wise, distance dependent forces. We assumed that these forces are repulsive and decrease with distance. We also tested differences in the relative magnitude of inter-nuclear and nucleus-cell edge forces but kept the forces independent of nuclear sizes and positions. For each experimentally measured cell, we used the real cell dimensions and nuclear numbers, and initially placed the nuclei at their measured positions. Then, applying the distance-dependent forces, we calculated their resulting positions caused by force balancing (Figure 3D). The simulated data, shown in Figures 3B and 3C, closely recapitulated the experimentally measured nuclear positioning in both VL3 and VL4 cells. The accuracy of the mathematical approximation supported that positioning mechanisms are based on microtubule-based mechanical forces and establish a cell geometry-dependent force balance to position the nuclei in VL3 and VL4 muscles.
If nuclei are positioned via mechanical interactions yet independent of their size, we hypothesized that these nuclei sense the size of their surrounding cytoplasmic domain and adjust their own size accordingly, to establish local size scaling relationships. To evaluate this hypothesis, we tested a space-sensing mechanism that predicts the size of each nucleus based on the detected amount of a hypothetical diffusible cytoplasmic molecule (Figure 3E). We assumed that signal molecules are activated or created with a constant rate and equal probability everywhere in the cell, diffuse and, upon encountering a nucleus, are taken up by the nucleus. Subsequently, each nucleus adjusts its size depending on how much signal it receives (see Methods and Mathematical Supplemental Methods, Supplemental Data File S1). Using experimentally determined cell shapes and nuclear positions, our simulations predicted nuclear areas very accurately, with an average relative error of less than 17% compared to the experimental data (Figure 3F). An intuitive explanation for this mechanism is that nuclei positioned farther away from their neighbors harvest the signaling molecules from the greater area, and hence grow larger than their neighbors, leading to the local size regulation. Our data suggest that a local space sensing mechanism is involved in regulating nuclear sizes within each cell.
Our space-sensing model predicted correlations between the size of individual nuclei and the size of their surrounding cytoplasmic domain. To test this in vivo, we used an unbiased approach to geometrically partition each cell into cytoplasmic domains based on nuclear positions (Voronoi tessellation (Du et al., 2010), Figure 3A). In accordance with our simulations, we found a linear correlation between nuclear and Voronoi areas in both VL muscle types (Figure 3G). However, in contrast to the precise global nuclear size scaling relationships (Figure 2G, R=0.90), the local correlation of nuclear size and cytoplasmic domain size was much weaker (R=0.55). Closer analysis revealed that Voronoi domain areas were relatively consistent within each muscle fibers (Figure 3H), while the size of individual nuclei varied significantly (Figures 3I). Strikingly, in both VL muscles, nuclear areas showed a specific, asymmetric pattern with the biggest nuclei located close to the cell center and considerably smaller nuclei at the cell ends. This intracellular pattern of nuclear sizes was not predicted by our space-sensing model (Figure S3C), indicating that additional regional factors differentially affect nuclear sizes along the length of each VL muscle fiber. Multiple linear regression analyses using various cell parameters confirmed that the best prediction of nuclear size was achieved by a combination of local cytoplasmic domain area and nuclear position within the cell (Figure 3J, R=0.66, p<0.0001). This demonstrated that VL muscle nuclei do establish specific local size scaling with their surrounding cytoplasmic domain; however, each cell contained a heterogeneous population of nuclei with different sizes.
Together these data suggested that VL nuclei are coordinated, via a force balance, to evenly distribute throughout the cells and establish stable global scaling relationships by adjusting their size based on local spatial parameters. In addition to the size of the cytoplasmic domain, our data predicts that regional factors, which consistently vary along the length of each muscle fiber, regulate nuclear sizes within each VL muscle.
Muscle fibers are composed of domains with distinct nuclear scaling relationships
Each skeletal muscle fiber attaches to tendon cells at both cell ends (myotendinous junctions, MTJs) and is innervated by a motoneuron at the neuromuscular junction (NMJ). VL3 and VL4 muscles form MTJs at the anterior and posterior abdominal hemisegment boundaries and are innervated by the same motoneuron off-center, in the anterior half of the cells (Figure 4A). Strikingly, in both VL muscles, the highest local nuclear size scaling values (Nuclear area / Voronoi area) correlated with the position of the NMJ (start: 29+/−5%, end: 54+/−8% of cell length), while nuclei adjacent to anterior and posterior MTJs showed significantly lower values (Figures 4B and S4A). This indicated that, within each VL muscle fiber, differences in nuclear size scaling correlate with regions associated with specific cell functions during muscle contraction.
Figure 4. Local nuclear size scaling and synthetic activity are inversely correlated.
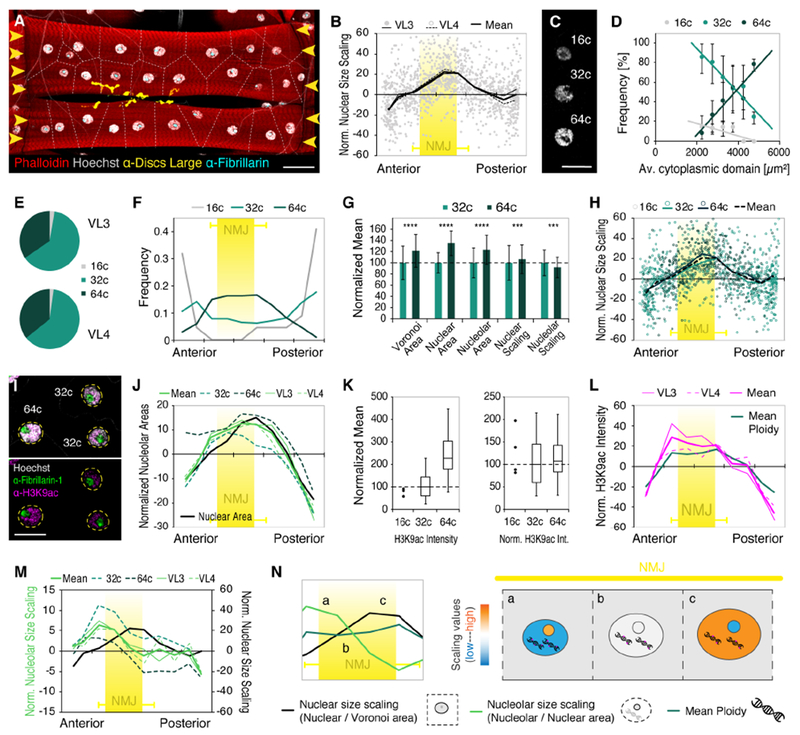
(A) Positions of NMJ (α-Discs large, yellow) and MTJs (yellow arrowheads) in VL3 and VL4 muscles. Muscle, Red, phalloidin; nuclei, white, Hoechst; nucleolus, cyan, α-Fibrillarin.
(B) Scatter plot showing distribution of normalized local nuclear size scaling (ratio of nuclear area to Voronoi domain) along the length of VL muscle fibers (nVL3=57, nVL4=61 muscles). Highest values correlate with mean position of the NMJ (yellow; start: 29.03+/−4.48%, end: 53.74+/−7.88% of cell length; nVL3=24, nVL4=24). Error bars, SD.
(C) VL muscles nuclei containing 16, 32 or 64 copies (c) of DNA. See also Figures S2A-D.
(D) requency of 16c, 32c and 64c nuclei as a function of mean Voronoi domain size. The ratio of nuclear ploidy numbers in individual cells depends on nuclear number and cell size.
(E) Pie charts showing similar ratio of nuclear ploidies in VL3 and VL4 muscles.
(F) Histogram of nuclear ploidy numbers along the long cell axis (anterior left, posterior right). NMJ region noted by yellow box as in (B).
(G) Bar graph (mean +/− SD) comparing absolute size of Voronoi domain (p<0.0001), nuclear area (p<0.0001) and nucleolar area (p<0.0001), and size scaling of nuclei (p=0.0009) and nucleoli (p<0.0001) in nuclei with 32 and 64 copies of nuclear DNA. Means for 32c nuclei were set to 100%.
(H) Nuclear size scaling (nuclear per Voronoi area) along the length of VL muscle fibers. DNA copy number for each nucleus plotted. NMJ position is indicated in yellow error bars as in (B).
(I) Representative images showing nucleoli (Fibrillarin-1, green), H3K9ac (magenta) and DNA (Hoechst, gray) in polyploid VL nuclei.
(J) Normalized nucleolar areas plotted against cell length. Mean values for nuclei with 32c and 64c, and VL3 and VL4 muscles are indicated. Black line shows normalized DNA content for reference. NMJ region (yellow box) as in (B).
(K) Box plots (median, 25/75 percentile, min/max values) showing proportional increase of H3K9ac with DNA content thus similar relative values per nucleus, independent of absolute DNA content.
(L) Normalized H3K9ac intensity measurements plotted against cell length. Mean values for VL3 and VL4 muscles are indicated. Dark green line shows normalized DNA content for reference. NMJ region (yellow box) as in (B).
(M) Normalized nucleolar size scaling plotted against cell length. Mean values for nuclei with 32c and 64c, and VL3 and VL4 muscles are indicated. NMJ region (yellow box) and normalized nuclear size scaling (black line) as in (B).
(N) Schematic highlighting the inverse relationship of nuclear and nucleolar size scaling (as in (M)) at constant DNA content (see (L)) at the NMJ. Lower case letters (a, b, c; graph, left) reflect areas from which representative nuclei and nucleolar scaling relationships are depicted in drawing (a, b, c; right).
Scale bars: 50 μm (A), 25 μm (C,I).
Sample numbers: n=1286 nuclei (B,H,J,M,N), n=950 nuclei (D-G,K,L)
To determine whether nuclear DNA content affects local nuclear size scaling, we calculated DNA copy numbers for each VL nucleus, using established techniques (e.g. Losick et al., 2013). We identified nuclei with 16, 32, or 64 copies of DNA, which on average, occurred at a similar frequency in VL3 and VL4 muscles (Figures 4C-E and S2A-D). However, each cell established a distinct ratio of nuclear ploidy numbers in correlation with the number of nuclei and cell size, so that cells with larger cytoplasmic domain sizes contained a higher percentage of 64c nuclei. Along the cells, 16c nuclei were located adjacent to the MTJs and were absent from the NMJ region; 32c nuclei were positioned throughout the cell, and 64c nuclei were located mainly adjacent to the NMJ (Figure 4F). On average, nuclear DNA content was highest in nuclei adjacent to the NMJ in both VL muscles (Figure S4B). We compared size parameters associated with 32c and 64c nuclei: a doubling in DNA content correlated with significant increases in nuclear area (~35%) and cytoplasmic (Voronoi) domain area (~21%). Further, local nuclear size scaling (nuclear area/Voronoi area) was increased for 64c nuclei (Figure 4G). These data suggested that nuclear ploidy affects absolute size, as well as local nuclear size scaling. Nevertheless, both 32c and 64c nuclei established similar size scaling patterns along the anterior-posterior axis of the VL muscle fibers (Figure 4H), indicating that regional/intracellular size scaling differences are established independent of absolute nuclear DNA content.
Variations in nuclear DNA content suggested significant local differences in nuclear synthetic activity within each VL muscle fiber. We analyzed individual nucleolar sizes as readout for the synthetic activity of VL muscle nuclei (Figure 4I). Across all VL nuclei, absolute nucleolar areas showed a better linear correlation with nuclear areas than with Voronoi domain areas and were significantly larger in 64c than in 32c nuclei (~24%; Figures 4G and S4C-D). Accordingly, mean nucleolar areas were largest in the anterior half of the muscle fibers and the NMJ region (Figure 4J). To independently assess nuclear synthetic activity, we analyzed labeling of H3K9ac, a conserved marker of gene activation which does not report rRNA transcription (Boros, 2012; Peng and Karpen, 2007). H3K9ac fluorescence intensities indicated that the mean number of active transcriptional start sites increased proportional with nuclear ploidy; thus, normalizing by DNA content resulted in similar relative H3K9ac levels in 16c, 32c and 64c nuclei (Figure 4K). Along the length of both VL muscles, H3K9ac levels showed clear regional differences and were proportionally increased in the anterior half of the cells (Figure 4L). Together, DNA content, nucleolar sizes, and H3K9ac indicated highest nuclear activity in the anterior half of the cells, including the region of the NMJ.
We used the local scaling of nucleolar to nuclear areas to further investigate the relative contribution of individual nuclei to the total synthetic activity of each cell. In mononucleated cells with a set number of nucleolar components, nucleolar size is determined in a concentration-dependent manner by the relative size of the nucleus within the cell (Brangwynne, 2013; Ma et al., 2016; Uppaluri et al., 2016; Weber and Brangwynne, 2015). If muscle nuclei contribute to a shared pool of nucleolar components, small nuclei containing less DNA would import a proportionally increased number of nucleolar components and form proportionally larger nucleoli. Indeed, local nucleolar size scaling was significantly increased in 32c nuclei, indicating proportionally higher nuclear synthetic activity in nuclei containing less DNA (Figure 4G). Along the anterior-posterior axis of the cells, the pattern of nucleolar size scaling showed specific regional differences that were recapitulated by both 32c and 64c nuclei, and similar in VL 3 and VL4 muscles (Figures 4M). These results indicated that nucleolar size scaling (nucleolar area/nuclear area) was established independent of absolute size parameters. Intriguingly, the intracellular pattern of nucleolar size scaling was inverted compared to nuclear size scaling, so that nucleolar size scaling was lower in proportionally large nuclei and higher in proportionally small nuclei (Figure 4N). These data suggested that within each muscle cell, size scaling of nucleoli could coordinate nuclear synthetic activities to compensate for differences in nuclear DNA content as well as for differences in local nuclear size scaling.
Together these data showed that each muscle fiber consist of domains with distinct nuclear scaling relationships. Scaling of nuclear size, DNA content, and synthetic activity exhibit different, asymmetric patterns along the length of both VL muscle fibers, and correlate with regions associated with different cell functions during muscle contraction. We propose inverse size scaling of the nucleolus as a possible mechanism for muscle cells to allow for local differences in DNA content and nuclear sizes, while maintaining similar cytoplasmic domain sizes along each muscle fiber and stable global cell size regulation.
Nuclear compensation and functional consequences
Our analyses suggested that DNA content affects the absolute size of cells, nuclei, and nucleoli, while nuclear positioning and local size scaling are regulated independent of nuclear ploidy. To test our assumptions and investigate the robustness of nuclear scaling and cell function, we genetically manipulated the DNA content in the larval musculature. We knocked down a component of the DNA replication machinery (Dmef2 > ctd1(dup)RNAi) to reduce the amount of endoreplication (Whittaker et al., 2000), and overexpressed a regulator of cell cycle progression (Dmef2 > dMyc) to promote endoreplication specifically in muscle during larval growth (Pierce et al., 2004). These manipulations resulted in significant differences in nuclear DNA content: Cdt(Dup) knockdown (KD) reduced nuclear ploidy numbers by one round of endoreplication (8c, 3%; 16c, 83%; 32c, 14%), whereas Myc overexpression (OE) increased nuclear ploidies by approximately one round of endoreplication (32c, 6%; 64c, 38%; 128c, 55%; 256c, 1%) (Figures 5A and 5C). Cdt1(Dup)KD muscles were only 10% smaller, and MycOE muscles had similar cell sizes compared to controls; however, larval locomotion was significantly reduced in both genotypes (Figures 5B and 5D). This indicated that our tissue specific manipulations of DNA content negatively affected muscle function but did not override the systemic demands for a specific muscle size. These manipulations thus provided an opportunity to investigate nuclear adaptions to changes in intracellular scaling relationships.
Figure 5. Muscle specific increase and decrease in nuclear DNA content.
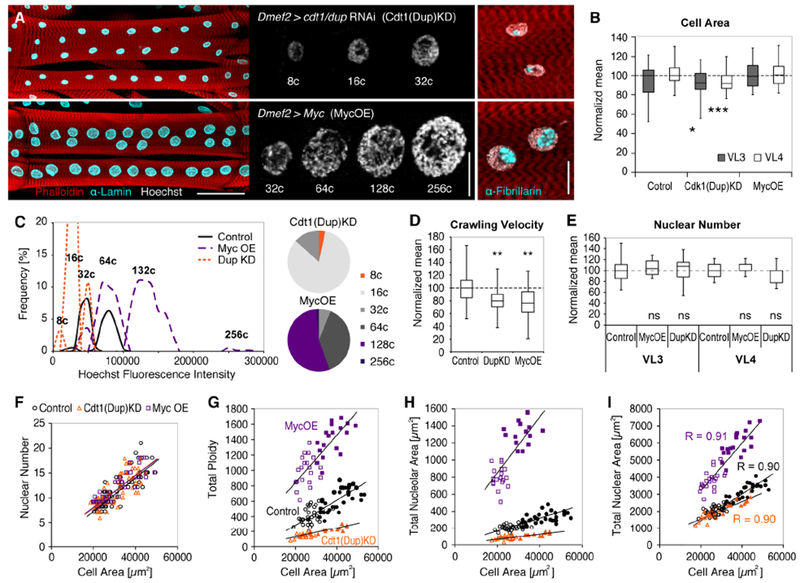
(A) VL3 and VL4 with muscle-specific knockdown of Cdtl(Dup) (top) and overexpression of Myc (bottom). For representative control image see Figure 1B. Changes in nuclear DNA content (Hoechst, gray) and nucleolar sizes (α--Fibrillarin, cyan) are shown in panels in the middle and on the right, respectively. Muscle, phalloidin, red; nuclei, α-Lamin, cyan (left panel).
(B) Boxplot showing median VL3 and VL4 cell areas in Cdt1(Dup)KD, MycOE, and control larvae (boxes, 25/75 percentiles; whiskers, min/max values). p values and asterisks indicate Student’s t test results: Cdt1(Dup)KD, pVL3=0.0268, pVL4=0.0002; MycOE, pVL3=0.9959, pVL4=0.3720.
(C) Left: Histogram of DNA (Hoechst) fluorescence intensities showing decreased nuclear DNA content in Cdt1(Dup)KD (orange) and DNA increased DNA content in Myc OE muscles (purple). Right: Pie charts of nuclear ploidies in Cdt1(Dup)KD and MycOE muscles. Ploidy classes not found in control muscles are highlighted in orange (8c; Cdtl(Dup)KD) and purple (128c, 256c; MycOE).
(D,E) Box plots (whisker, min/max values; boxes, 25/75 percentiles) comparing median larval crawling velocity(D) and nuclear numbers(E) in Cdt1(Dup)KD, Myc OE and control muscles (dashed line indicates median). Student’s t test results: (D) Cdt1(Dup)KD, p=0.0044 , n=24 larvae), MycOE (p=0.0017, n=27 larvae).
(F-I) Scatter plots showing scaling of nuclear number(F), cumulative DNA content(G), cumulative nucleolar area(H) and cumulative nuclear area (I) across VL 3 (filled symbols) and VL4 muscle types (outlined symbols) in Cdt1(Dup)KD (orange), MycOE (purple) and control muscles (black).
Sample numbers: Control, nVL3=28, nVL4=35 cells; Cdt1(Dup)KD, nVL3=39, nVL4=35 cells; MycOE, nVL3=18, nVL4=19 cells (all except (D)).
Analysis of global nuclear scaling relationships (cumulative nuclear parameter/cell size) showed that Cdt1(Dup)KD and MycOE did not affect the number of VL nuclei, thus scaling of nuclear number with cell size was similar to control muscles (Figures 5E and 5F). Despite changes in absolute parameter values, precise linear scaling of cumulative DNA content and nuclear and nucleolar areas with VL cell areas was also maintained in Cdt1(Dup)KD and MycOE backgrounds (Figures 5G-5I). These data indicated that intracellular scaling mechanisms and the coordination of nuclei within each cell were not disrupted and were independent of absolute size parameters.
In accordance with our simulations of nuclear positioning in control cells, Cdt1(Dup)KD and MycOE nuclei were evenly positioned despite different nuclear sizes and DNA content (Figures 6A-C). Further, in both genotypes, DNA ploidy numbers and nuclear sizes were smallest adjacent to the MTJs and increased towards the cell center/NMJ (Figures 6D and S5A). Strikingly, the normalized distribution of nuclear sizes along each cell was similar in MycOE, Cdt1(Dup)KD, and control muscles (Figure 6E), suggesting that regional patterning mechanisms within the cell were intact and regulate relative sizes rather than absolute nuclear parameters within each cell.
Figure 6. Intracellular changes in response to manipulation of nuclear DNA content.
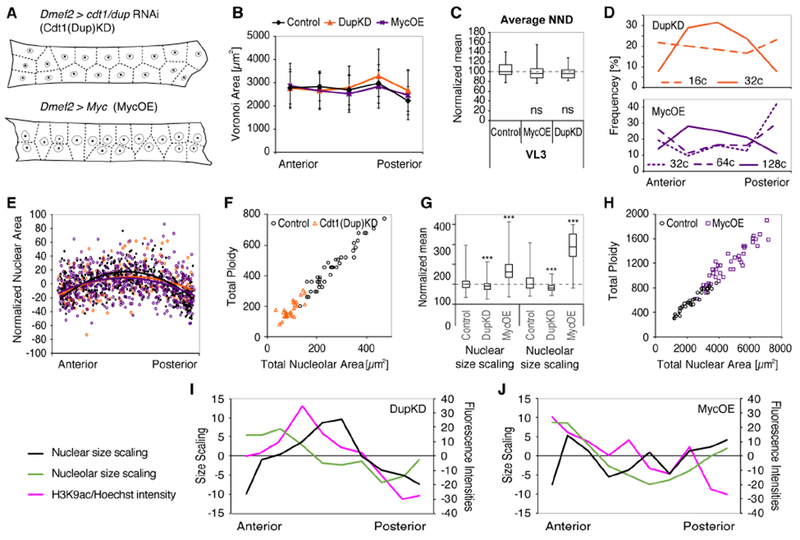
(A) Schematic representation of Dup(Cdk1)KD (top) and MycOE (bottom) VL3 muscles and nuclei, including nuclear centroids, and cytoplasmic domain sizes (Voronoi tessellation, dashed lines).
(B) Voronoi domain areas along the long cell axis (mean +/− SD). Colored lines indicate genotype.
(C) Boxplot (whisker, min/max values; boxes, 25/75 percentiles) showing nearest neighbor distance (NND) in VL3 muscles of Cdt1(Dup)KD, Myc OE and control larvae. Student’s t test results: p = 0.1638 (MycOE) and p = 0.5448 (Cdtl(Dup)KD).
(D) Histograms showing distribution of nuclear ploidies along the cell length of MycOE and Cdt1(Dup)KD muscles.
(E) Distribution of normalized nuclear areas along the length of each muscle fibers. Values are expressed as % deviation from average per genotype. Solid lines indicate mean. The distribution of nuclear areas in the Cdt1(Dup)KD and in MycOE is similar to control.
(F) Linear isometric scaling of cumulative nucleolar area with DNA content in Cdt1(Dup)KD muscles.
(G) Boxplot showing median nuclear and nucleolar scaling in Cdt1(Dup)KD, MycOE, and control larvae (boxes, 25/75 percentiles; whiskers, min/max values). *** indicates p values <0.0001 for all genotypes (Student’s t test).
(H) Linear isometric scaling of cumulative nuclear area with DNA content in MycOE muscles.
(I,J) Normalized nuclear and nucleolar size scaling, and H3K9ac per Hoechst fluorescence intensity plotted along the length of Cdt1(Dup)KD and MycOE muscles. For wild-type patterns see Figure 4).
Sample numbers: Control, nVL3=28, nVL4=35 cells; Cdt1(Dup)KD, nVL3=39, nVL4=35 cells; MycOE, nVL3=18, nVL4=19 cells (C-J).
On average, Cdt1(Dup)KD resulted in a 62% reduction in total DNA content, and 60% reduction in cumulative nucleolar areas, while the cumulative area of all nuclei was only 25% smaller than in control cells (Figures 5 and S5B-D). Thus, Cdt1(Dup)KD nuclei increased their size relative to DNA content. However, small nucleolar sizes suggested that synthetic activity was not upregulated under these conditions (e.g. no compensation). Instead, cumulative nucleolar areas maintained a linear correlation with total DNA content (Figure 6F), suggesting that the amount of nuclear DNA limits maximal nucleolar sizes within each muscle cell. In accordance with a low number of nucleolar components and proportionally increased nuclear sizes, nucleolar size scaling (nucleolar size/nuclear size) was significantly decreased in Cdt1(Dup)KD nuclei compared to control (Figure 6G). Despite lower global size scaling values in Cdt1 (Dup)KD muscles, the regional patterns of local nuclear and nucleolar size scaling within the cells were similar to control (Figure 6I). These data indicated that local size scaling mechanisms were intact in Cdt1(Dup)KD muscles. Limitations to the synthetic machinery could reduce muscle function and growth by not meeting the metabolic demands of the muscle cells.
MycOE resulted in a doubling in cumulative DNA content, a four-fold increase in cumulative nucleolar area, and a doubling in cumulative nuclear area (Figures 5 and S5B-D). In addition to promoting the replication of nuclear DNA, MycOE has been shown to promote rRNA synthesis, ribosome biogenesis, and nucleolar sizes in a variety of Drosophila larval tissues (Grewal et al., 2005). Despite the dramatic increase in nucleolar areas, MycOE muscle nuclei maintained linear scaling of cumulative DNA content with cumulative nuclear areas compared to control cells (Figure 6H). This suggested that the ratio of DNA per nuclear area, and thus chromatin compaction and mechanical properties of the nucleus, might limit the range of nuclear size adjustments in dynamically contracting muscle fibers. In accordance with increased absolute sizes, local size scaling of nuclei and nucleoli was dramatically increased in (Figure 6G). Further, along the anterior-posterior length of MycOE muscles, the coordination between local nuclear and nucleolar size scaling was lost (Figure 6J), suggesting that the upregulation of the synthetic machinery in Myc OE disrupted local size sensing mechanisms.
Together these data suggest that VL muscle nuclei regulate their size within a range set by DNA content, yet differentially respond to increases and decreases in nuclear ploidy. While DNA content affects absolute nuclear sizes and synthetic activity, nuclear positioning mechanisms and functionally distinct regions within each cell determine the relative contribution of individual nuclei to cell size. These experiments highlight distinct levels of muscle size regulation in multinucleate muscle fiber (Figure 7), demonstrate the robustness of intracellular organization, and stress the importance of nuclear scaling for muscle function.
Figure 7.
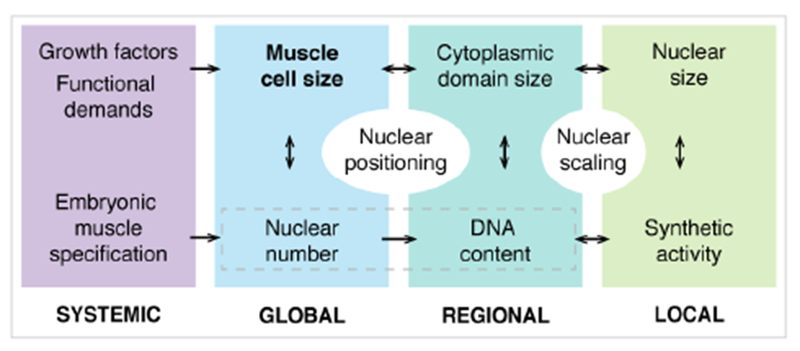
Levels of intracellular size regulation in multinucleated muscle fibers.
DISCUSSION
Skeletal muscle fibers are large multinucleated cells with essential roles in locomotion and metabolism. Our study provides the first comprehensive analysis of nuclear scaling in whole, fully differentiated muscle fibers using a large in vivo dataset. We show that muscle nuclei collectively establish precise global scaling relationships with muscle cell size. However, each cell is composed of domains with distinct local scaling of DNA, nuclear size, and nuclear synthetic activities. Together, our analyses of wild-type parameters, mathematical simulations, and genetic manipulations reveal different levels of muscle size regulation (Figure 7) and implicate nuclear scaling as essential for muscle function. We suggest that the mechanisms involved in intracellular size regulation in muscle cells depend on local factors (cytoplasmic domain size), regional factors (possibly involving NMJ, MTJs), as well as global factors (muscle type).
To establish a baseline for nuclear scaling in multinucleated muscle fibers we took advantage of the natural variation of different size parameters in Drosophila VL muscles. In Drosophila as well as in vertebrate systems, muscle fibers exhibit remarkable size plasticity, and nuclear number and DNA content are highly variable (Deng et al., 2017; Van der Meer et al., 2011). VL muscle sizes vary along the anterior-posterior axis of each larva and correlate with a specific range in the number of nuclei. We find that, on the global level, several nuclear parameters scale with muscle cell size, including nuclear number, DNA content, nucleolar size, and nuclear size. While the correlation of nuclear number and DNA content with muscle cell size has been appreciated in a variety of systems, nuclear size scaling has not been previously investigated in muscle fibers. Our data indicate that DNA content establishes a coarse scaling with cell size while the size regulation of nuclei and nucleoli is used for fine tuning the system. The precision of global nuclear and nucleolar size scaling in VL muscles is reminiscent of mononucleated cells, where cell-type specific scaling of the nucleus and nucleolus are associated with optimal cell function (Levy and Heald, 2012). Strikingly, VL3 and VL4 muscles establish distinct global nuclear size scaling, indicating that intracellular size scaling relationships are established in a muscle type specific manner. While the metabolic consequences of global size scaling differences in wild-type Drosophila muscles remain to be determined, it is possible that scaling of nuclear and nucleolar sizes with cell size is indicative of the growth potential of individual cells, and the differences in functional demands observed in different vertebrate muscle fiber types.
Despite precise global scaling, the nuclei contained within each VL muscle fiber consistently differ in size, DNA content, and nucleolar size. These differences are established in particular patterns along the length of both VL muscles and are independent of absolute cell size and nuclear content. While regional nuclear differences have been reported in different vertebrate muscles (Bruusgaard et al., 2003; B. W. C. Rosser et al., 2002), the extent of nuclear diversity and the precision of nuclear patterning within individual fibers and on population level have not been documented. In both Drosophila and vertebrate muscles, increases in DNA content are associated with the position of the NMJ. While in vertebrate muscles this seems to be achieved by regional clustering of nuclei, VL muscles increase nuclear DNA content; however in both systems, nuclei adjacent to the NMJ express specific genes required for NMJ function (Ganesan et al., 2011; Merlie and Sanes, 1985; Packard et al., 2015; Pavlath et al., 1989; B. Rosser and Bandman, 2003). Thus, it is likely that, as in mammals, NMJ and MTJs impose distinct functional requirements on adjacent VL nuclei. Further, it is possible that mechanical forces during muscle contraction have distinct affects along each cell. Experiments aimed at identifying the molecular mechanisms regulating the intracellular patterning and scaling relationships are underway and will provide valuable insights to the biology and physiology of muscle cells.
According to the myonuclear domain hypothesis, muscle fibers are composed of a mosaic of cytoplasmic domains, each regulated by a single nucleus (Hall and Ralston, 1989; Pavlath et al., 1989; Van der Meer et al., 2011). This concept of intracellular organization proposes that nuclei act mostly autonomously, with little exchange of gene products between neighboring nuclei. In contrast, the global nuclear scaling relationships uncovered in our study suggest that size regulation is highly coordinated among the nuclei contained within a VL muscle fiber. First, our data indicate that VL muscle nuclei are actively positioned via mechanical forces and based on cell geometries. Corresponding findings in mouse muscle fibers suggest that the mechanisms of nuclear positioning are conserved across species (Bruusgaard et al., 2003) and determine the relative spatial responsibility of individual nuclei. Further, our space-sensing model implicates the existence of a signaling molecule that diffuses across myonuclear domain boundaries to regulate individual nuclear sizes. In accordance with these simulations, increases and decreases in global DNA content affect absolute nuclear sizes, while nuclear positioning and the relative distribution of nuclear sizes within the cell is maintained. Together these data indicate that VL muscle fibers do establish distinct myonuclear domains; however, the mechanisms of intracellular size regulation determine the relative, rather than the absolute, contribution of individual nuclei within a muscle syncytium.
Studies investigating the molecular mechanisms of intracellular size regulation in various mononucleated cell types have implicated the nucleolar protein Fibrillarin as a possible evolutionarily conserved molecular size sensor (Ma et al., 2016; Yi et al., 2015). As membraneless organelles, nucleoli form via phase separation, and their size is determined by the concentration of nucleolar components inside the nucleus (Brangwynne, 2013). Strikingly, genetic manipulations of cell size at a fixed amount of nucleolar components in C. elegans embryos revealed inverse size scaling of nucleoli, so that nucleolar size was increased in smaller cells and decreased in larger cells (Weber and Brangwynne, 2015). Based on these and other findings it has been proposed that concentration-dependent inverse nucleolar size scaling could serve as a link between cell size, nuclear size, and synthetic activity. If muscle nuclei contribute to a shared pool of nucleolar components, like Fibrillarin, which distribute throughout the cytoplasm, smaller nuclei containing less DNA would import a proportionally increased number of nucleolar components and form proportionally larger nucleoli. Indeed, our data show that small VL nuclei with low ploidy, contain proportionally bigger nucleoli than big nuclei within the same cell. We propose that, similar to mononucleated cells, the inverse relationship of nuclear and nucleolar size scaling in VL muscles fibers could represent a link between absolute cell size and nuclear synthetic activity, globally as well as locally. In a shared cytoplasmic space, this mechanism would also allow for local differences in nuclear sizes and DNA content, while maintaining similar cytoplasmic domain sizes along each muscle fiber and stable global cell size regulation.
During muscle growth, increases in DNA content, in transcriptional output, and in cytoplasmic domain sizes contribute to cellular hypertrophy (e.g. this work; (Kirby et al., 2016; Murach et al., 2018b; Qaisar and Larsson, 2014). While domain sizes grow continuously, DNA content increases in steps (through endoreplication in Drosophila or fusion in vertebrates), which requires, in theory, that nuclear activity is adjusted to compensate. Changes in cytoplasmic domain sizes have been observed in many growing vertebrate muscles (Murach et al., 2018a); however, how local nuclear synthetic activities correlated with these changes have not been analyzed in detail in whole muscle cells. Our genetic manipulations revealed which size parameters are linked and which are flexible and can compensate for changes in DNA content. Cdt1(Dup)KD nuclei increased nuclear areas despite reduced DNA content and smaller nucleoli; these data suggest changes in nuclear organization, such as chromatin organization, to overcome limitations to the synthetic machinery. MycOE muscle nuclei, in contrast, maintained the ratio of DNA per nuclear area. However, these nuclei lost cumulative nuclear size scaling with cell size (that is, smaller muscle cells than would be predicted) as well as the local coordination of nuclear and nucleolar size scaling. Overall, our data also revealed a surprising dominance of systemic size regulators, such as growth factors (Demontis and Perrimon, 2009), to fulfill the requirements for a specific muscle size. As a consequence, different intracellular phenotypes (different local scaling along the fiber) developed. Drosophila larvae allow for easy, muscle-specific manipulations, and readouts of muscle function, which opens the door for future studies linking specific muscle phenotypes to pathways of intracellular size regulation and to functional consequences.
While using Drosophila larval VL muscles allowed us to perform a relatively straight-forward 2D quantification of muscle cell sizes and nuclear content, most vertebrate muscle fibers are cylindrical in shape with nuclei positioned along the entire fiber at the cell periphery. In addition, Drosophila larval muscle nuclei undergo endoreplication to increase DNA content during muscle growth, while in mice, increasing domain sizes during muscle hypertrophy can trigger increases in DNA content via cell fusion (Murach et al., 2018a; Qaisar and Larsson, 2014). Despite these differences, vertebrate and Drosophila muscles share many structural and functional similarities, which makes our study a suitable framework for understanding size control in different muscle systems. Further, the presence of increased nuclear DNA content has been shown in many differentiated cell types as common mechanisms to achieve large cell sizes (Orr-Weaver, 2015), making it worth testing whether vertebrate muscle nuclei actually maintain a diploid (2c) state. While the molecular mechanisms of intracellular size regulation in muscle fibers await further investigation, our study represents an important step toward optimizing the quantification of muscle cell size and understanding the complex mechanisms of size regulation in multinucleated cells. In this regard, our data should also inform size regulation in other multinucleated cell types such as trophoblasts and osteoclasts and affect our thinking on therapies aimed at affecting muscle growth, homeostasis, and regeneration. Ultimately, identifying the regulatory network that coordinates intracellular size regulation in multinucleated muscle fibers will reveal how disruption of sub-cellular organization results in muscle disease and reduced muscle function.
STAR Methods
CONTACT FOR REAGENT AND RESOURCE SHARING
Further information and request for resources and reagents should be directed to and will be fulfilled by the Lead Contact Mary K. Baylies (m-baylies@ski.mskcc.org).
EXPERIMENTAL MODEL AND SUBJECT DETAILS
Fly stocks and staging
The following Drosophila stocks were maintained under standard laboratory conditions (25 °C) on BDSC cornmeal medium (Bloomington Drosophila Stock Center: https://bdsc.indiana.edu/information/recipes/bloomfood.html): w1118 (Bloomington 3605), Dmef2-GAL4 (Ranganayakulu et al., 1998), UAS-2xEGFP (Bloomington 6874), UAS-GFP RNAi (from J. Zallen, SKI), UAS-dmyc (from N. Perrimon), UAS-dup (double parked/Ctd1) RNAi (from T. Orr-Weaver). Crosses (GAL4 × UAS) were performed at 25 °C on apple juice plates under 12:12 Light:Dark conditions and constant humidity. For all experiments, embryos hatched within a 2h period were selected and raised to third instar larval stage on cornmeal medium at 25°C. Staging of 3rd instar larvae was confirmed using developmental landmarks, including mouth hook and spiracle morphologies. Both male and female larvae were analyzed.
METHOD DETAILS
Dissections, labeling and confocal imaging
Wandering third instar larvae were dissected, fixed in 10% formalin, and labeled as previously described (Metzger et al., 2012). Muscle cells were labeled using Alexa Fluor-conjugated phalloidin (Life Technologies). Anti-Lamin (ADL67.10, DSHB; 1:100), anti-Fibrillarin (MCA-38F3, EnCor; 1:100), anti-H3K9ac (Active Motif; 1:200), anti-discs large (4F3, DSHB; 1:200), anti-alpha tubulin (Sigma, 1:500) primary antibodies and Alexa Flour-conjugated secondary antibodies (Life Technologies; 1:200) were used to label cellular and nuclear structures. Hoechst 33342 (Invitrogen; 1 μg/ml) was used to label nuclear DNA. Whole larvae were mounted in ProlongGold (Invitrogen). VL3 and VL4 muscles in abdominal hemisegments 2-6 were imaged on a LSM 700 confocal microscope (Zeiss). All samples intended for direct comparison were imaged using the same confocal settings.
Image processing and measurements
All images were processed and analyzed using standard ImageJ (FIJI) measurement tools. For 2D quantification of VL3 and VL4 muscles, z-projections of confocal images were used. VL3 and VL4 cell areas were traced by hand, based on phalloidin labeling. Outlines were used to record shapes (aspect ratio; cell width/cell length), sizes (areas), and positions (coordinates) of individual cells. To determine NMJ length, we generated binary images of anti-Discs large labeling and recorded area and position of the NMJ in relation to VL3 and VL4 cells. Automated thresholding of fluorescence intensities of anti-Lamin and/or Hoechst labeling was used to generate binary images of VL nuclei. We recorded the number, size (areas), and position (centroids) of all nuclei within each cell, and we used the binary images as masks to measure Hoechst and H3K9ac fluorescence intensities (sum intensity of pixel density). Further, nuclear centroids were used to calculate nearest neighbor distances and perform Voronoi tessellation (Du et al., 2010). Automated thresholding of anti-Fibrillarin labeling was used to generate binary images of nucleoli and measure nucleolar sizes (areas). For calculation of DNA content, we normalized Hoechst fluorescence intensities of each muscle nucleus to diploid Adult Muscle Progenitors (AMPs) (Figeac et al., 2010) from the same larva. Work from the Orr-Weaver, Spradling, and others labs routinely use DNA stains to estimate DNA content and ploidy (e.g. (Dej and Spradling, 1999; Losick et al., 2013; 2016; Sher et al., 2013; Unhavaithaya and Orr-Weaver, 2012)). Note that the extent of genome replication in polyploid cells has been published for several Drosophila tissues; it is known that not all genomic sequences are equally replicated, as an example, the heterochromatin (20-30% of the genome) is not replicated in tissues like the larval salivary gland and midgut (Nordman et al., 2011). Likewise, it has been determined that in larval salivary gland cells, ovarian follicle cells, and pupal trichogen cells, but not nurse cells, that rRNA genes are not fully replicated. As an example, salivary gland cells contain only one-fourth to one-eighth the expected number of rRNA genes (reviewed in: (Spradling and Orr-Weaver, 1987)).
For 3D measurements of VL cell and nuclei, we determined the average depth/thickness of each cell and of all nuclei from one representative experiment. Volumes were calculated by multiplying thickness values with area measurements.
Simulation of random nuclear positioning
To simulate random positioning of nuclei within VL muscle fibers, we used actual cell parameters of 200 wild-type cells (width, height, number of nuclei) and positioned nuclei randomly following uniform distributions. To assess the influence of stochasticity on our results, we repeated this procedure 1000 times. We calculated mean nearest neighbor distances and standard deviations for VL3 and VL4 nuclei +/− SD. The fits of Gaussians to the data (thick lines) were computed using the measured mean and SD.
Simulation of nuclear positioning
We simulated the positioning of N equally sized nuclei in a rectangular domain that interact with each other and with the cell sides via an isotropic pushing force, decreasing with distance. To underscore the differences between VL3 and VL4 cells, only cells from hemisegments 1-4 were used. Since we are working in a low Reynolds number regime, we can assume a friction-dominated environment, i.e. the velocities of the nuclei are proportional to the forces acting on them. Since we are only interested in equilibrium positions, we can rescale in order to normalize the coefficient of the internuclear interactions to 1. We assume the position of the centroid of the i-th nucleus follows
where dij is the distance between centroids i and j, Nij is the vector of length 1 pointing from nucleus j to nucleus i. For the interactions with the sides, we define dik as the shortest distance between the i-th nucleus and the side with index k (L=left, R=right, U=upper, D=down) and Nik is the unit vector normal to that side pointing towards the i-th nucleus. The scalar function f(d)>0 is a distance dependent pushing force and q is a free parameter describing the ratio between internuclear and nucleus-side forces. We used f(d)=1/d and f(d)=1/d2 To directly compare with the data, we used the same cell widths, heights, and number of nuclei as measured for the experimental data. As initial conditions the real positions were used, since this allows the use of the mean distance between the real and final (equilibrium) positions of the nuclei as an error functional in the simulation. This error was minimized with respect to q. Here only the results using f(d)=1/d2 are shown, which gave a better fit with the data. The error functional was minimal for q=0.7. To simulate, we used Matlab’s ode solver ode15, a variable-step, variable-order solver.
Simulation of space-sensing
We simulated the distribution of a signaling molecule, that is produced at a constant rate everywhere in the cell and diffuses until it is absorbed by a nucleus. For each cell, the real geometry and nuclear positions were used with nuclear radii of 3.8μm. Mathematically, we solve the Poisson equation in 2D within each cell using Neumann boundary conditions at the cell membrane and Dirichlet boundary conditions at the nuclear envelope, i.e. if s(x) is the concentration of the signal at position x, we solve
where ∂N denotes the union of all the boundaries of all nuclei and ∂C is the cell boundary. We solve using a Finite Element Method with an adaptive mesh utilizing Matlab’s PDE toolbox. The amount of signal each nucleus receives, S, was calculated as the integral of the fluxes at its boundary. We assumed a linear relationship between the amount of signal received and the area of the nucleus A:
We fitted the parameters Amin (the minimal nuclear area) and α (the sensitivity) to maximize the correlation between simulated and measured nuclear sizes, yielding Amin=83 μm2 and α=0.044 μm2 per unit signal.
Larval locomotion assay
Third instar larvae were placed in the center of a 10 cm apple juice plate (stained with green food color for better contrast) and recorded for 1 minute using an iPhone SE (Apple) on a custom mount. Each genotype was analyzed in 2 independent experiments; per individual experiment, a minimum of 10 larvae was analyzed. Movies of larval locomotion were processed and quantified in ImageJ using the trackmate plugin. Average velocities (+/− standard deviation) per genotype.
QUANTIFICATION AND STATISTICAL ANALYSIS
Sample sizes were chosen based on previous experience in the laboratory. Each experiment was performed in 2 technical replicas; per individual experiment a minimum of 4 larvae (biological replicates) and at least 8 VL muscles per larva were analyzed. For wild-type analyses, we quantified a total of 102 VL3 and 97 VL4 muscles from three control genotypes (w1118, Dmef2-GAL4;UAS-2xEGFP, Dmef2-GAL4;UAS-GFP RNAi). Two-tailed Student’s t-test and correlation coefficients (R) were computed using GraphPad Prism version 7.0a for Mac (GraphPad Software).
Unsupervised multidimensional cluster analysis
Analysis was performed in R statistical language (Team, 2013). Data was clustered using classical multidimensional scaling (MDS) using cmdscale function with Euclidean distances and default parameters.
Multiple linear regression analysis
To allow for direct comparison of the data and assess which parameters best predict nuclear sizes, we normalized all parameters (see below). The best prediction gave the following linear regression model: normalized (norm.) nuclear area = a + b (norm. Voronoi area) + c (norm. distance to center). Where norm. nuclear area = nuclear area divided by the mean nuclear area in each cell; norm. Voronoi area = Voronoi area divided by the mean Voronoi area in each cell; norm. distance to center is defined between 0 (center) and 1 (poles). We fitted coefficients a,b,c of the linear regression model, yielding a=0.87, b=0.31, c=−0.33. p-values are well below 1% for both variables. R2=0.477. Note that norm. Voronoi area and norm. distance to center are not correlated with each other (R=−0.082).
Supplementary Material
KEY RESOURCES TABLE
| REAGENT or RESOURCE | SOURCE | IDENTIFIER |
|---|---|---|
| Antibodies | ||
| Mouse anti-Lamin | DHSB | ADL67.10 |
| Mouse anti-Fibrillarin1 | EnCore | MCA-38F3 |
| Rabbit anti-H3K9ac | Active Motif | Catalog No: 39138 |
| Mouse anti-Discs Large | DHSB | 4F3 |
| Mouse anti-alpha tubulin | Sigma | DM1A |
| Goat anti-mouse Alexa conjugated secondaries | Life Technologies | |
| Experimental Models: Organisms/Strains | ||
| D. melanogaster: w1118 | Bloomington Drosophila Stock Center | BDSC:3605 |
| D. melanogaster: DMef2-Gal4 | Ranganayakulu et al., 1998 | |
| D. melanogaster: UAS-2×EGFP | Bloomington Drosophila Stock Center | BDSC:6874 |
| D. melanogaster: UAS-GFP RNAi | from J. Zallen (SKI) | |
| D. melanogaster: UAS-dMyc | from N. Perrimon (HMS) | |
| D. melanogaster: UAS-dup (double parked/Cdt1) RNAi | from T. Orr-Weaver (MIT) | |
| Software and Algorithms | ||
| ImageJ/Fiji | Fiji | https://fiji.sc/ |
| GraphPad Prism | GraphPad | https://www.graphpad.com/ |
| Excel | Microsoft | https://products.office.com/en-us/excel |
| Matlab | Mathworks | https://www.mathworks.com/products/matlab.html |
| Imaris | Bitplane | http://www.bitplane.com/imaris/imaris |
| R | R Foundation for Statistical Computing | https://www.r-project.org/ |
| Cytosim | Nédélec Laboratory | http://github.com/nedelec/cytosim |
| Illustrator | Adobe | www.adobe.com |
Highlights.
Muscle nuclei collectively establish precise global scaling with muscle fiber size
Cells contain domains with distinct local scaling of DNA, nuclear and nucleolar sizes
Nucleolar scaling indicates proportionally higher synthetic activity in small nuclei
Changes in DNA content affect nuclear scaling relationships and muscle function
Acknowledgements
We would like to thank T. Orr-Weaver, N. Perrimon, and the Bloomington Stock Center for flies; members of the Baylies Lab for helpful discussion, and particularly M. Azevedo for critical reading of the manuscript; and R. Khanin in the MSKCC Bioinformatics core for the PCA analysis. This work was supported by the NIH [GM121971, AR068128] to MKB and National Cancer Institute [P30 CA 008748] core grant to MSKCC. The funders had no role in the study design, data collection and analysis, decision to publish, or preparation of the manuscript.
Footnotes
Publisher's Disclaimer: This is a PDF file of an unedited manuscript that has been accepted for publication. As a service to our customers we are providing this early version of the manuscript. The manuscript will undergo copyediting, typesetting, and review of the resulting proof before it is published in its final citable form. Please note that during the production process errors may be discovered which could affect the content, and all legal disclaimers that apply to the journal pertain.
Declaration of interests
We have no competing interests to declare.
References
- Amodeo AA, Skotheim JM, 2016. Cell-Size Control. Cold Spring Harbor Perspectives in Biology 8, a019083. doi: 10.1101/cshperspect.a019083 [DOI] [PMC free article] [PubMed] [Google Scholar]
- Boros IM, 2012. Histone modification in drosophila. Briefings in Functional Genomics 11, 319–331. doi: 10.1093/bfgp/els029 [DOI] [PubMed] [Google Scholar]
- Boulan L, Milán M, Léopold P, 2015. The Systemic Control of Growth. Cold Spring Harbor Perspectives in Biology a019117–30. doi: 10.1101/cshperspect.a019117 [DOI] [PMC free article] [PubMed] [Google Scholar]
- Brangwynne CP, 2013. Phase transitions and size scaling of membrane-less organelles. The Journal of cell biology 203, 875–881. doi: 10.1083/jcb.201308087 [DOI] [PMC free article] [PubMed] [Google Scholar]
- Bruusgaard JC, Liestol K, Ekmark M, Kollstad K, Gundersen K, 2003. Number and spatial distribution of nuclei in the muscle fibres of normal mice studied in vivo. The Journal of Physiology 551, 467–478. doi: 10.1113/jphysiol.2003.045328 [DOI] [PMC free article] [PubMed] [Google Scholar]
- Chan Y-HM, Marshall WF, 2012. How cells know the size of their organelles. Science (New York, N.Y.) 337, 1186–1189. doi: 10.1126/science.1223539 [DOI] [PMC free article] [PubMed] [Google Scholar]
- Conklin EG, 1912. Cell size and nuclear size. Journal of Experimental Zoology 12, 1–98. doi: 10.1002/jez.1400120102 [DOI] [Google Scholar]
- Dej KJ, Spradling AC, 1999. The endocycle controls nurse cell polytene chromosome structure during Drosophila oogenesis. Development 126, 293–303. [DOI] [PubMed] [Google Scholar]
- Demontis F, Perrimon N, 2009. Integration of Insulin receptor/Foxo signaling and dMyc activity during muscle growth regulates body size in Drosophila. Development (Cambridge, England) 136, 983–993. doi: 10.1242/dev.027466 [DOI] [PMC free article] [PubMed] [Google Scholar]
- Demontis F, Piccirillo R, Goldberg AL, Perrimon N, 2013. Mechanisms of skeletal muscle aging: insights from Drosophila and mammalian models. Dis Model Mech 6, 1339–1352. doi: 10.1242/dmm.012559 [DOI] [PMC free article] [PubMed] [Google Scholar]
- Deng S, Azevedo M, Baylies M, 2017. Acting on identity: Myoblast fusion and the formation of the syncytial muscle fiber. Seminars in Cell & Developmental Biology 72, 45–55. doi: 10.1016/j.semcdb.2017.10.033 [DOI] [PMC free article] [PubMed] [Google Scholar]
- Dobi KC, Schulman VK, Baylies MK, 2015. Specification of the somatic musculature in Drosophila. Wiley interdisciplinary reviews. Developmental biology 4, 357–375. doi: 10.1002/wdev.182 [DOI] [PMC free article] [PubMed] [Google Scholar]
- Du Q, Gunzburger M, Ju L, 2010. Advances in studies and applications of Centroidal Voronoi tessellations. Numerical Mathematics 3, 119–142. doi: 10.4208/nmtma.2010.32s.1 [DOI] [Google Scholar]
- Eaton ML, Prinz JA, MacAlpine HK, Tretyakov G, Kharchenko PV, MacAlpine DM, 2011. Chromatin signatures of the Drosophila replication program. Genome Research 21, 164–174. doi: 10.1101/gr.116038.110 [DOI] [PMC free article] [PubMed] [Google Scholar]
- Figeac N, Jagla T, Aradhya R, Da Ponte JP, Jagla K, 2010. Drosophila adult muscle precursors form a network of interconnected cells and are specified by the rhomboid-triggered EGF pathway. Development (Cambridge, England) 137, 1965–1973. doi: 10.1242/dev.049080 [DOI] [PubMed] [Google Scholar]
- Folker ES, Baylies MK, 2013. Nuclear positioning in muscle development and disease. Front Physiol 4, 363. doi: 10.3389/fphys.2013.00363 [DOI] [PMC free article] [PubMed] [Google Scholar]
- Frawley LE, Orr-Weaver TL, 2015. Polyploidy. Curr. Biol 25, R353–8. doi: 10.1016/j.cub.2015.03.037 [DOI] [PubMed] [Google Scholar]
- Ganesan S, Karr JE, Featherstone DE, 2011. Drosophila glutamate receptor mRNA expression and mRNP particles. RNA Biol 8, 771–781. doi: 10.4161/rna.8.5.16014 [DOI] [PMC free article] [PubMed] [Google Scholar]
- Gillooly JF, Hein A, Damiani R, 2015. Nuclear DNA Content Varies with Cell Size across Human Cell Types. Cold Spring Harbor Perspectives in Biology 7, a019091–28. doi: 10.1101/cshperspect.a019091 [DOI] [PMC free article] [PubMed] [Google Scholar]
- Ginzberg MB, Kafri R, Kirschner M, 2015. Cell biology. On being the right (cell) size. Science (New York, N.Y.) 348, 1245075–1245075. doi: 10.1126/science.1245075 [DOI] [PMC free article] [PubMed] [Google Scholar]
- Grewal SS, Li L, Orian A, Eisenman RN, Edgar BA, 2005. Myc-dependent regulation of ribosomal RNA synthesis during Drosophila development. Nature cell biology 7, 295–302. doi: 10.1038/ncb1223 [DOI] [PubMed] [Google Scholar]
- Gundersen GG, Worman HJ, 2013. Nuclear Positioning. Cell 152, 1376–1389. doi: 10.1016/j.cell.2013.02.031 [DOI] [PMC free article] [PubMed] [Google Scholar]
- Gundersen K, 2016. Muscle memory and a new cellular model for muscle atrophy and hypertrophy. J. Exp. Biol 219, 235–242. doi: 10.1242/jeb.124495 [DOI] [PubMed] [Google Scholar]
- Keshishian H, Broadie K, A Chiba A, Bate M, 2003. The Drosophila Neuromuscular Junction: A Model System for Studying Synaptic Development and Function. 10.1146/annurev.ne.19.030196.002553 19, 545–575. doi: 10.1146/annurev.ne.19.030196.002553 [DOI] [PubMed] [Google Scholar]
- Hall ZW, Ralston E, 1989. Nuclear domains in muscle cells. Cell 59, 771–772. doi: 10.1016/0092-8674(89)90597-7 [DOI] [PubMed] [Google Scholar]
- Jevtić P, Levy DL, 2014. Mechanisms of nuclear size regulation in model systems and cancer. Advances in experimental medicine and biology 773, 537–569. doi: 10.1007/978-1-4899-8032-8_25 [DOI] [PubMed] [Google Scholar]
- Kirby TJ, Patel RM, McClintock TS, Dupont-Versteegden EE, Peterson CA, McCarthy JJ, 2016. Myonuclear transcription is responsive to mechanical load and DNA content but uncoupled from cell size during hypertrophy. Molecular Biology of the Cell 27, 788–798. doi: 10.1091/mbc.E15-08-0585 [DOI] [PMC free article] [PubMed] [Google Scholar]
- Levy DL, Heald R, 2012. Mechanisms of intracellular scaling. Annual Review of Cell and Developmental Biology 28, 113–135. doi: 10.1146/annurev-cellbio-092910-154158 [DOI] [PubMed] [Google Scholar]
- Losick VP, Fox DT, Spradling AC, 2013. Polyploidization and cell fusion contribute to wound healing in the adult Drosophila epithelium. Curr. Biol 23, 2224–2232. doi : 10.1016/j.cub.2013.09.029 [DOI] [PMC free article] [PubMed] [Google Scholar]
- Losick VP, Jun AS, Spradling AC, 2016. Wound-Induced Polyploidization: Regulation by Hippo and JNK Signaling and Conservation in Mammals. PloS one 11, e0151251–20. doi: 10.1371/journal.pone.0151251 [DOI] [PMC free article] [PubMed] [Google Scholar]
- Ma T-H, Lee L-W, Lee C-C, Yi Y-H, Chan S-P, Tan BC-M, Lo SJ, 2016. Genetic control of nucleolar size: An evolutionary perspective. Nucleus 7, 112–120. doi: 10.1080/19491034.2016.1166322 [DOI] [PMC free article] [PubMed] [Google Scholar]
- Malfatti E, Romero NB, 2017. Diseases of the skeletal muscle. Handb Clin Neurol 145, 429–451. doi: 10.1016/B978-0-12-802395-2.00030-4 [DOI] [PubMed] [Google Scholar]
- Manhart A, Windner S, Baylies M, Mogilner A, 2018. Mechanical positioning of multiple nuclei in muscle cells. PLoS Comput Biol 14, e1006208. doi: 10.1371/journal.pcbi.1006208 [DOI] [PMC free article] [PubMed] [Google Scholar]
- Merlie JP, Sanes JR, 1985. Concentration of acetylcholine receptor mRNA in synaptic regions of adult muscle fibres. Nature 317, 66–68. [DOI] [PubMed] [Google Scholar]
- Metzger T, Gache V, Xu M, Cadot B, Folker ES, Richardson BE, Gomes ER, Baylies MK, 2012. MAP and kinesin-dependent nuclear positioning is required for skeletal muscle function. Nature 484, 120–124. doi: 10.1038/nature10914 [DOI] [PMC free article] [PubMed] [Google Scholar]
- Miettinen TP, Pessa HKJ, Caldez MJ, Fuhrer T, Diril MK, Sauer U, Kaldis P, Bjorklund M, 2014. Identification of Transcriptional and Metabolic Programs Related to Mammalian Cell Size. Current Biology 24, 598–608. doi: 10.1016/j.cub.2014.01.071 [DOI] [PMC free article] [PubMed] [Google Scholar]
- Mukherjee RN, Chen P, Levy DL, 2016. Recent advances in understanding nuclear size and shape. Nucleus 7, 167–186. doi: 10.1080/19491034.2016.1162933 [DOI] [PMC free article] [PubMed] [Google Scholar]
- Murach KA, Englund DA, Dupont-Versteegden EE, McCarthy JJ, Peterson CA, 2018a. Myonuclear Domain Flexibility Challenges Rigid Assumptions on Satellite Cell Contribution to Skeletal Muscle Fiber Hypertrophy. Front Physiol 9, 635. doi: 10.3389/fphys.2018.00635 [DOI] [PMC free article] [PubMed] [Google Scholar]
- Murach KA, Fry CS, Kirby TJ, Jackson JR, Lee JD, White SH, Dupont-Versteegden EE, McCarthy JJ, Peterson CA, 2018b. Starring or Supporting Role? Satellite Cells and Skeletal Muscle Fiber Size Regulation. Physiology (Bethesda) 33, 26–38. doi: 10.1152/physiol.00019.2017 [DOI] [PMC free article] [PubMed] [Google Scholar]
- Neumüller RA, Gross T, Samsonova AA, Vinayagam A, Buckner M, Founk K, Hu Y, Sharifpoor S, Rosebrock AP, Andrews B, Winston F, Perrimon N, 2013. Conserved regulators of nucleolar size revealed by global phenotypic analyses. Science signaling 6, ra70–ra70. doi: 10.1126/scisignal.2004145 [DOI] [PMC free article] [PubMed] [Google Scholar]
- Nordman J, Li S, Eng T, Macalpine D, Orr-Weaver TL, 2011. Developmental control of the DNA replication and transcription programs. Genome Research 21, 175–181. doi: 10.1101/gr.114611.110 [DOI] [PMC free article] [PubMed] [Google Scholar]
- Packard M, Jokhi V, Ding B, Ruiz-Cañada C, Ashley J, Budnik V, 2015. Nucleus to Synapse Nesprin1 Railroad Tracks Direct Synapse Maturation through RNA Localization. Neuron 86, 1015–1028. doi: 10.1016/j.neuron.2015.04.006 [DOI] [PMC free article] [PubMed] [Google Scholar]
- Pavlath GK, Rich K, Webster SG, Blau HM, 1989. Localization of muscle gene products in nuclear domains. Nature 337, 570–573. doi: 10.1038/337570a0 [DOI] [PubMed] [Google Scholar]
- Peng JC, Karpen GH, 2007. H3K9 methylation and RNA interference regulate nucleolar organization and repeated DNA stability. Nature cell biology 9, 25–35. doi: 10.1038/ncb1514 [DOI] [PMC free article] [PubMed] [Google Scholar]
- Penzo-Méndez AI, Stanger BZ, 2015. Organ-Size Regulation in Mammals. Cold Spring Harbor Perspectives in Biology 7, a019240–13. doi: 10.1101/cshperspect.a019240 [DOI] [PMC free article] [PubMed] [Google Scholar]
- Piccirillo R, Demontis F, Perrimon N, Goldberg AL, 2014. Mechanisms of muscle growth and atrophy in mammals and Drosophila. Dev. Dyn 243, 201–215. doi: 10.1002/dvdy.24036 [DOI] [PMC free article] [PubMed] [Google Scholar]
- Pierce SB, Yost C, Britton JS, Loo LWM, Flynn EM, Edgar BA, Eisenman RN, 2004. dMyc is required for larval growth and endoreplication in Drosophila. Development (Cambridge, England) 131, 2317–2327. doi: 10.1242/dev.01108 [DOI] [PubMed] [Google Scholar]
- Qaisar R, Larsson L, 2014. What determines myonuclear domain size? Indian J. Physiol. Pharmacol 58, 1–12. [PubMed] [Google Scholar]
- Ranganayakulu G, Elliott DA, Harvey RP, Olson EN, 1998. Divergent roles for NK-2 class homeobox genes in cardiogenesis in flies and mice. Development 125, 3037–3048. doi: 10.1101/gad.7.7b.1325 [DOI] [PubMed] [Google Scholar]
- Roman W, Gomes ER, 2017. Nuclear positioning in skeletal muscle. Seminars in Cell & Developmental Biology. doi: 10.1016/j.semcdb.2017.11.005 [DOI] [PubMed] [Google Scholar]
- Rosser B, Bandman E, 2003. Heterogeneity of protein expression within muscle fibers. American Society of Animal Science. doi: 10.2527/2003.8114_suppl_2E94x [DOI] [Google Scholar]
- Rosser BWC, Dean MS, Bandman E, 2002. Myonuclear domain size varies along the lengths of maturing skeletal muscle fibers. Int. J. Dev. Biol 46, 747–754. [PubMed] [Google Scholar]
- Rudra D, Warner JR, 2004. What better measure than ribosome synthesis? Genes & development 18, 2431–2436. doi: 10.1101/gad.1256704 [DOI] [PubMed] [Google Scholar]
- Schreiber KH, Kennedy BK, 2013. When lamins go bad: nuclear structure and disease. Cell 152, 1365–1375. doi: 10.1016/j.cell.2013.02.015 [DOI] [PMC free article] [PubMed] [Google Scholar]
- Schulman VK, Dobi KC, Baylies MK, 2015. Morphogenesis of the somatic musculature in Drosophila melanogaster. Wiley interdisciplinary reviews. Developmental biology 4, 313–334. doi: 10.1002/wdev.180 [DOI] [PMC free article] [PubMed] [Google Scholar]
- Sher N,Von Stetina, JR, Bell GW, Matsuura S, Ravid K, Orr-Weaver TL, 2013. Fundamental differences in endoreplication in mammals and Drosophila revealed by analysis of endocycling and endomitotic cells. Proceedings of the National Academy of Sciences of the United States of America 110, 9368–9373. doi: 10.1073/pnas.1304889110 [DOI] [PMC free article] [PubMed] [Google Scholar]
- Spradling A, Orr-Weaver T, 1987. Regulation of DNA replication during Drosophila development. Annu. Rev. Genet 21, 373–403. doi: 10.1146/annurev.ge.21.120187.002105 [DOI] [PubMed] [Google Scholar]
- Team RC, 2013. R: A language and environment for statistical computing. [Google Scholar]
- Unhavaithaya Y, Orr-Weaver TL, 2012. Polyploidization of glia in neural development links tissue growth to blood-brain barrier integrity. Genes & development 26, 31–36. doi: 10.1101/gad.177436.111 [DOI] [PMC free article] [PubMed] [Google Scholar]
- Uppaluri S, Weber SC, Brangwynne CP, 2016. Hierarchical Size Scaling during Multicellular Growth and Development. Cell Reports 17, 345–352. doi: 10.1016/j.celrep.2016.09.007 [DOI] [PubMed] [Google Scholar]
- Van der Meer SFT, Jaspers RT, Degens H, 2011. Is the myonuclear domain size fixed? Journal of musculoskeletal & neuronal interactions 11, 286–297. [PubMed] [Google Scholar]
- Weber SC, Brangwynne CP, 2015. Inverse size scaling of the nucleolus by a concentration-dependent phase transition. Curr. Biol 25, 641–646. doi: 10.1016/j.cub.2015.01.012 [DOI] [PMC free article] [PubMed] [Google Scholar]
- Whittaker AJ, Royzman I, Orr-Weaver TL, 2000. Drosophila double parked: a conserved, essential replication protein that colocalizes with the origin recognition complex and links DNA replication with mitosis and the down-regulation of S phase transcripts. Genes & development 14, 1765–1776. [PMC free article] [PubMed] [Google Scholar]
- Yi Y-H, Ma T-H, Lee L-W, Chiou P-T, Chen P-H, Lee C-M, Chu Y-D, Yu H, Hsiung K-C, Tsai Y-T, Lee C-C, Chang Y-S, Chan S-P, Tan BC-M, Lo SJ, 2015. A Genetic Cascade of let-7-ncl-1-fib-1 Modulates Nucleolar Size and rRNA Pool in Caenorhabditis elegans. PLoS genetics 11, e1005580. doi: 10.1371/journal.pgen.1005580 [DOI] [PMC free article] [PubMed] [Google Scholar]
Associated Data
This section collects any data citations, data availability statements, or supplementary materials included in this article.