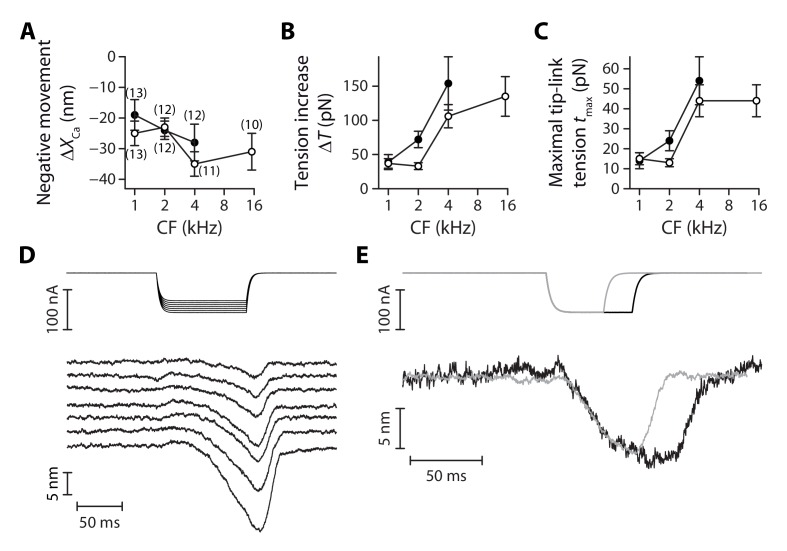
Figure 6. Tensioning of the tip links at decreased Ca2+ concentrations.
The amplitude of the negative hair-bundle movement (A), of the maximal increase in hair-bundle tension (B), and of the maximal tension in a single tip link (C) are plotted as a function of the hair cell’s characteristic frequency (CF). The tension increase in (B) was calculated from the stiffness of the stereociliary pivots (Figure 3B) and the data shown in (A). The single tip-link tension was then deduced from the tension at rest in a single tip link (Figure 5c), the projection factor (Figure 3—figure supplement 2) and the average number of intact tip links (Figure 3—figure supplement 3). (D) Current-step commands (top) applied to an iontophoretic pipette containing the Ca2+ chelator EDTA evoked reversible negative movements of the hair bundle (bottom). (E) When the stimulus (top) was long enough, the hair bundle position could reach a steady state (bottom), corresponding to higher resting tension in the tip links. In (A–C), the hair bundles were immersed in low-Ca2+ saline, for which EDTA iontophoresis led to tip-link disruption. Positions and tensions were estimated at the point of polarity reversal of the hair-bundle movement (see Figure 4A), thus at the initiation of tip-link disruption, where the hair bundle reached its largest deflection in the negative direction and tension was thus maximal. Black and white disks correspond to outer and inner hair cells, respectively. Each data point in (A) is the mean ± SEM with numbers of cells indicated between brackets; in (B–C), mean values and SEMs were calculated as described in the Materials and methods. In (D–E), the hair bundles were immersed in a saline containing 500-µM Ca2+; this higher Ca2+ concentration preserved the integrity of the tip links upon EDTA iontophoresis.

