

Abstract
Background
Interferons‐beta (IFNs‐beta) and glatiramer acetate (GA) were the first two disease‐modifying therapies (DMTs) approved 20 years ago for the treatment of multiple sclerosis (MS). DMTs' prescription rates as first or switching therapies and their costs have both increased substantially over the past decade. As more DMTs become available, the choice of a specific DMT should reflect the risk/benefit profile, as well as the impact on quality of life. As MS cohorts enrolled in different studies can vary significantly, head‐to‐head trials are considered the best approach for gaining objective reliable data when two different drugs are compared. The purpose of this systematic review is to summarise available evidence on the comparative effectiveness of IFNs‐beta and GA on disease course through the analysis of head‐to‐head trials.
This is an update of the Cochrane review 'Interferons‐beta versus glatiramer acetate for relapsing‐remitting multiple sclerosis' (first published in the Cochrane Library 2014, Issue 7).
Objectives
To assess whether IFNs‐beta and GA differ in terms of safety and efficacy in the treatment of people with relapsing‐remitting (RR) MS.
Search methods
We searched the Trials Register of the Cochrane Multiple Sclerosis and Rare Diseases of the CNS Group (08 August 2016) and the reference lists of retrieved articles. We contacted authors and pharmaceutical companies.
Selection criteria
Randomised controlled trials (RCTs) comparing directly IFNs‐beta versus GA in study participants affected by RRMS.
Data collection and analysis
We used standard methodological procedures as expected by Cochrane.
Main results
Six trials were included and five trials contributed to this review with data. A total of 2904 participants were randomly assigned to IFNs (1704) and GA (1200). The treatment duration was three years for one study, two years for the other four RCTs while one study was stopped early (after one year). The IFNs analysed in comparison with GA were IFN‐beta 1b 250 mcg (two trials, 933 participants), IFN‐beta 1a 44 mcg (three trials, 466 participants) and IFN‐beta 1a 30 mcg (two trials, 305 participants). Enrolled participants were affected by active RRMS. All studies were at high risk for attrition bias. Three trials are still ongoing, one of them completed.
Both therapies showed similar clinical efficacy at 24 months, given the primary outcome variables (number of participants with relapse (risk ratio (RR) 1.04, 95% confidence interval (CI) 0.87 to 1.24) or progression (RR 1.11, 95% CI 0.91 to 1.35). However at 36 months, evidence from a single study suggests that relapse rates were higher in the group given IFNs than in the GA group (RR 1.40, 95% CI 1.13 to 1.74, P value 0.002).
Secondary magnetic resonance imaging (MRI) outcomes analysis showed that effects on new or enlarging T2‐ or new contrast‐enhancing T1 lesions at 24 months were similar (mean difference (MD) −0.15, 95% CI −0.68 to 0.39, and MD −0.14, 95% CI −0.30 to 0.02, respectively). However, the reduction in T2‐ and T1‐weighted lesion volume was significantly greater in the groups given IFNs than in the GA groups (MD −0.58, 95% CI −0.99 to −0.18, P value 0.004, and MD −0.20, 95% CI −0.33 to −0.07, P value 0.003, respectively).
The number of participants who dropped out of the study because of adverse events was similar in the two groups (RR 0.95, 95% CI 0.64 to 1.40).
The quality of evidence for primary outcomes was judged as moderate for clinical end points, but for safety and some MRI outcomes (number of active T2 lesions), quality was judged as low.
Authors' conclusions
The effects of IFNs‐beta and GA in the treatment of people with RRMS, including clinical (e.g. people with relapse, risk to progression) and MRI (Gd‐enhancing lesions) measures, seem to be similar or to show only small differences. When MRI lesion load accrual is considered, the effect of the two treatments differs, in that IFNs‐beta were found to limit the increase in lesion burden as compared with GA. Evidence was insufficient for a comparison of the effects of the two treatments on patient‐reported outcomes, such as quality‐of‐life measures.
Plain language summary
A comparison of the effectiveness and safety of the two most common therapies for people with multiple sclerosis (MS)
Background This is an update of the Cochrane review 'Interferons‐beta versus glatiramer acetate for relapsing‐remitting multiple sclerosis' (first published in the Cochrane Library 2014, Issue 7).
At present, the therapeutic choice for people with MS requires informed discussion on the equivalence of therapeutic agents. This study is important because it is the first report evaluating through a direct comparison whether two treatments, interferons‐beta (IFNs‐beta) and glatiramer acetate (GA), have the same effect on the disease course. Study characteristics We searched medical databases for studies in which neither participants nor researchers were told which treatment was given (randomised double‐blind trials). The efficacy of the two therapies was considered in terms of occurrence of relapse and progression of disease. Key results and quality of evidence Up to August 2016, we found six studies comprising 2904 participants (1704 treated with IFNs; 1200 with GA) that met our inclusion criteria requirements. We found that the two therapies seemed to have similar effects or only small differences in the occurrence of relapse or progression. The quality of evidence was moderate overall, although in terms of the safety profile the quality of evidence was low. The risk for incomplete outcome data was found to be high, as some studies present incomplete reporting of adverse events and numbers of participants who dropped out. It is worth noting that all studies but one were sponsored by the drug industry. Furthermore, all of the studies were short‐term, with a treatment duration of three years for one study and two years for the other four, while one study was stopped early after one year.
Summary of findings
Summary of findings for the main comparison. Interferons compared with glatiramer acetate for participants with relapsing‐remitting multiple sclerosis.
| interferons compared with glatiramer acetate for participants with relapsing‐remitting multiple sclerosis | ||||||
| Patient or population: people with relapsing‐remitting multiple sclerosis Settings: secondary care Intervention: interferons Comparison: glatiramer acetate | ||||||
| Outcomes | Illustrative comparative risks* (95% CI) | Relative effect (95% CI) | No. of participants (studies) | Quality of the evidence (GRADE) | Comments | |
| Assumed risk (control) | Corresponding risk (intervention) | |||||
| Glatiramer acetate | Interferons | |||||
|
Number of participants with relapse
Risk ratio (M‐H, random, 95% CI) Follow‐up: 24 months |
Study population | RR 1.04 (0.87 to 1.24) | 2184 (3 studies) | ⊕⊕⊕⊝ moderatea | Detection bias risk for clinical outcomes was judged as high for 1 study and low for the other 2 RCTs | |
| 36 per 100 | 38 per 100 (31 to 45) | |||||
| Moderate | ||||||
| 35 per 100 | 36 per 100 (30 to 43) | |||||
|
Number of participants with confirmed progression
Risk ratio (M‐H, random, 95% CI) Follow‐up: 24 months |
Study population | RR 1.11 (0.91 to 1.35) | 2169 (3 studies) | ⊕⊕⊕⊝ moderatea | Detection bias risk for clinical outcomes was judged as high for 1 study and low for the other 2 RCTs | |
| 15 per 100 | 16 per 100 (13 to 20) | |||||
| Moderate | ||||||
| 15 per 100 | 17 per 100 (14 to 21) | |||||
|
Number of participants who dropped out for AEs
Risk ratio (M‐H, random, 95% CI) Follow‐up: 24 months |
Study population | RR 0.95 (0.64 to 1.4) | 2685 (4 studies) | ⊕⊕⊝⊝ lowa,b | ||
| 4 per 100 | 4 per 100 (3 to 6) | |||||
| Moderate | ||||||
| 5 per 100 | 5 per 100 (3 to 7) | |||||
| Mean number of active T2 lesions Mean difference (IV, random, 95% CI) Follow‐up: 24 months | 0.15 lower in IFN versus GA groups (0.68 lower to 0.39 higher) | 1790 (3 studies) | ⊕⊕⊝⊝ lowb,c | Detection bias risk for MRI outcomes was judged as low for all studies | ||
| Mean number of new enhancing lesions Mean difference (IV, random, 95% CI) Follow‐up: 24 months | 0.14 lower in IFN versus GA groups (0.3 lower to 0.02 higher) | 1734 (3 studies) | ⊕⊕⊕⊝ moderated | Detection bias risk for MRI outcomes was judged as low for all studies | ||
| Mean change in total T2‐hyperintense lesion load Mean difference (IV, random, 95% CI) Follow‐up: 24 months | 0.58 lower in IFN versus GA groups (0.99 to 0.18 lower) | 1608 (2 studies) | ⊕⊕⊕⊝ moderated | Detection bias risk for MRI outcomes was judged as low for both studies | ||
| Mean change in total T1‐hypointense lesion load Follow‐up: 24 months | −0.20 lower in IFN versus GA groups (−0.33 to −0.07) | 1602 (2 studies) | ⊕⊕⊕⊝ moderated | Detection bias risk for MRI outcomes was judged as low for both studies | ||
| *The basis for the assumed risk (e.g. median control group risk (GA) across studies) is provided in footnotes. The corresponding risk (and its 95% confidence interval) is based on the assumed risk in the comparison group (IFNs) and the relative effect of the intervention (and its 95% CI). CI: Confidence interval; RR: Risk ratio. | ||||||
| GRADE Working Group grades of evidence. High quality: Further research is very unlikely to change our confidence in the estimate of effect. Moderate quality: Further research is likely to have an important impact on our confidence in the estimate of effect and may change the estimate. Low quality: Further research is very likely to have an important impact on our confidence in the estimate of effect and is likely to change the estimate. Very low quality: We are very uncertain about the estimate. | ||||||
aHigh risk of attrition bias. bWide 95% confidence intervals. cSignificant heterogeneity of results. dEffect size of uncertain value.
Background
This is an update of the Cochrane review 'Interferons‐beta versus glatiramer acetate for relapsing‐remitting multiple sclerosis' (first published in The Cochrane Library 2014, Issue 7).
Description of the condition
Multiple sclerosis (MS) is the most important non‐traumatic cause of neurological disability in young adults. It is widely considered an immune‐mediated inflammatory disease of the central nervous system (CNS). The overall incidence rate of MS is between 3.5 and 6.6 per 100,000, and the prevalence is between 100 and 120 people per 100,000 (Alonso 2008; Richards 2002). After the first clinical episode (clinically isolated syndrome (CIS)), about 50% of people develop MS within six years (Chard 2011). MS commonly follows a relapsing‐remitting (RR) course, but after 10 years, about 50% of people with RRMS convert to a secondary progressive (SP) phase (Weinshenker 1989), which is characterised by progressive disability with or without superimposed relapses.
Disease‐modifying therapies (DMTs) are approved worldwide as therapeutic options for RRMS (Goodin 2008b; Weinstock‐Guttman 2008), although recent systematic reviews of placebo‐controlled trials have questioned their effectiveness, showing partial efficacy for exacerbation and disease progression (La Mantia 2010; Rice 2001). The first two DMTs, recombinant interferons‐beta (IFNs‐beta) and glatiramer acetate (GA), became available 20 years ago. In the Canadian provinces between 2002 and 2007, subcutaneous IFN‐beta 1a was the most commonly used drug, whereas GA showed the greatest growth in use (Rotstein 2010). Interferon‐beta 1a gained the greatest number of users in the United States between 2002 and 2008, whereas GA showed the greatest growth in use for therapy switches (Oleen‐Burkey 2013).
Today these drugs remain in worldwide use for the treatment of MS (Jelinek 2015). Persistence with injectable DMTs was found to be high in an 18‐year population‐based study, median time to discontinuation being 11.1 years, with a stop/switch rate of 46% for GA and 56% for IFN‐beta (Zhornitsky 2015).
Description of the intervention
Recombinant IFN‐beta products licensed for MS treatment include two IFN‐beta 1b preparations (Betaferon® (Bayer) (FDA 1993); and Extavia® (Novartis) (FDA 2009)) and three IFN‐beta 1a preparations: Avonex® (Biogen Idec) (FDA 1996); Rebif® (EMD Serono/Pfizer) (FDA 2002); and Plegridy® (Biogen Idec) (FDA 2014).
IFN‐beta 1b is a lyophilised protein produced by DNA recombinant technology using Escherichia coli. The approved dose is 250 mcg every other day by subcutaneous (SC) injection.
IFN‐beta 1a is a lyophilised glycoprotein produced in mammalian cells by using the natural human gene sequence. Three preparations are licensed for the treatment of MS: 30 mcg once a week administered by intramuscular (IM) injection (Avonex®); 22 or 44 mcg administered three times a week by SC injection (Rebif®); and 125 micrograms injected subcutaneously every 14 days (peginterferon‐beta 1a, Plegridy®)
GA, formerly known as co‐polymer‐1, is a random polymer of four amino acids: L‐alanine, L‐glutamic acid, L‐lysine and L‐tyrosine. It was the first non‐IFN drug approved for the treatment of MS (FDA 2001). The approved dose of GA (Copaxone® (Teva Pharmaceuticals)) is 20 mg administered subcutaneously every day.
How the intervention might work
Large placebo‐controlled, randomised double‐blind trials have demonstrated the efficacy of different forms of IFN‐beta in study participants with RRMS, as assessed by clinical evaluation and magnetic resonance imaging (MRI) (IFN MSSG 1995; Jacobs 1996; PRISMS 1998). The mechanisms of action of IFN‐beta 1b and 1a are not completely understood. Potential mechanisms include regulation of immune cell activation and proliferation, auto‐reactive T‐cell apoptosis, induction of anti‐inflammatory cytokine shifts, inhibition of immune cell trafficking across the blood‐brain barrier and antiviral activity (Dhib‐Jalbut 2010).
GA showed significant efficacy in people with RRMS, reducing the relapse rate and MRI disease activity (Comi 2001; Johnson 1995). The efficacy of GA is considered due to inhibition of the immune response to myelin basic protein and possibly other myelin antigens. Generating suppressor cells, inducing tolerance, expanding regulatory T‐cell populations and altering antigen‐presenting cells seem to be involved in the mechanism of action (Racke 2010).
Why it is important to do this review
The choice of specific DMTs remains a relevant issue, and the final decision should be based on a thorough evaluation of the risk/benefit profile, impact on quality of life and potential neuroprotective and long‐term effects of a given drug (Compston 2008). At present, no clear evidence can be found on the relative efficacy of different DMTs in the treatment of people with RRMS. Comparative trials remain the best tool for acquiring objective information; however, they are difficult to run for several reasons, including the difficulty of achieving proper blinding and the need for large sample sizes (Goodin 2008a).
Although new approved drugs are currently available, IFNs and GA are still used worldwide to treat MS (Jelinek 2015), drug‐persistence is considerable and patients may also resume injectable DMT after suspension for different reasons (Zhornitsky 2015). Specific details on their relative efficacy and tolerability may help physicians make a more precise and unbiased therapeutic choice for their patients.
Dose‐dependent clinical and MRI efficacy of IFNs in RRMS treatment has been suggested, but this study did not analyse the role of GA (Oliver 2010). Differences in the safety profile of immunomodulatory treatments were observed, in particular more favourable skin tolerance with intramuscularly administered IFNs‐beta and a better systemic adverse event profile for GA (Ouallet 2010).
Direct comparative data evaluating IFNs‐beta and GA for RRMS are now available (Goodin 2008b), but no systematic reviews of head‐to‐head trials of IFNs versus GA have been performed.
Objectives
To assess whether IFNs‐beta and GA differ in terms of efficacy and safety in the treatment of people with relapsing‐remitting (RR) MS.
Methods
Criteria for considering studies for this review
Types of studies
We included randomised, double‐blind or single‐blind and open‐label active control trials, as well as cross‐over trials, comparing all types of IFNs versus GA in participants with relapsing‐remitting multiple sclerosis (RRMS). Studies including participants with secondary progressive multiple sclerosis (SPMS) were excluded.
Quasi‐randomised and cross‐over trials were acceptable but were not found. Randomised controlled trials (RCTs) designed with multiple groups were included only with regard to data provided by groups given GA and IFNs. Uncontrolled non‐randomised trials, add‐on trials (i.e. trials with drug associations) and observational studies were excluded. Trials with a follow‐up period shorter than three months were excluded.
Trials comparing head‐to‐head different types and dosages of IFNs without a GA arm were excluded.
Types of participants
People of any age, gender and race affected by RRMS according to Poser 1983's or McDonald's criteria were included (McDonald 2001; Polman 2005; Polman 2011).
A relapsing‐remitting course is characterised by relapses and remissions, with or without complete recovery between relapses.
Study participants had to have an Expanded Disability Status Scale (EDSS) score of 0 to 6.0 (Kurtzke 1983).
Types of interventions
We included trials in which participants received recombinant IFN‐beta 1a (Rebif®, Avonex®) or IFN‐beta 1b (Betaferon®, Betaseron®, Extavia®) at any dose and by any route of administration in any setting.
Comparison: GA at any dose, route of administration and setting.
For trials comparing multiple groups of participants, only the following designs were considered.
IFN‐beta 1a versus IFN‐beta 1b versus GA.
GA (dose 1) versus GA (dose 2) versus IFNs‐beta.
GA versus IFNs‐beta (dose 1) versus IFNs‐beta (dose 2).
Treatment duration had to be at least three months.
Types of outcome measures
Primary outcomes
CLINICAL EFFICACY OUTCOMES
1. Number of participants who experienced at least one relapse at 12 to 24 months and at the end of follow‐up.
2. Number of participants whose condition worsened during the study; we defined worsening as a 0.5‐point increase from starting EDSS score equal to or greater than 5.5; or a 1‐point increase from starting EDSS score equal to or less than 5.0 (Kurtzke 1983). Worsening must have been confirmed during two subsequent neurological examinations separated by at least six months free of relapses (Rudick 2010). We attempted to ascertain confirmed worsening at 12 to 18 months; at 24 months; and at the end of follow‐up. Less stringent criteria (such as an increase in EDSS score sustained for three months) were considered.
CLINICAL SAFETY OUTCOMES
3. Number of participants who withdrew from or dropped out of the study because of adverse events (AEs), defined according to the Cochrane Handbook for Systematic Reviews of Interventions as unfavourable outcomes that occur during or after use of a drug but not necessarily caused by it, and/or as ‘side effects’ (any unintended effects, adverse or beneficial, of a drug that occur at doses normally used for treatment) (Higgins 2011). Serious adverse events (SAEs) were included and were defined according to the US Food and Drug Administration (FDA) as participant outcomes such as death, life‐threatening events, hospitalisation, disability, permanent damage or congenital anomaly/birth defect (FDA 2013).
Secondary outcomes
CLINICAL OUTCOMES
4. Frequency of relapse (number of relapses/patient‐year: annual relapse rate (ARR) was defined as the total number of relapses across all participants divided by total time on the study across all participants). Relapse was defined as newly developed or recently worsened symptoms of neurological dysfunction, with objective confirmation, lasting longer than 24 hours. Less stringent criteria (i.e. without objective confirmation) were considered.
5. Time to first relapse after the start of the study.
6. Percentage of participants free of disease activity: no relapses, no change in EDSS and no MRI changes (T1‐T2).
7. Number of participants treated with steroids for relapse of MS.
8. Mean changes in quality of life (QOL) measured by validated questionnaires such as the Multiple Sclerosis Quality of Life‐54 instrument (MSQOL‐54) (Vickrey 1995).
MRI OUTCOMES
9. Mean number of active (new or enlarged) T2‐hyperintense lesions per participant at 6 ‐12 ‐ 24 months from the start of the study and at the end of the scheduled follow‐up period.
10. Mean number of new contrast‐enhancing T1 lesions per participant at 6 ‐12 ‐ 24 months from the start of the study and at the end of the scheduled follow‐up period.
11. Mean change in total T2‐hyperintense lesion volume at 12 ‐ 24 months from the start of the study and at the end of the scheduled follow‐up period.
12. Mean change in total T1‐hypointense lesion volume at 12 ‐ 24 months from the start of the study and at the end of the scheduled follow‐up period.
13. Mean change in total brain volume (as a measure of atrophy) at 12 ‐ 24 months from the start of the study and at the end of the scheduled follow‐up period.
Search methods for identification of studies
A systematic search with no restrictions was conducted to identify all relevant published and unpublished RCTs.
Electronic searches
The Information Specialist searched the Trials Register of the Cochrane Multiple Sclerosis and Rare Diseases of the CNS Group (last search on 8 August 2016), which, among other sources, contains trials from:
The Cochrane Central Register of Controlled Trials (CENTRAL) (8 August 2016);
MEDLINE (PubMed) (1966 to 08 August 2016);
Embase (Embase.com) (1974 to 8 August 2016);
Cumulative Index to Nursing and Allied Health Literature (CINAHL) (EBSCO host) (1981 to 8 August 2016); and
Latin American and Caribbean Health Science Information Database (LILACS) (Bireme) (1982 to 8 August 2016).
We searched the following trials registries:
Clinical trial registries (clinicaltrials.gov, clinicaltrialsregister.eu); and
World Health Organization (WHO) International Clinical Trials Registry Portal (apps.who.int/trialsearch/).
Information on the Trials Register of the Review Group and details of search strategies used to identify trials can be found in the 'Specialised Register' section within the Cochrane Multiple Sclerosis and Rare Diseases of the Central Nervous System Group module.
The keywords used to search for studies for this review are listed in Appendix 1.
Searching other resources
The search was extended to other resources, including:
screening of reference lists of review articles and primary studies found;
screening of abstract books of the main MS meetings (European Committee for Treatment and Research in Multiple Sclerosis (ECTRIMS), European Neurological Society (ENS), American Academy of Neurology (AAN) from 2000 to 8 August 2016; and
contact with drug manufacturers.
Data collection and analysis
Selection of studies
Three review authors (SF, AG, LLM) independently reviewed titles and abstracts and excluded the study if it did not meet eligibility criteria. They obtained the full paper if the title and the abstract did not provide sufficient information and independently evaluated it. If they could not reach consensus on inclusion/exclusion criteria of an individual study, the final decision was made by all review authors. Study authors were contacted in cases of ambiguity or missing data.
Data extraction and management
For the update of the review, two review authors (AV, AL) independently screened titles and abstracts of the citations retrieved by the literature search to determine their inclusion/exclusion in the review. A third review author (LLM) further revised and confirmed the study selection. The two review authors (AL, LLM) resolved disagreements by discussion.
Assessment of risk of bias in included studies
Two review authors (AV, SF) independently graded the selected trials according to the domain‐based evaluation described in chapter 10 of theCochrane Handbook for Systematic Reviews of Interventions (Sterne 2011). The review authors compared evaluations and discussed and resolved disagreements.
Review authors assessed the following domains as 'yes' (i.e. low risk of bias), 'unclear' (uncertain risk of bias) or 'no' (i.e. high risk of bias).
Sequence generation.
Allocation concealment.
Blinding (of participants, personnel and outcome assessors).
Incomplete outcome data (when rate of dropout or loss to follow‐up was greater than 20%, the risk was judged as high).
Selective outcome reporting.
The review authors reported on each of these assessments for each individual study in the Risk of bias in included studies table.
We considered overall quality of the studies as good if all domains of selection, attrition and detection were at low risk of bias; moderate if one was at high risk; and poor in the other cases.
Measures of treatment effect
We processed data according to a modified intention‐to‐treat (ITT) principle, using the number of randomly assigned participants who took at least the first dose of the drug. For dichotomous data, we summarised study results as risk ratios (RRs) with 95% confidence intervals (CIs) according to Mantel‐Haenszel methods. When possible, we calculated the number needed to treat for an additional beneficial outcome or the number needed to treat for an additional harmful outcome. For continuous outcomes, weighted mean difference (MD) and standardised mean difference (95% CI) methods were used.
When event rates were reported as the occurrence of events in the overall population over a specific interval in time, we used log‐RR, and when the events were reported as hazard ratio (HR), we used log‐HR.
Unit of analysis issues
Studies with parallel‐group design were included: participants randomly assigned to intervention or control were analysed at the individual allocation level. We decided to include cross‐over studies by considering only data from the first half of the cross‐over trial, but no cross‐over studies were found. We performed a separate analysis at various periods (time frames: short term ≤18 months, medium term 24 and 36 months, and long term > 36 months) of different outcomes based on different periods of follow‐up.
Dealing with missing data
We addressed the effects of withdrawal and loss to follow‐up by performing a sensitivity analysis (see Sensitivity analysis section). When we discovered that some data with focus on predefined outcomes were missing, we contacted the corresponding authors. Missing data are provided in the studies tables. Additional data from the BEYOND trial were provided by Bayer (O'Connor 2009a; Pleimes 2013); but requests for additional data from the other study authors (Lublin 2013a, Mikol 2008 and Calabrese 2012) and from the drug company Merck Serono were not answered.
Assessment of heterogeneity
Clinical diversity and methodological diversity have been considered as heterogeneity. Heterogeneity among trial results has been examined by using the I² test (Higgins 2003). This provides an estimate of the percentage of variability due to heterogeneity rather than to chance alone. We interpreted an I² estimate of 50% or more as indicating the presence of heterogeneity, and random‐effects models were applied (DerSimonian 1986). We investigated diversity in clinical and methodological aspects of included trials.
Assessment of reporting biases
The small number of trials included in this review did not permit an assessment of publication bias. In future updates, we will assess publication bias by following recommendations provided by the Cochrane Handbook for Systematic Reviews of Interventions (Higgins 2011).
Data synthesis
The meta‐analysis was conducted using Review Manager 5 software (Review Manager 2016). If significant heterogeneity was not found among the included trials, we aggregated all included data in the final analyses by using a fixed‐effect model (Yusuf 1985). If substantial clinical diversity was noted between included studies, we used the random‐effects model with studies grouped by intervention. However, we decided to present results using a random‐effects model.
Subgroup analysis and investigation of heterogeneity
Small numbers of trials and small quantities of data did not permit a subgroup analysis according to IFN type and baseline EDSS. In future updates, and if further data become available, we plan to carry out subgroup analyses for primary outcomes according to IFN types beta 1a and 1b and baseline EDSS higher or lower than 3.0 points.
Sensitivity analysis
Sensitivity analyses were performed to explore missing data by likely scenario, attributing the outcome of interest to both treatment groups, as described in the Cochrane Handbook for Systematic Reviews of Interventions, Section 16.2.2 (Higgins 2011).
Summary of findings table
These outcomes are included in the 'Summary of findings' table.
1. Number of participants who experienced at least one relapse.
2. Number of participants whose condition worsened during the study.
3. Number of participants who withdrew from or dropped out of the study because of adverse events.
4. Mean number of active (new or enlarging) T2 lesions.
5. Mean number of new contrast‐enhancing T1 lesions.
6. Mean change in total T2‐hyperintense lesion volume.
7. Mean change in total T1‐hypointense lesion volume.
We assessed the quality of evidence as it relates to the studies that contributed data to the meta‐analyses for prespecified outcomes using GRADEpro software (GRADEpro 2008). We justified all decisions to downgrade or upgrade the quality of studies in footnotes, and we provided comments to aid readers' understanding of the review when necessary, as recommended by Cochrane (Schünemann 2011). The 'Summary of findings' table includes overall grading of the quality of evidence related to each of the outcomes, using the GRADEpro approach (GRADE Working Group 2004). Quality of evidence was graded as high, moderate, low or very low, upon consideration of within‐study risk of bias, directness of evidence, heterogeneity, precision of effect estimates and risk of publication bias. Control event rates used in the calculation of absolute risks were based on the numbers of events reported in the included studies.
Results
Description of studies
Results of the search
We identified overall 636 reports through the search strategy (MEDLINE 356, Embase 225, CINAHL 14, CENTRAL 14, clinical trials registries 11, CDR database 7, other databases 2, additional articles 7). We excluded 592 articles on the basis of abstracts considered not pertinent.
As compared with the first version, we have retrieved 232 new records. Two articles and two new ongoing trials were considered as potentially relevant. One already cited ongoing trial was included in the present updated review (NCT01058005); and one study previously classified as awaiting classification was excluded (Salama 2003). However, the final analysis was unchanged.
Overall, a total of 44 articles were provisionally selected as potentially fulfilling the inclusion criteria (Figure 1).
1.
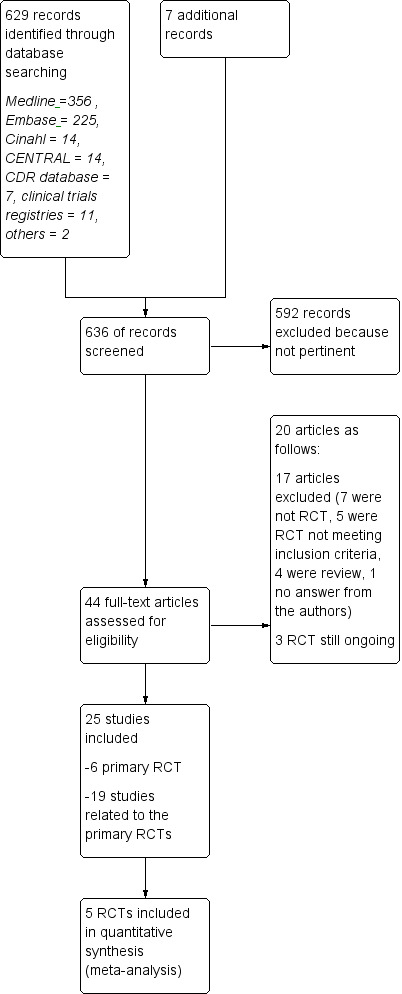
Study flow diagram.
Seventeen studies were excluded (see Characteristics of excluded studies): seven because they were not RCTs (Beer 2011; Carra 2008; Ghezzi 2005; Kalincik 2015; Khan 2001; Khan 2012; Spelman 2015); five RCTs, two on GA because the design included no active comparator treatment with IFNs but placebo in CIS (Comi 2009), or RRMS (Khan 2013), one because it was a comparative trial evaluating two dosages of GA (Comi 2011), two because they evaluated drugs different from those considered in this review (Barbato 2011; Khoury 2010); and four publications because they were review articles (Carter 2010; Del Santo 2011; Ouallet 2010; Qizilbash 2012). Finally one study was excluded because authors never answered our request for additional information (Salama 2003).
Three trials are still ongoing (Characteristics of ongoing studies). One ongoing trial is a phase IV RCT, with head‐to‐head comparisons of IFN‐beta 1b (250 mg of Betaseron) and GA (Copaxone) for the treatment of participants with CIS and RR forms of MS by using acute changes on MRI as the primary outcome (NCT00176592). The second one is a phase IIb/III trial that compares masitinib with interferon‐beta 1a, interferon‐beta 1b, peginterferon‐beta 1a or glatiramer acetate in people with RRMS who do not respond to these first line treatments (EUCTR2012‐003735‐32‐GR). The third is a 12‐month study where participants with RRMS are randomized 1:1 to fingolimod or approved disease modifying therapy (NCT01623596). Participants will be treatment naive or will have only been treated with one class of DMT (Interferon‐beta preparation or glatiramer acetate). The primary objective will be to evaluate efficacy of fingolimod by assessing participants' retention on treatment.
Twenty‐five studies were considered for inclusion: five published RCTs (Cadavid 2009a; Calabrese 2012; Lublin 2013a; Mikol 2008; O'Connor 2009a), and one unpublished study — NCT01058005 — met the selection criteria. Nineteen articles were related to primary studies, excluding the aforementioned ongoing trial (NCT00176592), which was related to the Cadavid 2009a study.
Three articles were pertinent to the Cadavid 2009a trial. Investigators analysed the impact of therapies on MRI measures as follows: one was a post hoc analysis of MRI/clinical activity (Cadavid 2011); another was an analysis of the development of focal lesions suggestive of brain injury (Cadavid 2009b); and the last described changes in brain volume (Cheriyan 2012).
Six articles were pertinent to the Lublin 2013a trial: one study reported the protocol (Lindsey 2012), and five articles were related to meeting reports of the same trial (Lublin 2012; Lublin 2013b; Lublin 2013c; Wolinsky 2012; Wolinsky 2013).
Two articles were pertinent to the Mikol 2008 trial: one was a post hoc analysis of tolerability (Coyle 2010), and the other commented on the same trial (Sørensen 2008).
Eight articles were pertinent to the O'Connor 2009a trial: one study was a meeting report of preliminary results (O'Connor 2008); another described the immunological effects of treatments (Goodin 2012); another was a post hoc analysis evaluating MRI measures of degeneration among participants included in the BEYOND trial (Filippi 2011); three were Errata reports (O'Connor 2009b; O'Connor 2011; O'Connor 2012); one was a post hoc analysis (Lampi 2013), and we analysed additional data from the BEYOND trial, as provided by Bayer (Pleimes 2013).
Included studies
Six RCTs met our predefined selection criteria: two studies compared the effects of GA versus IFN‐beta 1b (Cadavid 2009a; O'Connor 2009a), and four compared GA versus IFN‐beta 1a (Calabrese 2012; Lublin 2013a; Mikol 2008; NCT01058005), with two comparing GA versus IFN‐beta 1a 44 mcg SC (Mikol 2008; NCT01058005), one GA versus IFN‐beta 1a 30 mcg IM (Lublin 2013a), one GA versus both IFN‐beta 1a 44 mcg SC and IFN‐beta 1a 30 mcg IM (Calabrese 2012), and one comparing GA versus IFN‐beta 1a 44 mcg SC and natalizumab (NCT01058005)
Cadavid 2009a (BECOME) evaluated the efficacy of IFN‐beta 1b and GA in 79 participants with RRMS or CIS (36 treated with IFN and 39 with GA). The primary outcome was MRI measures of activity (combined active lesion counts).
Calabrese 2012 evaluated the efficacy of IFN‐beta 1a (44 mcg SC three times weekly), IM IFN‐beta 1a (30 mcg weekly) or GA in 165 participants with RRMS (55 participants in each group). The primary outcome was the development of new cortical lesions and cortical atrophy progression among participants with RRMS.
Lublin 2013a (CombiRx) evaluated the efficacy of combined use of interferon‐beta 1a 30 mcg IM weekly and GA 20 mg daily versus each single agent with matching placebo in 1008 participants with RRMS (250 treated with IFN, 259 with GA and 499 with IFN + GA). The primary outcome was annualised relapse rate (ARR).
Mikol 2008 (REGARD) evaluated the efficacy of SC IFN‐beta 1a (44 mcg three times weekly) versus GA in 764 participants with RRMS (386 in IFN group and 378 in GA group). The primary outcome was time to first relapse.
O'Connor 2009a (BEYOND) evaluated the efficacy of IFN‐beta 1b at two different doses (250 mcg and 500 mcg every other day) and of GA in 2244 participants with RRMS (897 treated with IFN 250 mcg, 899 with IFN 500 mcg and 448 with GA). The primary outcome was risk of relapse. Missing data were provided by Bayer (Pleimes 2013).
NCT01058005 (SURPASS) evaluated the safety of natalizumab (300 mg intravenous injection every 4 weeks), IFN‐beta 1a (44 mcg SC injection 3 times weekly), or GA (20 mg SC injection once daily) in 84 participants. The primary outcome was the incidence of treatment‐emergent serious adverse events (SAEs).
The Characteristics of included studies table provides trial design, main characteristics of participants, intervention and treatment groups, selected outcome criteria and the authors' conclusions.
Detailed data related to the definition of relapse are reported in the Characteristics of included studies table. Four of the five trials — Cadavid 2009a; Lindsey 2012; Mikol 2008; O'Connor 2009a — defined relapse as new or recurrent neurological abnormalities associated with an increase in Scripps Neurological Rating Scale (SNRS) score (Cadavid 2009a); or an increase in EDSS score (Cadavid 2009a; Lublin 2013a; Mikol 2008; O'Connor 2009a), lasting at least 24 hours (Cadavid 2009a; Lublin 2013a; O'Connor 2009a), or at least 48 hours (Mikol 2008) and without fever or infection.
NCT01058005 (SURPASS) underwent an early termination due to significantly slower than expected enrolment: all clinical efficacy and magnetic resonance imaging (MRI) procedures were removed from the protocol and safety assessments were to be managed through standard of care activities.The results were reported on clinicaltrials.gov. Based on these data (accessed 19 August 2016) this study was selected because it fitted our predefined inclusion criteria, although it was excluded in the previous version of this review. Actually, no published data have been retrieved and this study did not contribute to any analyses for the lack of available data (Characteristics of included studies).
Cadavid 2009a and Lublin 2013a specified that the increase in EDSS score identified a relapse as follows.
Increase in total EDSS of 0.5 point.
Increase in Kurtzke Functional System Score (FSS) of 2.0 points.
Increase in two or more Kurtzke FSS scores of 1.0 point, or decrease in SNRS score of 7.0 points (Cadavid 2009a).
Disability progression was analysed by four RCTs and was defined as:
six months' sustained increase in EDSS ≥ 1.0 point from baseline or at least 0.2 standard deviations (SDs) on baseline Multiple Sclerosis Functional Composite (MSFC) score (post hoc analysis) (Cadavid 2011);
six months' sustained increase in EDSS ≥ 1.0 point (0.5 for baseline EDSS ≥ 5.5) (secondary outcome) (Lublin 2013a);
six months' sustained increase was confirmed as follows: if the EDSS score at baseline was 0, then a change of 1.5 points or more was required; if the EDSS was 0.5−4.5 at baseline, then a change of 1.0 point or more was required; and if the EDSS at baseline was 5 points or more, then the change required was 0.5 points or more (Mikol 2008);
three months' sustained increase in EDSS ≥ 1.0 point (secondary outcome) (O'Connor 2009a).
Baseline characteristics of the included population are reported in Table 2. All RCTs included participants with RRMS with low disability and active disease (frequency of relapse ≥ 1/y). No significant differences were found between studied populations in terms of mean age (range 34.8 to 39.0 years), mean EDSS (1.9 to 2.35 points) and mean relapse frequency (0.97 to 1.9). Mean disease duration was different, ranging from 0.9 (Cadavid 2009a) to 6.55 (Mikol 2008).
1. Baseline characteristics of the population included in the RCTs.
| Study name | Drugs | Number of participants | % female | Age, years, mean (SD) | Mean EDSS score (SD) | Disease duration, years,mean (SD) | Previous number of relapses, mean (SD) |
Number of participants with MRI Gad+ lesions (%) |
| Cadavid 2009a | IFN‐beta 1b | 36 | 75 | 36 (7.75) | 2.0* (0 to 5) |
0.9* (0.1 to 24) |
1.8* (0 to 7.5) |
26 (72) |
| GA | 39 | 64 | 36 (8.25) | 2.0* (0 to 5.5) |
1.2* (0.2 to 34) |
1,9* (0.13 to 7.0) |
27 (69) |
|
| Calabrese 2012 | IFN‐beta 1a 44 | 55 | 69.5 | 35.9 (9.1) | 1.9 (1.0) |
5.7 (4.9) |
1,2 (0.6) |
ND |
| IFN‐beta 1a 30 μg | 55 | 68.0 | 34.8 (9.6) | 1.9 (0.8) |
5.3 (5.1) |
1,2 (0.7) |
ND | |
| GA | 55 | 72.9 | 38.9 (10.2) | 2.1 (1.1) | 5.5 (6.1) |
1,3 (0.7) |
ND | |
| Lublin 2013a | IFN‐beta 1a 30 μg | 250 | 69.2 | 37.6 (10.2) | 2.0 (1.2) | 1.4 (4.0) |
1.7° (0.9) |
187 (74.8) |
| GA | 259 | 71.4 | 39.0 (9.5) | 1.9 (1.2) | 1.0 (2.9) | 1.6° (0.7) | 215 (83.01) | |
| Mikol 2008 | IFN‐beta 1a 44 μg | 386 | 69 | 36.7 (9.8) | 2.35 (1.28) | 5.93 (6.25) | 0.97** (0.42) | 150 (39) |
| GA | 378 | 72 | 36.8 (9.5) | 2.33 (1.31) | 6.55 (7.10) | 1.01** (0.35) | 156 (41) | |
| O'Connor 2009a | IFN‐beta 1b | 897 | 70 | 35.8** (11.13) | 2.35 (2) | 5.3** (4.45) | 1.6° (0.74) | ND |
| GA | 448 | 68 | 35.2** (11.87) | 2.28 (2) | 5.1** (4.45) | 1.6° (0.74) | ND |
ND (no data available).
*Median (range); mean not reported.
**SD or weighted mean was calculated.
°Pre‐1‐year.
Only three studies reported the numbers of participants with enhancing baseline lesions at MRI (Cadavid 2009a; Lublin 2013a; Mikol 2008).
The overall number of participants included in the five RCTs was 4256. However, we decided to exclude from the analysis high dosages of IFN‐beta 1b (500 mcg to 899 participants), as used in the O'Connor 2009a study, and combined IFN + GA (509 participants), as used in Lublin 2013a study arms, because these schedules are not used in clinical practice. The overall population considered in our analysis was 2858 (1679 participants treated with IFN and 1179 with GA). The drugs analysed in comparison with GA were IFN‐beta 1b (two trials, 933 participants), SC IFN‐beta 1a 44 mcg (two trials, 441 participants) and IM IFN‐beta 1a 30 mcg (two trials, 305 participants).
Duration of treatment and follow‐up was three years for the Lublin 2013a study and two years for the other four RCTs.
Excluded studies
See 'Results of the search' and the Characteristics of excluded studies table.
Risk of bias in included studies
The risk of bias was variable across studies: incomplete outcome data was the main biased dimension (high risk of bias in all studies) because of high levels of dropout and missing data, followed by lack of blinding of participants and investigators and by selective outcome reporting (high risk of bias in three and two studies, respectively).
Further details of this assessment are provided in relevant sections of the Characteristics of included studies table and are presented as the 'Risk of bias' graph (Figure 2) and the 'Risk of bias' summary (Figure 3).
2.
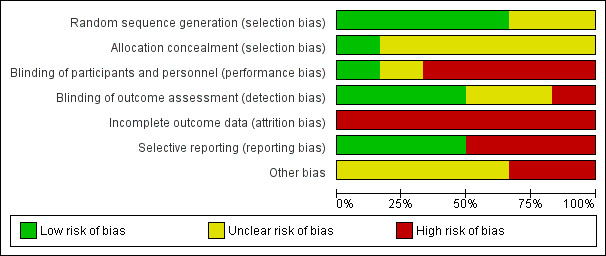
Risk of bias graph: review authors' judgements about each risk of bias item presented as percentages across all included studies.
3.
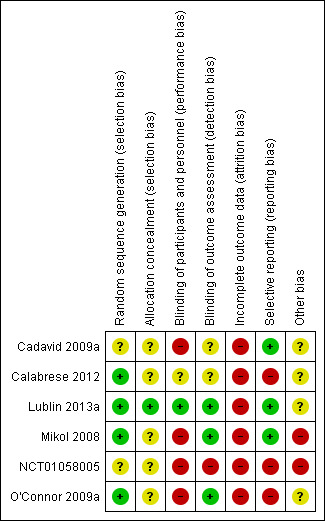
Risk of bias summary: review authors' judgements about each risk of bias item for each included study.
Allocation
All studies, with the exception of Cadavid 2009a (in which the item was not mentioned) used computer systems to generate the allocation sequence, but none clearly explained how the sequence was concealed (with the exception of Lublin 2013a, in which the sequence was masked by the computer system).
Blinding
Participants treated in Mikol 2008, O'Connor 2009a, Cadavid 2009a and NCT01058005 were not blinded. In Calabrese 2012, this item is not mentioned and in Lublin 2013a the computer system ensured blindness. Treating physicians were aware of the treatments in Mikol 2008 and O'Connor 2009a and were unaware in Lublin 2013a. The other studies did not mention this item. In all studies, outcome assessors were blinded. Two studies were at low risk for detection bias for MRI measures (Cadavid 2009a; Calabrese 2012), which were the primary outcomes for these studies and were unclear for clinical outcomes.
Incomplete outcome data
Incomplete outcome data was the main biased dimension because of the high level of loss to follow‐up. Participants who dropped out accounted for 13% to 30%, with higher values for IFN groups in four RCTs (Table 3). An ITT analysis was performed in Cadavid 2009a, Mikol 2008 and Lublin 2013a, but in the other two studies it was not performed. Reasons for loss to follow‐up were clearly reported only by Cadavid 2009a and Mikol 2008.
2. Dropout data.
| Study | Arm | N° participants | N° dropout | Reasons for missing | |||||||||||
| At randomisation | 24 months | 36 months | n° | % | Lost to follow‐up | Did not receive drug | Switched treatment | Withdrew | Deviated from protocol | Had adverse events | Died | Became pregnant | Other reasons | ||
| Cadavid 2009a1 | IFN‐beta 1a 44 μg | 36 | 25 | ND | 116 | 30.6 | 7 | 0 | 0 | 0 | 0 | 1 | 0 | 0 | 38 |
| GA | 39 | 31 | ND | 87 | 20.5 | 4 | 0 | 0 | 0 | 0 | 0 | 0 | 0 | 48 | |
| Calabrese 20122 | IFN‐beta 1a 44 μg | 55 | 46 | ND | 9 | 16.4 | 9 | ND | |||||||
| IFN‐beta 1a 30 μg | 55 | 47 | ND | 8 | 14.5 | 8 | |||||||||
| GA | 55 | 48 | ND | 7 | 12.7 | 7 | |||||||||
| Lublin 2013a3 | IFN‐beta 1a 30 μg | 250 | ND | 194 | 56 | 22.4 | 13 | 0 | 0 | 0 | 0 | 1711 | 1 | 0 | 2513 |
| GA | 259 | ND | 223 | 36 | 13.9 | 9 | 0 | 0 | 0 | 0 | 1112 | 1 | 0 | 1514 | |
| Mikol 20084 | IFN‐beta 1a 44 μg | 386 | 301 | ND | 85 | 22.0 | 17 | 3 | 0 | 0 | 2 | 23 | 0 | 8 | 329 |
| GA | 378 | 324 | ND | 54 | 14.3 | 2 | 3 | 0 | 0 | 2 | 19 | 0 | 5 | 2310 | |
| O'Connor 2009a5 | IFN‐beta 1b 250 | 897 | 784 | ND | 113 | 12.6 | 12 | 9 | 10 | 38 | 3 | 13 | 1 | 27 | |
| GA | 448 | 374 | ND | 74 | 16.5 | 12 | 3 | 5 | 18 | 2 | 8 | 1 | 1 | 24 | |
ND (no data available)
Source of data are described as follow.
1] pg 1977; 2] pg 3; 3] pg 33; 4] pg 904; 5] pg 890; 6] 7 lost to follow‐up + 4 discontinued intervention (see pg 1977); 7] 4 lost to follow‐up + 4 discontinued intervention (see pg 1977); 8] treatment failure; 9] 4 had disease progression + 28 for other reasons; 10] 7 had disease progression + 16 for other reasons; 11] 4 AE/SAE + 13 side effects; 12] 6 AE/SAE + 5 side effects; 13] 14 non‐medical reason + 11 other medical reason; 14] 8 non‐medical reason + 7 other medical reason
The online publication was corrected after the first publication of the study became available (O'Connor 2009b; O'Connor 2011; O'Connor 2012).
Selective reporting
Cadavid 2009a and O'Connor 2009a failed in matching outcomes planned with outcomes reported: O'Connor 2009a reported five tertiary outcomes not planned, and Cadavid 2009a reported one outcome more than those planned.
Other potential sources of bias
All studies were sponsored by the drug industry (Bayer sponsored Cadavid 2009a and O'Connor 2009a; Merck Serono sponsored Mikol 2008 and Calabrese 2012), with the exception of Lublin 2013a, which was funded by the National Institutes of Health and the National Institute of Neurological Disorders and Stroke.
Effects of interventions
See: Table 1
Main findings are described in Table 1.
Clinical efficacy outcomes
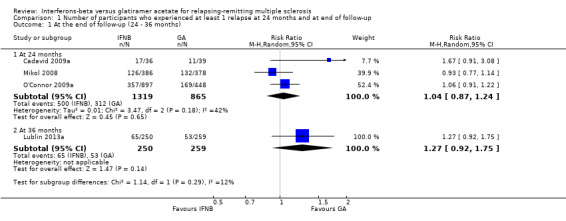
1. Number of participants who experienced at least one relapse at 12 months or at 24 months or at the end of follow‐up
This outcome was assessed by three trials at 24 months (Cadavid 2009a; Mikol 2008; O'Connor 2009a) (2184 participants; 76%) and by one trial at 36 months (Lublin 2013a) (509 participants; 18%) and was not available from the Calabrese 2012 trial. From these data, we found no significant differences in effect at 24 months (RR 1.04, 95% CI 0.87 to 1.24) and at 36 months (RR 1.27, 95% CI 0.92 to 1.75). No significant heterogeneity was found among studies (Analysis 1.1). The results were unchanged when missing data were explored at sensitivity analysis by a likely scenario (Analysis 1.2) (Table 4).
1.1. Analysis.
Comparison 1 Number of participants who experienced at least 1 relapse at 24 months and at end of follow‐up, Outcome 1 At the end of follow‐up (24 ‐ 36 months).
1.2. Analysis.
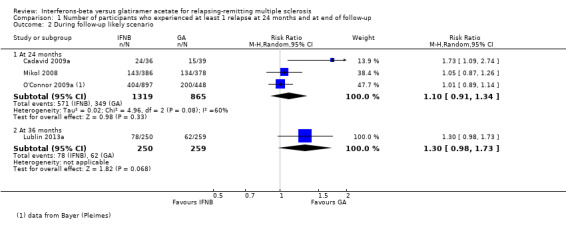
Comparison 1 Number of participants who experienced at least 1 relapse at 24 months and at end of follow‐up, Outcome 2 During follow‐up likely scenario.
3. Sensitivity analysis (OUTCOME: N° of participants with at least 1 relapse).
| Study | Arm | N° participants | N° dropout | Lost to follow‐up |
|||
| Randomised available for the outcome |
24 months | 36 months | n° | % | |||
| Cadavid 2009a | IFN‐beta 1a 44 | 36 | 25 | 11 | 30.6 | 7 | |
| GA | 39 | 31 | 8 | 20.5 | 4 | ||
| Calabrese 2012 | IFN‐beta 1a 44 | 55 | 46 | 9 | 16.4 | 9 | |
| IFN‐beta 1a 30 | 55 | 47 | 8 | 14.5 | 8 | ||
| GA | 55 | 48 | 7 | 12.7 | 7 | ||
| Lublin 2013a | IFN‐beta 1a 30 | 250 | 194 | 56 | 22.4 | 13 | |
| GA | 259 | 223 | 36 | 13.9 | 9 | ||
| Mikol 2008 | IFN‐beta 1a 44 | 386 | 301 | 85 | 22.0 | 17 | |
| GA | 378 | 324 | 54 | 14.3 | 2 | ||
| O'Connor 2009a | IFN‐beta 1b | 897 | 784 | 113 | 12.6 | 57* | |
| GA | 448 | 374 | 74 | 16.5 | 31* | ||
*Data provided by Bayer (Pleimes 2013).
2. Number of participants with confirmed worsening at 12 months or at 24 months or at the end of follow‐up
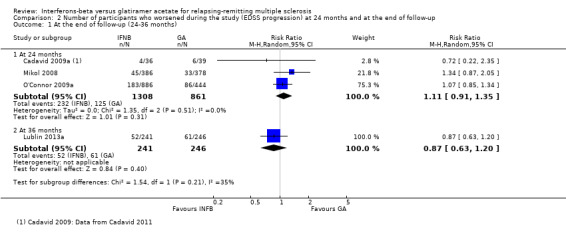
This outcome was assessed by three trials at 24 months (2169 participants; 76%) and by one trial at 36 months (487 participants; 17%). Three trials adopted the predefined criteria of worsening (confirmed during two subsequent neurological examinations separated by at least six months) (Cadavid 2009a; Mikol 2008,Lublin 2013a). One study used less stringent criteria (i.e. an increase in EDSS sustained for three months) (O'Connor 2009a).
No differences were found when confirmed progression was analysed at 24 months (RR 1.11, 95% CI 0.91 to 1.35) or at 36 months (RR 0.87, 95% CI 0.63 to 1.20) (Analysis 2.1).
2.1. Analysis.
Comparison 2 Number of participants who worsened during the study (EDSS progression) at 24 months and at the end of follow‐up, Outcome 1 At the end of follow‐up (24‐36 months).
Results were unchanged when missing data were explored by a likely scenario (Analysis 2.2) (Table 5).
2.2. Analysis.
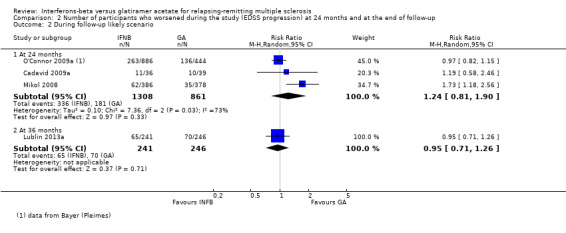
Comparison 2 Number of participants who worsened during the study (EDSS progression) at 24 months and at the end of follow‐up, Outcome 2 During follow‐up likely scenario.
4. Sensitivity analysis (OUTCOME: N° participants with EDSS progression).
| Study | Arm | N° participants at | N° dropout | Lost to follow‐up |
|||
| Randomised available for the outcome |
24 months | 36 months | n° | % | |||
| Cadavid 2009a | IFN‐beta 1a 44 | 36 | 25 | 11 | 30.6 | 7 | |
| GA | 39 | 31 | 8 | 20.5 | 4 | ||
| Calabrese 2012 | IFN‐beta 1a 44 | 55 | 46 | 9 | 16.4 | 9 | |
| IFN‐beta 1a 30 | 55 | 47 | 8 | 14.5 | 8 | ||
| GA | 55 | 48 | 7 | 12.7 | 7 | ||
| Lublin 2013a | IFN‐beta 1a 30 | 241 | 194 | 47 | 19.5 | 13 | |
| GA | 246 | 223 | 23 | 9.3 | 9 | ||
| Mikol 2008 | IFN‐beta 1a 44 | 386 | 301 | 85 | 22.0 | 17 | |
| GA | 378 | 324 | 54 | 14.3 | 2 | ||
| O'Connor 2009a | IFN‐beta 1b | 886 | 784 | 102 | 11.5 | 80* | |
| GA | 444 | 374 | 70 | 15.8 | 58* | ||
*Data provided by Bayer (Pleimes 2013).
Clinical safety outcomes
3. Number of participants who withdrew from or dropped out of the study because of adverse events
The number of participants who withdrew from or dropped out of the study because of adverse events was available for four studies (2685 participants; 93%) and was not reported in the Calabrese 2012 study. No differences were found between the two treatment groups (RR 0.95, 95% CI 0.64 to 1.40). No heterogeneity was found (Analysis 3.1).
3.1. Analysis.
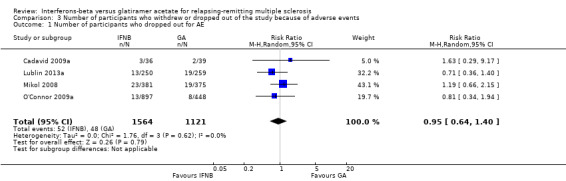
Comparison 3 Number of participants who withdrew or dropped out of the study because of adverse events, Outcome 1 Number of participants who dropped out for AE.
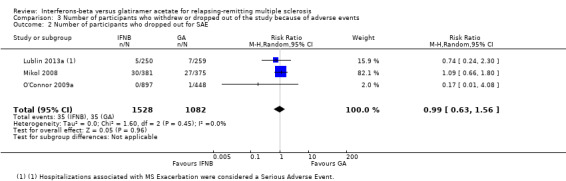
Similar results were found when SAEs were considered (RR 0.99, 95% CI 0.63 to 1.56) (Lublin 2013a; Mikol 2008; O'Connor 2009a). Seven deaths were reported: five in the IFN group (three in the 500 mcg arm) and two in the GA group: among participants treated with IFN, one died (suicide) about three months after taking the last dose of study drug (IFN‐beta 1a) (Mikol 2008), one died as the result of pulmonary embolism (Lublin 2013a), and three died for unexplained reasons (O'Connor 2009a). No reason was specified for one death reported in the GA group (O'Connor 2009a), and one participant died of a large cell lymphoma of the CNS (Lublin 2013a) (Analysis 3.2).
3.2. Analysis.
Comparison 3 Number of participants who withdrew or dropped out of the study because of adverse events, Outcome 2 Number of participants who dropped out for SAE.
Lublin 2013a is the only trial that provided details on numbers of SAEs by organ system as experienced by participants. In this study, SAEs occurred more often in the IFN group than in the GA group: nervous system disorders, including relapses: 4.4% versus 1.9%; neoplasms benign and malignant: 2% versus 0.4%; surgical and medical procedures: 2% versus 1.9%; infections and infestations: 1.6% versus 0.4%; gastrointestinal disorders: 1.2% versus 0.8%; and cardiac disorders: 1.2% versus 0.8%.
By contrast, the proportions of participants treated with GA were higher for experiencing hepatobiliary disorders (0.8% vs 0.4%) and musculoskeletal, connective tissue and bone disorders (0.8% vs 0.4%).
NCT01058005 reported two SAEs: one meningitis herpes and one cerebral venous thrombosis in 2/22 participants treated with IFN1a.
Analysis of the number needed to treat for an additional beneficial outcome or the number needed to treat for an additional harmful outcome was not provided because reliable data were insufficient.
Clinical outcomes
4. Frequency of relapse
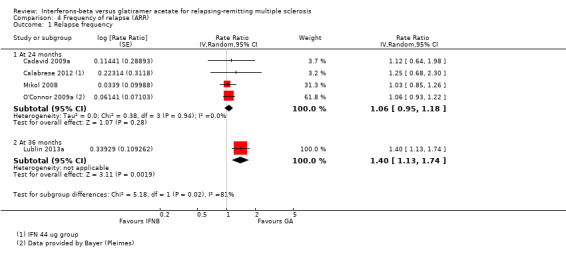
The frequency of relapse was analysed in terms of log rate ratio at 24 months for four studies (Cadavid 2009a; Calabrese 2012; Mikol 2008; O'Connor 2009a). The rate ratio (1.06, 95% CI 0.95 to 1.18) showed no difference between the two groups. At 36 months, data were provided by one study (Lublin 2013a); the rate ratio (1.40, 95% CI 1.13 to 1.74) was significantly higher in the IFN group (P value 0.002), favouring GA (Analysis 4.1).
4.1. Analysis.
Comparison 4 Frequency of relapse (ARR), Outcome 1 Relapse frequency.
5. Time to first relapse
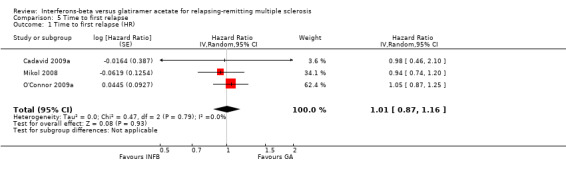
No differences were found (HR 1.01, 95% CI 0.87 to 1.16) without heterogeneity among studies (Analysis 5.1).
5.1. Analysis.
Comparison 5 Time to first relapse, Outcome 1 Time to first relapse (HR).
6. Percentage of participants free of disease activity: no relapses, no changes in EDSS and no MRI changes
No analysis was possible because data were insufficient. Data were reported by only one study (Lublin 2013a): a preplanned assessment of percentages of participants with no clinical or MRI activity was performed and no significant differences were found between IFNs and GA (21.2% and 19.4%).
7. Participants treated with steroids for relapse of MS
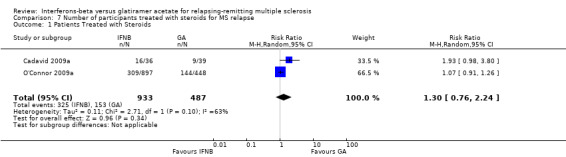
This outcome was available for two studies (1420 participants; 50%) (Cadavid 2009a; O'Connor 2009a). Results did not show a statistically significant difference between the two therapies (RR 1.30, 95% CI 0.76 to 2.24) (Analysis 7.1). Significant heterogeneity was found between studies (I² = 63%).
7.1. Analysis.
Comparison 7 Number of participants treated with steroids for MS relapse, Outcome 1 Patients Treated with Steroids.
8. Mean changes in quality of life
No data were available.
MRI outcomes
9. Mean number of active (new or enlarged) T2‐hyperintense lesions per participant at 6 or 12 or 24 months
This outcome was available for one study at six months (396 participants; 14%), for two studies at 12 months (1722 participants; 60%) and for three studies at 24 months (1790 participants; 62%). For the latter time point, data from Calabrese 2012 referred to the IFN 44 mcg group. At six months, the number of active (new or enlarging) T2 lesions was significantly lower in IFN‐treated than in GA‐treated participants (MD −0.86, 95% CI −1.32 to −0.40; P value 0.0003). No significant differences were found between IFN and GA for this outcome at 12 months or at 24 months (MD −0.52, 95% CI −1.12 to 0.09, and MD −0.15, 95% CI −0.68 to 0.39, respectively). At 24 months, heterogeneity was significant (I² = 68%) (Analysis 9.1). At 24 months, the results did not change when data from Calabrese 2012 evaluating the effects of IM IFN‐beta 1a 30 mcg versus GA were analysed (MD 0.11, 95% CI −0.67 to 0.44).
9.1. Analysis.
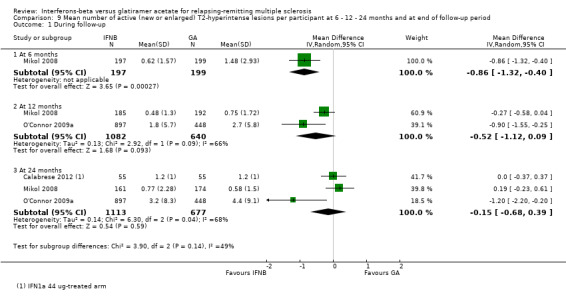
Comparison 9 Mean number of active (new or enlarged) T2‐hyperintense lesions per participant at 6 ‐ 12 ‐ 24 months and at end of follow‐up period, Outcome 1 During follow‐up.
10. Mean number of new contrast‐enhancing T1 lesions per participant at 6 or 12 or 24 months
This outcome was available at 12 months for one study (1233 participants; 43%) and at 24 months for three studies (1734 participants; 61%). For the latter time point, data from Calabrese 2012 referred to the IFN 44 mcg group. No significant differences between SC IFN 44 mcg and GA were found for this outcome at 12 months (MD −0.10, 95% CI −0.26 to 0.06) and at 24 months (MD −0.14, 95% CI −0.30 to 0.02) (Analysis 10.1). At 24 months, the results did not change when data from Calabrese 2012 evaluating the effects of IM IFN‐beta 1a 30 mcg versus GA were analysed (MD −0.16, 95% CI −0.31 to 0.00).
10.1. Analysis.
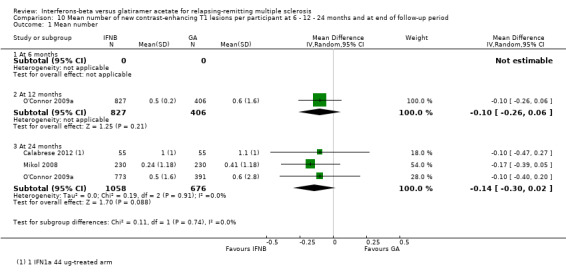
Comparison 10 Mean number of new contrast‐enhancing T1 lesions per participant at 6 ‐ 12 ‐ 24 months and at end of follow‐up period, Outcome 1 Mean number.
No data at six months were available.
11. Mean change in total T2‐hyperintense lesion volume at 12 or 24 months
This outcome was available for one study at 12 months (1221 participants; 43%), for two studies at 24 months (1608 participants; 56%) and for another study at 36 months (509 participants; 19%). The mean increase in T2 lesion volume was significantly less in IFN‐treated than in GA‐treated participants at month 12 and at month 24 (MD −0.40, 95% CI −0.59 to −0.21, and MD −0.58, 95% CI −0.99 to −0.18; P values < 0.0001 and 0.004, respectively). No heterogeneity was found. The difference favouring IFN (MD −0.26, 95% CI −1.04 to 0.52) was also present in 36‐month data from a single study (Lublin 2013a), but it did not reach statistical significance (Analysis 11.1).
11.1. Analysis.
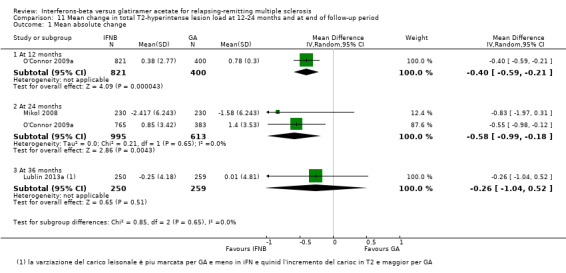
Comparison 11 Mean change in total T2‐hyperintense lesion load at 12‐24 months and at end of follow‐up period, Outcome 1 Mean absolute change.
12. Mean change in total T1‐hypointense lesion volume at 12 or 24 months
This outcome was available at 12 months for one study (1207 participants; 42%) and at 24 months for two studies (1602 participants; 56%). The mean increase in T1 lesion volume was significantly less in IFN‐treated than in GA‐treated participants at month 24 (MD −0.20, 95% CI −0.33 to −0.07; P value 0.003). The difference favouring IFN (MD −0.06, 95% CI −0.18 to 0.07) was also seen in 12‐month data from a single study (O'Connor 2009a), but did not reach statistical significance (Analysis 12.1).
12.1. Analysis.
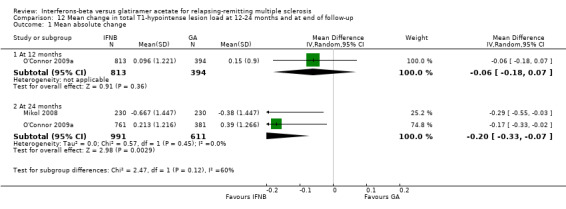
Comparison 12 Mean change in total T1‐hypointense lesion load at 12‐24 months and at end of follow‐up, Outcome 1 Mean absolute change.
13. Mean change in total brain volume (as a measure of atrophy) at 12 or 24 months
This outcome was available at 12 months for one study (1137 participants; 40%) and at 24 months for two studies (1552 participants; 54%). Data at 12 months did not show a significant difference between IFN and GA with regard to brain volume changes (MD −0.10, 95% CI −0.22 to 0.02). At 24 months, mean brain volume reduction was significantly greater in IFN‐treated than in GA‐treated participants (MD −0.12, 95% CI −0.23 to −0.01; P value 0.04). At 24 months, the heterogeneity was significant (I² = 83%) (Analysis 13.1).
13.1. Analysis.
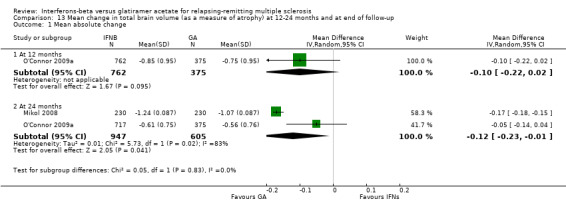
Comparison 13 Mean change in total brain volume (as a measure of atrophy) at 12‐24 months and at end of follow‐up, Outcome 1 Mean absolute change.
Discussion
Summary of main results
The purpose of this study was to evaluate whether treatment with IFN‐beta and GA in participants with RRMS was different in terms of efficacy and safety, by performing a systematic review of head‐to‐head RCTs.
Six trials were included and five trials contributed to this review with data. The overall population included 2904 participants (1704 participants treated with IFN and 1200 with GA). The drugs analysed in comparison with GA were SC IFN‐beta 1b (two trials, 933 participants), SC IFN‐beta 1a 44 mcg (three trials, 466 participants) and IM IFN‐beta 1a 30 mcg (two trials, 305 participants). Duration of treatment and follow‐up was three years for Lublin 2013a and two years for the other four RCTs. All studies were at high risk for attrition bias.
The main conclusion was that the two therapies seemed to have similar effects in terms of clinical efficacy, when primary outcomes (number of participants with relapse or risk of confirmed progression) and other supportive outcomes (time to first relapse, number of participants treated with steroids) were considered. However, we found some evidence, limited by the small number of participants derived from only one study, that the relapse ratio was significantly lower at 36 months in GA as compared with IFN.
The number of participants who withdrew from or dropped out of the studies because of adverse events (safety end point) was similar in the two groups. The percentage of discontinuation due to adverse effects was similar (3% for IFNs and 4% for GA). The percentage of discontinuation due to serious adverse events was also similar between groups.
In light of MRI outcomes, results showed that the effects on new/enlarging T2 or gadolinium‐enhancing lesions at 24 months were similar. However, IFNs have a more pronounced effect on T2 and T1 lesion volume accrual at 12 (T2) and 24 months. Conversely, a lower rate of brain volume (BV) loss at 24 months was observed in GA‐treated participants. The values for new T2 lesions and for brain atrophy data were limited by the heterogeneity of the results. Methodological issues have been highlighted (Rudick 2009).
The quality of evidence for primary outcomes was judged as moderate for clinical end points, but for safety and some MRI outcomes (number of active T2 lesions) as low (Table 1).
Overall completeness and applicability of evidence
The RCTs included in the review were homogeneous in terms of included populations, treatment schedules and outcome measures.
All studies included only participants with active RRMS (pre‐study relapse frequency ranging from 0.97 to 1.9) and low disability (EDSS 1.9 to 2.35). Participants had similar baseline characteristics in terms of gender and mean age (34.8 to 39 years), although mean disease duration was different, ranging from 0.9 years to 6.55 years (Cadavid 2009a and Mikol 2008, respectively).
Studies compared the effects of different IFN products used in clinical practice versus GA. However, evaluation of the comparative effects of IFN‐beta 1a IM (Avonex) and GA was limited because of the different time points provided (24 months and 36 months, respectively). For this reason, the main comparison in this review was that between GA and IFNs at high frequencies and dosages.
The objectives of this review were reasonably well achieved, allowing comparison of the two treatments in terms of predefined clinical and MRI measures of efficacy. The main outcome measure not available for analysis was quality of life, which impaired the comparison of the relative tolerability of different DMTs in terms of patient‐reported outcomes.
We selected outcome measures that evaluated changes in clinical activity (relapse rate, attack‐free status or time to first relapse), MRI activity (new or enlarging T2 lesions or Gd‐enhancing lesions), clinical severity (confirmed disability progression) or MRI severity (T1 lesion load accrual or BV decrease).
Overall, results showed no differences in clinical effect between the two treatments. Different effects on some measures of MRI activity suggest that IFN might have a stronger and faster anti‐inflammatory action than GA. Such an anti‐inflammatory effect might also account for observed differences between the two drugs in terms of brain volume reduction at 24 months, because they could be related to non–tissue‐related BV loss ('pseudoatrophy' effect), although pseudoatrophy is seen primarily only during the first year (Zivadinov 2008). Furthermore, the clinical impact of these data is currently being studied (Fisniku 2008: Popescu 2013).
The results of this systematic review have several limitations.
The main limitation was related to high risk of attrition bias. The percentage of dropouts was higher in the IFN groups than in the GA group for different reasons (adverse effects, lack of consent, tolerability). This aspect might have a role in the final assessment of effectiveness of these drugs, although sensitivity analysis using a likely scenario did not capture different results.
The definition of relapse was similar, with objective confirmation required, in all studies. However, Calabrese 2012 did not define the outcome, and Mikol 2008 counted as relapses both qualifying and non‐qualifying attacks. We could not exclude the possibility that an inhomogeneous relapse definition might constitute a bias.
Pivotal trials comparing DMTs versus placebo have suggested different efficacy for disease activity (Hillert 2012), although the results of this review show similar effects for IFN and GA. The reasons for this are uncertain, but the primary source of discrepancy is probably related to differences in the enrolled populations of studies, especially in the behaviour of placebo groups (Goodin 2008a).
Data did not allow verification of the effects of IFNs and GA as change therapy in participants who were not responders to previous therapies. A recent comparative study evaluating DMTs in real world clinical practice using international MSBase registry data has been conducted using propensity score matching. Slightly lower relapse incidence was found among participants treated with glatiramer acetate or subcutaneous interferon‐beta 1a relative to intramuscular interferon‐beta 1a and interferon‐beta 1b. No differences in 12‐month confirmed progression of disability were observed (Kalincik 2015). The ongoing RCTs might possibly contribute to this issue comparing the new approved therapies.
Analysis of the safety profile was restricted to the number of participants who withdrew from, or dropped out of, the study; drug‐related adverse effects (tolerability) were not considered. Data derived from one study (reported but not planned) suggest a greater incidence of SAEs such as tumour or infection in IFN groups than in GA groups, although hepatobiliary and musculoskeletal disorders were reported more often among GA‐treated participants. Other studies showed that tolerability was generally good. It is well known that up to 75% of IFN‐treated patients experience flu‐like illness, headache and myalgia. Increased alanine aminotransferase and leukopenia occur significantly more often in the IFN group, whereas pruritus, swelling, induration at the injection site (56% to 71%), dyspnoea and post‐injection systemic reactions (15% to 38%) occur significantly more often in the GA group (Carter 2010; Parkenov 2013).
Significant heterogeneity of results on MRI assessment of new or enlarging T2 and brain volume changes was probably related to differences in the MRI protocol and measures of image acquisition protocol (Cadavid 2009a; O'Connor 2009a; Filippi 2011).
Quality of the evidence
Six RCTs were included, but only five contribute to the analyses involving large numbers of participants with similar disease characteristics. No heterogeneity of results was found when clinical end points were considered, supporting no difference in the protective effects of IFNs and GA on risk of relapse and progression.
The body of evidence was judged to be of moderate quality for most clinical and radiological outcomes, although the quality of evidence for the safety profile was found to be low (Table 1).
Potential biases in the review process
The trials search strategy and contacts initiated with the main investigators suggest the likelihood that all relevant studies were identified and all relevant data were obtained.
Agreements and disagreements with other studies or reviews
This is the first systematic review comparing IFNs and GA by using head‐to‐head RCTs in participants with RRMS.
Many reviews have been published evaluating the efficacy and safety of DMTs and other approved therapies through direct or indirect comparison in participants with RRMS, but some have considered different types of trials, outcome measures and designs.
A Cochrane systematic review reported a meta‐analysis of all available therapies in MS, including comparisons between active and placebo groups and head‐to‐head studies (Filippini 2013). Head‐to‐head trials on IFN and GA were also considered. However, in terms of risk of relapse and worsening at 24 months, the quality of the evidence was judged too low to allow meaningful comparisons, given the small sample size and the wide 95% confidence intervals. In this review, only two studies were considered (Mikol 2008; O'Connor 2009a).
Qizilbash 2012 considered both RCTs and comparative observational cohort studies and focused on participants treated with GA for RRMS or CIS versus placebo; the comparators in a subanalysis were also IFNs and standard treatment. Eleven studies were included. As compared to the present study results, an 18% reduction in clinical progression (RR 0.82, 95% CI 0.68 to 0.98) was seen in GA‐treated participants compared with those given IFNs, but only two studies were included (Mikol 2008; O'Connor 2009a). Similarly to our findings, study discontinuations due to adverse events did not differ among participants treated with GA and those given IFNs (RR 0.89, 95% CI 0.57 to 1.41). Hadjigeorgiou 2013 evaluated through direct and indirect comparisons the approved existing treatment for RRMS, but no clear conclusions were provided. Zagmutt 2013 conducted a network meta‐analysis to assess the rates of adverse events and dropout from treatment for RRMS. Placebo‐controlled RCTs evaluating immunosuppressive drugs and DMTs were included. The GA group had a significantly lower incidence rate of adverse events when compared with groups given other products. Dropouts were not significantly different across treatments, except for a higher incidence in the SC IFN‐beta 1a 22 mcg and 44 mcg groups compared with the fingolimod group.
A recent comparative study evaluating DMTs in real world clinical practice using international MSBase registry data has been conducted using propensity score matching: a slightly lower relapse incidence was found among participants treated with glatiramer acetate or subcutaneous interferon‐beta 1a relative to intramuscular interferon‐beta 1a and interferon‐beta 1b. No differences in 12‐month confirmed progression of disability were observed (Kalincik 2015).
A systematic non‐Cohrane review of observational studies and extension of randomized controlled trials (not included in our review) has been conducted to evaluate the long‐term impact of IFNs or GA on disability progression in MS. The quantitative estimate of the treatment effect in reducing progression to EDSS 6 was HR pooled = 0.49 (95% CI 0.34 to 0.69), P < 0.001, showing that treatment with immunomodulators seems to reduce long‐term probability of disability progression (Signori 2016).
Authors' conclusions
Implications for practice.
The results of this review fit into current clinical practice. IFNs and GA have played historic roles in transforming MS into a treatable disease and remain the cornerstone of treatment for RRMS as first‐line drugs or as switching therapies, even after 20 years. IFNs and GA are generally perceived as very safe drugs, in contrast with the awareness of uncommon but severe AEs associated with newly available MS treatments (Hillert 2012; Hutchinson 2012; Dubey 2016).
The results of this review support clinicians in using either of these therapies for RRMS, because of their similar safety and efficacy in the prevention of disease activity.
However, some differences in clinical and MRI measures should be underlined.
Evidence from a single study suggests better efficacy of GA over IFN in terms of relapse rate at three years of follow‐up. In addition, greater and faster reduction in MRI lesion load accrual was observed in IFN‐treated compared with GA‐treated participants with MS. These results need to be considered with caution because they are derived from a limited number of studies and participants, and because significant heterogeneity of the results is apparent. Furthermore, the clinical impact of these data is uncertain.
We were not able to draw conclusions on quality of life and tolerability of these two drugs, as these parameters were not fully assessed in this review.
Implications for research.
The following considerations should be applied to future research efforts.
Authors of RCTs should be required to include a clear data presentation, such as reasons for loss to follow‐up; this may allow more accurate interpretation and less problematic comparisons of trial results. This is true also for MRI outcome measures that need comparable protocols for image acquisition.
Comparison of IFN and GA using patient‐related outcomes such as fatigue and other specific MS‐related quality of life measures is needed, as is comparison of the effects of DMTs on cognitive function.
Researchers should be required to apply standardised sets of outcomes to produce manageable data that could be further merged in meta‐analysis.
What's new
| Date | Event | Description |
|---|---|---|
| 8 August 2016 | New search has been performed | New search was performed |
| 8 August 2016 | New citation required but conclusions have not changed | New studies have been added |
History
Protocol first published: Issue 9, 2011 Review first published: Issue 7, 2014
| Date | Event | Description |
|---|---|---|
| 22 October 2015 | Amended | Minor edit made |
Acknowledgements
We thank Dirk Pleimes, MD, Global Medical Lead Neurology (Bayer Healthcare Pharmaceuticals, Global Medical Affairs Specialized Therapeutics, Montville, M100, USA), for providing data from the primary studies (BEYOND).
We thank Andrea Fittipaldo, Trials Search Co‐ordinator, for support provided in paper retrieval. We are grateful to Liliana Coco for valuable and helpful technical assistance provided, as well as for support in drawing up the paper.
Appendices
Appendix 1. Keywords for searching the MS Group Register
{interferon\*} OR {interferon beta} OR {beta‐1 interferon} OR {beta 1 interferon} OR {interferon beta‐1\*} OR {rebif} OR {avonex} OR {betaseron} OR {beta‐seron} OR {betaferon} OR {beta‐IFN‐1\*} OR {interferon beta‐1\*} OR {Interferon‐beta\*} OR {interferon beta\*} OR {recombinant interferon beta‐1\*}
AND
{copolymer‐1} OR {cop‐1} OR {copaxone} OR {glatiramer acetate} OR {cpx} OR {cop1} OR {copolymer} OR {glatiramer} OR {immunomodulation\*} OR {immunomodulator\*} OR {immunosuppression}
AND
{relapsing remitting} OR {relapsing‐remitting } OR {remitting‐relapsing} OR {remitting relapsing}
Data and analyses
Comparison 1. Number of participants who experienced at least 1 relapse at 24 months and at end of follow‐up.
| Outcome or subgroup title | No. of studies | No. of participants | Statistical method | Effect size |
|---|---|---|---|---|
| 1 At the end of follow‐up (24 ‐ 36 months) | 4 | Risk Ratio (M‐H, Random, 95% CI) | Subtotals only | |
| 1.1 At 24 months | 3 | 2184 | Risk Ratio (M‐H, Random, 95% CI) | 1.04 [0.87, 1.24] |
| 1.2 At 36 months | 1 | 509 | Risk Ratio (M‐H, Random, 95% CI) | 1.27 [0.92, 1.75] |
| 2 During follow‐up likely scenario | 4 | Risk Ratio (M‐H, Random, 95% CI) | Subtotals only | |
| 2.1 At 24 months | 3 | 2184 | Risk Ratio (M‐H, Random, 95% CI) | 1.10 [0.91, 1.34] |
| 2.2 At 36 months | 1 | 509 | Risk Ratio (M‐H, Random, 95% CI) | 1.30 [0.98, 1.73] |
Comparison 2. Number of participants who worsened during the study (EDSS progression) at 24 months and at the end of follow‐up.
| Outcome or subgroup title | No. of studies | No. of participants | Statistical method | Effect size |
|---|---|---|---|---|
| 1 At the end of follow‐up (24‐36 months) | 4 | Risk Ratio (M‐H, Random, 95% CI) | Subtotals only | |
| 1.1 At 24 months | 3 | 2169 | Risk Ratio (M‐H, Random, 95% CI) | 1.11 [0.91, 1.35] |
| 1.2 At 36 months | 1 | 487 | Risk Ratio (M‐H, Random, 95% CI) | 0.87 [0.63, 1.20] |
| 2 During follow‐up likely scenario | 4 | Risk Ratio (M‐H, Random, 95% CI) | Subtotals only | |
| 2.1 At 24 months | 3 | 2169 | Risk Ratio (M‐H, Random, 95% CI) | 1.24 [0.81, 1.90] |
| 2.2 At 36 months | 1 | 487 | Risk Ratio (M‐H, Random, 95% CI) | 0.95 [0.71, 1.26] |
Comparison 3. Number of participants who withdrew or dropped out of the study because of adverse events.
| Outcome or subgroup title | No. of studies | No. of participants | Statistical method | Effect size |
|---|---|---|---|---|
| 1 Number of participants who dropped out for AE | 4 | 2685 | Risk Ratio (M‐H, Random, 95% CI) | 0.95 [0.64, 1.40] |
| 2 Number of participants who dropped out for SAE | 3 | 2610 | Risk Ratio (M‐H, Random, 95% CI) | 0.99 [0.63, 1.56] |
Comparison 4. Frequency of relapse (ARR).
| Outcome or subgroup title | No. of studies | No. of participants | Statistical method | Effect size |
|---|---|---|---|---|
| 1 Relapse frequency | 5 | Rate Ratio (Random, 95% CI) | Subtotals only | |
| 1.1 At 24 months | 4 | Rate Ratio (Random, 95% CI) | 1.06 [0.95, 1.18] | |
| 1.2 At 36 months | 1 | Rate Ratio (Random, 95% CI) | 1.40 [1.13, 1.74] |
Comparison 5. Time to first relapse.
| Outcome or subgroup title | No. of studies | No. of participants | Statistical method | Effect size |
|---|---|---|---|---|
| 1 Time to first relapse (HR) | 3 | Hazard Ratio (Random, 95% CI) | 1.01 [0.87, 1.16] |
Comparison 7. Number of participants treated with steroids for MS relapse.
| Outcome or subgroup title | No. of studies | No. of participants | Statistical method | Effect size |
|---|---|---|---|---|
| 1 Patients Treated with Steroids | 2 | 1420 | Risk Ratio (M‐H, Random, 95% CI) | 1.30 [0.76, 2.24] |
Comparison 9. Mean number of active (new or enlarged) T2‐hyperintense lesions per participant at 6 ‐ 12 ‐ 24 months and at end of follow‐up period.
| Outcome or subgroup title | No. of studies | No. of participants | Statistical method | Effect size |
|---|---|---|---|---|
| 1 During follow‐up | 3 | Mean Difference (IV, Random, 95% CI) | Subtotals only | |
| 1.1 At 6 months | 1 | 396 | Mean Difference (IV, Random, 95% CI) | ‐0.86 [‐1.32, ‐0.40] |
| 1.2 At 12 months | 2 | 1722 | Mean Difference (IV, Random, 95% CI) | ‐0.52 [‐1.12, 0.09] |
| 1.3 At 24 months | 3 | 1790 | Mean Difference (IV, Random, 95% CI) | ‐0.15 [‐0.68, 0.39] |
Comparison 10. Mean number of new contrast‐enhancing T1 lesions per participant at 6 ‐ 12 ‐ 24 months and at end of follow‐up period.
| Outcome or subgroup title | No. of studies | No. of participants | Statistical method | Effect size |
|---|---|---|---|---|
| 1 Mean number | 3 | Mean Difference (IV, Random, 95% CI) | Subtotals only | |
| 1.1 At 6 months | 0 | 0 | Mean Difference (IV, Random, 95% CI) | 0.0 [0.0, 0.0] |
| 1.2 At 12 months | 1 | 1233 | Mean Difference (IV, Random, 95% CI) | ‐0.10 [‐0.26, 0.06] |
| 1.3 At 24 months | 3 | 1734 | Mean Difference (IV, Random, 95% CI) | ‐0.14 [‐0.30, 0.02] |
Comparison 11. Mean change in total T2‐hyperintense lesion load at 12‐24 months and at end of follow‐up period.
| Outcome or subgroup title | No. of studies | No. of participants | Statistical method | Effect size |
|---|---|---|---|---|
| 1 Mean absolute change | 3 | Mean Difference (IV, Random, 95% CI) | Subtotals only | |
| 1.1 At 12 months | 1 | 1221 | Mean Difference (IV, Random, 95% CI) | ‐0.4 [‐0.59, ‐0.21] |
| 1.2 At 24 months | 2 | 1608 | Mean Difference (IV, Random, 95% CI) | ‐0.58 [‐0.99, ‐0.18] |
| 1.3 At 36 months | 1 | 509 | Mean Difference (IV, Random, 95% CI) | ‐0.26 [‐1.04, 0.52] |
Comparison 12. Mean change in total T1‐hypointense lesion load at 12‐24 months and at end of follow‐up.
| Outcome or subgroup title | No. of studies | No. of participants | Statistical method | Effect size |
|---|---|---|---|---|
| 1 Mean absolute change | 2 | Mean Difference (IV, Random, 95% CI) | Subtotals only | |
| 1.1 At 12 months | 1 | 1207 | Mean Difference (IV, Random, 95% CI) | ‐0.06 [‐0.18, 0.07] |
| 1.2 At 24 months | 2 | 1602 | Mean Difference (IV, Random, 95% CI) | ‐0.20 [‐0.33, ‐0.07] |
Comparison 13. Mean change in total brain volume (as a measure of atrophy) at 12‐24 months and at end of follow‐up.
| Outcome or subgroup title | No. of studies | No. of participants | Statistical method | Effect size |
|---|---|---|---|---|
| 1 Mean absolute change | 2 | Mean Difference (IV, Random, 95% CI) | Subtotals only | |
| 1.1 At 12 months | 1 | 1137 | Mean Difference (IV, Random, 95% CI) | ‐0.10 [‐0.22, 0.02] |
| 1.2 At 24 months | 2 | 1552 | Mean Difference (IV, Random, 95% CI) | ‐0.12 [‐0.23, ‐0.01] |
Characteristics of studies
Characteristics of included studies [ordered by study ID]
Cadavid 2009a.
| Methods | Multi‐centre (2 centres) performed in 1 country (USA); randomised 2‐parallel group open‐label trial Duration: 2 years Study start date: January 2003 Primary completion date: January 2007 (final data collection date for primary outcome measure) Estimated study completion date: January 2016 Acronym: BECOME |
|
| Participants | 75 participants affected by RRMS or clinically isolated syndrome CIS Inclusion criteria:
Exclusion criteria:
|
|
| Interventions |
|
|
| Outcomes | The primary efficacy outcome was combined active lesions (CALs) per scan in the first year Secondary end points included the following.
Relapses defined as all new or worsening neurological symptoms lasting 24 hours and not explained by fever or infection were considered subjective relapses. Subjective relapses confirmed by a blinded examining neurologist who used worsening scores on the Scripps Neurological Rating Scale (SNRS) or the Expanded Disability Status Scale (EDSS; Kurtzke 1983) were considered objective relapses. One or more of the following changes compared with baseline were required for objective relapse confirmation.
Progression of disability was confirmed at 6 months according to EDSS change, or Multiple Sclerosis Functional Composite Measure was evaluated in a post hoc analysis (Cadavid 2009a; Cadavid 2011) |
|
| Notes | Participants with CIS (21%) were considered participants with MS because the criteria of diagnosis were consistent with the new criteria for MS (Polman 2011) BECOME study was supported by Bayer Schering Pharma, distributors of IFN‐beta 1b This study provided the first published results from the RCT registered in ClinicalTrials.gov Identifier NCT00176592 (last access 24 November 2013) (Characteristics of ongoing studies) Study author was contacted for missing data on 13 July 2012 (concerning progression and relapse outcome), but the request for additional data was rejected Study authors' conclusions: participants with RRMS randomly assigned to IFN‐beta 1b or to GA showed similar MRI and clinical activity |
|
| Risk of bias | ||
| Bias | Authors' judgement | Support for judgement |
| Random sequence generation (selection bias) | Unclear risk | Not mentioned |
| Allocation concealment (selection bias) | Unclear risk | Not mentioned |
| Blinding of participants and personnel (performance bias) All outcomes | High risk | Participants could not be blinded because of characteristic injection reactions to IFN‐beta 1b or GA |
| Blinding of outcome assessment (detection bias) All outcomes | Unclear risk | Low risk for MRI: MRI readers were blinded to treatment High risk for clinical assessment: unblinded assessment of clinical outcomes |
| Incomplete outcome data (attrition bias) All outcomes | High risk | Even if causes of loss to follow‐up were explicit, the dropout rate was very high and was not balanced between the 2 groups: 30% with IFN versus 20.5% with GA |
| Selective reporting (reporting bias) | Low risk | All outcomes were reported (Cadavid 2009a; Cadavid 2011; Cheriyan 2012) |
| Other bias | Unclear risk | The study was sponsored by Bayer |
Calabrese 2012.
| Methods | Single‐centre (Italy), randomised, 3‐parallel group, open‐label trial Duration: 2 years Enrolment: from 1 January 2007 to 30 June 2008 Acronym: none |
|
| Participants | 165 participants with RRMS Inclusion criteria:
Exclusion criteria: previous treatment with immunosuppressive drugs |
|
| Interventions |
|
|
| Outcomes | MRI (not defined as primary or secondary)
Clinical measures (ARR, EDSS change) were also provided at 12 months and 24 months of follow‐up |
|
| Notes | The study included as a reference population 50 participants with DMTs‐untreated RRMS; this group was not randomly assigned and was not analysed This study was funded by an independent medical grant from Merck Serono S.A., Geneva, Switzerland, an affiliate of Merck KGaA, Darmstadt, Germany The study author was contacted for missing data on 14 May 2012, and on 13 July 2012 (concerning progression and relapse outcome) without reply Study authors' conclusion: DMTs significantly decreased new CL development and cortical atrophy progression compared with those seen in untreated participants, with faster and more pronounced effects with SC IFN‐beta 1a than with IM IFN‐beta 1a or GA |
|
| Risk of bias | ||
| Bias | Authors' judgement | Support for judgement |
| Random sequence generation (selection bias) | Low risk | Random allocation sequence was computer generated |
| Allocation concealment (selection bias) | Unclear risk | Not mentioned |
| Blinding of participants and personnel (performance bias) All outcomes | Unclear risk | Not mentioned |
| Blinding of outcome assessment (detection bias) All outcomes | Unclear risk | Low for MRI outcome: all images were assessed by 2 experienced observers, who were blinded to participants' identity and to treatment. Not mentioned whether clinical outcome was blinded |
| Incomplete outcome data (attrition bias) All outcomes | High risk |
|
| Selective reporting (reporting bias) | High risk | Outcome of T2‐hyperintense lesion volume planned but not reported |
| Other bias | Unclear risk | No definitions of primary or secondary outcomes were reported, nor definitions of relapse.The study was sponsored by Merck Serono |
Lublin 2013a.
| Methods | Multi‐centre (68), performed in 2 countries (USA and Canada), randomised, double‐blind, 3‐parallel group trial Duration: 3 years Enrolment: from January 2005 to April 2009 Acronym: CombiRx |
|
| Participants | 1008 participants with RRMS Inclusion criteria:
Exclusion criteria:
|
|
| Interventions | Combination therapy with IFN‐beta 1a 30 μg intramuscularly weekly and glatiramer acetate (GA) 20 mg daily versus each single agent with matching placebo, that is, as follows.
No placebo IFN + placebo GA treatment arm was included |
|
| Outcomes | Primary end point was reduction in annualised relapse rate Secondary outcomes included the following.
Relapse was defined as the appearance of a new symptom or worsening of an old symptom, attributable to MS, accompanied by a change in the neurological examination (demonstrated by a 0.5 or greater increase in EDSS score or a 2‐point change in 1 functional system or a 1‐point change in 2 functional systems, excluding bladder and cognitive changes); lasting at least 24 hours in the absence of fever; preceded by stability or improvement for at least 30 days, confirmed by the examining physician within 7 days of onset |
|
| Notes | Combined actively treated arms were not analysed This study was funded by the National Institutes of Health and the National Institute of Neurological Disorders and Stroke (Phase III study: UO1NS045719, Planning Grant R21NS41986) and was listed on www.clinicaltrials.gov (NCT00211887) Study agents and matched placebo were provided by their manufacturers, Biogen Idec and Teva Pharmaceuticals Study author was contacted for missing data (concerning progression and relapse outcome) on 13 July 2012 without reply Study authors' conclusion: combining the 2 most commonly prescribed therapies for RRMS did not produce a significant clinical benefit over 3 years |
|
| Risk of bias | ||
| Bias | Authors' judgement | Support for judgement |
| Random sequence generation (selection bias) | Low risk | Randomly assigned 2:1:1 via a computerised data entry system. Participants were randomly assigned using a permuted block design within sites with block sizes of 6 and 12 |
| Allocation concealment (selection bias) | Low risk | The computerised data entry system masked treatment arm allocation and drug dispensing to participants and all site personnel for the entire duration of the trial period |
| Blinding of participants and personnel (performance bias) All outcomes | Low risk | The computerised data entry system masked drug dispensing to all site personnel for the entire duration of the trial period |
| Blinding of outcome assessment (detection bias) All outcomes | Low risk | Treating clinicians and examining clinicians were blinded to treatment assignment |
| Incomplete outcome data (attrition bias) All outcomes | High risk |
|
| Selective reporting (reporting bias) | Low risk | All outcomes reported |
| Other bias | Unclear risk | Primary, secondary and tertiary outcomes and protocol order were modified in the results paper draft |
Mikol 2008.
| Methods | Multi‐centre (81) (14 countries: Argentina, Austria, Brazil, Canada, France, Germany, Ireland, Italy, Netherlands, Russia, Spain, Switzerland, UK and USA), randomised, 2‐parallel group, open‐label study Duration: 24 months Enrolment: from January to December 2004 Acronym: REGARD |
|
| Participants | 764 participants with RRMS Subpopulation of 460 participants (230 from each group) also had serial MRI scans to assess T2‐weighted and gadolinium‐enhancing lesion number and volume Inclusion criteria:
Exclusion criteria:
|
|
| Interventions |
|
|
| Outcomes | Primary outcome of the study was time to first relapse Secondary end points were:
Tertiary end points were as follows.
Relapse was defined as new or worsening neurological symptoms, without fever, that lasted for 48 hours or longer and were accompanied by a change in Kurtzke Functional Scale (KFS) score. Non‐qualifying relapses met the same criteria but were not accompanied by a change in KFS score. For relapse outcomes, all relapses (qualifying and non‐qualifying) were counted |
|
| Notes | The study was sponsored by EMD Serono and Pfizer Study author was contacted for missing data (concerning progression and relapse outcome) on 14 May 2012, and on 13 July 2012, without reply Additional missing data request (concerning clinical and MRI outcomes) was rejected by the drug company on 24 September 2012 Study authors' conclusion: no significant difference in the primary outcome between IFN‐1a and GA |
|
| Risk of bias | ||
| Bias | Authors' judgement | Support for judgement |
| Random sequence generation (selection bias) | Low risk | Treatments were assigned by a computer‐generated randomisation list that was stratified by centre |
| Allocation concealment (selection bias) | Unclear risk | Not mentioned |
| Blinding of participants and personnel (performance bias) All outcomes | High risk | Treating physicians and participants were not blinded |
| Blinding of outcome assessment (detection bias) All outcomes | Low risk | Physicians who assessed participants at regular intervals or at the time of a potential relapse were blinded to treatment and communicated with participants only as needed to complete the EDSS, the Kurtzke Functional Scale (KFS) and relapse assessments. Participants were asked not to discuss their treatment with the assessing physician and covered their injection sites so the physician could not guess which treatment they had received. MRI evaluations were performed blinded at the image analysis centre, the VU Medical Centre, Amsterdam, Netherlands |
| Incomplete outcome data (attrition bias) All outcomes | High risk |
|
| Selective reporting (reporting bias) | Low risk | All outcomes reported |
| Other bias | High risk | For relapse outcomes, all relapses (qualifying and non‐qualifying) were counted This study was sponsored by Merck Serono |
NCT01058005.
| Methods | Multicentre (42 study locations), randomised, open‐label study 3‐parallel groups, active‐controlled study Duration: 27 months Enrolment: from March 2010 to April 2012 Acronym: SURPASS |
|
| Participants | 84 participants with RRMS (Polman 2005) | |
| Interventions | 1. Natalizumab, 300 mg intravenous injection every 4 weeks (38 participants) 2. IFN‐beta 1a 44 mcg subcutaneously 3 times weekly (25 participants) 3. Glatiramer acetate 20 mg subcutaneously every day (21 participants) |
|
| Outcomes | Incidence of Treatment‐emergent Serious Adverse Events | |
| Notes | The study was terminated on April 2012 before completion, due to significantly slower than expected enrolment. Due to early termination of the study and the small size of the study population, there was insufficient power for efficacy and safety analyses. Only serious adverse events were to be captured and reported. These study results were provided at www.clinicaltrials.gov, National Institutes of Health, last updated August 18, 2014 (accessed 19 August 2016), in terms of partial safety. No published data have been retrieved | |
| Risk of bias | ||
| Bias | Authors' judgement | Support for judgement |
| Random sequence generation (selection bias) | Unclear risk | No data |
| Allocation concealment (selection bias) | Unclear risk | No data |
| Blinding of participants and personnel (performance bias) All outcomes | High risk | Open label |
| Blinding of outcome assessment (detection bias) All outcomes | High risk | Open label |
| Incomplete outcome data (attrition bias) All outcomes | High risk | No data on clinical and radiological outcome have been provided since the early termination because enrolment had been significantly slower than expected. Thus, the decision was made by the Sponsor to terminate the study since current and projected future enrolment rates would not have provided valuable information in a reasonable timeframe. All clinical efficacy and magnetic resonance imaging (MRI) procedures were removed from the protocol and safety assessments were to be managed through standard of care activities. Forty‐seven out of 84 participants withdrawn due to study termination |
| Selective reporting (reporting bias) | High risk | Only partial data have been reported by ClinicalTrials.gov (access 19 August 2016), regarding safety assessments that were to be managed through standard of care activities |
| Other bias | High risk | No published data have been retrieved |
O'Connor 2009a.
| Methods | Multi‐centre (198 centres in 26 countries: North and Latin America, Western and Eastern Europe and Australia), randomised, parallel‐group, double‐blind (RCDB) trial Enrolment: from November 2003 to June 2005 Duration: 24 months Acronym: BEYOND |
|
| Participants | 2244 with RRMS Inclusion criteria:
Exclusion criteria:
|
|
| Interventions |
|
|
| Outcomes | Primary end point was relapse risk Secondary outcomes were as follows.
Relapse was defined as new or recurrent neurological abnormalities that were separated by at least 30 days from onset of the preceding event, lasted at least 24 hours and occurred without fever or infection. Neurological event was deemed as a relapse only when it was associated with an increase in EDSS or functional system scores |
|
| Notes | Study arms treated with IFN 500 mcg (899 participants) were not analysed Study was sponsored by Bayer HealthCare Pharmaceuticals Additional missing data (concerning clinical and MRI outcomes) were provided by Dirk Pleimes, Global Medical Lead Neurology, Bayer Healthcare Pharmaceuticals (Pleimes 2013) Study authors' conclusion: no difference in clinical outcomes was found |
|
| Risk of bias | ||
| Bias | Authors' judgement | Support for judgement |
| Random sequence generation (selection bias) | Low risk | Participants were randomly assigned in a 2:2:1 ratio by the central randomisation group with use of permuted blocks randomisation with regional stratification |
| Allocation concealment (selection bias) | Unclear risk | Not mentioned |
| Blinding of participants and personnel (performance bias) All outcomes | High risk | Treating physicians were aware of treatment assignments. Participants were blind only for the 2 doses of IFN, not for GA. Participants were double‐blind to comparisons between the 2 doses. Autoinjector use was mandatory for all participants. To ensure masking between the 2 doses of interferon‐beta 1b, medication was identical in appearance, packaging and labelling |
| Blinding of outcome assessment (detection bias) All outcomes | Low risk | Evaluating physicians were masked to all random assignments. Participants covered their injection sites during neurological examinations and did not discuss adverse events with the evaluating physician |
| Incomplete outcome data (attrition bias) All outcomes | High risk | Dropout rate was 12.6% in IFN group versus 16.5% in GA group Reasons for discontinuation were not reported in 78/104 (75%) IFN‐treated and 24/71 (33%) GA‐treated Types of AEs justifying study discontinuation were not described Analysis was per protocol (not ITT) Causes of dropouts were not reported (113/161 (70%); 75/104 (72%); 47/74 (63%)) for most participants Numbers of participants with “confirmed EDSS progression (year 2)” and “proportion relapse free (year 2)” and “at least one major relapse (year 2)” were deleted (only proportions were given) because data in all 3 rows were derived from log‐rank tests and Kaplan–Meier estimates (see Erratum 2012; O'Connor 2009a) |
| Selective reporting (reporting bias) | High risk | 5 tertiary clinical outcomes not planned in methods section but reported in results section (Table 3) |
| Other bias | Unclear risk | Online publication has been corrected, taking into account Erratum data. Corrected versions first appeared at Lancet.com/Neurology on 19 January 2011, and on 9 December 2011. Study was sponsored by Bayer. Sponsor had no role in data collection, data analysis, data interpretation or writing of the report. All study authors who were members of the publication committee had full access to all data in the study, and the corresponding author had final responsibility for the decision to submit for publication |
Abbreviations:
ARR: annual relapse rate.
CAL: combined active lesion.
CIS: clinically isolated syndrome.
CL: cortical lesion.
CUA: combined unique active.
DMT: disease‐modifying therapy.
EDSS: Expanded Disability Status Scale.
GA: glatiramer acetate.
IFN: interferon.
ITT: intention‐to‐treat.
IV: intravenous.
IVIg: intravenous immunoglobulin.
KFS: Kurtzke Functional Scale.
MRI: magnetic resonance scale.
MS: multiple sclerosis.
MSFC: Multiple Sclerosis Functional Composite.
NL: new lesion.
RCDB: randomised, controlled, double‐blind.
RRMS: relapsing‐remitting multiple sclerosis.
SC: subcutaneous.
SNRS: Scripps Neurological Rating Scale.
Characteristics of excluded studies [ordered by study ID]
| Study | Reason for exclusion |
|---|---|
| Barbato 2011 | Intervention group not matching our criteria. This was an RCT; open‐label design, evaluating the efficacy of fingolimod after prior treatment with DMTs for MS (EPOC study) versus continued therapy with DMTs (IFN‐beta 1a, IFN‐beta 1b or GA) Preliminary results available only in abstract meeting book. No published data have been retrieved |
| Beer 2011 | Not an RCT. Observational study on the prevalence of injection site reactions with DMTs |
| Carra 2008 | Not an RCT. Observational study evaluating the effects of switching immuno‐modulator treatments in participants who responded inadequately to first treatment |
| Carter 2010 | Not an RCT. Review of use of glatiramer acetate in RRMS and in CIS |
| Comi 2009 | Intervention group not matching our criteria. RCT evaluating the efficacy of glatiramer acetate versus placebo in participants with CIS |
| Comi 2011 | Intervention group not matching our criteria. RCT evaluating the effects of 2 doses of GA (20 mg and 40 mg) |
| Del Santo 2011 | Not an RCT. Review article investigating the effectiveness of drugs, Including interferon, glatiramer, natalizumab or fingolimod, for RRMS |
| Ghezzi 2005 | Not an RCT. Multi‐centre collaborative study evaluating the effects of immunomodulatory treatment in participants younger than 16 years of age |
| Kalincik 2015 | Not an RCT. Pairwise analysis of the international MSBase registry data was conducted using propensity score matching. Treatment with injectable immunomodulators |
| Khan 2001 | Not an RCT. Prospective, open‐label treatment trial of immunomodulatory therapy IFN‐b 1a (Avonex 1), IFN‐b 1b (Betaseron 1) and GA (Copaxone 1) in participants with RRMS |
| Khan 2012 | Not an RCT. Retrospective study in which participants with RRMS were treated with DMTs to examine the effects of DMTs (IFN‐beta and GA) on brain volume over a 5‐year period |
| Khan 2013 | Intervention group not matching our criteria. RCT comparing GA 40 mg administered 3 times weekly with placebo in participants with RRMS |
| Khoury 2010 | Intervention group not matching our criteria. RCT evaluating the effects of albuterol as add‐on treatment to glatiramer acetate therapy |
| Ouallet 2010 | Not an RCT. Review article comparing the efficacy and safety of immunomodulatory treatments for MS |
| Qizilbash 2012 | Not an RCT. Review assessing the benefit‐risk (BR) profile of GA in RRMS and CIS |
| Salama 2003 | No answer from the authors about more details (last request on 15 July 2016) |
| Spelman 2015 | Not an RCT. Participants included were registered in MSBase or the TYSABRI Observational Program (TOP). The aim was to compare treatment efficacy and persistence in participants who switched to natalizumab versus those who switched between glatiramer acetate (GA) and interferon‐beta (IFNb) after an on‐treatment relapse on IFNb or GA using propensity score matched real‐world data sets. |
Abbreviations:
BR: benefit‐risk.
CIS: clinically isolated syndrome.
DMT: disease‐modifying therapy.
GA: glatiramer acetate.
IFN: interferon.
MS: multiple sclerosis.
RCT: randomised controlled trial.
RRMS: relapsing‐remitting multiple sclerosis
Characteristics of ongoing studies [ordered by study ID]
EUCTR2012‐003735‐32‐GR.
| Trial name or title | A 96‐weeks, prospective, multicentre, randomised, open label, active‐controlled, parallel groups, phase 2b/3 study to compare efficacy and safety of masitinib to first line treatment, in patients with relapsing remitting multiple sclerosis with unsatisfactory response to first line treatment |
| Methods | Indirect comparison of masitinib to interferon beta‐1a, interferon beta‐1b, peginterferon beta‐1a or glatiramer acetate in people with relapsing remitting multiple sclerosis with unsatisfactory response to these first line treatments Allocation: randomised Intervention model: parallel assignment Masking: open label Acronym: none |
| Participants | 450: 400 Adults (18 to 64 years) and 50 Elderly (≥ 65 years) |
| Interventions | Comparison of masitinib to interferon‐beta 1a, interferon‐beta 1b, peginterferon‐beta 1a or glatiramer acetate |
| Outcomes | Primary outcome: annualised relapse rate defined as the number of confirmed relapses per year at 96 weeks Secondary outcomes: ‐ EDSS Cumulative probability of sustained disability progression at week 12, 24, 48, 72 and 96 in EDSS EDSS score at week 12, 24, 48, 72 and 96 ‐ Relapse Relapse rate per participant at week 12, 24, 48, 72 and 96 Use of corticosteroids for multiple sclerosis Severity of relapse and number of hospitalisation for potential relapse • MRI endpoints: T1 gadolinium‐enhancing lesions at week 48 and 96, T2 hyperintense lesions at week 48 and 96, T1 hypointense lesions at week 48 and 96; Atrophy: measure of brain parenchymal fraction (BPF) at week 48 and 96, MRI criteria from ASL (Arterial Spi Labelling): cerebral blood flow (CBF) in ml/100 g/min, cerebral blood volume (CBV) in ml/100 g and mean transit time (MTT) in seconds, at baseline, week 48 and 96 (optional) • Multiple Sclerosis Functional Composite (MSFC) at week 12, 24, 48, 72 and 96 • Quality of life assessment: MSQOL‐54 at week 12, 24, 48, 72 and 96; EQ‐Visual Analogue Scale for Quality of life at week 12, 24, 48, 72 and 96; Beck Depression Inventory at week 12, 24, 48, 72 and 96; Modified Fatigue Impact Scale at week 12, 24, 48, 72 and 96 • Safety profile Clinical and biological safety profile: occurrence of Adverse Events, potential changes in vital signs, ECG, chest X‐ray and biological parameters |
| Starting date | 19 November 2015 (accessed 29 July 2016) |
| Contact information | Name of contact point: Vincent Arnold Address: AB Science, 3, avenue George V, Paris, France email: vincent.arnold@ab‐science.com |
| Notes | Trial protocol ongoing. No results available (access 29 July 2016) |
NCT00176592.
| Trial name or title | Phase IV, rater‐blinded, randomised study comparing the effects of 250 mg of Betaseron with 20 mg of Copaxone in participants with relapsing‐remitting or clinically isolated forms of multiple sclerosis using 3 tesla MRI with triple‐dose gadolinium |
| Methods | Head‐to‐head comparison of interferon‐beta and Copaxone for treatment of participants with clinically isolated syndrome (CIS) and relapsing‐remitting (RR) forms of multiple sclerosis (MS) using acute changes on magnetic resonance imaging (MRI) as the primary outcome Randomised controlled trial Allocation: randomised Intervention model: parallel assignment Masking: open label Acronym: BECOME |
| Participants | Estimated enrolment: 75 (CIS and RRMS) |
| Interventions | Head‐to‐head comparison of interferon‐beta and Copaxone |
| Outcomes | Primary outcome measure: number of "combined active" lesions by monthly MRI at conclusion of the study Secondary outcome measures: number of enhancing lesions, number of new lesions, number of "combined active" disease‐free participants |
| Starting date | January 2003 |
| Contact information | New Jersey Medical School, Newark, NJ 07103, USA Sponsors and collaborators: University of Medicine and Dentistry of New Jersey Principal investigator: Diego Cadavid, MD |
| Notes | Estimated study completion date: January 2016 Study is ongoing but is not recruiting participants (ClinicalTrials.gov, US National Institutes of Health); no study results posted (access 29 July 2016) |
NCT01623596.
| Trial name or title | A 12‐month, Prospective, Randomized, Active‐controlled, Open‐label multicenter Study to Evaluate the Patient Retention of Fingolimod vs. Approved First‐line Disease Modifying Therapies in Adults With Relapsing Remitting Multiple Sclerosis (PREFERMS) |
| Methods | Randomized Parallel Assignment Open Label Phase 4 study. Participants will be treatment naive or have only been treated with one class of DMT (Interferon beta preparation or glatiramer acetate). Participants will be able to switch to different treatment for safety, efficacy, tolerability or convenience during the study. |
| Participants | Estimated enrolment: 881 RRMS |
| Interventions | Drug: Fingolimod Drug: disease‐modifying therapy‐Interferon Beta preparation (Exctavia, Betaseron, Rebif, Avonex) or glatiramer acetate (Copaxone) |
| Outcomes | Primary outcome measures: retention on treatment (time frame: 12 months) Secondary objectives are to compare reasons for discontinuation, adverse events, cognitive impairment, medication satisfaction and change in brain volume measured by MRI. |
| Starting date | June 2012 |
| Contact information | Novartis Pharmaceuticals |
| Notes | This study has been completed. July 2015 (final data collection date for primary outcome measure). No study results posted (accessed 29 July 2016) |
Differences between protocol and review
Outcomes
The secondary clinical outcome "Mean change in EDSS disability score" was deleted because it was considered not relevant.
The secondary clinical outcomes "Mean number of active (new or enlarged) T2‐hyperintense lesions per participant" and "Mean number of new contrast‐enhancing T1 lesions per participant" at 3 months were not evaluated because considered not relevant
The definition of outcome "Number of relapse free" was changed to "Number of participants who experienced a relapse" for consistency.
Analysis
Treatment schedules not approved in RRMS treatment and not used in clinical practice were not included in the analysis.
Scoring of overall quality of the study was better defined.
Sensitivity analysis exploring the impact of loss to follow‐up was performed using a likely scenario because that is more understandable.
We used risk ratio instead of odds ratio because this measure is suitable for the design of included studies, as studies provided neither infrequent events nor unbalanced groups.
The Table 1 was added.
Contributions of authors
| Roles and responsibilities | |
| Drafting the protocol | All review authors |
| Selecting which studies to include | LLM, SF, AG |
| Planning data sheet for study data extraction | LLM, AV, GR, CDP |
| Planning data sheet for MRI data extraction | LLM, AV, MR, CDP |
| Extracting data from studies, double‐checking data and resolving discrepancies | LLM, AV, MR, FB, SF, AL, GR |
| Assessing risk of bias of included studies | LLM, AV, SF |
| Entering data into RevMan | LLM, AV, CDP |
| Planning the strategy analysis | LLM, AV, MR, CDP |
| Carrying out statistical analysis, interpreting statistical results | CDP, AV, LLM |
| Carrying out and interpreting the results and drafting the final review | LLM, AV, MR, CDP, BWG |
| Providing review control, according to Standards for the Reporting of New Cochrane Intervention Reviews | LLM, AV |
| Updating the review | LLM, AV, AL, SF |
Sources of support
Internal sources
-
Cochrane Multiple Sclerosis Group, The Cochrane Collaboration, Other.
Cochrane MS Review Group, Neuroepidemiology Unit. Fondazione IRCCS Istituto Neurologico Carlo Besta, via Celoria 11, 20133 Milan, Italy
External sources
No sources of support supplied
Declarations of interest
This Cochrane review has no commercial sponsorship.
MR and BWG have participated in meetings and trials sponsored by large pharmaceutical companies.
LLM, SF, AG, FB, GR, AL, CDP, and AV have no conflicts of interest.
New search for studies and content updated (no change to conclusions)
References
References to studies included in this review
Cadavid 2009a {published data only}
- Cadavid D, Cheriyan J, SkurnickJ, LincolnJ A, Wolansky LJ, Cook SD. New acute and chronic black holes in patients with multiple sclerosis randomised to interferon beta‐1b or glatiramer acetate. Journal Neurology Neurosurgery and Psychiatry 2009;80(12):1337‐43. [DOI] [PubMed] [Google Scholar]
- Cadavid D, Kim S, Peng B, Skurnick J, Younes M, Hill J, et al. Clinical consequences of MRI activity in treated multiple sclerosis. Multiple Sclerosis Journal 2011;17(9):1113–21. [DOI] [PubMed] [Google Scholar]
- Cadavid D, Wolansky LJ, Skurnick J, Lincoln J, Cheriyan J, Szczepanowski K, et al. Efficacy of treatment of MS with IFNbeta‐1b or glatiramer acetate by monthly brain MRI in the BECOME study. Neurology 2009;72(23):1976‐83. [DOI] [PubMed] [Google Scholar]
- Cheriyan J, Kim S, Wolansky LJ, Cook SD, Cadavid D. Impact of inflammation on brain volume in multiple sclerosis. Archives of Neurology 2012;69(1):82‐8. [DOI] [PubMed] [Google Scholar]
Calabrese 2012 {published data only}
- Calabrese M, Bernardi V, Atzori M, Mattisi I, Favaretto A, Rinaldi F, et al. Effect of disease‐modifying drugs on cortical lesions and atrophy in relapsing–remitting multiple sclerosis. Multiple Sclerosis Journal 2012;18(4):418–24. [DOI] [PubMed] [Google Scholar]
Lublin 2013a {published data only}
- Lindsey JW, Scott TF, Lynch SG, Cofield SS, Nelson F, Conwit R, et al. The CombiRx trial of combined therapy with interferon and glatiramer acetate in relapsing remitting MS: design and baseline characteristics. Multiple Sclerosis and Related Disorders 2012;1(2):81‐6. [DOI] [PubMed] [Google Scholar]
- Lublin F, Cofield S, Cutter G, Conwit R, Narayana P, Nelson F, et al. The CombiRx trial: a multi‐center, double‐blind, randomized study comparing the combined use of interferon beta‐1a and glatiramer acetate to either agent alone in participants with relapsing remitting multiple sclerosis ‐ clinical outcomes. Neurology 2012;78(1 Suppl 1):PL02.003. [Google Scholar]
- Lublin F, Cofield S, Cutter G, Salter A, Wang J, Conwit R, et al. EDSS changes in CombiRx: blinded, 7‐year extension results for progression and improvement. Neurology 2013;80(7 Suppl 1):P04.121. [Google Scholar]
- Lublin F, Cofield S, Cutter G, Salter A, Wang J, Conwit R, et al. Relapse activity in the CombiRx trial: blinded, 7‐year extension results. Neurology 2013;80(7 Suppl 1):S01.002. [Google Scholar]
- Lublin FD, Cofield SS, Cutter GR, Conwit R, Narayana PA, Nelson F, et al. Randomized study combining interferon and glatiramer acetate in multiple sclerosis. Annals of Neurology 2013;73(3):327–40. [DOI] [PMC free article] [PubMed] [Google Scholar]
- Wolinsky J, Narayana P, Nelson F, Datta S, Cofield S, Cutter G, et al. The CombiRx trial: a multi‐center, double‐blind, randomized study comparing the combined use of interferon beta‐1a and glatiramer acetate to either agent alone in participants with relapsing remitting multiple sclerosis ‐ MRI outcomes. Neurology 2012;78(Suppl 1):S11.002. [Google Scholar]
- Wolinsky J, Salter A, Narayana P, Datta S, Nelson F, Cofield S, et al. MRI outcomes in CombiRx: blinded, 7‐year extension results. Neurology 2013;80(Suppl 7):S01.003. [Google Scholar]
Mikol 2008 {published data only}
- Coyle PK, Cornelisse P, Lehr L, Stubinski B. Time course of injection‐site reactions to subcutaneous interferon beta‐1a or glatiramer acetate in the REGARD Study. Proceedings of the 24th Annual Meeting of the Consortium of Multiple Sclerosis Centers, June 2–5, San Antonio, Texas, USA. 2010.
- Mikol DD, Barkhof F, Chang P, Coyle PK, Jeffery DR, Schwid SR, et al. Comparison of subcutaneous interferon beta‐1a with glatiramer acetate in patients with relapsing multiple sclerosis (the REbif vs Glatiramer Acetate in Relapsing MS Disease [REGARD] study): a multicentre, randomised, parallel, open‐label trial. Lancet Neurology 2008;7(10):903‐14. [DOI] [PubMed] [Google Scholar]
- Sørensen S. REGARD: what can we learn from randomised, open‐label, head‐to‐head studies?. Lancet 2008;7(10):864‐6. [DOI] [PubMed] [Google Scholar]
NCT01058005 {unpublished data only}
- NCT01058005. Study Evaluating Rebif, Copaxone, and Tysabri for Active Multiple Sclerosis [A Multicenter, Randomized, Open‐Label, Parallel‐Group, Active‐Controlled Study to Evaluate the Benefits of Switching Therapy (Glatiramer Acetate or Interferon Beta‐1a) to Natalizumab in Subjects With Relapsing Remitting Multiple Sclerosis]. clinicaltrials.gov/show/NCT01058005 (first received 26 January 2010).
O'Connor 2009a {published data only}
- Filippi M, Rocca MA, Camesasca F, Cook S, O’Connor P, Arnason BG, et al. Interferon‐1b and glatiramer acetate effects on permanent black hole evolution. Neurology 2011;76(14):1222–8. [DOI] [PMC free article] [PubMed] [Google Scholar]
- Goodin DS, Hartung HP, O'Connor P, Filippi M, Arnason B, Comi G, et al. Neutralizing antibodies to interferon beta‐1b multiple sclerosis: a clinico‐radiographic paradox in the beyond trial. Multiple Sclerosis 2012;18(2):181‐95. [DOI] [PubMed] [Google Scholar]
- Lampl C, Nagl S, Arnason B, Comi G, O’Connor P, Cook S, et al. Efficacy and safety of interferon beta‐1b SC in older RRMS patients‐a post hoc analysis of the BEYOND study. Journal of Neurology 2013;260(7):1838‐45. [DOI] [PubMed] [Google Scholar]
- O'Connor P, Filippi M, Arnason B, Comi G, Cook S, Goodin D, et al. 250 microg or 500 microg interferon beta‐1b versus 20 mg glatiramer acetate in relapsing‐remitting multiple sclerosis: a prospective, randomised, multicentre study. Lancet Neurology 2009;8(10):889‐97. [DOI] [PubMed] [Google Scholar]
- O’Connor P, Arnason B, Comi GC, Filippi M, Cook S, Newark NJ, et al. Interferon beta‐1b 500 mcg, Interferon beta‐1b 250 mcg and glatiramer acetate: primary outcomes of the betaferon® efficacy yielding outcomes of a new dose study. Neurology 2008;71:LBS.004. [Google Scholar]
- O’Connor P, Filippi M, Arnason B, Comi G, Cook S, Goodin D. 250 μg or 500 μg interferon beta‐1b versus 20 mg glatiramer acetate in relapsing‐remitting multiple sclerosis: a prospective, randomised, multicentre study. Errata. Lancet Neurology 2011; Vol. 10, issue 2:115. [DOI] [PubMed]
- O’Connor P, Filippi M, Arnason B, Comi G, Cook S, Goodin D, et al. 250 μg or 500 μg interferon beta‐1b versus 20 mg glatiramer acetate in relapsing‐remitting multiple sclerosis: a prospective, randomised, multicentre study [Errata]. Lancet Neurology 2009;8(11):981. [DOI] [PubMed] [Google Scholar]
- O’Connor P, Filippi M, Arnason B, Comi G, Cook S, Goodin D, et al. 250 μg or 500 μg interferon beta‐1b versus 20 mg glatiramer acetate in relapsing‐remitting multiple sclerosis: a prospective, randomised, multicentre study. Errata. Lancet Neurology 2012;11(1):27. [DOI] [PubMed] [Google Scholar]
- Pleimes D, Pohl C, Beckmann K, Stolz C. BEYOND Study – Data for Cochrane Analyses Protocol No. 306440. Bayer HealthCare Pharmaceuticals Affairs Specialized Therapeutics 2013.
References to studies excluded from this review
Barbato 2011 {published data only}
- Barbato LM, Schofield L, McCague K, Pestreich L, Tobias K, Malhotra M, et al. Randomized, open‐label study to evaluate patient‐reported outcomes (PRO) with fingolimod after changing from prior disease‐modifying therapy (DMT) for relapsing multiple sclerosis. American Neurological Association (ANA) 136th Annual Meeting, September 25 ‐ 27, 2011; San Diego, California. 2011.
Beer 2011 {published data only}
- Beer K, Müller M, Hew‐Winzeler AM, Bont A, Maire P, You X, et al. The prevalence of injection‐site reactions with disease‐modifying therapies and their effect on adherence in patients with multiple sclerosis: an observational study. Bacteriologia, Virusologia, Parazitologia, Epidemiologia 2011;11(144):2‐7. [DOI] [PMC free article] [PubMed] [Google Scholar]
Carra 2008 {published data only}
- Carra A, Onaha P, Luetic G, Burgos M, Crespo E, Deri N, et al. Therapeutic outcome 3 years after switching of immunomodulatory therapies in patients with relapsing‐remitting multiple sclerosis in Argentina. European Journal Neurology 2008;15(4):386‐93. [DOI] [PubMed] [Google Scholar]
Carter 2010 {published data only}
- Carter NJ, Keating GM. Glatiramer acetate: a review of its use in relapsing‐remitting multiple sclerosis and in delaying the onset of clinically definite multiple sclerosis. Drugs 2010;70(12):1545‐77. [DOI] [PubMed] [Google Scholar]
Comi 2009 {published data only}
- Comi G, Martinelli V, Rodegher M, Moiola L, Bajenaru O, Carra A, et al. Effect of glatiramer acetate on conversion to clinically definite multiple sclerosis in patients with clinically isolated syndrome (PreCISe study): a randomised, double‐blind, placebo‐controlled trial. Lancet 2009;374:1503–11. [DOI] [PubMed] [Google Scholar]
Comi 2011 {published data only}
- Comi G, Cohen JA, Arnold DL, Wynn D, Filippi M, FORTE Study Group. Phase III dose‐comparison study of glatiramer acetate for multiple sclerosis. Annals of Neurology 2011;69(1):75‐82. [DOI] [PubMed] [Google Scholar]
Del Santo 2011 {published data only}
- Santo F, Maratea D, Fadda V, Trippoli S, Messori A. Treatments for relapsing–remitting multiple sclerosis: summarising current information by network meta‐analysis. European of Journal Clinical Pharmacology 2011;68(4):441‐8. [DOI] [PubMed] [Google Scholar]
Ghezzi 2005 {published data only}
- Ghezzi A, Amato MP, Capobianco M, Gallo P, Marrosu G, Martinelli V, et al. Disease‐modifying drugs in childhood‐juvenile multiple sclerosis: results of an Italian co‐operative study. Multiple Sclerosis 2005;11(4):420‐4. [DOI] [PubMed] [Google Scholar]
Kalincik 2015 {published data only}
- Kalincik T, Jokubaitis V, Izquierdo G, Duquette P, Girard M, Grammond P, et al. Comparative effectiveness of glatiramer acetate and interferon beta formulations in relapsing‐remitting multiple sclerosis. Multiple Sclerosis (Houndmills, Basingstoke, England) 2015;21:1159‐71. [DOI] [PubMed] [Google Scholar]
Khan 2001 {published data only}
- Khan OA, Tselis AC, Kamholz JA, Garbern JY, Lewis RA, Lisak RP. A prospective, open‐label treatment trial to compare the effect of IFNbeta‐1a (Avonex), IFNbeta‐1b (Betaseron), and glatiramer acetate (Copaxone) on the relapse rate in relapsing‐remitting multiple sclerosis: results after 18 months of therapy. Multiple Sclerosis (Houndmills, Basingstoke, England) 2001;7(6):349‐53. [DOI] [PubMed] [Google Scholar]
Khan 2012 {published data only}
- Khan O, Bao F, Shah M, Caon C, Alexandros T, Selis A, et al. Effect of disease‐modifying therapies on brain volume in relapsing–remitting multiple sclerosis: results of a five‐year brain MRI study. Journal of the Neurological Sciences 2012;312:7–12. [DOI] [PubMed] [Google Scholar]
Khan 2013 {published data only}
- Khan O, Rieckmann P, Boyko A, Selmaj K, Zivadinov R, GALA Study Group. Three times weekly glatiramer acetate in relapsing‐remitting multiple sclerosis. Annals of Neurology 2013;73(6):705‐13. [DOI] [PubMed] [Google Scholar]
Khoury 2010 {published data only}
- Khoury SJ, Healy BC, Kivisäkk P, Viglietta V, Egorova S, Guttmann CR, et al. A randomised controlled double‐masked trial of albuterol add‐on therapy in patients with multiple sclerosis. Archives of Neurology 2010;67(9):1055‐61. [DOI] [PMC free article] [PubMed] [Google Scholar]
Ouallet 2010 {published data only}
- Ouallet JC. Immunomodulatory treatments for multiple sclerosis: lessons from direct comparative studies [Traitements de fond de la sclérose en plaques: enseignements des études randomisées comparatives directes]. Reveu Neurologique 2010;166(1):21‐31. [DOI] [PubMed] [Google Scholar]
Qizilbash 2012 {published data only}
- Qizilbash N, Mendez I, Sanchez‐de la Rosa R. Benefit‐risk analysis of glatiramer acetate for relapsing‐remitting and clinically isolated syndrome. Multiple Sclerosis Clinical Therapy 2012;34(1):159‐76. [DOI] [PubMed] [Google Scholar]
Salama 2003 {published data only}
- Salama HH, Abu‐Hashim EM, Bakry MA, Zhang J, Mongui A. Twelve‐month comparative study of the impacts of IFNb‐1a (Avonex), IFNb‐1b (Betaseron) and glatiramer acetate (Copaxone) on the clinical, MRI and immunological responses in relapsing‐remitting multiple sclerosis. Neurosciences (Official Journal of the Pan Arab Union of Neurological Sciences) 2003;8:93‐4. [Google Scholar]
Spelman 2015 {published data only}
- Spelman T, Kalincik T, Zhang A, Pellegrini F, Wiendl H, Kappos L, et al. Comparative efficacy of switching to natalizumab in active multiple sclerosis. Annals of Clinical and Translational Neurology 2015;2(4):373–87. [DOI] [PMC free article] [PubMed] [Google Scholar]
References to ongoing studies
EUCTR2012‐003735‐32‐GR {unpublished data only}
- EUCTR2012‐003735‐32‐GR. Study to compare the efficacy and/or safety of masitinib to interferon beta‐1a, interferon beta‐1b, peginterferon beta‐1a or glatiramer acetate in patients with relapsing remitting multiple sclerosis with unsatisfactory response to these first line treatments [A 96‐weeks, prospective, multicentre, randomised, open label, active‐controlled, parallel groups, phase 2b/3 study to compare efficacy and safety of masitinib to first line treatment, in patients with relapsing remitting multiple sclerosis with unsatisfactory response to first line treatment]. www.clinicaltrialsregister.eu/ctr‐search/trial/2012‐003735‐32/GR. ., (first received 19 November 2015).
NCT00176592 {unpublished data only}
- NCT00176592. Phase IV Study, Betaseron Versus Copaxone for Relapsing Remitting or CIS Forms of MS Using Triple Dose Gad 3 T MRI [Phase IV, rater‐blinded, randomized study, comparing 250 mg of betaseron with 20 mg of copaxone in patients with the relapsing‐remitting(RR) or CIS forms of ms using 3 tesla (3T) magnetic resonance imaging (MRI) with triple‐dose gadolinium]. ClinicalTrials.gov/show/NCT00176592 (first received 13 September 2005).
NCT01623596 {published and unpublished data}
- NCT01623596. Evaluation of Patient Retention of Fingolimod vs. Currently Approved Disease Modifying Therapy in Patients With Relapsing Remitting Multiple Sclerosis [A 12‐month, Prospective, Randomized, Active‐controlled, Open‐label Study to Evaluate the Patient Retention of Fingolimod vs. Approved First‐line Disease Modifying Therapies in Adults With Relapsing Remitting Multiple Sclerosis (PREFERMS)]. https://clinicaltrials.gov/ct2/show/study/NCT01623596 (first received 18 June 2012).
Additional references
Alonso 2008
- Alonso A, Hernan MA. Temporal trends in the incidence of multiple sclerosis: a systematic review. Neurology 2008;71(2):129‐35. [MEDLINE: ] [DOI] [PMC free article] [PubMed] [Google Scholar]
Cadavid 2009b
- Cadavid D, Cheriyan J, Skurnick J, Lincoln JA, Wolansky LJ, Cook SD. New acute and chronic black holes in patients with multiple sclerosis randomised to interferon beta‐1b or glatiramer acetate. Journal Neurology Neurosurgery and Psychiatry 2009;80(12):1337‐43. [DOI] [PubMed] [Google Scholar]
Cadavid 2011
- Cadavid D, Kim S, Peng B, Skurnick J, Younes M, Hill J, et al. Clinical consequences of MRI activity in treated multiple sclerosis. Multiple Sclerosis Journal 2011;17(9):1113–21. [DOI] [PubMed] [Google Scholar]
Chard 2011
Cheriyan 2012
- Cheriyan J, Kim S, Wolansky LJ, Cook SD, Cadavid D. Impact of inflammation on brain volume in multiple sclerosis. Archives of Neurology 2012;69(1):82‐8. [DOI] [PubMed] [Google Scholar]
Comi 2001
- Comi G, Filippi M, Wolinsky JS. European/Canadian multicenter, double‐blind, randomized, placebo‐controlled study of the effects of glatiramer acetate on magnetic resonance imaging—measured disease activity and burden in patients with relapsing multiple sclerosis. European/Canadian Glatiramer Acetate Study Group. Annals of Neurology 2001;49(3):290–7. [PubMed] [Google Scholar]
Compston 2008
- Compston A, Coles A. Multiple sclerosis. Lancet 2008;372(9648):1502‐17. [DOI] [PubMed] [Google Scholar]
Coyle 2010
- Coyle PK, Cornelisse P, Lehr L, Stubinski B. Time course of injection‐site reactions to subcutaneous interferon beta‐1a or glatiramer acetate in the REGARD Study. Proceedings of 24th Annual Meeting of the Consortium of Multiple Sclerosis Centers, June 2–5, San Antonio, Texas, USA. 2010.
DerSimonian 1986
- DerSimonian R, Laird N. Meta‐analysis in clinical trials. Controlled Clinical Trials 1986;7(3):177‐88. [MEDLINE: ] [DOI] [PubMed] [Google Scholar]
Dhib‐Jalbut 2010
- Dhib‐Jalbut S, Marks S. Interferon beta mechanism of action in multiple sclerosis. Neurology 2010;74(1 Suppl):17‐24. [DOI] [PubMed] [Google Scholar]
Dubey 2016
- Dubey D, Cano CA, Stüve O. Update on monitoring and adverse effects of approved second‐generation disease‐modifying therapies in relapsing forms of multiple sclerosis. Current Opinion in Neurology 2016;29(3):278‐85. [DOI] [PubMed] [Google Scholar]
FDA 1993
- U.S. Food, Drug Administration. Betaseron® Product Approval Information ‐ Application No 103471‐ July 1993. http://www.accessdata.fda.gov/drugsatfda_docs/nda/pre96/103471s0000_APPROV.pdf (accessed September 2016).
FDA 1996
- U.S. Food, Drug Administration. Avonex® Product Approval Information ‐ Application N. 103628 ‐ May 1996. http://www.accessdata.fda.gov/drugsatfda_docs/appletter/1996/ifnbbio051796l.pdf (accessed September 2016).
FDA 2001
- U.S. Food, Drug Administration. Copaxone® Product Approval Information ‐ NDA 020622/S‐015 ‐ March 2001. http://www.accessdata.fda.gov/drugsatfda_docs/nda/2001/020622_S015_COPAXONE_INJECTION_AP.pdf (accessed September 2016).
FDA 2002
- U.S. Food, Drug Administration. Rebif® Product Approval Information ‐ Application No 103780 ‐ March 2002. http://www.fda.gov/downloads/Drugs/DevelopmentApprovalProcess/HowDrugsareDevelopedandApproved/ApprovalApplications/TherapeuticBiologicApplications/ucm094508.pdf (accessed September 2016).
FDA 2009
- U.S. Food, Drug Administration. Extavia® Product Approval Information ‐ Application No.125290 ‐ August 2009. http://www.accessdata.fda.gov/drugsatfda_docs/appletter/2009/125290s0000ltr.pdf (accessed September 2016).
FDA 2013
- U.S. Food, Drug Administration. Safety ‐ What is a Serious Adverse Event?. http://www.fda.gov/safety/medwatch/howtoreport/ucm053087.htm (accessed September 2016).
FDA 2014
- U.S. Food, Drug Administration. Plegridy® Product Approval Information‐ BLA 125499/S‐011‐ August 2014. http://www.accessdata.fda.gov/drugsatfda_docs/label/2016/125499s011lbl.pdf (accessed September 2016).
Filippi 2011
- Filippi M, Rocca MA, Camesasca F, Cook S, O’Connor P, Arnason BG, et al. Interferon ‐1b and glatiramer acetate effects on permanent black hole evolution. Neurology 2011;76(14):1222–8. [DOI] [PMC free article] [PubMed] [Google Scholar]
Filippini 2013
- Filippini G, Giovane C, Vacchi L, D'Amico R, Pietrantonj C, Beecher D, et al. Immunomodulators and immunosuppressants for multiple sclerosis: a network meta‐analysis. Cochrane Database of Systematic Reviews 2013, Issue 6. [DOI: 10.1002/14651858.CD008933] [DOI] [PMC free article] [PubMed] [Google Scholar]
Fisniku 2008
- Fisniku LK, Chard DT, Jackson JS, Anderson VM, Altmann DR, Miszkiel KA, et al. Gray matter atrophy is related to long‐term disability in multiple sclerosis. Annals of Neurology 2008;64(3):247‐54. [DOI] [PubMed] [Google Scholar]
Goodin 2008a
- Goodin DS. Disease‐modifying therapy in multiple sclerosis. Update and clinical implications. Neurology 2008;71 Suppl 3:8–13. [DOI] [PubMed] [Google Scholar]
Goodin 2008b
- Goodin D. Comparative studies of glatiramer acetate and interferon beta. International Multiple Sclerosis Journal 2008;15(2):39‐41. [PubMed] [Google Scholar]
Goodin 2012
- Goodin DS, Hartung HP, O'Connor P, Filippi M, Arnason B, Comi G, et al. Neutralizing antibodies to interferon beta‐1b multiple sclerosis: a clinico‐radiographic paradox in the BEYOND trial. Multiple Sclerosis (Houndmills, Basingstoke, England) 2012;18(2):181‐95. [DOI] [PubMed] [Google Scholar]
GRADE Working Group 2004
- GRADE Working Group. Grading quality of evidence and strength of recommendations. BMJ 2004;328:1490‐4. [DOI] [PMC free article] [PubMed] [Google Scholar]
GRADEpro 2008 [Computer program]
- Brozek J, Oxman A, Schünemann H. GRADEpro. Version 3.2 for Windows. GRADE Working Group, 2008.
Hadjigeorgiou 2013
- Hadjigeorgiou G, Doxani C, Miligkos M, Ziakas P, Bakalos G, Papadimitriou D, et al. A network meta‐analysis of randomized controlled trials for comparing the effectiveness and safety profile of treatments with marketing authorization for relapsing multiple sclerosis. Journal of Clinical Pharmacy and Therapeutics 2013;38(6):433‐9. [DOI] [PubMed] [Google Scholar]
Higgins 2003
- Higgins JP, Thompson SG, Deeks JJ, Altman DG. Measuring inconsistency in meta‐analyses. British Medical Journal 2003;327(7414):557‐60. [DOI] [PMC free article] [PubMed] [Google Scholar]
Higgins 2011
- Higgins JP, Green S editor(s). Cochrane Handbook for Systematic Reviews of Interventions Version 5.1.0 (updated March 2011). The Cochrane Collaboration, 2011. Available from handbook.cochrane.org.
Hillert 2012
- Hillert J. In the coming year we should abandon interferons and glatiramer acetate as first line therapy for MS: No. Multiple Sclerosis (Houndmills, Basingstoke, England) 2012;19(1):26‐8. [DOI] [PubMed] [Google Scholar]
Hutchinson 2012
- Hutchinson M. In the coming year we should abandon interferons and glatiramer acetate as first line therapy for MS: commentary. Multiple Sclerosis (Houndmills, Basingstoke, England) 2012;19(1):29‐30. [DOI] [PubMed] [Google Scholar]
IFN MSSG 1995
- The IFNB Multiple Sclerosis Study Group. Interferon beta‐1b is effective in relapsing‐remitting multiple sclerosis. I. Clinical results of a multicenter, randomized, double‐blind, placebo‐controlled trial. Neurology 1993;43(4):655–61. [DOI] [PubMed] [Google Scholar]
Jacobs 1996
- Jacobs LD, Cookfair DL, Rudick RA, Herndon RM, Richert JR, Salazar AM, et al. Intramuscular interferon beta‐1a for disease progression in relapsing multiple sclerosis. The Multiple Sclerosis Collaborative Research Group (MSCRG). Annals of Neurology 1996;39(3):285–94. [DOI] [PubMed] [Google Scholar]
Jelinek 2015
- Jelinek GA, Weiland TJ, Hadgkiss EJ, Marck CH, Pereira N, Dania M, Meer DM. Medication use in a large international sample of people with multiple sclerosis: associations with quality of life, relapse rate and disability. Neurological Research 2015;37(8):662‐73. [DOI] [PMC free article] [PubMed] [Google Scholar]
Johnson 1995
- Johnson KP, Brooks BR, Cohen JA, Ford CC, Goldstein J, Lisak RP, et al. Copolymer 1 reduces relapse rate and improves disability in relapsing‐remitting multiple sclerosis: results of a phase III multi‐center, double‐blind placebo‐controlled trial: the Copolymer 1 Multiple Sclerosis Study Group. Neurology 1995;45(7):1268–76. [DOI] [PubMed] [Google Scholar]
Kurtzke 1983
- Kurtzke JF. Rating neurological impairment in multiple sclerosis: an Expanded Disability Status Scale (EDSS). Neurology 1983;33(11):1444‐52. [MEDLINE: ] [DOI] [PubMed] [Google Scholar]
La Mantia 2010
- La Mantia, Munari LM, Lovati R. Glatiramer acetate for multiple sclerosis. Cochrane Database of Systematic Reviews 2010, Issue 5. [DOI: 10.1002/14651858.CD004678.pub2] [DOI] [PMC free article] [PubMed] [Google Scholar]
Lampi 2013
- Lampl C, Nagl S, Arnason B, Comi G, O'Connor P, Cook S, et al. Efficacy and safety of interferon beta‐1b sc in older RRMS patients‐a posthoc analysis of the BEYOND study. Journal of Neurology 2013;260(7):1838‐45. [DOI] [PubMed] [Google Scholar]
Lindsey 2012
- Lindsey JW, Scott TF, Lynch SG, Cofield SS, Nelson F, Conwit R, et al. The CombiRx trial of combined therapy with interferon and glatiramer acetate in relapsing remitting MS: design and baseline characteristics. Multiple Sclerosis and Related Disorders 2012;1(2):81‐6. [DOI] [PubMed] [Google Scholar]
Lublin 2012
- Lublin F, Cofield S, Cutter G, Conwit R, Narayana P, Nelson F, et al. The CombiRx trial: a multi‐center, double‐blind, randomized study comparing the combined use of interferon beta‐1a and glatiramer acetate to either agent alone in participants with relapsing remitting multiple sclerosis ‐ clinical outcomes. Neurology 2012;78(1 Suppl 1):PL02.00. [Google Scholar]
Lublin 2013b
- Lublin F, Cofield S, Cutter G, Salter A, Wang J, Conwit R, et al. EDSS changes in CombiRx: blinded, 7‐year extension results for progression and improvement. Proceedings of the 65th American Academy of Neurology (AAN) Annual Meeting. Neurology 2013;80:1. [Google Scholar]
Lublin 2013c
- Lublin F, Cofield S, Cutter G, Salter A, Wang J, Conwit R, et al. Relapse activity in the CombiRx trial: blinded, 7‐year extension results. Neurology 2013;80(1 Suppl1):1. [Google Scholar]
McDonald 2001
- McDonald WI, Compston A, Edan G, Goodkin D, Hartung HP, Lublin FD, et al. Recommended diagnostic criteria for multiple sclerosis: guidelines from the International Panel on the Diagnosis of Multiple Sclerosis. Annals of Neurology 2001;50(1):121‐7. [MEDLINE: ] [DOI] [PubMed] [Google Scholar]
O'Connor 2008
- O’Connor P, Arnason B, Comi G, Filippi M, Cook S, Goodin D, et al. Interferon beta‐1b 500 mcg, interferon beta‐1b 250 mcg and glatiramer acetate: primary outcomes of the Betaferon® efficacy yielding outcomes of a new dose study. Neurology 2008;71:153. [Google Scholar]
O'Connor 2009b
- O’Connor P, Filippi M, Arnason B, Comi G, Cook S, Gooding D, et al. 250 μg or 500 μg interferon beta‐1b versus 20 mg glatiramer acetate in relapsing‐remitting multiple sclerosis: a prospective, randomised, multicentre study. Errata. Lancet Neurology 2009;8:981. [DOI] [PubMed] [Google Scholar]
O'Connor 2011
O'Connor 2012
- O’Connor P, Filippi M, Arnason B, Comi G, Cook S, Gooding D, et al. 250 μg or 500 μg interferon beta‐1b versus 20 mg glatiramer acetate in relapsing‐remitting multiple sclerosis: a prospective, randomised, multicentre study. Errata. Lancet Neurology 2012;11:27. [DOI] [PubMed] [Google Scholar]
Oleen‐Burkey 2013
- Oleen‐Burkey M, Cyhaniuk A, Swallow E. Treatment patterns in multiple sclerosis: administrative claims analysis over 10 years. Journal of Medical Economics 2013;16(3):397‐406. [DOI] [PubMed] [Google Scholar]
Oliver 2010
- Oliver BJ, Kohli E, Kasper LH. Interferon therapy in relapsing‐remitting multiple sclerosis: a systematic review and meta‐analysis of the comparative trials. Journal of the Neurological Sciences 2010;302(1‐2):96‐105. [DOI] [PubMed] [Google Scholar]
Parkenov 2013
- Parkenov V, Schluep M, Du Pasquier R. Assessing risk of multiple sclerosis therapies. Journal of Neurosurgical Sciences 2013;332(1‐2):59‐65. [DOI] [PubMed] [Google Scholar]
Pleimes 2013
- Pleimes D, Pohl C, Beckmann K, Stolz C. BEYOND Study – Data for Cochrane Analyses Protocol No. 306440. Personal communication. Bayer HealthCare Pharmaceuticals Affairs Specialized Therapeutics 2013.
Polman 2005
- Polman CH, Reingold SC, Edan G, Filippi M, Hartung HP, Kappos L, et al. Diagnostic criteria for multiple sclerosis: 2005 revision to the "McDonald Criteria". Annals of Neurology 2005;58(6):840‐6. [MEDLINE: ] [DOI] [PubMed] [Google Scholar]
Polman 2011
- Polman CH, Reingold SC, Banwell B, Clanet M, Cohen JA, Filippi M, et al. Diagnostic criteria for multiple sclerosis: 2010 revisions to the McDonald criteria. Annals of Neurology 2011;69(2):292‐302. [DOI] [PMC free article] [PubMed] [Google Scholar]
Popescu 2013
- Popescu V, Agosta F, Hulst HE, Sluimer IC, Knol DL, Sormani MP, et al. Brain atrophy and lesion load predict long term disability in multiple sclerosis. Journal of Neurology, Neurosurgery and Psychiatry 2013;84(10):1082‐91. [DOI] [PubMed] [Google Scholar]
Poser 1983
- Poser CM, Paty DW, Scheinberg L, McDonald WI, Davis FA, Ebers GC, et al. New diagnostic criteria for multiple sclerosis:guidelines for research protocols. Annals of Neurology 1983;13(3):227‐31. [MEDLINE: ] [DOI] [PubMed] [Google Scholar]
PRISMS 1998
- PRISMS Study Group. Randomised double‐blind placebo‐controlled study of interferon beta‐1a in relapsing/remitting multiple sclerosis. Lancet 1998;352:1498–504. [PubMed] [Google Scholar]
Racke 2010
- Racke MK, Lovett‐Racke AE, Karandikar NJ. The mechanism of action of glatiramer acetate treatment in multiple sclerosis. Neurology 2010;74 Suppl 1:25‐30. [DOI] [PubMed] [Google Scholar]
Review Manager 2016 [Computer program]
- The Nordic Cochrane Centre, The Cochrane Collaboration. Review Manager 5 (RevMan). Version 5.3. Copenhagen: The Nordic Cochrane Centre, The Cochrane Collaboration, 2014.
Rice 2001
- Rice GPA, Incorvaia B, Munari LM, Ebers G, Polman C, D’Amico R, et al. Interferon in relapsing‐remitting multiple sclerosis. Cochrane Database of Systematic Reviews 2001, Issue 4. [DOI: 10.1002/14651858.CD002002] [DOI] [PMC free article] [PubMed] [Google Scholar]
Richards 2002
- Richards R, Sampson F, Beard S, Tappenden P. A review of the natural history and epidemiology of multiple sclerosis: implications for resource allocation and health economic models. Health Technology Assessment 2002;6(18):1‐73. [MEDLINE: ] [DOI] [PubMed] [Google Scholar]
Rotstein 2010
- Rotstein DL, Mamdani M, O'Connor PW. Increasing use of disease modifying drugs for MS in Canada. Canadian Journal of the Neurological Sciences 2010;37(3):383‐8. [MEDLINE: ] [DOI] [PubMed] [Google Scholar]
Rudick 2009
- Rudick RA, Fisher E. Do interferon beta‐1b and glatiramer acetate grow brain?. Lancet Neurology 2009;8(12):1085‐6. [DOI] [PubMed] [Google Scholar]
Rudick 2010
- Rudick RA, Lee LC, Cutter GR, Miller DM, Bourdette D, Weinstock‐Guttman B, et al. Disability progression in a clinical trial of relapsing‐remitting multiple sclerosis: eight year follow‐up. Archives of Neurology 2010;67(11):1329‐35. [DOI] [PubMed] [Google Scholar]
Schünemann 2011
- Schünemann HJ, Oxman AD, Higgins JPT, Vist GE, Glasziou P, Guyatt GH. Chapter 11: Presenting results and ‘Summary of findings' tables. In: Higgins JPT, Green S (editors), Cochrane Handbook for Systematic Reviews of Interventions Version 5.1.0 [updated March 2011]. The Cochrane Collaboration, 2011. www.cochrane‐handbook.org.
Signori 2016
- Signori A, Gallo F, Bovis F, Tullio N, Maietta I, Sormani MP. Long‐term impact of interferon or Glatiramer acetate in multiple sclerosis: A systematic review and meta‐analysis. Multiple Sclerosis and Related Disorders 2016;6:57‐63. [DOI] [PubMed] [Google Scholar]
Sterne 2011
- Sterne JAC, Egger M, Moher D (editors). Chapter 10: Addressing reporting biases. In: Higgins JPT, Green S (editors). Cochrane Handbook for Systematic Reviews of Intervention. Version 5.1.0 [updated March 2011]. The Cochrane Collaboration, 2011. www.cochrane‐handbook.org.
Sørensen 2008
Vickrey 1995
- Vickrey BG, Hays RD, Harooni R, Harooni R, Ellison GW. A health‐related quality of life measure for multiple sclerosis. Quality of Life Research 1995;4(3):187‐206. [DOI] [PubMed] [Google Scholar]
Weinshenker 1989
- Weinshenker BG, Bass B, Rice GP, Noseworthy J, Carriere W, Baskerville J, et al. The natural history of multiple sclerosis: a geographically based study. I. Clinical course and disability. Brain 1989;112(Pt 1):133‐46. [DOI] [PubMed] [Google Scholar]
Weinstock‐Guttman 2008
- Weinstok‐Guttman B, Rmanathan M, Zwadinov R. Interferon‐beta treatment for relapsing multiple sclerosis. Expert Opinion on Biological Therapy 2008;8(9):1435‐47. [MEDLINE: ] [DOI] [PubMed] [Google Scholar]
Wolinsky 2012
- Wolinsky J, Narayana P, Nelson F, Datta S, Cofield S, Cutter G, et al. The CombiRx trial: a multi‐center, double‐blind, randomized study comparing the combined use of interferon beta‐1a and glatiramer acetate to either agent alone in participants with relapsing remitting multiple sclerosis ‐ MRI outcomes. Neurology. 2012; Vol. 78, issue 1 Suppl 1:S11.002.
Wolinsky 2013
- Wolinsky J, Salter A, Narayana P, Datta S, Nelson F, Cofield S, et al. MRI outcomes in CombiRx: blinded, 7‐year extension results. Neurology 2013;80(7 Suppl 1):1. [Google Scholar]
Yusuf 1985
- Yusuf S, Peto R, Lewis J, Collins R, Sleight P. Beta‐blockade during and after myocardial infarction: an overview of the randomised trials. Progress in Cardiovascular Diseases 1985;27(5):335‐71. [DOI] [PubMed] [Google Scholar]
Zagmutt 2013
- Zagmutt F, Carroll C. A network meta‐analysis assessing the rate of adverse events and drop outs of alternative treatments for relapsing forms of multiple sclerosis. Neurology. 2013; Vol. 80, issue 7 Suppl 1:1.
Zhornitsky 2015
- Zhornitsky S, Greenfield J, Koch MW, Patten SB, Harris C, Wall W, et al. Long‐term persistence with injectable therapy in relapsing‐remitting multiple sclerosis: an 18‐year observational cohort study. PLoS One 2015;10(4):e0123824. [DOI] [PMC free article] [PubMed] [Google Scholar]
Zivadinov 2008
- Zivadinov R, Reder AT, Filippi M, Minagar A, Stüve O, Lassmann H, et al. Mechanisms of action of disease‐modifying agents and brain volume changes in multiple sclerosis. Neurology 2008;71(2):136‐44. [DOI] [PubMed] [Google Scholar]
References to other published versions of this review
La Mantia 2014
- Mantia L, Pietrantonj C, Rovaris M, Rigon G, Frau S, Berardo F, Gandini A, Longobardi A, Weinstock‐Guttman B, Vaona A. Interferons‐beta versus glatiramer acetate for relapsing‐remitting multiple sclerosis. Cochrane Database of Systematic Reviews 2014, Issue 7. [DOI: 10.1002/14651858.CD009333.pub2] [DOI] [PubMed] [Google Scholar]