

Abstract
Background
Dietary advice is the main strategy for managing gestational diabetes mellitus (GDM). It remains unclear what type of advice is best.
Objectives
To assess the effects of different types of dietary advice for women with GDM for improving health outcomes for women and babies.
Search methods
We searched Cochrane Pregnancy and Childbirth's Trials Register (8 March 2016), PSANZ's Trials Registry (22 March 2016) and reference lists of retrieved studies.
Selection criteria
Randomised controlled trials comparing the effects of different types of dietary advice for women with GDM.
Data collection and analysis
Two authors independently assessed study eligibility, risk of bias, and extracted data. Evidence quality for two comparisons was assessed using GRADE, for primary outcomes for the mother: hypertensive disorders of pregnancy; caesarean section; type 2 diabetes mellitus; and child: large‐for‐gestational age; perinatal mortality; neonatal mortality or morbidity composite; neurosensory disability; secondary outcomes for the mother: induction of labour; perineal trauma; postnatal depression; postnatal weight retention or return to pre‐pregnancy weight; and child: hypoglycaemia; childhood/adulthood adiposity; childhood/adulthood type 2 diabetes mellitus.
Main results
In this update, we included 19 trials randomising 1398 women with GDM, at an overall unclear to moderate risk of bias (10 comparisons). For outcomes assessed using GRADE, downgrading was based on study limitations, imprecision and inconsistency. Where no findings are reported below for primary outcomes or pre‐specified GRADE outcomes, no data were provided by included trials.
Primary outcomes
Low‐moderate glycaemic index (GI) versus moderate‐high GI diet (four trials): no clear differences observed for: large‐for‐gestational age (risk ratio (RR) 0.71, 95% confidence interval (CI) 0.22 to 2.34; two trials, 89 infants; low‐quality evidence); severe hypertension or pre‐eclampsia (RR 1.02, 95% CI 0.07 to 15.86; one trial, 95 women; very low‐quality evidence); eclampsia (RR 0.34, 95% CI 0.01 to 8.14; one trial, 83 women; very low‐quality evidence) or caesarean section (RR 0.66, 95% CI 0.29 to 1.47; one trial, 63 women; low‐quality evidence).
Energy‐restricted versus no energy‐restricted diet (three trials): no clear differences seen for: large‐for‐gestational age (RR 1.17, 95% CI 0.65 to 2.12; one trial, 123 infants; low‐quality evidence); perinatal mortality (no events; two trials, 423 infants; low‐quality evidence); pre‐eclampsia (RR 1.00, 95% CI 0.51 to 1.97; one trial, 117 women; low‐quality evidence); or caesarean section (RR 1.12, 95% CI 0.80 to 1.56; two trials, 420 women; low‐quality evidence).
DASH (Dietary Approaches to Stop Hypertension) diet versus control diet (three trials): no clear differences observed for: pre‐eclampsia (RR 1.00, 95% CI 0.31 to 3.26; three trials, 136 women); however there were fewer caesarean sections in the DASH diet group (RR 0.53, 95% CI 0.37 to 0.76; two trials, 86 women).
Low‐carbohydrate versus high‐carbohydrate diet (two trials): no clear differences seen for: large‐for‐gestational age (RR 0.51, 95% CI 0.13 to 1.95; one trial, 149 infants); perinatal mortality (RR 3.00, 95% CI 0.12 to 72.49; one trial, 150 infants); maternal hypertension (RR 0.40, 95% CI 0.13 to 1.22; one trial, 150 women); or caesarean section (RR 1.29, 95% CI 0.84 to 1.99; two trials, 179 women).
High unsaturated fat versus low unsaturated fat diet (two trials): no clear differences observed for: large‐for‐gestational age (RR 0.54, 95% CI 0.21 to 1.37; one trial, 27 infants); pre‐eclampsia (no cases; one trial, 27 women); hypertension in pregnancy (RR 0.54, 95% CI 0.06 to 5.26; one trial, 27 women); caesarean section (RR 1.08, 95% CI 0.07 to 15.50; one trial, 27 women); diabetes at one to two weeks (RR 2.00, 95% CI 0.45 to 8.94; one trial, 24 women) or four to 13 months postpartum (RR 1.00, 95% CI 0.10 to 9.61; one trial, six women).
Low‐GI versus high‐fibre moderate‐GI diet (one trial): no clear differences seen for: large‐for‐gestational age (RR 2.87, 95% CI 0.61 to 13.50; 92 infants); caesarean section (RR 1.91, 95% CI 0.91 to 4.03; 92 women); or type 2 diabetes at three months postpartum (RR 0.76, 95% CI 0.11 to 5.01; 58 women).
Diet recommendation plus diet‐related behavioural advice versus diet recommendation only (one trial): no clear differences observed for: large‐for‐gestational age (RR 0.73, 95% CI 0.25 to 2.14; 99 infants); or caesarean section (RR 0.78, 95% CI 0.38 to 1.62; 99 women).
Soy protein‐enriched versus no soy protein diet (one trial): no clear differences seen for: pre‐eclampsia (RR 2.00, 95% CI 0.19 to 21.03; 68 women); or caesarean section (RR 1.00, 95% CI 0.57 to 1.77; 68 women).
High‐fibre versus standard‐fibre diet (one trial): no primary outcomes reported.
Ethnic‐specific versus standard healthy diet (one trial): no clear differences observed for: large‐for‐gestational age (RR 0.14, 95% CI 0.01 to 2.45; 20 infants); neonatal composite adverse outcome (no events; 20 infants); gestational hypertension (RR 0.33, 95% CI 0.02 to 7.32; 20 women); or caesarean birth (RR 1.20, 95% CI 0.54 to 2.67; 20 women).
Secondary outcomes
For secondary outcomes assessed using GRADE no differences were observed: between a low‐moderate and moderate‐high GI diet for induction of labour (RR 0.88, 95% CI 0.33 to 2.34; one trial, 63 women; low‐quality evidence); or an energy‐restricted and no energy‐restricted diet for induction of labour (RR 1.02, 95% CI 0.68 to 1.53; one trial, 114 women, low‐quality evidence) and neonatal hypoglycaemia (average RR 1.06, 95% CI 0.48 to 2.32; two trials, 408 infants; very low‐quality evidence).
Few other clear differences were observed for reported outcomes. Longer‐term health outcomes and health services use and costs were largely not reported.
Authors' conclusions
Evidence from 19 trials assessing different types of dietary advice for women with GDM suggests no clear differences for primary outcomes and secondary outcomes assessed using GRADE, except for a possible reduction in caesarean section for women receiving a DASH diet compared with a control diet. Few differences were observed for secondary outcomes.
Current evidence is limited by the small number of trials in each comparison, small sample sizes, and variable methodological quality. More evidence is needed to assess the effects of different types of dietary advice for women with GDM. Future trials should be adequately powered to evaluate short‐ and long‐term outcomes.
Keywords: Female; Humans; Pregnancy; Caloric Restriction; Cesarean Section; Cesarean Section/statistics & numerical data; Diabetes, Gestational; Diabetes, Gestational/diet therapy; Diet, Carbohydrate‐Restricted; Diet, Diabetic; Dietary Carbohydrates; Dietary Carbohydrates/administration & dosage; Dietary Fiber; Dietary Fiber/administration & dosage; Glycemic Index; Hypertension; Hypertension/epidemiology; Pregnancy Complications, Cardiovascular; Pregnancy Complications, Cardiovascular/epidemiology; Randomized Controlled Trials as Topic
Plain language summary
Different types of dietary advice for women with gestational diabetes mellitus
What is the issue?
Gestational diabetes mellitus (GDM) is a carbohydrate intolerance resulting in excess of sugar in the blood (hyperglycaemia) that begins or is first recognised during pregnancy. Dietary counselling or advice is the main strategy for helping women manage GDM, but it is not clear what dietary advice is best. In this review we set out to determine what dietary advice for women with GDM is best for reducing health complications for women and their babies.
Why is this important?
Women with GDM are at increased risk of developing high blood pressure and pre‐eclampsia (high blood pressure with swelling and protein in the urine) during pregnancy. The babies can grow large for their gestational age. As a result, they may be injured at birth, or cause injury to their mothers during the birth. The babies are more likely to have their birth induced or be born by caesarean section. Both the women and their babies are at increased risk of long‐term health problems including type 2 diabetes and disability.
What evidence did we find?
We searched the medical literature on 8 March 2016 and for this updated review we included 19 randomised controlled trials involving 1398 women with GDM and their babies. The overall risk of bias of the trials was unclear or moderate because of methodological limitations and the quality of the evidence was low or very low. The studies were generally small, few compared the same or similar interventions, and the outcomes they reported on were not comprehensive.
Ten different dietary advice comparisons were included. These were: 1) a low‐moderate glycaemic index (GI) diet with a moderate‐high GI diet (four trials); 2) an energy‐restricted diet with a diet with no energy restriction (three trials); 3) a 'Dietary Approaches to Stop Hypertension (DASH)' diet rich in fruits, vegetables, whole grains and low‐fat dairy products with a control diet (three trials); 4) a low‐carbohydrate diet with a high‐carbohydrate diet (two trials); 5) a high unsaturated fat diet with a low unsaturated fat diet (two trials); 6) a low‐GI diet with a high‐fibre moderate‐GI diet (one trial); 7) diet recommendations and diet‐related behavioural advice with diet recommendations only (one trial); 8) a soy protein‐enriched diet with a diet with no soy protein (one trial); 9) a high‐fibre diet with a standard‐fibre diet (one trial); and 10) an ethnic‐specific diet with a standard healthy diet (one trial).
The review found no clear differences between the different types of dietary advice on the number of women with high blood pressure during pregnancy including pre‐eclampsia (nine trials in six different diet comparisons), large‐for‐gestational age babies (eight trials in seven different diet comparisons), perinatal deaths including stillbirth and death around the time of the birth (three trials in two different diet comparisons), type 2 diabetes development for the mother (two trials in two different diet comparisons), and a composite outcome of neonatal deaths or ill‐health (one trial in one diet comparison). No clear difference was seen in the number of babies delivered by caesarean section (10 trials in eight different diet comparisons) except for a reduction with a DASH diet. None of the included trials reported on later disability during childhood for the babies.
A range of other outcomes were looked at with no consistent differences reported between the different types of dietary advice. Outcomes related to longer‐term health for women and their babies, and the use and costs of health services were largely not reported.
What does this mean?
Dietary advice is the main strategy for managing GDM, however it remains unclear what type of advice is best. Conclusive evidence from randomised controlled trials is not yet available to guide practice, although a wide range of dietary advice interventions have been investigated. Few trials have compared the same or similar interventions, trials have been small and have reported limited findings. Further large, well‐designed, randomised controlled trials are required to assess the effects of different types of dietary advice for women with GDM for improving health outcomes for women and their babies in the short and long term.
Summary of findings
Summary of findings for the main comparison. Summary of findings: Low‐moderate GI diet versus moderate‐high GI diet (maternal outcomes).
| Low‐moderate GI diet versus moderate‐high GI diet (maternal outcomes) | ||||||
|
Patient or population: pregnant women with GDM Settings: 4 RCTs in Australia, Canada, China and Mexico Intervention: low‐moderate GI diet Comparison: moderate‐high GI diet | ||||||
| Outcomes | Illustrative comparative risks* (95% CI) | Relative effect (95% CI) | No of participants (studies) | Quality of the evidence (GRADE) | Comments | |
| Risk with moderate‐high GI diet | Risk with low‐moderate GI diet | |||||
| Hypertensive disorders of pregnancy: severe hypertension or pre‐eclampsia | Study population | RR 1.02 (0.07 to 15.86) | 95 (1 RCT) | ⊕⊝⊝⊝ VERY LOW1,2 |
1 RCT in China | |
| 21 per 1000 | 21 per 1000 (2 to 333) | |||||
| Hypertensive disorders of pregnancy: eclampsia | Study population | RR 0.34 (0.01 to 8.14) | 83 (1 RCT) | ⊕⊝⊝⊝ VERY LOW1,2 |
1 RCT in China | |
| 24 per 1000 | 8 per 1000 (0 to 195) | |||||
| Caesarean section | Study population | RR 0.66 (0.29 to 1.47) | 63 (1 RCT) | ⊕⊕⊝⊝ LOW3,4 |
1 RCT in Australia | |
| 344 per 1000 | 227 per 1000 (100 to 506) | |||||
| Induction of labour | Study population | RR 0.88 (0.33 to 2.34) | 63 (1 RCT) | ⊕⊕⊝⊝ LOW3,4 |
1 RCT in Australia | |
| 219 per 1000 | 193 per 1000 (72 to 512) | |||||
| Perineal trauma | Not reported | |||||
| Type 2 diabetes mellitus | Not reported | |||||
| Postnatal depression | Not reported | |||||
| Postnatal weight retention or return to pre‐pregnancy weight | Not reported | |||||
| *The risk in the intervention group (and its 95% confidence interval) is based on the assumed risk in the comparison group and the relative effect of the intervention (and its 95% CI). CI: confidence interval; GDM: gestational diabetes mellitus; GI: glycaemic index; RR: risk ratio | ||||||
| GRADE Working Group grades of evidence High quality: Further research is very unlikely to change our confidence in the estimate of effect. Moderate quality: Further research is likely to have an important impact on our confidence in the estimate of effect and may change the estimate. Low quality: Further research is very likely to have an important impact on our confidence in the estimate of effect and is likely to change the estimate. Very low quality: We are very uncertain about the estimate. | ||||||
1Design limitations: one study at high risk of selection and performance bias; unclear risk of detection bias.
2Imprecision: wide confidence interval crossing the line of no effect, few events and small sample size.
3Design limitations: one study at unclear risk of selection and detection bias; high risk of performance bias.
4Imprecision: wide confidence interval crossing the line of no effect and small sample size.
Summary of findings 2. Summary of findings: Low‐moderate GI diet versus moderate‐high GI diet (neonatal/child/adulthood outcomes).
| Low‐moderate GI diet versus moderate‐high GI diet (neonatal/child/adulthood outcomes) | ||||||
|
Patient or population: pregnant women with GDM Settings: 4 RCTs in Australia, Canada, China and Mexico Intervention: low‐moderate GI diet Comparison: moderate‐high GI diet | ||||||
| Outcomes | Illustrative comparative risks* (95% CI) | Relative effect (95% CI) | No of participants (studies) | Quality of the evidence (GRADE) | Comments | |
| Risk with moderate‐high GI diet | Risk with low‐moderate GI diet | |||||
| Large‐for‐gestational age | Study population | RR 0.71 (0.22 to 2.34) | 89 (2 RCTs) | ⊕⊕⊝⊝ LOW1,2 |
2 RCTs in Australia and Canada | |
| 146 per 1000 | 104 per 1000 (32 to 342) | |||||
| Perinatal mortality | Not reported | |||||
| Neonatal mortality or morbidity composite | Not reported | |||||
| Neonatal hypoglycaemia | Not reported | |||||
| Childhood/adulthood neurosensory disability | Not reported | |||||
| Childhood/adulthood adiposity | Not reported | |||||
| Childhood/adulthood type 2 diabetes mellitus | Not reported | |||||
| *The risk in the intervention group (and its 95% confidence interval) is based on the assumed risk in the comparison group and the relative effect of the intervention (and its 95% CI). CI: confidence interval; GDM: gestational diabetes mellitus; GI: glycaemic index; RR: risk ratio | ||||||
| GRADE Working Group grades of evidence High quality: Further research is very unlikely to change our confidence in the estimate of effect. Moderate quality: Further research is likely to have an important impact on our confidence in the estimate of effect and may change the estimate. Low quality: Further research is very likely to have an important impact on our confidence in the estimate of effect and is likely to change the estimate. Very low quality: We are very uncertain about the estimate. | ||||||
1Design limitations: one study at unclear risk of selection bias; two at high risk of performance bias and unclear risk of detection bias.
2Imprecision: wide confidence interval crossing the line of no effect and small sample sizes.
Summary of findings 3. Summary of findings: Energy‐restricted diet versus no energy‐restricted diet (maternal outcomes).
| Energy‐restricted diet versus no energy‐restricted diet | ||||||
|
Patient or population: pregnant women with GDM Settings: 3 RCTs in Australia, Canada and the United States Intervention: energy‐restricted diet Comparison: no energy‐restricted diet | ||||||
| Outcomes | Illustrative comparative risks* (95% CI) | Relative effect (95% CI) | No of participants (studies) | Quality of the evidence (GRADE) | Comments | |
| Risk with no energy‐restricted diet | Risk with energy‐restricted diet | |||||
| Hypertensive disorders of pregnancy: pre‐eclampsia | Study population | RR 1.00 (0.51 to 1.97) | 117 (1 RCT) | ⊕⊕⊝⊝ LOW1,2 |
1 RCT in Australia | |
| 222 per 1000 | 222 per 1000 (113 to 437) | |||||
| Caesarean section | Study population | RR 1.12 (0.80 to 1.56) | 420 (2 RCTs) | ⊕⊕⊝⊝ LOW3,4 |
2 RCTs in Australia and Canada | |
| 228 per 1000 | 255 per 1000 (182 to 356) | |||||
| Induction of labour | Study population | RR 1.02 (0.68 to 1.53) | 114 (1 RCT) | ⊕⊕⊝⊝ LOW1,2 |
1 RCT in Australia | |
| 451 per 1000 | 460 per 1000 (307 to 690) | |||||
| Perineal trauma | Not reported | |||||
| Type 2 diabetes mellitus | Not reported | |||||
| Postnatal depression | Not reported | |||||
| Postnatal weight retention or return to pre‐pregnancy weight | Not reported | |||||
| *The risk in the intervention group (and its 95% confidence interval) is based on the assumed risk in the comparison group and the relative effect of the intervention (and its 95% CI). CI: confidence interval; GDM: gestational diabetes mellitus; GI: glycaemic index; RR: risk ratio | ||||||
| GRADE Working Group grades of evidence High quality: Further research is very unlikely to change our confidence in the estimate of effect. Moderate quality: Further research is likely to have an important impact on our confidence in the estimate of effect and may change the estimate. Low quality: Further research is very likely to have an important impact on our confidence in the estimate of effect and is likely to change the estimate. Very low quality: We are very uncertain about the estimate. | ||||||
1Design limitations: one study at unclear risk of selection and detection bias.
2Imprecision: wide confidence interval crossing the line of no effect and small sample size.
3Design limitations: two studies at unclear risk of selection bias; one at high risk of performance bias and unclear risk of detection bias.
4Imprecision: wide confidence interval crossing the line of no effect.
Summary of findings 4. Summary of findings: Energy‐restricted diet versus no energy‐restricted diet (neonatal/child/adulthood outcomes).
| Energy‐restricted diet versus no energy‐restricted diet (neonatal/child/adulthood outcomes) | ||||||
|
Patient or population: pregnant women with GDM Settings: 3 RCTs in Australia, Canada and the United States Intervention: energy‐restricted diet Comparison: no energy‐restricted diet | ||||||
| Outcomes | Illustrative comparative risks* (95% CI) | Relative effect (95% CI) | No of participants (studies) | Quality of the evidence (GRADE) | Comments | |
| Risk with no energy‐restricted diet | Risk with energy‐restricted diet | |||||
| Large‐for‐gestational age | Study population | RR 1.17 (0.65 to 2.12) | 123 (1 RCT) | ⊕⊕⊝⊝ LOW1,2 |
1 RCT in Australia | |
| 246 per 1000 | 288 per 1000 (160 to 522) | |||||
| Perinatal mortality | Study population | Not estimable | 423 (2 RCTs) | ⊕⊕⊝⊝ LOW3,4 |
No events; 2 RCTs in Australia and Canada | |
| 0 per 1000 | 0 per 1000 (0 to 0) | |||||
| Neonatal mortality or morbidity composite | Not reported | |||||
| Neonatal hypoglycaemia | Study population | RR 1.06 (0.48 to 2.32) | 408 (2 RCTs) | ⊕⊝⊝⊝ VERY LOW3,5,6 |
2 RCTs in Australia and Canada | |
| 190 per 1000 | 201 per 1000 (91 to 441) | |||||
| Childhood/adulthood neurosensory disability | Not reported | |||||
| Childhood/adulthood adiposity | Not reported | |||||
| Childhood/adulthood type 2 diabetes mellitus | Not reported | |||||
| *The risk in the intervention group (and its 95% confidence interval) is based on the assumed risk in the comparison group and the relative effect of the intervention (and its 95% CI). CI: confidence interval; GDM: gestational diabetes mellitus; GI: glycaemic index; RR: risk ratio | ||||||
| GRADE Working Group grades of evidence High quality: Further research is very unlikely to change our confidence in the estimate of effect. Moderate quality: Further research is likely to have an important impact on our confidence in the estimate of effect and may change the estimate. Low quality: Further research is very likely to have an important impact on our confidence in the estimate of effect and is likely to change the estimate. Very low quality: We are very uncertain about the estimate. | ||||||
1Design limitations: one study at unclear risk of selection and detection bias.
2Imprecision: wide confidence interval crossing the line of no effect and small sample size.
3Design limitations: two studies at unclear risk of selection bias; one at high risk of performance bias and unclear risk of detection bias.
4Imprecision: no events; relatively small sample sizes.
5Imprevision: wide confidence interval crossing the line of no effect.
6Inconsistency: substantial heterogeneity: I² = 75%.
Background
Description of the condition
Introduction and definition of gestational diabetes mellitus
Although there are no universally accepted diagnostic criteria, gestational diabetes mellitus (GDM) can be defined as 'glucose intolerance or hyperglycaemia (high blood glucose concentration) with onset or first recognition during pregnancy' (ACOG 2013; Hoffman 1998; Metzger 1998; Ministry of Health 2014; NICE 2015; WHO 2013). It is one of the most common pregnancy complications, with approximately 1% to 14% of pregnancies affected every year around the world (Mulla 2010). The prevalence of GDM continues to rise in line with the increasing prevalence of maternal obesity and type 2 diabetes mellitus (Bottalico 2007; Dabelea 2005; Mulla 2010; Petry 2010).
Pathophysiology of GDM
In pregnancy, insulin resistance increases with advancing gestation (Clapp 2006). Hormones secreted from the placenta, including tumour necrosis factor‐alpha (TNF‐α), placental lactogen, placental growth hormone, cortisol and progesterone are thought to be the likely triggers of these physiological changes (Clapp 2006; Devlieger 2008). Increasing insulin resistance in pregnancy, especially during the third trimester, helps to meet the increased nutrient requirement for fetal development and promotes fetal growth by increasing maternal glucose supply (Devlieger 2008). GDM results when the insulin secretion is inadequate for the degree of insulin resistance (Clapp 2006).
Risk factors for GDM
A range of factors have been found to increase the risk of GDM (Morisset 2010). Advancing maternal age and maternal overweight (body mass index (BMI) equal to or greater than 25 kg/m²) or obesity (equal to or greater than 30 kg/m²) are the two most common risk factors (Morisset 2010).
High parity, non‐white race/ethnicity, family history of diabetes, maternal high or low birthweight and polycystic ovarian syndrome are the known non‐modifiable risk factors for GDM (Cypryk 2008; Petry 2010; Solomon 1997). Additional non‐modifiable risk factors include history of having a macrosomic (birthweight 4000 g or more) baby and history of GDM (Petry 2010). Risk factors considered modifiable include those that are lifestyle‐related, such as physical inactivity (Chasan‐Taber 2008), having a low‐fibre and high‐glycaemic load (GL) diet (Zhang 2006), and excessive weight gain during pregnancy, especially for those who are overweight or obese (Hedderson 2010).
Health risks for GDM
Negative impacts of GDM on the health of women and their babies have been consistently reported (Crowther 2005; Landon 2009; Metzger 2008; Reece 2009).
Short‐term risks for women with GDM include developing pre‐eclampsia and an increased need for induction of labour (Anderberg 2010; Crowther 2005; Dodd 2007; Ju 2008; Landon 2009; Metzger 2008) and caesarean section (Dodd 2007; Landon 2009; Metzger 2008). The incidence of cephalopelvic disproportion, uterine rupture, shoulder dystocia and perineal lacerations is increased in women with GDM due to the higher likelihood of having a large‐for‐gestational age or macrosomic baby (Jastrow 2010). In the longer‐term, women who have a history of GDM have been estimated to have at least a seven‐fold risk of developing type 2 diabetes in the future when compared with women who have had a normoglycaemic pregnancy (Bellamy 2009), and up to 50% of women with GDM may develop type 2 diabetes within 10 years of the index pregnancy (Kim 2002).
One of the most significant health risks for babies born to mothers with GDM is being large‐for‐gestational age or macrosomic (Crowther 2005; Landon 2009; Metzger 2008; Reece 2009). Being a large‐for‐gestational age fetus or macrosomic infant is a surrogate for many of the complications associated with GDM (Esakoff 2009). Large‐for‐gestational age or macrosomic infants are at increased risk of birth injury, such as shoulder dystocia, perinatal asphyxia, bone fractures and nerve palsies (Henriksen 2008; Langer 2005; Metzger 2008). Babies large‐for‐gestational age at birth are more likely to be heavier at every age (adjusted for height) and to develop early overweight or obesity and type 2 diabetes (Pettitt 1993; Whincup 2008). In addition, babies born large‐for‐gestational age are at increased risk of developing metabolic syndrome (a cluster of risk factors defined by the occurrence of three of the following: obesity, hypertension, hypertriglyceridaemia and low high‐density lipoproteins cholesterol concentration) in childhood, adolescence or adulthood (Baker 1994; Guerrero‐Romero 2010; Harder 2009). Development of the metabolic syndrome during childhood predicts adult type 2 diabetes at 25 to 30 years of age (Morrison 2008). These health problems repeat across generations (Mulla 2010; Petitt 1985).
Besides the risks relating to large‐for‐gestational age or macrosomia, other adverse health consequences for babies born to women with GDM may include respiratory distress syndrome, hypoglycaemia, hyperbilirubinaemia (increased concentrations of bilirubin in the blood), cardiomyopathy (the deterioration of the function of the heart muscle layer), hypocalcaemia, hypomagnesaemia, polycythaemia (increase in the number of circulating red blood cells), and admission to the neonatal nursery (Metzger 2008; Reece 2009; Soler 1978). Other longer‐term risks for these babies include developing type 1 diabetes mellitus (Harder 2009) and having impaired neurosensory development (Rizzo 1997).
Management of GDM
The primary aims of management for GDM are to optimise glycaemic control and improve pregnancy outcomes (Alwan 2009; Balsells 2015; Brown 2016; Falavigna 2012; Horvath 2010; Kim 2010a). Providing dietary and lifestyle advice is usually recommended as the primary therapeutic strategy for women with GDM (ACOG 2013; Hoffman 1998; Ministry of Health 2014; NICE 2015). If diet and lifestyle management alone are not sufficient to achieve good maternal glycaemic control, insulin therapy or oral hypoglycaemics such as glyburide and metformin may be indicated (ACOG 2013; Hoffman 1998; Ministry of Health 2014; NICE 2015; Silva 2010; Simmons 2004). As a part of GDM management, maternal glucose monitoring and ultrasonography are advised to monitor treatment and guide care for birth (ACOG 2013; Hoffman 1998; Ministry of Health 2014; NICE 2015).
Description of the intervention
Dietary advice for managing GDM
Although it is widely accepted that dietary and lifestyle advice is the primary strategy for managing GDM, there is very little evidence on specific nutritional approaches such as total energy intake and nutrient distribution in GDM management (Cheung 2009; Kim 2010a; Metzger 2007). Elevated blood glucose concentrations, especially postprandial glucose elevations are associated with adverse pregnancy outcomes in GDM (De Veciana 1995). Dietary advice provided for women with GDM should ensure adequate nutrients for normal fetal growth and maternal health, but not induce weight loss or excessive weight gain during pregnancy; it should also aim to assist optimal glycaemic control (ACOG 2013; Hoffman 1998; Metzger 2007; Ministry of Health 2014; NICE 2015).
How the intervention might work
Total energy intake and weight gain during pregnancy
Given the high prevalence of overweight and obesity in women with GDM, dietary advice for appropriate pregnancy weight gain is often included as a part of nutritional management of GDM (Kim 2010a). It is estimated that the prevalence of GDM for women with a BMI within the range of 35 kg/m² to 64.9 kg/m² (extremely obese) is 15.4%, and decreases to 5.5%, 4.8% and 2.3% for women having a BMI within the ranges of 30 kg/m² to 34.9 kg/m² (obese), 25 kg/m² to 29.9 kg/m² (overweight) and 18.5 kg/m² to 24.9 kg/m² (normal weight), respectively (Kim 2010b). Small reductions in weight improve glycaemic control (ACOG 2005). However, severe calorie restriction and pregnancy weight loss are discouraged due to the risks of ketonaemia and small‐for‐gestational‐age infants (ACOG 2013; Hoffman 1998; Ministry of Health 2014; NICE 2015).
In 2009, the Institute of Medicine released new guidelines for weight gain during pregnancy, which are stratified by pre‐pregnancy BMI, i.e. women with a pre‐pregnancy BMI between 25 kg/m² and 29.9 kg/m² should aim for 6.8 kg to 11.4 kg weight gain and those with pre‐pregnancy BMI of 30 kg/m² or more should aim for 5 kg to 9 kg weight gain (IOM 2009). However, the degree of energy restriction for pre‐pregnancy overweight and obese women to achieve these weight gain goals is unknown (Kim 2010a).
The optional proportion of the total energy derived from each of the macronutrients in GDM management is still controversial (Kim 2010a). In Australia, the principles of dietary management of diabetes are also recommended for GDM management (i.e. carbohydrate contributes up to 50% total energy intake, fat accounts for less than 30% total energy and protein accounts for 10% to 20% total energy intake) (Colagiuri 2009; Hoffman 1998).
Carbohydrate and glycaemic index (GI)
Carbohydrate is an important source of energy, vitamins, minerals and fibre and is the main nutrient that affects blood glucose concentrations (Reader 2007); blood glucose can be affected by the total amount and type of carbohydrate (Reader 2007).
Evidence on the proportion of carbohydrate in diet therapy for GDM management is also controversial (Kim 2010a). Both low‐carbohydrate diets (i.e. carbohydrate accounting for less than 42% total energy intake) and high‐carbohydrate diets (i.e. carbohydrate accounting for 55% total energy intake) have been found beneficial in improving pregnancy outcomes in non‐randomised studies (Clapp 2002; Major 1998; Romon 2001). These inconsistent findings triggered the hypothesis that in addition to the total amount of carbohydrate, the type of carbohydrate may also be an important factor affecting postprandial blood glucose (Kim 2010a). Glycaemic index (GI) is a ranking of the effects of carbohydrates on blood glucose concentrations (Jenkins 1981). Foods with a low GI (less than 55) produce a lower postprandial glucose elevation and area under the curve; foods with a high GI (more than 70) produce a rapid increase in postprandial blood glucose concentrations (Jenkins 1981). In non‐pregnant individuals with diabetes, low‐GI diets help lower HbA1c and give better glycaemic control (Thomas 2010). During pregnancy, the concept of GI is still valid (Cheung 2009).
Fat and other nutrients
Polyunsaturated fatty acids may be protective against impaired glucose tolerance, while saturated fatty acids may increase glucose and insulin concentrations in women with GDM (Ilic 1999). However, the specific amount and sources of fat that are beneficial for GDM management are not clear (Kim 2010a). Therefore, recommendations on fat intake for women with GDM have not yet been promulgated (ACOG 2013; Hoffman 1998; Metzger 2007; NICE 2015).
Recommendations on the intake of other nutrients for women with GDM are usually based on the general recommendations for diabetes mellitus (Cheung 2009).
Why it is important to do this review
GDM affects a significant proportion of pregnant women each year and the incidence and prevalence are increasing worldwide (Bottalico 2007; Dabelea 2005; Mulla 2010). GDM is associated with a range of adverse outcomes for women and their babies and these adverse outcomes can repeat across generations (Metzger 2008; Mulla 2010). Dietary advice or counselling is the primary therapeutic strategy in GDM management (Hoffman 1998; Metzger 2007; NICE 2015). However, there is much inconsistency and uncertainty around the best dietary advice for women with GDM (Dornhorst 2002; Kim 2010a).
This review will provide reliable evidence on the effects of different types of dietary advice interventions for women with GDM. One Cochrane review has assessed the effects of dietary advice in pregnancy for preventing GDM (Tieu 2008). Another Cochrane review has assessed the effects of different treatments for women with GDM (Alwan 2009); however these reviews did not assess comparisons of different types of dietary advice. A new Cochrane review will assess lifestyle interventions for the treatment of women with GDM; specifically those including a combination of at least two of more of the following interventions: diet; physical activity; education; behavioural change; regimens of self‐monitoring of blood glucose; other (Brown 2015).
Objectives
To assess the effects of different types of dietary advice for women with gestational diabetes mellitus (GDM) for improving health outcomes for women and babies.
Methods
Criteria for considering studies for this review
Types of studies
All published randomised controlled trials and cluster‐randomised trials comparing the effects of different types of dietary advice for GDM management. We intended to include published abstracts if relevant outcome data were available. We planned to exclude quasi‐randomised trials and cross‐over trials.
Types of participants
Pregnant women with GDM. Diagnostic criteria for GDM based on oral glucose tolerance test (OGTT) results were defined variously by individual trials according to the policies of local health authorities and professional organisations. Women were eligible regardless of age, gestation, parity or plurality.
We planned to include trials recruiting pregnant women with normal glycaemia, GDM or pre‐existing diabetes mellitus if subgroup data for women with GDM could be extracted separately.
Types of interventions
We planned to include interventions assessing any type of dietary advice for women with GDM in the review.
We planned to include trials comparing two or more different types of dietary advice interventions. We intended to compare two or more forms of the same type of dietary advice, i.e. standard dietary advice compared with individualised dietary advice, individual dietary education sessions compared with group dietary education sessions. We intended to compare different intensities of dietary intervention, i.e. single dietary counselling session compared with multiple dietary counselling sessions.
Types of outcome measures
For this update, we used the standard outcome set agreed by consensus between review authors of Cochrane Pregnancy and Childbirth systematic reviews for prevention and treatment of GDM and pre‐existing diabetes.
Primary outcomes
Fetal/neonatal/childhood outcomes
Large‐for‐gestational age (birthweight greater than or equal to the 90th percentile for gestational age).
Perinatal mortality (stillbirth and neonatal mortality).
Neonatal mortality or morbidity composite.
Neurosensory disability.
Maternal outcomes
Hypertensive disorders of pregnancy (including pre‐eclampsia, pregnancy‐induced hypertension, eclampsia).
Caesarean section.
Type 2 diabetes mellitus.
Secondary outcomes
Fetal/neonatal outcomes
Stillbirth.
Neonatal mortality.
Gestational age at birth.
Preterm birth (less than 37 weeks' gestation and less than 32 weeks' gestation).
Apgar score less than seven at five minutes.
Macrosomia (birthweight greater than 4000 g as defined by authors).
Small‐for‐gestational age.
Birthweight and z‐score.
Head circumference at birth and z‐score.
Length at birth and z‐score.
Ponderal index at birth.
Adiposity at birth (e.g. as measured by BMI, skinfold thickness).
Shoulder dystocia.
Bone fracture.
Nerve palsy.
Respiratory distress syndrome.
Hypoglycaemia.
Hyperbilirubinaemia.
Hypocalcaemia.
Polycythaemia.
Childhood outcomes
Weight and z‐scores.
Height and z‐scores.
Head circumference and z‐scores.
Adiposity (e.g. as measured by BMI, skinfold thickness).
Blood pressure.
Type 1 diabetes mellitus.
Type 2 diabetes mellitus.
Impaired glucose tolerance (as defined by authors).
Insulin sensitivity (as defined by authors).
Dyslipidaemia or metabolic syndrome.
Educational achievement.
Adulthood outcomes
Weight.
Height.
Adiposity (e.g. as measured by BMI, skinfold thickness).
Cardiovascular health (as defined by authors, including blood pressure, hypertension, cardiovascular disease, metabolic syndrome).
Type 1 diabetes mellitus.
Type 2 diabetes mellitus.
Impaired glucose tolerance (as defined by authors).
Insulin sensitivity (as defined by authors).
Employment, education and social status/achievement.
Maternal outcomes
Perinatal
Mode of birth (normal vaginal birth; operative vaginal birth).
Induction of labour.
Perineal trauma.
Placental abruption.
Postpartum haemorrhage.
Postpartum infection.
Gestational weight gain.
Adherence to dietary intervention.
Behaviour changes associated with dietary intervention.
Insulin sensitivity (as defined by authors).
Sense of well‐being and quality of life.
Views of the intervention.
Breastfeeding (e.g. at discharge, six weeks postpartum).
Use of additional pharmacotherapy.
Glycaemic control during or at the end of treatment.
Hypoglycaemia.
Mortality.
Long term
Postnatal depression.
Postnatal weight retention or return to pre‐pregnancy weight.
BMI.
GDM in a subsequent pregnancy.
Type 2 diabetes mellitus.
Impaired glucose tolerance (as defined by authors).
Insulin sensitivity (as defined by authors).
Cardiovascular health (as defined by authors, including blood pressure, hypertension, cardiovascular disease, metabolic syndrome).
Health services outcomes
Number of hospital or health professional visits (e.g. midwife, obstetrician, physician, dietitian, diabetic nurse).
Number of antenatal visits or admissions.
Length of antenatal stay.
Neonatal intensive care unit admission.
Length of postnatal stay (mother).
Length of postnatal stay (baby).
Costs to families associated with the management provided.
Costs associated with the dietary intervention.
Cost of maternal care.
Cost of offspring care.
Search methods for identification of studies
The following methods section of this review is based on a standard template used by Cochrane Pregnancy and Childbirth.
Electronic searches
We searched Cochrane Pregnancy and Childbirth’s Trials Register by contacting their Information Specialist (8 March 2016).
The Register is a database containing over 22,000 reports of controlled trials in the field of pregnancy and childbirth. For full search methods used to populate Pregnancy and Childbirth’s Trials Register including the detailed search strategies for CENTRAL, MEDLINE, Embase and CINAHL; the list of handsearched journals and conference proceedings, and the list of journals reviewed via the current awareness service, please follow this link to the editorial information about the Cochrane Pregnancy and Childbirth in the Cochrane Library and select the ‘Specialized Register ’ section from the options on the left side of the screen.
Briefly, Cochrane Pregnancy and Childbirth’s Trials Register is maintained by their Information Specialist and contains trials identified from:
monthly searches of the Cochrane Central Register of Controlled Trials (CENTRAL);
weekly searches of MEDLINE (Ovid);
weekly searches of Embase (Ovid);
monthly searches of CINAHL (EBSCO);
handsearches of 30 journals and the proceedings of major conferences;
weekly current awareness alerts for a further 44 journals plus monthly BioMed Central email alerts.
Search results are screened by two people and the full text of all relevant trial reports identified through the searching activities described above is reviewed. Based on the intervention described, each trial report is assigned a number that corresponds to a specific Pregnancy and Childbirth review topic (or topics), and is then added to the Register. The Information Specialist searches the Register for each review using this topic number rather than keywords. This results in a more specific search set which has been fully accounted for in the relevant review sections (Included studies; Excluded studies).
In addition, we searched the Perinatal Society of Australia and New Zealand (PSANZ) Trial Registry (22 March 2016) using the search terms detailed in Appendix 1.
Searching other resources
We searched reference lists of trials and other review articles.
We did not apply any language or date restrictions.
Data collection and analysis
For methods used in the previous version of this review, seeHan 2013.
For this update, the following methods were used for assessing the 34 reports that were identified as a result of the updated search.
Selection of studies
Two review authors independently assessed for inclusion all the potential studies identified as a result of the search strategy. We resolved any disagreement through discussion or, if required, we consulted a third review author.
We created a Study flow diagram to map out the number of records identified, included and excluded (see Figure 1).
1.
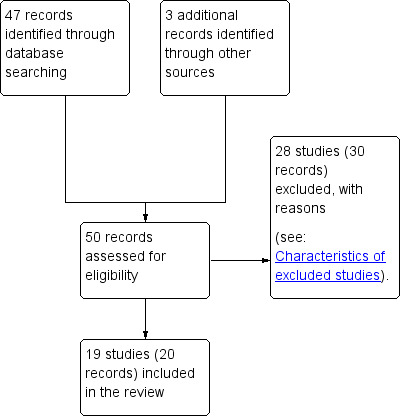
Study flow diagram.
Data extraction and management
We designed a form to extract data. For eligible studies, two review authors extracted the data using the agreed form. We resolved discrepancies through discussion or, if required, we consulted a third review author. Data were entered into Review Manager software (RevMan 2014) and checked for accuracy.
When information regarding any of the above was unclear, we attempted to contact authors of the original reports to provide further details. We contacted the authors of Grant 2011, Lauszus 2001, Louie 2011; Moses 2009, and Rae 2000 for further information.
Assessment of risk of bias in included studies
Two review authors independently assessed risk of bias for each study using the criteria outlined in the Cochrane Handbook for Systematic Reviews of Interventions (Higgins 2011). Any disagreement was resolved by discussion or by involving a third assessor.
(1) Random sequence generation (checking for possible selection bias)
We described for each included study the method used to generate the allocation sequence in sufficient detail to allow an assessment of whether it should produce comparable groups.
We assessed the method as:
low risk of bias (any truly random process, e.g. random number table; computer random number generator);
high risk of bias (any non‐random process, e.g. odd or even date of birth; hospital or clinic record number);
unclear risk of bias.
(2) Allocation concealment (checking for possible selection bias)
We described for each included study the method used to conceal allocation to interventions prior to assignment and assessed whether intervention allocation could have been foreseen in advance of, or during recruitment, or changed after assignment.
We assessed the methods as:
low risk of bias (e.g. telephone or central randomisation; consecutively numbered sealed opaque envelopes);
high risk of bias (open random allocation; unsealed or non‐opaque envelopes, alternation; date of birth);
unclear risk of bias.
(3.1) Blinding of participants and personnel (checking for possible performance bias)
We described for each included study the methods used, if any, to blind study participants and personnel from knowledge of which intervention a participant received. We considered that studies were at low risk of bias if they were blinded, or if we judged that the lack of blinding unlikely to affect results. We assessed blinding separately for different outcomes or classes of outcomes.
We assessed the methods as:
low, high or unclear risk of bias for participants;
low, high or unclear risk of bias for personnel.
(3.2) Blinding of outcome assessment (checking for possible detection bias)
We described for each included study the methods used, if any, to blind outcome assessors from knowledge of which intervention a participant received. We assessed blinding separately for different outcomes or classes of outcomes.
We assessed methods used to blind outcome assessment as:
low, high or unclear risk of bias.
(4) Incomplete outcome data (checking for possible attrition bias due to the amount, nature and handling of incomplete outcome data)
We described for each included study, and for each outcome or class of outcomes, the completeness of data including attrition and exclusions from the analysis. We stated whether attrition and exclusions were reported and the numbers included in the analysis at each stage (compared with the total randomised participants), reasons for attrition or exclusion where reported, and whether missing data were balanced across groups or were related to outcomes. Where sufficient information was reported, or could be supplied by the trial authors, we planned to re‐include missing data in the analyses which we undertook.
We assessed methods as:
low risk of bias (e.g. no missing outcome data; missing outcome data balanced across groups);
high risk of bias (e.g. numbers or reasons for missing data imbalanced across groups; 'as treated' analysis done with substantial departure of intervention received from that assigned at randomisation);
unclear risk of bias.
(5) Selective reporting (checking for reporting bias)
We described for each included study how we investigated the possibility of selective outcome reporting bias and what we found.
We assessed the methods as:
low risk of bias (where it is clear that all of the study's pre‐specified outcomes and all expected outcomes of interest to the review have been reported);
high risk of bias (where not all the study's pre‐specified outcomes have been reported; one or more reported primary outcomes were not pre‐specified; outcomes of interest are reported incompletely and so cannot be used; study fails to include results of a key outcome that would have been expected to have been reported);
unclear risk of bias.
(6) Other bias (checking for bias due to problems not covered by (1) to (5) above)
We described for each included study any important concerns we had about other possible sources of bias.
(7) Overall risk of bias
We made explicit judgements about whether studies were at high risk of bias, according to the criteria given in the Handbook (Higgins 2011). With reference to (1) to (6) above, we planned to assess the likely magnitude and direction of the bias and whether we considered it is likely to impact on the findings. In future updates, we will explore the impact of the level of bias through undertaking sensitivity analyses ‐ seeSensitivity analysis.
Assessing the quality of the evidence using the GRADE approach
For this update the GRADE approach as outlined in the GRADE Handbook was used, where possible, to assess the quality of the body of evidence relating to the following outcomes for the following two comparisons, which were selected as the 'main' comparisons, based on containing the most information (included trials and participants), and thus, based on perceived importance (of trialists).
Low‐moderate GI diet versus moderate‐high GI diet.
Energy‐restricted diet versus no energy‐restricted diet.
Maternal outcomes
Perinatal
Hypertensive disorders of pregnancy (including pre‐eclampsia, pregnancy‐induced hypertension, eclampsia).
Caesarean section.
Induction of labour.
Perineal trauma.
Long term
Type 2 diabetes mellitus.
Postnatal depression.
Postnatal weight retention or return to pre‐pregnancy weight.
Fetal/neonatal/childhood/adulthood outcomes
Fetal/neonatal
Large‐for‐gestational age.
Perinatal mortality (stillbirth and neonatal mortality).
Neonatal mortality or morbidity composite.
Hypoglycaemia.
Childhood/adulthood
Neurosensory disability.
Adiposity (e.g. as measured by BMI, skinfold thickness).
Type 2 diabetes mellitus.
We used the GRADEpro Guideline Development Tool to import data from Review Manager (RevMan 2014) in order to create 'Summary of findings' tables. A summary of the intervention effect and a measure of quality for the above outcomes, where possible, was produced using the GRADE approach. The GRADE approach uses five considerations (study limitations, consistency of effect, imprecision, indirectness and publication bias) to assess the quality of the body of evidence for each outcome. The evidence can be downgraded from 'high quality' by one level for serious (or by two levels for very serious) limitations, depending on assessments for risk of bias, indirectness of evidence, serious inconsistency, imprecision of effect estimates or potential publication bias.
Measures of treatment effect
Dichotomous data
For dichotomous data, we have presented results as summary risk ratios with 95% confidence intervals.
Continuous data
For continuous data, we have presented results as summary mean differences with 95% confidence intervals. We planned to use standardised mean differences to combine trials that measured the same outcome, but used different methods.
Unit of analysis issues
Cluster‐randomised trials
We did not identify any cluster‐randomised trials for inclusion. If we identify cluster‐randomised trials in future updates of this review, we will include them in the analyses along with individually‐randomised trials. We will adjust their sample sizes using the methods described in the Handbook using an estimate of the intracluster correlation co‐efficient (ICC) derived from the trial (if possible), from a similar trial or from a study of a similar population. If we use ICCs from other sources, we will report this and conduct sensitivity analyses to investigate the effect of variation in the ICC. If we identify both cluster‐randomised trials and individually‐randomised trials, we plan to synthesise the relevant information. We will consider it reasonable to combine the results from both if there is little heterogeneity between the study designs and the interaction between the effect of intervention and the choice of randomisation unit is considered to be unlikely.
We will also acknowledge heterogeneity in the randomisation unit and perform a sensitivity analysis to investigate the effects of the randomisation unit.
Cross‐over trials
We considered cross‐over trials as inappropriate for this research question.
Dealing with missing data
For included studies, we noted levels of attrition. In future updates, if more eligible trials are included, the impact of including trials with high levels of missing data in the overall assessment of treatment effect will be explored by using sensitivity analysis.
For all outcomes, analyses were carried out, as far as possible, on an intention‐to‐treat basis i.e. we attempted to include all participants randomised to each group in the analyses. The denominator for each outcome in each trial was the number randomised minus any participants whose outcomes were known to be missing.
Assessment of heterogeneity
We assessed statistical heterogeneity in each meta‐analysis using the Tau², I² and Chi² statistics. We regarded heterogeneity as substantial if an I² was greater than 30% and either a Tau² was greater than zero, or there was a low P value (less than 0.10) in the Chi² test for heterogeneity. Had we identified substantial heterogeneity (above 30%), we planned to explore it using pre‐specified subgroup analysis.
Assessment of reporting biases
In future updates, if there are 10 or more studies in a meta‐analysis, we will investigate reporting biases (such as publication bias) using funnel plots. We will assess funnel plot asymmetry visually. If asymmetry is suggested by a visual assessment, we will perform exploratory analyses to investigate it.
Data synthesis
We carried out statistical analysis using Review Manager software (RevMan 2014). We used fixed‐effect meta‐analysis for combining data where it was reasonable to assume that studies were estimating the same underlying treatment effect: i.e. where trials were examining the same intervention, and the trials' populations and methods were judged sufficiently similar.
Where there was clinical heterogeneity sufficient to expect that the underlying treatment effects differed between trials, or where substantial statistical heterogeneity was detected, we used random‐effects meta‐analysis to produce an overall summary, if an average treatment effect across trials was considered clinically meaningful. The random‐effects summary has been treated as the average range of possible treatment effects and we have discussed the clinical implications of treatment effects differing between trials. If the average treatment effect was not considered clinically meaningful, we did not combine trials. Where we have used random‐effects analyses, the results have been presented as the average treatment effect with 95% confidence intervals, and the estimates of Tau² and I².
Subgroup analysis and investigation of heterogeneity
Where identified, we planned to investigate substantial heterogeneity using subgroup analyses.
Maternal characteristics, ways of delivering dietary advice and intensities of the dietary advice interventions may impact health outcomes. We planned to carry out the following subgroup analyses, however, there were insufficient data to do so.
Maternal characteristics
Maternal age: older than or equal to 35 years of age versus younger than 35 years of age.
Ethnicity: high‐risk versus low‐risk ethnicities.
Parity: 0 versus 1 to 2; versus 3 or more.
Maternal education level: less than 12 years versus 12 years of more.
Maternal BMI at or before trial entry: less than 18.5 kg/m² versus 18.5 kg/m² to 24.9 kg/m² versus 25 kg/m² to 29.9 kg/m² versus 30 kg/m² to 39.9 kg/m² versus 40 kg/m² or more.
Ways of delivering dietary advice
Standard dietary advice versus individualised dietary advice.
Individual dietary counselling versus group dietary education.
Face‐to‐face dietary advice versus non‐face‐to‐face dietary advice (e.g. phone counselling, information package, etc.).
Intensities of dietary intervention
Single dietary counselling session versus multiple dietary counselling sessions.
We planned to use primary outcomes in subgroup analyses.
We planned to assess subgroup differences by interaction tests available within RevMan (RevMan 2014). We planned to report the results of subgroup analyses quoting the Chi² statistic and P value, and the interaction test I² value.
Sensitivity analysis
We planned to carry out sensitivity analyses to explore the effect of trial quality assessed by concealment of allocation, high attrition rates, or both, with poor quality trials (rated high or unclear risk of bias for these domains) being excluded from the analyses in order to assess whether this makes any difference to the overall result. However, there were insufficient data to do so. If we had included cluster‐randomised trials, we also planned to carry out sensitivity analyses to investigate the effects of the randomisation unit, however we did not include any cluster‐randomised trials.
Results
Description of studies
Results of the search
We identified a total of 47 potentially eligible studies (50 records) (see Figure 1).
Following the application of eligibility criteria, we included 19 randomised controlled trials (20 records) (Asemi 2013a; Asemi 2013b; Asemi 2014; Balas‐Nakash 2010; Bo 2014; Cypryk 2007; Garner 1997; Grant 2011; Jamilian 2015; Lauszus 2001; Louie 2011; Ma 2015; Magee 1990; Moreno‐Castilla 2013; Moses 2009; Rae 2000; Reece 1995; Valentini 2012; Wang 2015) and excluded 28 studies (30 records) (Cao 2012; Chua 2008; Corrado 2011; Deveer 2013; Ehrlich 2014; Gillen 2004; Gillmer 1986; Gonai 2014; Hernandez 2012; Hernandez 2014; Hernandez 2016; Hosseinzadeh‐Shamsi‐Anar 2012; Hu 2014; Ilic 1999; Jamilian 2016; Knopp 1991; Li 2013; Lindsay 2014; Lindsay 2015; Louie 2013; Ma 2011; Nolan 1984; Perichart‐Perara 2012; Reader 2006; Samimi 2015; Thangaratinam 2014; Yu 2013; Yuan 2015).
Included studies
Setting
Of the 19 included trials, four trials were conducted in Iran (Asemi 2013a; Asemi 2013b; Asemi 2014; Jamilian 2015); three were from Australia (Louie 2011; Moses 2009; Rae 2000); two trials each were conducted in the USA (Magee 1990; Reece 1995), Canada (Garner 1997; Grant 2011), Italy (Bo 2014; Valentini 2012) and China (Ma 2015; Wang 2015); one was from Denmark (Lauszus 2001), one from Mexico (Balas‐Nakash 2010), one from Poland (Cypryk 2007) and one from Spain (Moreno‐Castilla 2013).
Participants
A total of 1398 women and their babies were randomised to the 19 included trials, with sample sizes of the included trials ranging from 12 (Magee 1990) to 300 (Garner 1997).
For the detailed descriptions of inclusion and exclusion criteria across the included trials, see Characteristics of included studies.
Gestational diabetes mellitus (GDM) diagnosis
Different GDM diagnostic criteria were used across the 19 included trials. The American Diabetes Association (ADA) criteria were used in five trials (Asemi 2013a; Asemi 2013b; Asemi 2014; Jamilian 2015; Valentini 2012). The Australian Diabetes in Pregnancy Society (ADIPS) criteria were used in two trials (Louie 2011; Moses 2009). One trial each used the World Health Organization (WHO) criteria (Cypryk 2007), Hatem Criteria (Garner 1997), Canadian Diabetes Association (CDA) criteria (Grant 2011), Carpenter and Coustan's criteria (Magee 1990) and the National Diabetes Data Group criteria (Moreno‐Castilla 2013). The International Association of Diabetes and Pregnancy Study Group (IADPSG) criteria were used in Wang 2015.
Lauszus 2001 used a three‐hour 75 g oral glucose tolerance test (OGTT) for GDM diagnosis, and GDM was defined as two or more plasma glucose concentrations above three standard deviations of the mean. Rae 2000 used criteria as fasting blood glucose > 5.4 mmol/L and/or two‐hour blood glucose > 7.9 mmol/L following a 75 g OGTT. Ma 2015 used a three‐hour 75 g OGTT for GDM diagnosis, with women diagnosed if their blood glucose met two or more of the following criteria: fasting > 5.8mmol/L, one‐hour > 10.6 mmol/L, two‐hour > 9.2 mmol/L and three‐hour > 8.1 mmol/L.
There was no information on diagnostic criteria for GDM in Balas‐Nakash 2010, Bo 2014, or Reece 1995.
Two trials reported the incidence of type 2 diabetes and impaired glucose tolerance in the early postpartum period (Lauszus 2001; Louie 2011). The diagnostic criteria for type 2 diabetes or impaired glucose tolerance based on OGTT were not specified in Lauszus 2001 and the WHO criteria were used in Louie 2011.
While 16 trials included only women with GDM, women with both GDM and type 2 diabetes were included in Balas‐Nakash 2010; women with GDM and insulin‐dependent diabetes were included in Reece 1995 and women with GDM and impaired glucose tolerance not meeting GDM diagnostic criteria were included in Grant 2011.
Maternal body mass index (BMI)
Women's BMI at trial entry varied greatly across the 19 included trials. Only three trials had specific eligibility criteria related to BMI (Bo 2014; Magee 1990; Rae 2000). Bo 2014 excluded women with a BMI > 40 kg/m²; Rae 2000 included women whose weights were greater than 110% of their ideal weight (100% ideal body weight was defined as BMI of 25 kg/m²); and Magee 1990 included only women who were obese; with obesity as greater than 120% of ideal body weight.
There were no eligibility criteria based on BMI in the remaining 16 trials (Asemi 2013a; Asemi 2013b; Asemi 2014; Balas‐Nakash 2010; Cypryk 2007; Garner 1997; Grant 2011; Jamilian 2015; Lauszus 2001; Louie 2011; Ma 2015; Moreno‐Castilla 2013; Moses 2009; Reece 1995; Valentini 2012; Wang 2015), though in 11 trials, some information was reported regarding women's pre‐pregnancy or baseline BMI (mean (SD)).
In Ma 2015, the mean pre‐pregnancy BMI was 21.9 (3.1) kg/m² for women in the low‐moderate GI diet group, and 21.2 (2.8) kg/m² for the women in the moderate‐high GI diet group. In Wang 2015, the mean pre‐pregnancy mean BMI was 21.4 (3.0) kg/m² for the women in the high unsaturated fat diet group and 22.2 (3.6) kg/m² for the women in the low unsaturated fat diet group. In Louie 2011, 68% of women had a pre‐pregnancy BMI of less than 25 kg/m²; the pre‐pregnancy mean BMI was 23.9 (4.4) kg/m² for women in the low‐GI diet group and 24.1 (5.7) kg/m² for women in the high‐fibre moderate‐GI diet group. In Valentini 2012, women's mean pre‐pregnancy BMI were 25.7 (3.6) kg/m² for the ethnic‐specific diet group and 24.1 (4.7) kg/m² for the standard healthy diet group. In Moreno‐Castilla 2013, women's pre‐pregnancy mean BMI were 25.4 (5.7) kg/m² for the low‐carbohydrate diet group and 26.6 (5.5) kg/m² for the high‐carbohydrate diet group. In Jamilian 2015, women's mean baseline BMI in the soy protein‐enriched diet group was 28.9 (5.0) kg/m², and 28.4 (3.4) kg/m² in the no soy protein diet group. In Asemi 2013a, Asemi 2013b and Asemi 2014, women's mean trial entry BMI ranged from 29.0 (3.2) kg/m² to 30.2 (4.6) kg/m² for the Dietary Approaches to Stop Hypertension (DASH) diet group and 29.7 (3.3) kg/m² to 31.4 (5.7) kg/m² for the control diet group. In Moses 2009, the mean trial entry BMI was 32.0 (1.2) kg/m² for the women in the low‐moderate GI diet group and 32.8 (1.4) kg/m² for the women in the moderate‐high GI diet group. In Lauszus 2001, women were recruited after their diagnosis of GDM and were then instructed to follow a high‐carbohydrate diet until 33 weeks' gestation where they were randomised. No information was reported on women's weight or BMI at recruitment, but baseline weight was reported for women at randomisation; the mean BMI at 33 weeks' gestation were 35 (2.4) kg/m² and 32.2 (1.5) kg/m² for women in the high unsaturated fat and the low unsaturated diet groups, respectively (Lauszus 2001).
No information was reported regarding BMI at trial entry in Cypryk 2007 and Garner 1997; and for Bo 2014 it was not reported for the two randomised groups at entry; a further three trials did not report BMI at trial entry for the relevant subgroup of women with GDM (Balas‐Nakash 2010; Grant 2011; Reece 1995).
Interventions and comparisons
We have structured the comparisons, ordered by quantity of information available (number of included trials, and participants in the comparisons) as:
low‐moderate GI diet versus moderate‐high GI diet: Balas‐Nakash 2010; Grant 2011; Ma 2015; Moses 2009;
energy‐restricted diet versus no energy‐restricted diet: Garner 1997; Magee 1990; Rae 2000;
DASH diet versus control diet with matching macronutrient contents: Asemi 2013a; Asemi 2013b; Asemi 2014;
low‐carbohydrate diet versus high‐carbohydrate diet: Cypryk 2007; Moreno‐Castilla 2013;
high unsaturated fat diet versus low unsaturated diet with matching calories: Lauszus 2001; Wang 2015;
low‐GI diet versus high‐fibre moderate‐GI diet: Louie 2011;
diet recommendation and diet‐related behavioural advice versus diet recommendation only: Bo 2014;
soy protein‐enriched diet versus no soy protein diet: Jamilian 2015;
high‐fibre versus standard‐fibre diet: Reece 1995;
ethnic‐specific diet versus standard healthy diet: Valentini 2012.
Five trials assessed the effects of a low‐ (or low‐moderate) GI diet (Balas‐Nakash 2010; Grant 2011; Louie 2011; Ma 2015; Moses 2009). In Balas‐Nakash 2010, women in the low‐GI diet group were advised to select low‐to‐moderate GI carbohydrate food, while women in the control group were allowed any type of carbohydrate food. There was no information reported on the definitions for low‐GI carbohydrate, moderate‐GI carbohydrate or high‐GI carbohydrate in this trial (Balas‐Nakash 2010). Grant 2011 advised women in the low‐GI diet group to select their starch food from an exchange list of low‐ and intermediate‐GI choices, while women in the comparison group were asked to select their starch choices from an exchange list of intermediate‐ and high‐GI food (Grant 2011). Food exchange lists for study diets were provided in the published report for Grant 2011, which indicated that the carbohydrate food recommended for women in low‐GI diet group having a GI range of 26 to 66 and for women in the control group having a GI range of 58 to 87. In Ma 2015, women in the low‐GL group were given an exchange list of low‐GL foods and women in the control group were given an exchange list of intermediate‐ to high‐GL foods. In Moses 2009, women in the low‐GI diet group were advised to select low‐GI food (55 or less) based on the international tables of GI and GL values (Atkinson 2008) and women in the comparison group were advised to follow a high‐fibre, low‐sugar diet. In Louie 2011, a low‐GI diet aiming for a GI target of no higher than 50, was compared with a moderate‐GI diet (GI around 60); thus this trial was included in a separate comparison from the aforementioned four trials.
Three trials compared an energy‐restricted diet with a no energy‐restriction diet (Garner 1997; Magee 1990; Rae 2000). In Garner 1997, a calorie‐restricted diet of 35 kcal per kg ideal body weight per day was compared with an unrestricted healthy diet during pregnancy. Women in Magee 1990 were hospitalised during the intervention period. In the first week of hospitalisation, women in both groups had a 2400 kcal per day diet, with 50% total energy derived from carbohydrate, 30% from fat and 20% from protein (Magee 1990). During the second week of hospitalisation, one group of women continued the diet consumed in the first week, while women in the other group restricted their daily energy intake to 1200 kcal, which was achieved by reducing serving size without changing diet content (Magee 1990). In Rae 2000, a 6800 kJ to 7600 kJ per day diet was compared with a diet providing 8600 kJ to 9500 kJ.
Three trials assessed the effect of the DASH eating pattern (Asemi 2013a; Asemi 2013b; Asemi 2014). In Asemi 2013a,Asemi 2013b and Asemi 2014, diet for women in the DASH diet group and the control diet group had similar composition of 45% to 55% carbohydrates, 15% to 20% protein and 25% to 30% fat. However, diet for women in the DASH diet group was rich in fruits, vegetables, whole grains and low‐fat dairy products, and low in saturated fats, cholesterol, refined grains and sweets. The amount of sodium intake was 2400 mg per day or less (Asemi 2013a; Asemi 2013b; Asemi 2014).
Two trials assessed different carbohydrate content in the diet for women with GDM (Cypryk 2007; Moreno‐Castilla 2013). The daily total energy intake from carbohydrate was 40% to 45% for the low‐carbohydrate diet group and 55% to 60% for the control group (Cypryk 2007; Moreno‐Castilla 2013).
Two trials compared the effect of high unsaturated fat diet with low unsaturated diet with matching calories for managing GDM (Lauszus 2001; Wang 2015). Lauszus 2001 compared a high‐carbohydrate diet with a high‐monounsaturated fat diet, without specifying the proportion of daily energy sources for the diets. In Wang 2015, women in the high polyunsaturated fatty acid diet group were advised to use 45 to 50 g sunflower oil daily for cooking while women in the low polyunsaturated fatty acid diet group were instructed to use 20 g sunflower oil for daily cooking.
Bo 2014 assessed the effects of providing additional behavioural recommendations for assisting healthy dietary choices. Women in both groups received individually‐prescribed diets, with 48% to 50% from carbohydrates, 18% to 20% from protein, 30% to 35% from fat, fibre 20 to 25 g per day and no alcohol (Bo 2014). For women in the intervention group, additional oral or written recommendations including strategies for out of home eating, healthy cooking and food shopping were provided (Bo 2014).
In Jamilian 2015, women in the intervention group received a diet containing 0.8 g per kg protein with 35% animal protein, 35% soy protein and 30% other plant proteins, and women in the control group received the same amount of protein with 70% animal and 30% plant proteins.
In Reece 1995, a high‐fibre diet containing 80 g of fibre per day was compared with a standard American Diabetes Association (ADA) diet providing 20 g fibre per day.
In Valentini 2012, ethnic‐specific diet including typical foods from women's home countries were compared with standard healthy diet for women with GDM. Both diets had the same nutrient composition and daily energy intake was from 1800 to 2200 kcal, depending on women's pre‐pregnancy BMI.
Outcomes
Sixteen included studies reported perinatal outcomes for women and/or their babies and have not reported on any longer‐term outcomes (Asemi 2013a; Asemi 2013b; Asemi 2014; Balas‐Nakash 2010; Bo 2014; Cypryk 2007; Garner 1997; Grant 2011; Jamilian 2015; Ma 2015; Moreno‐Castilla 2013; Moses 2009; Rae 2000; Reece 1995; Valentini 2012; Wang 2015). Two trials have reported limited early postpartum outcomes including risk of maternal type 2 diabetes development (Lauszus 2001; Louie 2011). One trial has reported biochemical outcomes only (Magee 1990).
SeeCharacteristics of included studies for further details.
Excluded studies
A total of 28 trials were excluded.
Six trials were excluded as they were cross‐over trials (Hernandez 2012; Hernandez 2014; Hernandez 2016; Ilic 1999; Louie 2013; Nolan 1984), and one was excluded as it was not a randomised trial (Knopp 1991). Four trials were excluded as their populations did not meet our inclusion criteria: (Deveer 2013 included women with borderline GDM; Lindsay 2014: including obese pregnant women and excluded women with GDM; Ma 2011 included women with abnormal glucose metabolism; Thangaratinam 2014 included pregnant women with metabolic risk factors but not GDM. In Perichart‐Perara 2012, outcome data were reported for a mixed population of women with GDM and type 2 diabetes).
Fourteen trials were excluded as they did not assess different types of dietary advice interventions: five compared different types of care, or lifestyle interventions for women with GDM, where dietary advice was included as part of the care/intervention (Cao 2012; Ehrlich 2014; Gillen 2004; Gillmer 1986; Reader 2006); one assessed a five day diet intervention (Hu 2014); and 10 assessed effects of dietary supplements (including magnesium chloride, myoinositol, lactobacilli GG yogurt, vitamin D, omega‐3 fatty acids, probiotics, nutritional liquid supplement, capsaicin) for women with GDM (Chua 2008; Corrado 2011; Gonai 2014; Hosseinzadeh‐Shamsi‐Anar 2012; Jamilian 2016; Li 2013; Lindsay 2015; Samimi 2015; Yu 2013; Yuan 2015).
SeeCharacteristics of excluded studies for further details.
Risk of bias in included studies
The 19 included studies had various levels of risk of bias. SeeFigure 2 and Figure 3 for further details.
2.
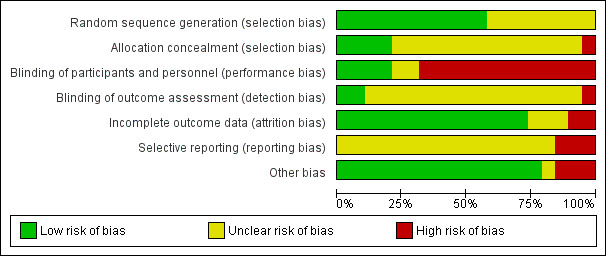
'Risk of bias' graph: review authors' judgements about each risk of bias item presented as percentages across all included studies.
3.
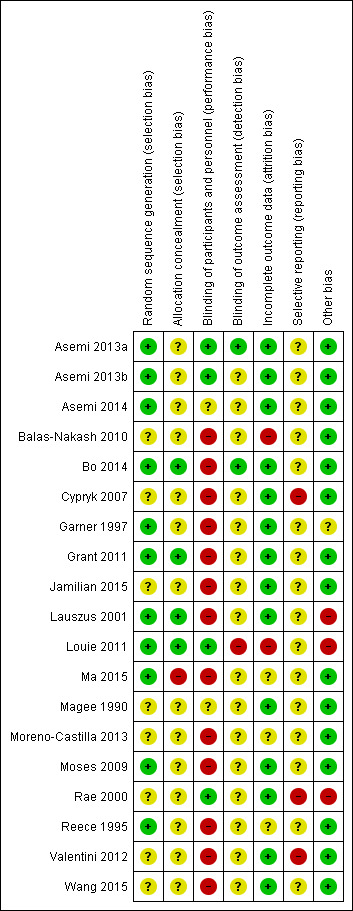
'Risk of bias' summary: review authors' judgements about each risk of bias item for each included study.
Allocation
Eleven of the 19 included trials reported adequate methods for generating their random sequence (Asemi 2013a; Asemi 2013b; Asemi 2014; Bo 2014; Garner 1997; Grant 2011; Lauszus 2001; Louie 2011; Ma 2015; Moses 2009; Reece 1995), and were thus judged to be at a low risk of selection bias. Methods reported included computer‐generated random numbers (Asemi 2013a; Asemi 2013b; Asemi 2014; Louie 2011), web‐based randomisation (Bo 2014) and random number tables (Garner 1997; Ma 2015; Reece 1995). In Moses 2009, restricted randomisation was used, where group allocation was done by using permuted blocks of unequal size with the list generated using STATA. Although Grant 2011 did not specify the method used for sequence generation, it was considered likely to have been a computer‐generated sequence. Lauszus 2001 used a block‐wise randomisation stratified for pre‐pregnancy weight. In the remaining eight trials (Balas‐Nakash 2010; Cypryk 2007; Jamilian 2015; Magee 1990; Moreno‐Castilla 2013; Rae 2000; Valentini 2012; Wang 2015), insufficient information was provided on random sequence generation, and thus these trials were judged to be at unclear risk of selection bias.
Four trials reported adequate allocation concealment methods, and were judged to be at low risk of selection bias (Bo 2014; Grant 2011; Lauszus 2001; Louie 2011). Methods used for achieving allocation concealment included use of a centralised randomisation service (Bo 2014; Louie 2011), use of consecutive, numbered, sealed, opaque envelopes (Grant 2011) and involvement of a third person from independent centre (Lauszus 2001). Ma 2015 reported allocation concealment was not used, and was thus judged to be at high risk of selection bias. The remainder of the included trials (Asemi 2013a; Asemi 2013b; Asemi 2014; Balas‐Nakash 2010; Cypryk 2007; Garner 1997; Jamilian 2015; Magee 1990; Moreno‐Castilla 2013; Moses 2009; Rae 2000; Reece 1995; Valentini 2012; Wang 2015) did not report clear methods for concealing allocation and thus were judged to be at unclear risk of selection bias.
Blinding
Four trials were judged to be at low risk of performance bias (Asemi 2013a; Asemi 2013b; Louie 2011; Rae 2000). In Asemi 2013a, Asemi 2013b and Louie 2011, while the study dietitians were not blinded, women and all other research personnel were reported to be blinded, and thus the risk of performance bias was judged to be low. Rae 2000 reported that the women and diabetes service staff were blinded.
Thirteen trials were considered to be at high risk of performance bias due to lack of blinding of women (Balas‐Nakash 2010; Bo 2014; Cypryk 2007; Garner 1997; Grant 2011; Jamilian 2015; Lauszus 2001; Ma 2015; Moreno‐Castilla 2013; Moses 2009; Reece 1995; Valentini 2012; Wang 2015), and two trials were judged to be at unclear risk of performance bias (Asemi 2014; Magee 1990).
Two trials reported that outcome assessors were blinded (Asemi 2013a; Bo 2014), and were thus judged to be at low risk of detection bias. In one trial, an un‐blinded research dietitian was responsible for outcome data collection, and was thus judged to be at high risk of detection bias (Louie 2011). No information was available on whether outcome assessors were blinded in the remaining 16 trials (Asemi 2013b; Asemi 2014; Balas‐Nakash 2010; Cypryk 2007; Garner 1997; Grant 2011; Jamilian 2015; Lauszus 2001; Ma 2015; Magee 1990; Moreno‐Castilla 2013; Moses 2009; Rae 2000; Reece 1995; Valentini 2012; Wang 2015).
Incomplete outcome data
Fourteen included trials were judged as being at low risk of attrition bias (Asemi 2013a; Asemi 2013b; Asemi 2014; Bo 2014; Cypryk 2007; Garner 1997; Grant 2011; Jamilian 2015; Lauszus 2001; Magee 1990; Moses 2009; Rae 2000; Valentini 2012; Wang 2015).
There were no losses to follow‐up or post‐randomisation exclusions in seven trials (Bo 2014; Cypryk 2007; Magee 1990; Moses 2009; Valentini 2012; Wang 2015). In the remaining trials, there were low proportions of women lost to follow‐up or excluded post‐randomisation, and/or similar reasons for loss to follow‐up or exclusion between groups (Asemi 2013a; Asemi 2013b; Asemi 2014; Garner 1997; Grant 2011; Jamilian 2015; Lauszus 2001; Rae 2000).
Two trials were judged to be at high risk of attrition bias (Balas‐Nakash 2010; Louie 2011). In Louie 2011, small numbers of women were lost to follow‐up or were withdrawn post‐randomisation; however, by three months postpartum, outcome data were only reported for only 58 (58.5%) of the randomised women and babies. In Balas‐Nakash 2010, it was reported that a randomised cohort of 108 women who were potentially eligible, 20 declined to participate (15.8%) and a further 19 women (17.5%) were excluded due to incomplete dietary information (leaving 69 women); no information was available on the characteristics of these women (Balas‐Nakash 2010).
In three trials (Ma 2015; Moreno‐Castilla 2013; Reece 1995), the risk of attrition bias was judged to be unclear. In Ma 2015, six (12.8%) of the women in the intervention group (protocol violation: three women; insulin treatment: one woman; pre‐eclampsia: one woman; declined to participate: one woman), and six (12.5%) of the women in the control group were excluded post‐randomisation (protocol violation: three women; insulin treatment: two women; severe hypertension: one woman). In Moreno‐Castilla 2013, a considerable number of women discontinued their allocated intervention (did not wish to continue; or due to major deviation from the protocol), with notably more women discontinuing in the control group (15/75 (20.0%) versus 5/75 (6.7%)); however these women were included in the 'intention‐to‐treat' analyses. In Reece 1995, of the 61 women diagnosed with insulin‐dependent diabetes or GDM, 11 (18.0%) were excluded post‐randomisation, however it was not clear how many of these women had GDM (Reece 1995). Reasons for exclusion were reported as: spontaneous abortion (one woman), moved away (two women), and non‐compliance (four women in each group) (Reece 1995).
Selective reporting
Sixteen of the included trials were judged to be at unclear risk of reporting bias (Asemi 2013a; Asemi 2013b; Asemi 2014; Balas‐Nakash 2010; Bo 2014; Garner 1997; Grant 2011; Jamilian 2015; Lauszus 2001; Louie 2011; Ma 2015; Magee 1990; Moreno‐Castilla 2013; Moses 2009; Reece 1995; Wang 2015), largely due to insufficient detail available to confidently assess risk of selective reporting (i.e. lack of a detailed trial registration or published trial protocol).
Three of the trials were judged to be at high risk of reporting bias (Cypryk 2007; Rae 2000; Valentini 2012). In Cypryk 2007 data on maternal weight gain were reported incompletely "The proper weight change was observed in all the patients studied" and thus were unable to be included in the review. In Rae 2000, data for a number of outcomes were reported incompletely, and thus were unable to be included in meta‐analyses (for example, no standard error (SE) was reported for birthweight in the intervention group; and in regards to hyperbilirubinaemia, the authors only reported "The mean maximum bilirubin level measured in the two groups was the same"). In Valentini 2012, data related to glycaemic control (fasting plasma glucose; one‐hour postprandial plasma glucose; and HbA1c) were reported in figures only, with no variance measures reported; thus they were unable to be included in meta‐analyses.
Other potential sources of bias
There was no obvious risk of other potential sources of bias in 15 trials (Asemi 2013a; Asemi 2013b; Asemi 2014; Balas‐Nakash 2010; Bo 2014; Cypryk 2007; Grant 2011; Jamilian 2015; Ma 2015; Magee 1990; Moreno‐Castilla 2013; Moses 2009; Reece 1995; Valentini 2012; Wang 2015). In Garner 1997, the risk of other bias was judged to be unclear; there were 16 women (10.6%) from the control group who received the same interventions as those in the intervention group due to uncontrolled blood glucose concentrations. In three trials (Lauszus 2001; Louie 2011; Rae 2000), the risk of other bias was judged to be high. In Lauszus 2001, women in the high unsaturated fat diet group had a higher trial entry BMI compared with women in the low unsaturated fat diet group. In Louie 2011, baseline blood glucose concentrations at two hours post 75 g glucose load were significantly higher in the low‐GI group compared with women in the high‐fibre group. In Rae 2000, there was a higher proportion of women with a history of preterm labour in the no energy‐restricted diet group compared with the energy‐restricted diet group.
Effects of interventions
See: Table 1; Table 2; Table 3; Table 4
1. Low‐moderate GI diet versus moderate‐high GI diet
Four trials (Balas‐Nakash 2010; Grant 2011; Ma 2015; Moses 2009) which randomised 224 women and their babies were included in this comparison. Authors from Grant 2011 and Moses 2009 provided additional unpublished outcome data.
Primary outcomes
Fetal/neonatal/childhood outcomes
There was no clear difference in the risk of being born large‐for‐gestational age between the low‐moderate GI and moderate‐high GI diet groups (risk ratio (RR) 0.71, 95% confidence interval (CI) 0.22 to 2.34; two trials, 89 infants; low‐quality evidence) (Analysis 1.1).
1.1. Analysis.
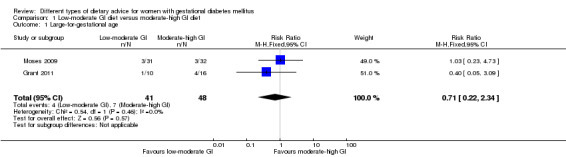
Comparison 1 Low‐moderate GI diet versus moderate‐high GI diet, Outcome 1 Large‐for‐gestational age.
The four trials in this comparison did not report on the other primary outcomes for the fetus/neonate/child: perinatal mortality; neonatal mortality or morbidity composite; neurosensory disability.
Maternal outcomes
Only one trial (Ma 2015) reported on hypertensive disorders of pregnancy, and showed no clear difference between the low‐moderate GI and moderate‐high GI diet groups for severe hypertension or pre‐eclampsia (RR 1.02, 95% CI 0.07 to 15.86; 95 women; very‐low quality evidence) (Analysis 1.2) or eclampsia (RR 0.34, 95% CI 0.01 to 8.14; 83 women; very‐low quality evidence) (Analysis 1.3).
1.2. Analysis.
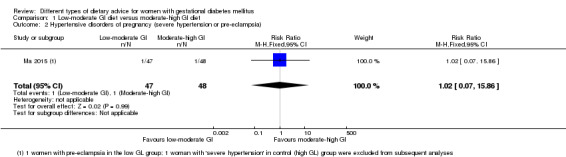
Comparison 1 Low‐moderate GI diet versus moderate‐high GI diet, Outcome 2 Hypertensive disorders of pregnancy (severe hypertension or pre‐eclampsia).
1.3. Analysis.
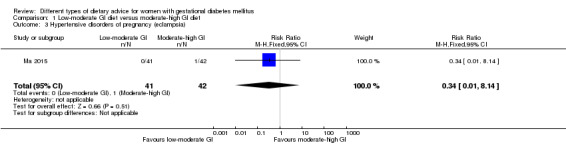
Comparison 1 Low‐moderate GI diet versus moderate‐high GI diet, Outcome 3 Hypertensive disorders of pregnancy (eclampsia).
Only one trial (Moses 2009) reported on caesarean section, and showed no clear difference between groups (RR 0.66, 95% CI 0.29 to 1.47; 63 women; low‐quality evidence) (Analysis 1.4).
1.4. Analysis.
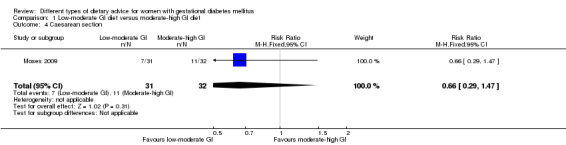
Comparison 1 Low‐moderate GI diet versus moderate‐high GI diet, Outcome 4 Caesarean section.
None of the four trials reported on the other primary outcome for the mother: type 2 diabetes development.
Secondary outcomes
Fetal/neonatal outcomes
No clear differences between groups were shown for the following secondary fetal/neonatal outcomes: gestational age at birth (mean difference (MD) 0.30 weeks, 95% CI ‐0.30 to 0.90; one trial; 62 infants) (Analysis 1.5); preterm birth (RR 0.64, 95% CI 0.22 to 1.85; two trials, 146 infants) (Analysis 1.6); macrosomia (RR 0.59, 95% CI 0.16 to 2.26; three trials, 172 infants) (Analysis 1.7); small‐for‐gestational age (RR 5.16, 95% CI 0.26 to 103.27; one trial, 63 infants) (Analysis 1.8); birthweight (MD ‐55.98 g, 95% CI ‐201.90 to 89.95; two trials, 145 infants) (Analysis 1.9); head circumference at birth (MD 0.40 cm, 95% CI ‐0.58 to 1.38; one trial, 59 infants) (Analysis 1.10); length at birth (MD ‐0.50 cm, 95% CI ‐1.54 to 0.54; one trial, 60 infants) (Analysis 1.11); or ponderal index at birth (MD 0.10 kg/m³, 95% CI ‐0.03 to 0.23; one trial, 60 infants) (Analysis 1.12).
1.5. Analysis.
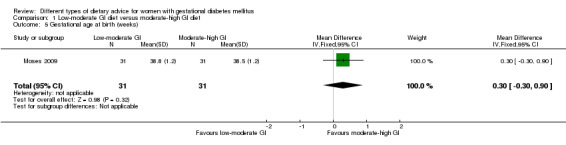
Comparison 1 Low‐moderate GI diet versus moderate‐high GI diet, Outcome 5 Gestational age at birth (weeks).
1.6. Analysis.
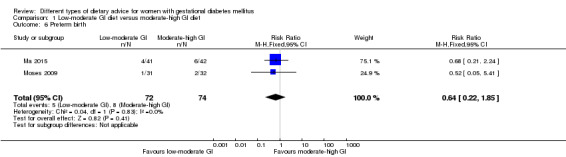
Comparison 1 Low‐moderate GI diet versus moderate‐high GI diet, Outcome 6 Preterm birth.
1.7. Analysis.
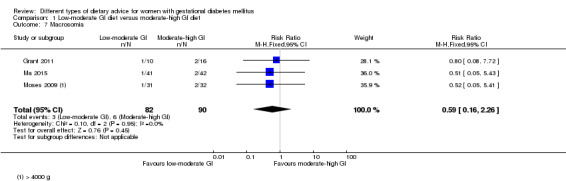
Comparison 1 Low‐moderate GI diet versus moderate‐high GI diet, Outcome 7 Macrosomia.
1.8. Analysis.
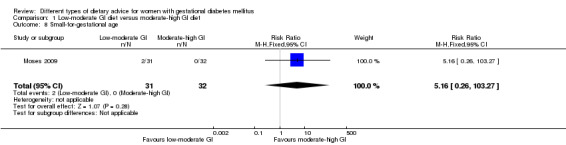
Comparison 1 Low‐moderate GI diet versus moderate‐high GI diet, Outcome 8 Small‐for‐gestational age.
1.9. Analysis.
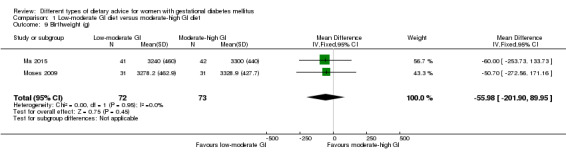
Comparison 1 Low‐moderate GI diet versus moderate‐high GI diet, Outcome 9 Birthweight (g).
1.10. Analysis.
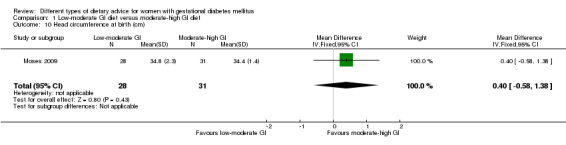
Comparison 1 Low‐moderate GI diet versus moderate‐high GI diet, Outcome 10 Head circumference at birth (cm).
1.11. Analysis.
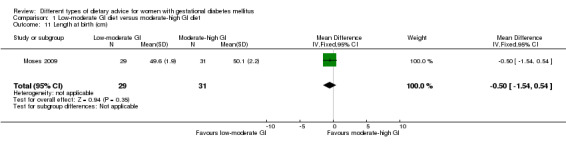
Comparison 1 Low‐moderate GI diet versus moderate‐high GI diet, Outcome 11 Length at birth (cm).
1.12. Analysis.

Comparison 1 Low‐moderate GI diet versus moderate‐high GI diet, Outcome 12 Ponderal index at birth (kg/m³).
Grant 2011 also reported on birthweight and small‐for‐gestational age, but not separately for the subset of infants born to women with GDM.
The four trials did not report on the other secondary outcomes for the fetus/neonate.
Childhood outcomes
The four trials did not report on any of the secondary outcomes for the child.
Adulthood outcomes
The four trials did not report on any of the secondary outcomes for the adult.
Maternal outcomes: perinatal
No clear differences between groups were shown for the following secondary maternal outcomes: normal vaginal birth (RR 1.35, 95% CI 0.89 to 2.07; one trial, 63 women) (Analysis 1.13); operative vaginal birth (RR 0.62, 95% CI 0.16 to 2.37; one trial, 63 women) (Analysis 1.14); induction of labour (RR 0.88, 95% CI 0.33 to 2.34; one trial, 63 women; low‐quality evidence) (Analysis 1.15); postpartum haemorrhage (RR 1.02, 95% CI 0.15 to 6.93; one trial, 83 women) (Analysis 1.16); postpartum infection (RR 0.34, 95% CI 0.01 to 8.14; one trial, 83 women) (Analysis 1.17); gestational weight gain (MD ‐0.47 kg, 95% CI ‐2.18 to 1.24; one trial, 83 women) (Analysis 1.18); use of additional pharmacotherapy (average RR 0.82, 95% CI 0.39 to 1.74; four trials, 221 women; Tau² = 0.36; Chi² = 9.84, P = 0.02; I² = 70%) (Analysis 1.19); glycaemic control: end of intervention fasting plasma glucose (MD ‐0.15 mmol/L, 95% CI ‐0.55 to 0.25; one trial, 83 women) (Analysis 1.20) and end of intervention HbA1c (MD 0.01%, 95% CI ‐0.18 to 0.20; one trial, 83 women) (Analysis 1.22).
1.13. Analysis.
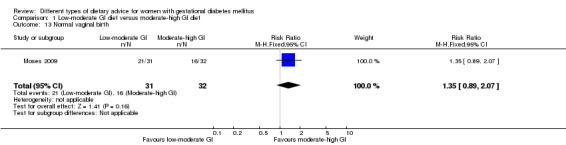
Comparison 1 Low‐moderate GI diet versus moderate‐high GI diet, Outcome 13 Normal vaginal birth.
1.14. Analysis.
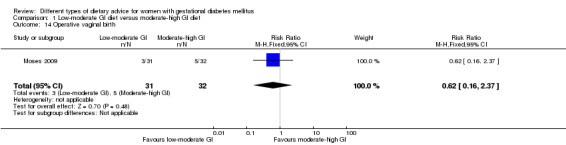
Comparison 1 Low‐moderate GI diet versus moderate‐high GI diet, Outcome 14 Operative vaginal birth.
1.15. Analysis.
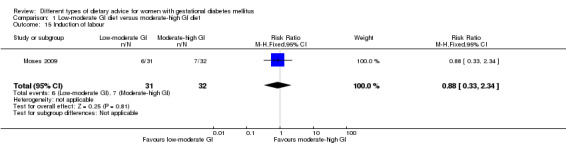
Comparison 1 Low‐moderate GI diet versus moderate‐high GI diet, Outcome 15 Induction of labour.
1.16. Analysis.
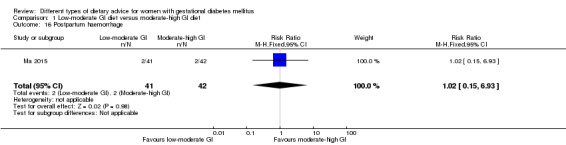
Comparison 1 Low‐moderate GI diet versus moderate‐high GI diet, Outcome 16 Postpartum haemorrhage.
1.17. Analysis.
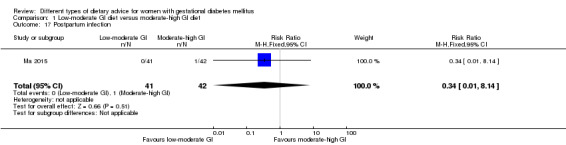
Comparison 1 Low‐moderate GI diet versus moderate‐high GI diet, Outcome 17 Postpartum infection.
1.18. Analysis.

Comparison 1 Low‐moderate GI diet versus moderate‐high GI diet, Outcome 18 Gestational weight gain (kg).
1.19. Analysis.
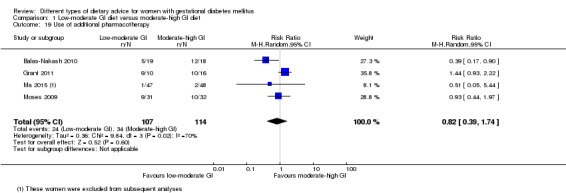
Comparison 1 Low‐moderate GI diet versus moderate‐high GI diet, Outcome 19 Use of additional pharmacotherapy.
1.20. Analysis.
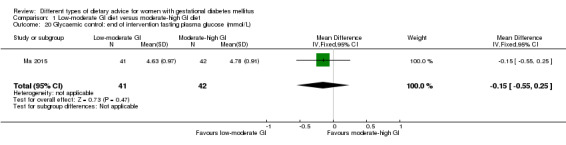
Comparison 1 Low‐moderate GI diet versus moderate‐high GI diet, Outcome 20 Glycaemic control: end of intervention fasting plasma glucose (mmol/L).
1.22. Analysis.
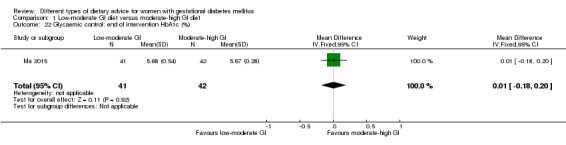
Comparison 1 Low‐moderate GI diet versus moderate‐high GI diet, Outcome 22 Glycaemic control: end of intervention HbA1c (%).
Also in regards to glycaemic control, in one trial (Ma 2015), a lower end of intervention two‐hour postprandial glucose concentration was shown for women in the low‐moderate GI diet group compared with the moderate‐high GI group (MD ‐0.71 mmol/L, 95% CI ‐1.21 to ‐0.21; one trial, 83 women) (Analysis 1.21).
1.21. Analysis.
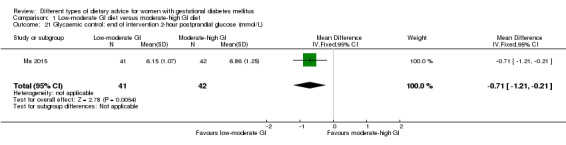
Comparison 1 Low‐moderate GI diet versus moderate‐high GI diet, Outcome 21 Glycaemic control: end of intervention 2‐hour postprandial glucose (mmol/L).
Moses 2009 also reported that "There were no significant differences between the women in either group with respect to weight gain from baseline to delivery..." (data not shown); we were unable to include these data in the above meta‐analysis.
In regards to adherence to the dietary intervention, Ma 2015 reported that "After the intervention... The Low‐GL group had significantly lower values for GL (122 v. 136) and glycaemic index (50 v. 54)... than did the Control group (all P <0·01);" and Moses 2009: noted that "The women randomly assigned to the low–glycaemic index diet achieved and maintained a significantly lower glycaemic index at all stages". In both Balas‐Nakash 2010 and Grant 2011, information regarding adherence was not reported separately for the subset of women with GDM.
Balas‐Nakash 2010 also reported on women's total average weight gain, and Grant 2011 reported on maternal weight gain rate, insulin sensitivity and glycaemic control (fasting insulin, fasting and postprandial blood glucose, and HbA1c), birthweight, and small‐for‐gestational age, but not separately for the subset of women with GDM.
The four trials did not report on the other secondary outcomes for the mother in the perinatal period.
Maternal outcomes: long term
The four trials did not report on any of the secondary outcomes for the mother in the long term.
Health services outcomes
The four trials did not report on any of the secondary outcomes relating to the use and costs of health services.
2. Energy‐restricted diet versus no energy‐restricted diet
Three trials (Garner 1997; Magee 1990; Rae 2000) which randomised 437 mothers and their babies were included in this comparison.
Primary outcomes
Fetal/neonatal/childhood outcomes
Only Rae 2000 reported on large‐for‐gestational age and showed no clear difference for babies born to mothers from the energy‐restricted versus no energy‐restricted diet groups (RR 1.17, 95% CI 0.65 to 2.12; 123 infants; low‐quality evidence) (Analysis 2.1). Both Garner 1997 and Rae 2000 reported on perinatal mortality, and there were no deaths in either group (low‐quality evidence) (Analysis 2.2).
2.1. Analysis.
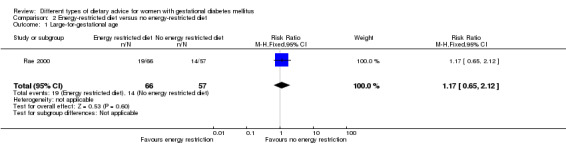
Comparison 2 Energy‐restricted diet versus no energy‐restricted diet, Outcome 1 Large‐for‐gestational age.
2.2. Analysis.
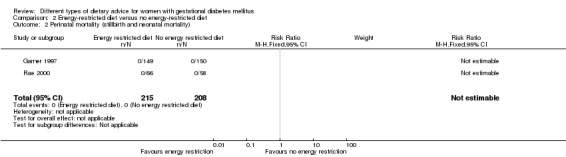
Comparison 2 Energy‐restricted diet versus no energy‐restricted diet, Outcome 2 Perinatal mortality (stillbirth and neonatal mortality).
None of the three trials reported on the other primary outcomes for the fetus/neonate/child: neonatal mortality or morbidity; neurosensory disability.
Maternal outcomes
Only Rae 2000 reported on hypertensive disorders of pregnancy (pre‐eclampsia) and showed no clear difference in risk for women in the energy‐restricted versus no energy‐restricted diet groups (RR 1.00, 95% CI 0.51 to 1.97; 117 women; low‐quality evidence) (Analysis 2.3). Both Garner 1997 and Rae 2000 reported on caesarean section birth, and overall, no clear difference was shown between groups (RR 1.12, 95% CI 0.80 to 1.56; 420 women; low‐quality evidence) (Analysis 2.4).
2.3. Analysis.
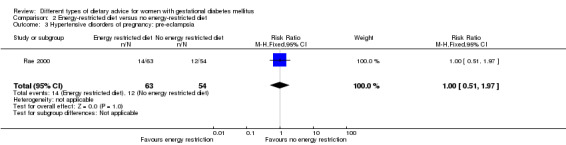
Comparison 2 Energy‐restricted diet versus no energy‐restricted diet, Outcome 3 Hypertensive disorders of pregnancy: pre‐eclampsia.
2.4. Analysis.
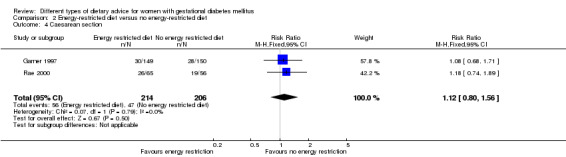
Comparison 2 Energy‐restricted diet versus no energy‐restricted diet, Outcome 4 Caesarean section.
None of the three trials reported on the other primary outcome for the mother: type 2 diabetes development.
Secondary outcomes
Fetal/neonatal outcomes
Garner 1997 and Rae 2000 reported no stillbirths (Analysis 2.5) or neonatal deaths (Analysis 2.6) in either group.
2.5. Analysis.
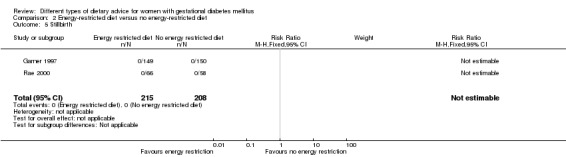
Comparison 2 Energy‐restricted diet versus no energy‐restricted diet, Outcome 5 Stillbirth.
2.6. Analysis.
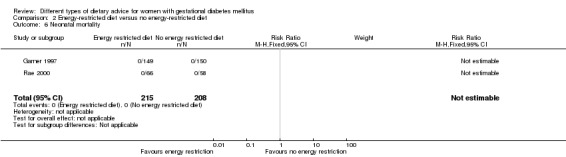
Comparison 2 Energy‐restricted diet versus no energy‐restricted diet, Outcome 6 Neonatal mortality.
There were no clear differences observed between groups for any of the fetal/neonatal outcomes reported: gestational age at birth (MD ‐0.16 weeks, 95% CI ‐0.67 to 0.36; two trials, 423 infants) (Analysis 2.7); macrosomia (RR 0.99, 95% CI 0.64 to 1.53; two trials, 421 infants; Tau² = 0.07; Chi² = 1.79, P = 0.18; I² = 44%) (> 4000 g) (Analysis 2.8); macrosomia (> 4500 g) (RR 1.01, 95% CI 0.33 to 3.05; one trial, 299 infants) (Analysis 2.9); birthweight (MD ‐107.00 g, 95% CI ‐240.32 to 26.32; one trial, 299 infants) (Analysis 2.10); shoulder dystocia (RR 0.12, 95% CI 0.01 to 2.26; two trials, 418 infants) (Analysis 2.11); neonatal hypoglycaemia (average RR 1.06, 95% CI 0.48 to 2.32; two trials, 408 infants; Tau² = 0.24; Chi² = 4.03, P = 0.04; I² = 75%; very‐low quality evidence) (Analysis 2.14); or neonatal hyperbilirubinaemia (RR 0.81, 95% CI 0.33 to 1.98; one trial, 299 infants) (Analysis 2.15).
2.7. Analysis.
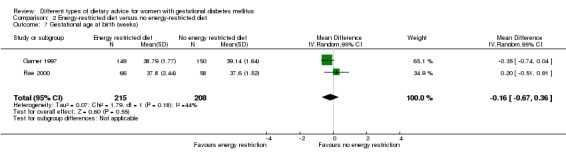
Comparison 2 Energy‐restricted diet versus no energy‐restricted diet, Outcome 7 Gestational age at birth (weeks).
2.8. Analysis.
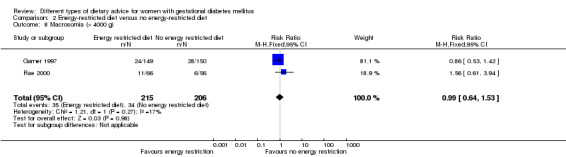
Comparison 2 Energy‐restricted diet versus no energy‐restricted diet, Outcome 8 Macrosomia (> 4000 g).
2.9. Analysis.
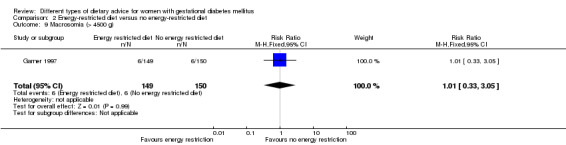
Comparison 2 Energy‐restricted diet versus no energy‐restricted diet, Outcome 9 Macrosomia (> 4500 g).
2.10. Analysis.
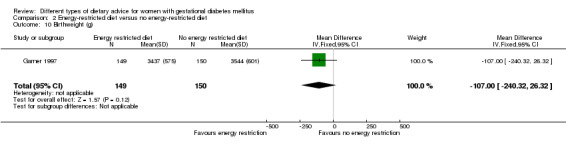
Comparison 2 Energy‐restricted diet versus no energy‐restricted diet, Outcome 10 Birthweight (g).
2.11. Analysis.
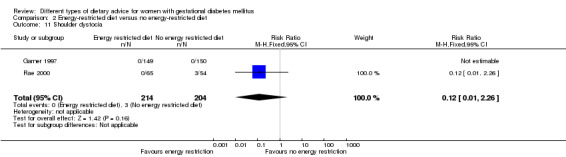
Comparison 2 Energy‐restricted diet versus no energy‐restricted diet, Outcome 11 Shoulder dystocia.
2.14. Analysis.
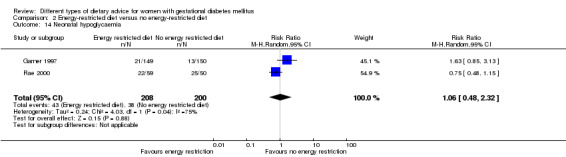
Comparison 2 Energy‐restricted diet versus no energy‐restricted diet, Outcome 14 Neonatal hypoglycaemia.
2.15. Analysis.
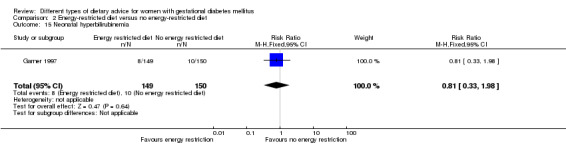
Comparison 2 Energy‐restricted diet versus no energy‐restricted diet, Outcome 15 Neonatal hyperbilirubinemia.
There were no bone fractures (Analysis 2.12) or nerve palsies (Analysis 2.13) in either group in Garner 1997. There were more cases of neonatal hypocalcaemia among babies born to women in the energy‐restricted diet group versus the no energy‐restricted diet group (RR 1.36, 95% CI 1.00 to 1.86; one trial, 299 infants) (Analysis 2.16).
2.12. Analysis.

Comparison 2 Energy‐restricted diet versus no energy‐restricted diet, Outcome 12 Bone fracture.
2.13. Analysis.
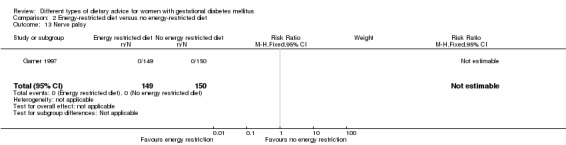
Comparison 2 Energy‐restricted diet versus no energy‐restricted diet, Outcome 13 Nerve palsy.
2.16. Analysis.
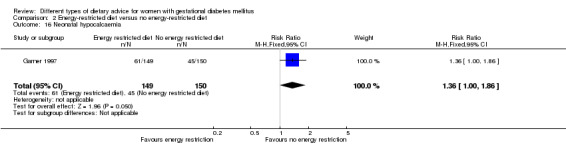
Comparison 2 Energy‐restricted diet versus no energy‐restricted diet, Outcome 16 Neonatal hypocalcaemia.
Rae 2000 reported the data below incompletely, and thus they were unable to be included in meta‐analyses.
The mean (SE) birthweight were: 3461 (not reported) and 3264 (0.2) for the intervention and control groups respectively (P = 0.105). The SE for the intervention group was not reported; and the numbers of infants in each group were unclear.
Adiposity at birth (skinfold thickness): no difference between groups was shown for average of all (P = 0.161), subscapular (P = 0.441), suprailiac (P = 0.064), triceps (P = 0.842) and mid arm circumference measurements (P = 0.506), though higher skinfold thickness in the energy‐restricted diet group for abdominal skinfolds (P = 0.021) was shown; the number of infants in each group were unclear.
"The mean maximum bilirubin level measured in the two groups was the same."
"Five infants in the control group were polycythaemic (Fisher's exact test p = 0.0202)"; the numbers of infants in each group were unclear.
None of the three trials reported on the other secondary outcomes for the fetus/neonate.
Childhood outcomes
None of the three trials reported on any of the secondary outcomes for the child.
Adulthood outcomes
None of the three trials reported on any of the secondary outcomes for the adult.
Maternal outcomes: perinatal
There were no clear differences observed between groups for the following secondary maternal outcomes: normal vaginal birth (RR 0.96, 95% CI 0.86 to 1.08; two trials, 420 women) (Analysis 2.17); operative vaginal birth (RR 0.98, 95% CI 0.38 to 2.54; one trial, 121 women) (Analysis 2.18); induction of labour (RR 1.02, 95% CI 0.68 to 1.53; one trial, 114 women, low‐quality evidence) (Analysis 2.19); gestational weight gain (MD 1.88 kg, 95% CI ‐1.96 to 5.72; one trial, 117 women) (Analysis 2.20); gestational weight gain: weight at birth (MD ‐3.15 kg, 95% CI ‐7.29 to 0.99; one trial, 299 women) (Analysis 2.21); insulin sensitivity: during intervention fasting plasma insulin (MD 100.00 pM, 95% CI ‐26.02 to 226.02; one trial, 12 women) (Analysis 2.22); end of intervention fasting plasma insulin (MD ‐20.00 pM, 95% CI ‐127.70 to 87.70; one trial, 12 women) (Analysis 2.23). Of note, the standard deviations (SDs) reported in Magee 1990, used in Analysis 2.22 and Analysis 2.23, differ notably in size between the two small groups (energy‐restricted diet group, N = 7; no energy‐restricted diet group, N = 5).
2.17. Analysis.
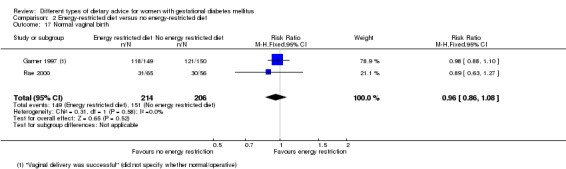
Comparison 2 Energy‐restricted diet versus no energy‐restricted diet, Outcome 17 Normal vaginal birth.
2.18. Analysis.
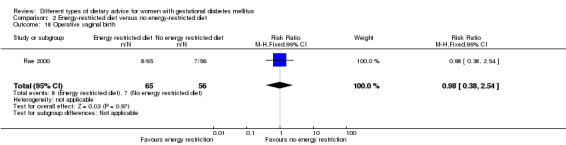
Comparison 2 Energy‐restricted diet versus no energy‐restricted diet, Outcome 18 Operative vaginal birth.
2.19. Analysis.
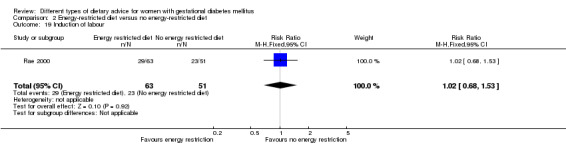
Comparison 2 Energy‐restricted diet versus no energy‐restricted diet, Outcome 19 Induction of labour.
2.20. Analysis.
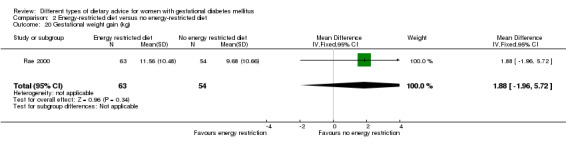
Comparison 2 Energy‐restricted diet versus no energy‐restricted diet, Outcome 20 Gestational weight gain (kg).
2.21. Analysis.
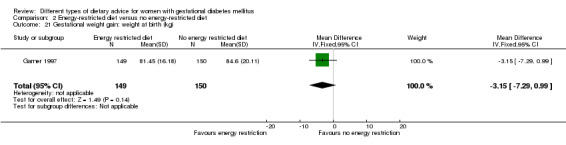
Comparison 2 Energy‐restricted diet versus no energy‐restricted diet, Outcome 21 Gestational weight gain: weight at birth (kg).
2.22. Analysis.
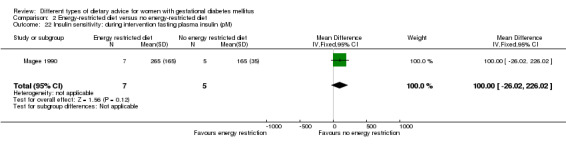
Comparison 2 Energy‐restricted diet versus no energy‐restricted diet, Outcome 22 Insulin sensitivity: during intervention fasting plasma insulin (pM).
2.23. Analysis.
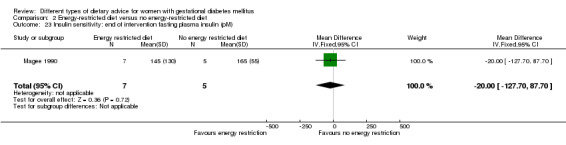
Comparison 2 Energy‐restricted diet versus no energy‐restricted diet, Outcome 23 Insulin sensitivity: end of intervention fasting plasma insulin (pM).
In regards to use of additional pharmacotherapy, no clear difference was observed between group in Rae 2000 (11/63 versus 9/54 in the energy‐restricted diet and no energy‐restricted diet groups respectively; RR 1.05, 95% CI 0.47 to 2.34; 117 women). In Garner 1997 however, the use of insulin was only part of the protocol for the energy‐restricted diet intervention group, and thus accordingly there were more cases of additional pharmacotherapy use in this group (36/149 versus 0/150 in the energy‐restricted diet and no energy‐restricted diet groups, respectively; RR 73.49, 95% CI 4.55 to 1186.39; 299 women). Due to very different approaches to the use of additional pharmacotherapy in these two trials, and the subsequent substantial heterogeneity observed (Tau² = 17.28; Chi² = 16.84, P < 0.0001, I² = 94%), we have not reported a pooled result for this outcome (Analysis 2.24).
2.24. Analysis.
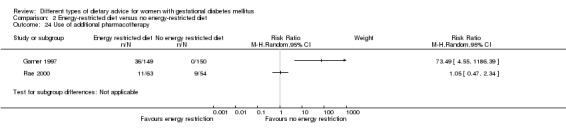
Comparison 2 Energy‐restricted diet versus no energy‐restricted diet, Outcome 24 Use of additional pharmacotherapy.
Considering glycaemic control, no clear differences between groups were seen for: during intervention preprandial fasting glucose (MD 0.21 mmol/L, 95% CI ‐0.58 to 0.99; two trials, 311 women; Tau² = 0.24; Chi² = 3.33, P = 0.07; I² = 70%) (Analysis 2.25); during intervention 24‐hour mean plasma glucose (MD 0.10 mmol/L, 95% CI ‐0.82 to 1.02; one trial, 12 women) (Analysis 2.26); during intervention one‐hour postprandial glucose (MD ‐0.25 mmol/L, 95% CI ‐0.68 to 0.18; one trial, 299 women) (Analysis 2.27); during/at end of intervention fasting glucose (MD 0.10 mmol/L, 95% CI ‐0.18 to 0.38; one trial, 117 women) (Analysis 2.31); during/at end of intervention mean plasma glucose (MD 0.10 mmol/L, 95% CI ‐0.34 to 0.54; one trial, 117 women) (Analysis 2.32); or during/at end of intervention mean HbA1c (MD ‐0.20%, 95% CI ‐0.64 to 0.24; one trial, 117 women) (Analysis 2.33). Lower end of intervention preprandial/fasting glucose (MD ‐0.23 mmol/L, 95% CI ‐0.44 to ‐0.03; two trials, 311 women) (Analysis 2.28); end of intervention 24‐hour mean plasma glucose (MD ‐1.30 mmol/L, 95% CI ‐2.25 to ‐0.35; one trial, 12 women) (Analysis 2.29); and end of intervention one‐hour postprandial glucose (MD ‐0.51 mmol/L, 95% CI ‐0.89 to ‐0.13; one trial, 299 women) (Analysis 2.30) values were however observed for women in the energy‐restricted diet versus no energy‐restricted diet group.
2.25. Analysis.
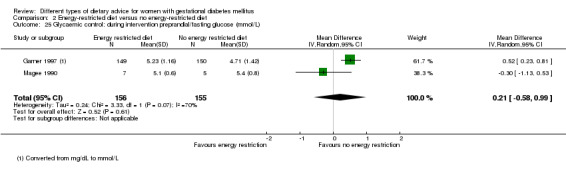
Comparison 2 Energy‐restricted diet versus no energy‐restricted diet, Outcome 25 Glycaemic control: during intervention preprandial/fasting glucose (mmol/L).
2.26. Analysis.
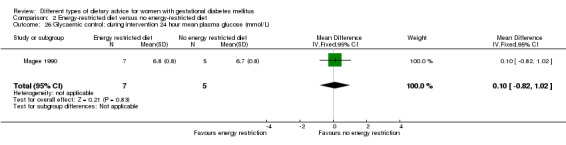
Comparison 2 Energy‐restricted diet versus no energy‐restricted diet, Outcome 26 Glycaemic control: during intervention 24 hour mean plasma glucose (mmol/L).
2.27. Analysis.
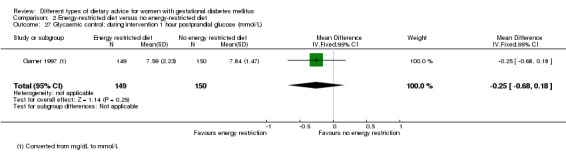
Comparison 2 Energy‐restricted diet versus no energy‐restricted diet, Outcome 27 Glycaemic control: during intervention 1 hour postprandial glucose (mmol/L).
2.31. Analysis.
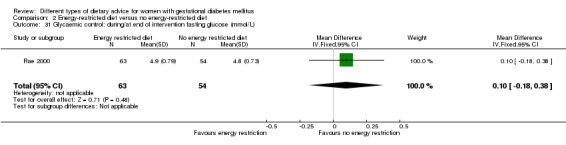
Comparison 2 Energy‐restricted diet versus no energy‐restricted diet, Outcome 31 Glycaemic control: during/at end of intervention fasting glucose (mmol/L).
2.32. Analysis.
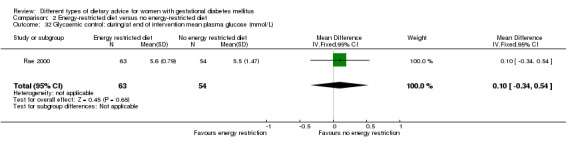
Comparison 2 Energy‐restricted diet versus no energy‐restricted diet, Outcome 32 Glycaemic control: during/at end of intervention mean plasma glucose (mmol/L).
2.33. Analysis.
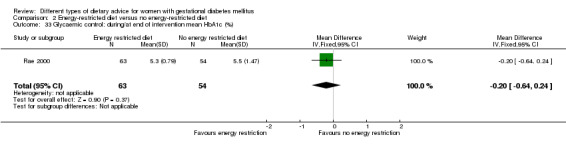
Comparison 2 Energy‐restricted diet versus no energy‐restricted diet, Outcome 33 Glycaemic control: during/at end of intervention mean HbA1c (%).
2.28. Analysis.
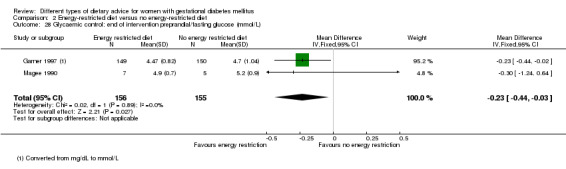
Comparison 2 Energy‐restricted diet versus no energy‐restricted diet, Outcome 28 Glycaemic control: end of intervention preprandial/fasting glucose (mmol/L).
2.29. Analysis.

Comparison 2 Energy‐restricted diet versus no energy‐restricted diet, Outcome 29 Glycaemic control: end of intervention 24‐hour mean plasma glucose (mmol/L).
2.30. Analysis.
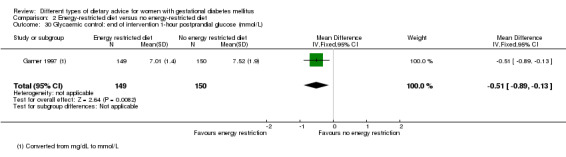
Comparison 2 Energy‐restricted diet versus no energy‐restricted diet, Outcome 30 Glycaemic control: end of intervention 1‐hour postprandial glucose (mmol/L).
In regards to adherence to the dietary intervention, Rae 2000 used three‐day food intake diaries at three time points, and reported that "In the intervention group from treatment until delivery the average energy intake was slightly less (97%) than the diet goal range. They consumed less carbohydrate than instructed, but more fat and slightly more protein. However the control group consumed considerably less energy than intended with a mean intake of 77% of the goal. Thus there was no significant difference between average energy intake of the two groups". Magee 1990 reported that "the calorie ration for the calorie‐restricted group during the second week was significantly reduced" (mean (SD) kcal/day: energy‐restricted diet group: 1238 (103) versus no energy‐restricted diet group: 2307 (171)). Garner 1997 did not report information related to adherence.
None of the three trials reported on the other secondary outcomes for the mother.
Maternal outcomes: long term
None of the three trials reported on any of the secondary outcomes for the mother in the long term.
Health services outcomes
None of the three trials reported on any of the secondary outcomes relating to the use of costs of health services.
3. DASH diet versus control diet with matching macronutrient contents
Three trials (Asemi 2013a; Asemi 2013b; Asemi 2014) which randomised 136 women and their babies were included in this comparison.
Primary outcomes
Fetal/neonatal/childhood outcomes
The three trials did not report on any of the primary outcomes for the fetus/neonatal/child.
Maternal outcomes
No clear difference across the three trials was shown between the DASH diet and control diet groups for the risk of hypertensive disorders of pregnancy (pre‐eclampsia) (RR 1.00, 95% CI 0.31 to 3.26; 136 women) (Analysis 3.1). Two trials reported on caesarean section birth and showed a reduction in the risk for women receiving the DASH diet compared with the control diet (RR 0.53, 95% CI 0.37 to 0.76; 86 women) (Analysis 3.2).
3.1. Analysis.
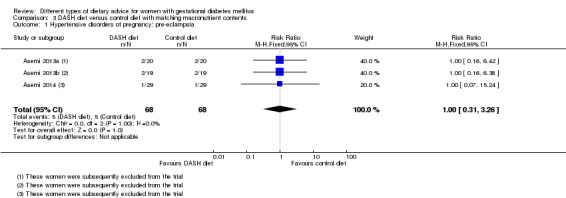
Comparison 3 DASH diet versus control diet with matching macronutrient contents, Outcome 1 Hypertensive disorders of pregnancy: pre‐eclampsia.
3.2. Analysis.
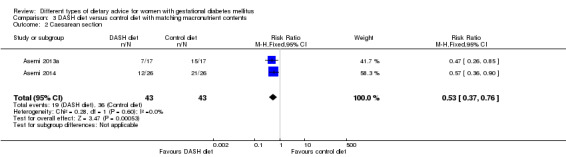
Comparison 3 DASH diet versus control diet with matching macronutrient contents, Outcome 2 Caesarean section.
The three trials did not report on the other primary maternal outcome: type 2 diabetes development.
Secondary outcomes
Fetal/neonatal outcomes
In Asemi 2014, no clear differences were shown between groups for gestational age at birth (MD 0.20 weeks, 95% CI ‐0.45 to 0.85; 52 infants) (Analysis 3.3) and length at birth (MD ‐0.50 cm, 95% CI ‐1.59 to 0.59; 52 infants) (Analysis 3.7), however infants born to mothers in the DASH diet group were less likely than those born to mothers on the control diet group to be macrosomic (RR 0.10, 95% CI 0.01 to 0.73; 52 infants) (Analysis 3.4), and had on average smaller head circumferences (MD ‐0.90 cm, 95% CI ‐1.44 to ‐0.36; 52 infants) (Analysis 3.6) and lower ponderal indices at birth (MD ‐0.37 kg/m³, 95% CI ‐0.54 to ‐0.20; 52 infants) (Analysis 3.8). Across two trials, infants born to mothers in the DASH diet group had, on average, lower birthweights than those born to mothers in the control diet group (MD ‐581.27 g, 95% CI ‐790.32 to ‐372.22; 86 infants) (Analysis 3.5).
3.3. Analysis.
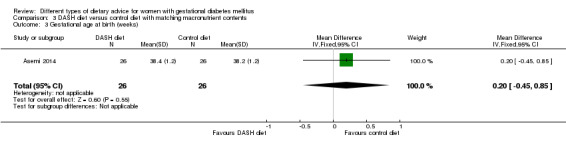
Comparison 3 DASH diet versus control diet with matching macronutrient contents, Outcome 3 Gestational age at birth (weeks).
3.7. Analysis.
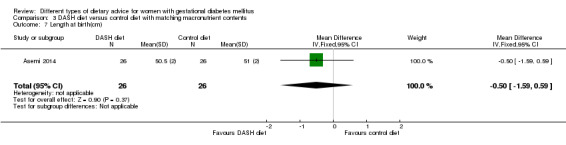
Comparison 3 DASH diet versus control diet with matching macronutrient contents, Outcome 7 Length at birth(cm).
3.4. Analysis.
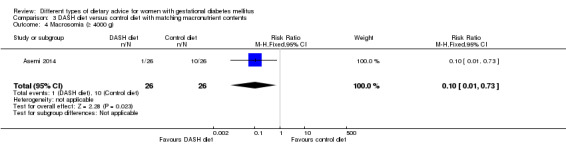
Comparison 3 DASH diet versus control diet with matching macronutrient contents, Outcome 4 Macrosomia (≥ 4000 g).
3.6. Analysis.
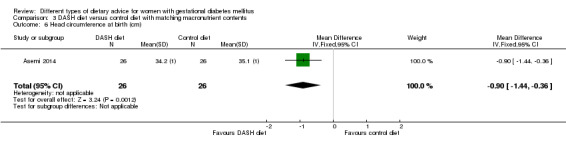
Comparison 3 DASH diet versus control diet with matching macronutrient contents, Outcome 6 Head circumference at birth (cm).
3.8. Analysis.
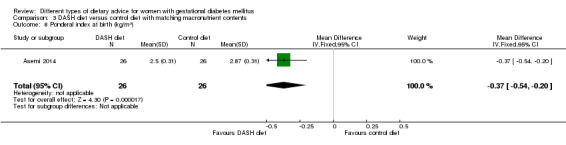
Comparison 3 DASH diet versus control diet with matching macronutrient contents, Outcome 8 Ponderal index at birth (kg/m³).
3.5. Analysis.
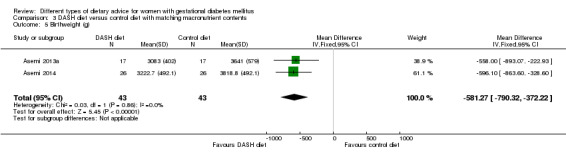
Comparison 3 DASH diet versus control diet with matching macronutrient contents, Outcome 5 Birthweight (g).
The three trials did not report on the other secondary outcomes for the fetus/neonate.
Childhood outcomes
The two trials did not report on any of the secondary outcomes for the child.
Adulthood outcomes
The two trials did not report on any of the secondary outcomes for the adult.
Maternal outcomes: perinatal
No clear differences were shown between groups for placental abruption (RR 3.00, 95% CI 0.13 to 70.74; one trial, 58 women) (Analysis 3.9) and gestational weight gain: BMI at end of the intervention (MD ‐0.83 kg/m², 95% CI ‐3.76 to 2.11; two trials, 66 women; Tau² = 2.03; Chi² = 1.83, P = 0.18; I² = 45%) (Analysis 3.10); weight at end of the intervention (MD ‐2.88 kg, 95% CI ‐8.48 to 2.71; two trials, 66 women) (Analysis 3.11).
3.9. Analysis.
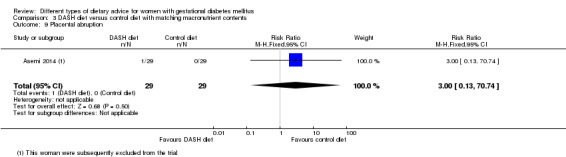
Comparison 3 DASH diet versus control diet with matching macronutrient contents, Outcome 9 Placental abruption.
3.10. Analysis.
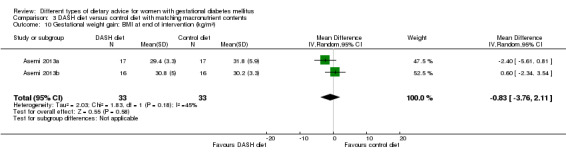
Comparison 3 DASH diet versus control diet with matching macronutrient contents, Outcome 10 Gestational weight gain: BMI at end of intervention (kg/m²).
3.11. Analysis.
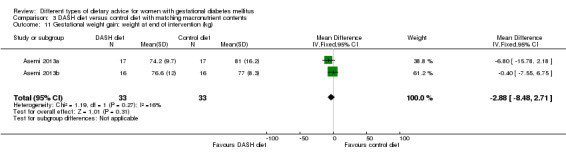
Comparison 3 DASH diet versus control diet with matching macronutrient contents, Outcome 11 Gestational weight gain: weight at end of intervention (kg).
In regards to insulin sensitivity, women in the DASH diet group had on average a lower end of intervention homeostatic model assessment of insulin resistance (HOMA‐IR) (MD ‐1.00, 95% CI ‐1.34 to ‐0.66; one trial, 32 women) (Analysis 3.12), and blood insulin (MD ‐3.26 µIU/mL, 95% CI ‐4.42 to ‐2.10; one trial, 32 women) (Analysis 3.13); there was also less use of additional pharmacotherapy among women in the DASH diet group (RR 0.28, 95% CI 0.14 to 0.53; two trials, 86 women) (Analysis 3.14). Considering glycaemic control, women in the DASH diet group had on average lower fasting blood glucose (MD ‐0.42 mmol/L, 95% CI ‐0.53 to ‐0.32; two trials, 66 women) (Analysis 3.15); however no clear difference was observed for HbA1c (MD ‐0.25%, 95% CI ‐0.76 to 0.26; one trial, 34 women) (Analysis 3.16).
3.12. Analysis.
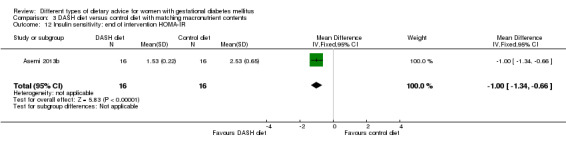
Comparison 3 DASH diet versus control diet with matching macronutrient contents, Outcome 12 Insulin sensitivity: end of intervention HOMA‐IR.
3.13. Analysis.
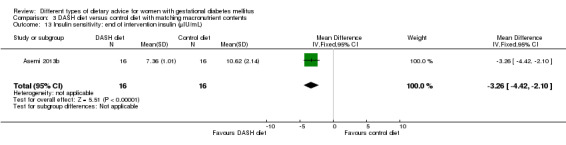
Comparison 3 DASH diet versus control diet with matching macronutrient contents, Outcome 13 Insulin sensitivity: end of intervention insulin (µIU/mL).
3.14. Analysis.
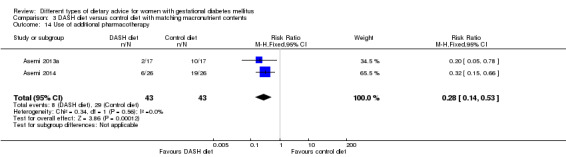
Comparison 3 DASH diet versus control diet with matching macronutrient contents, Outcome 14 Use of additional pharmacotherapy.
3.15. Analysis.
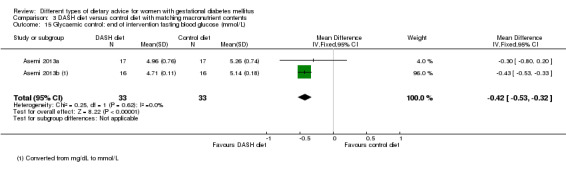
Comparison 3 DASH diet versus control diet with matching macronutrient contents, Outcome 15 Glycaemic control: end of intervention fasting blood glucose (mmol/L).
3.16. Analysis.
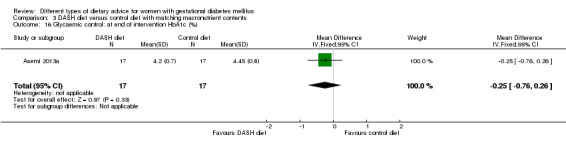
Comparison 3 DASH diet versus control diet with matching macronutrient contents, Outcome 16 Glycaemic control: at end of intervention HbA1c (%).
In regards to adherence:
Asemi 2013a reported that "Based on the 3 d dietary records that participants provided throughout the study, no statistically significant difference was seen between the two groups in terms of dietary intakes of energy; however, significant differences were found in dietary intakes of saturated fatty acid, polyunsaturated fatty acids, cholesterol, dietary fibre, simple sugars, sodium and potassium between the two groups (P<0·05)".
Asemi 2013b reported that "Based on 3‐d dietary records, no statistically significant difference was seen between the two groups in terms of energy and protein intake; however, significant differences were observed in dietary intakes of carbohydrates, fats, saturated fatty acids, polyunsaturated fatty acids, cholesterol, dietary fibre, simple sugar, fructose, arginine, sodium, potassium, magnesium, calcium, and vitamin C (P < 0.05 for all; ... These findings indicated that adherence to the prescribed diets was not perfect".
Asemi 2014 reported that "Based on the 3‐day dietary records that participants provided throughout the study, no statistically significant difference was seen between the two groups in terms of dietary intakes of energy; however, significant differences were found in dietary intakes of saturated fatty acids, polyunsaturated fatty acids, cholesterol, dietary fibre, simple sugar, sodium, potassium, magnesium, calcium and vitamin C between the two groups (P<0.05 for all...)".
The three trials did not report on the other secondary outcomes for the mother in the perinatal period.
Maternal outcomes: long term
The three trials did not report on any of the secondary outcomes for the mother in the long term.
Health services outcomes
The three trials did not report on any of the secondary outcomes relating to the use and costs of health services.
4. Low‐carbohydrate diet versus high‐carbohydrate diet
Two trials (Cypryk 2007; Moreno‐Castilla 2013) which randomised 182 women and their babies were included in this comparison.
Primary outcomes
Fetal/neonatal/childhood outcomes
Only one trial (Moreno‐Castilla 2013) reported on large‐for‐gestational age and perinatal mortality and did not find clear differences between the low‐carbohydrate and high‐carbohydrate diet groups for either outcome (large‐for‐gestational age: RR 0.51, 95% CI 0.13 to 1.95; 149 infants) (Analysis 4.1) (perinatal mortality: one stillbirth occurred in the low‐carbohydrate group: RR 3.00, 95% CI 0.12 to 72.49; 150 infants) (Analysis 4.2).
4.1. Analysis.
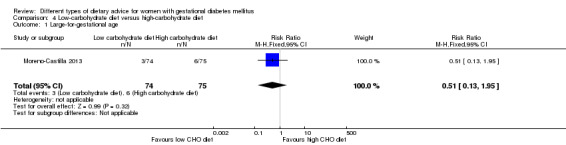
Comparison 4 Low‐carbohydrate diet versus high‐carbohydrate diet, Outcome 1 Large‐for‐gestational age.
4.2. Analysis.
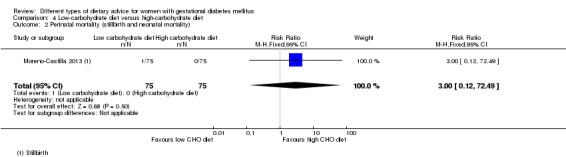
Comparison 4 Low‐carbohydrate diet versus high‐carbohydrate diet, Outcome 2 Perinatal mortality (stillbirth and neonatal mortality).
Neither trial reported on the other primary outcomes: neonatal mortality or morbidity composite; neurosensory disability.
Maternal outcomes
One trial (Moreno‐Castilla 2013) reported on hypertensive disorders of pregnancy (maternal hypertension) and did not show a clear difference between the low‐carbohydrate and high‐carbohydrate diet groups (RR 0.40, 95% CI 0.13 to 1.22; 150 women) (Analysis 4.3). Both trials reported on caesarean birth and did not show a clear difference in the risk between groups (RR 1.29, 95% CI 0.84 to 1.99; 179 women) (Analysis 4.4).
4.3. Analysis.
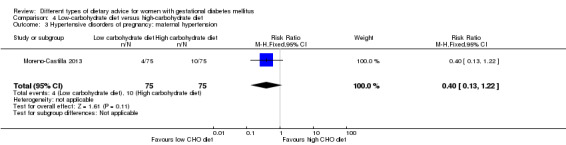
Comparison 4 Low‐carbohydrate diet versus high‐carbohydrate diet, Outcome 3 Hypertensive disorders of pregnancy: maternal hypertension.
4.4. Analysis.
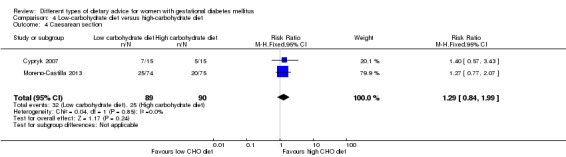
Comparison 4 Low‐carbohydrate diet versus high‐carbohydrate diet, Outcome 4 Caesarean section.
Neither trial reported on the other primary outcome: type 2 diabetes development.
Secondary outcomes
Fetal/neonatal outcomes
No clear differences between groups were shown for the following outcomes: stillbirth (RR 3.00, 95% CI 0.12 to 72.49; one trial, 150 infants) (Analysis 4.5); gestational age at birth (MD 0.10 weeks, 95% CI ‐0.42 to 0.62; two trials, 180 infants) (Analysis 4.6); macrosomia (RR 0.20, 95% CI 0.02 to 1.69; two trials, 179 infants) (Analysis 4.7); small‐for‐gestational age (RR 0.68, 95% CI 0.29 to 1.56; one trial, 149 infants) (Analysis 4.8); birthweight (MD 22.00 g, 95% CI ‐241.06 to 285.06; one trial, 30 infants) (Analysis 4.9); neonatal hypoglycaemia (RR 0.91, 95% CI 0.39 to 2.12; one trial, 149 infants) (Analysis 4.10).
4.5. Analysis.
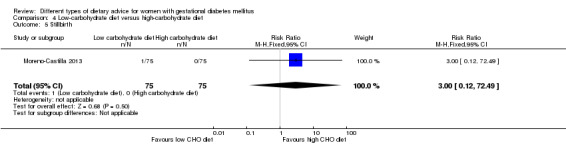
Comparison 4 Low‐carbohydrate diet versus high‐carbohydrate diet, Outcome 5 Stillbirth.
4.6. Analysis.
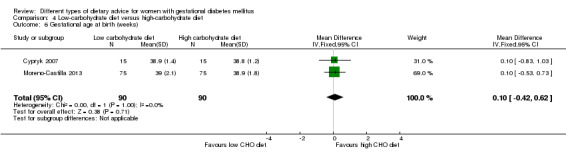
Comparison 4 Low‐carbohydrate diet versus high‐carbohydrate diet, Outcome 6 Gestational age at birth (weeks).
4.7. Analysis.
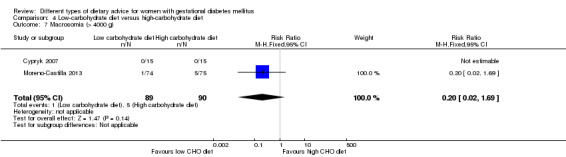
Comparison 4 Low‐carbohydrate diet versus high‐carbohydrate diet, Outcome 7 Macrosomia (> 4000 g).
4.8. Analysis.
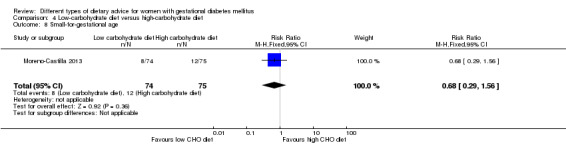
Comparison 4 Low‐carbohydrate diet versus high‐carbohydrate diet, Outcome 8 Small‐for‐gestational age.
4.9. Analysis.
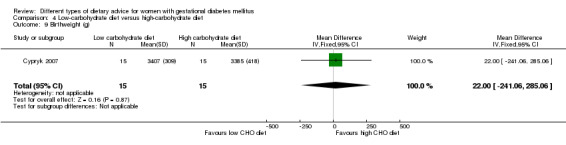
Comparison 4 Low‐carbohydrate diet versus high‐carbohydrate diet, Outcome 9 Birthweight (g).
4.10. Analysis.
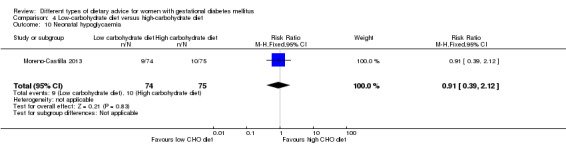
Comparison 4 Low‐carbohydrate diet versus high‐carbohydrate diet, Outcome 10 Neonatal hypoglycaemia.
The two trials did not report on the other secondary outcomes for the fetus/neonate.
Childhood outcomes
The two trials did not report on any of the secondary outcomes for the child.
Adulthood outcomes
The two trials did not report on any of the secondary outcomes for the child.
Maternal outcomes: perinatal
One trial (Cypryk 2007) reported on normal vaginal birth and operative vaginal birth and showed no clear differences between groups (RR 0.78, 95% CI 0.39 to 1.54; 30 women) (Analysis 4.11) (RR 1.00, 95% CI 0.07 to 14.55; 30 women) (Analysis 4.12). The other trial (Moreno‐Castilla 2013) reported on gestational weight gain (maternal weight gain during the intervention) and showed less weight gain for women in the low‐carbohydrate group compared with the high‐carbohydrate group (MD ‐0.90 kg, 95% CI ‐1.60 to ‐0.20; 145 women) (Analysis 4.13).
4.11. Analysis.
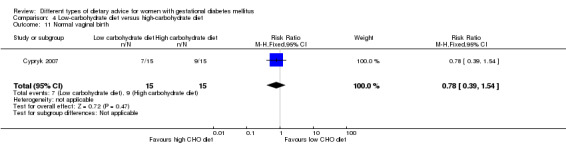
Comparison 4 Low‐carbohydrate diet versus high‐carbohydrate diet, Outcome 11 Normal vaginal birth.
4.12. Analysis.
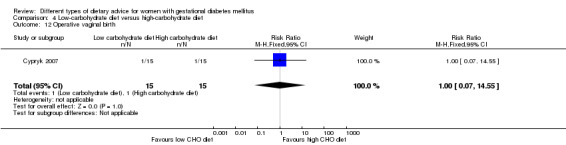
Comparison 4 Low‐carbohydrate diet versus high‐carbohydrate diet, Outcome 12 Operative vaginal birth.
4.13. Analysis.
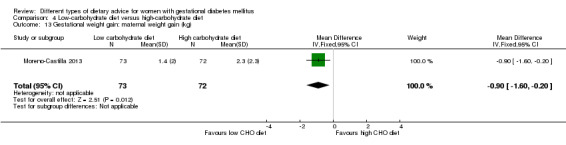
Comparison 4 Low‐carbohydrate diet versus high‐carbohydrate diet, Outcome 13 Gestational weight gain: maternal weight gain (kg).
Cypryk 2007 reported on 'physiological' (7/15 and 9/15) and 'other' births (1/15 and 1/15) for the low‐carbohydrate and high‐carbohydrate groups, however definitions were not clear and thus these data have not been included in meta‐analyses. Cypryk 2007 also reported that "The proper weight change was observed in all the patients studied. In four patients, who were overweight before the pregnancy, no increase or a small decrease in body weight was noticed. Due to the variety in pregnancy duration in the group studied this parameter was not analysed statistically;" similarly these data were not able to be included in a meta‐analysis.
In regards to adherence to the dietary intervention, in Cypryk 2007, there was no clear difference in the number of women who 'fully applied the recommended menu' (RR 1.09, 95% CI 0.73 to 1.62; 30 women) (Analysis 4.14). Moreno‐Castilla 2013 assessed adherence to the dietary intervention using two, three‐day food records; women's total carbohydrate and starch intake were reported to be significantly different between groups as per study protocol, however there was no clear difference in sugar intake between groups.
4.14. Analysis.
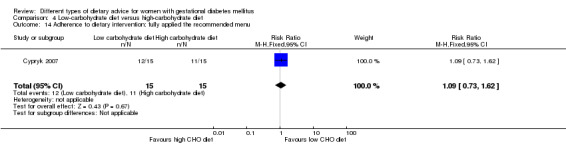
Comparison 4 Low‐carbohydrate diet versus high‐carbohydrate diet, Outcome 14 Adherence to dietary intervention: fully applied the recommended menu.
No clear differences were shown between groups in the use of additional pharmacotherapy (RR 1.02, 95% CI 0.77 to 1.37; 180 women) (Analysis 4.15) across the two trials, or for glycaemic control in one trial: end of intervention fasting blood glucose (MD 5.00 mg/dL, 95% CI ‐0.01 to 10.01; 30 women) (Analysis 4.16); end of intervention two‐hour post breakfast (MD 5.00 mg/dL, 95% CI ‐1.60 to 11.60; 30 women) (Analysis 4.17) post lunch (MD 3.00 mg/dL, 95% CI ‐2.77 to 8.77; 30 women) (Analysis 4.18) and post dinner (MD 6.00 mg/dL, 95% CI ‐1.47 to 13.47; 30 women) (Analysis 4.19) blood glucose.
4.15. Analysis.

Comparison 4 Low‐carbohydrate diet versus high‐carbohydrate diet, Outcome 15 Use of additional pharmacotherapy..
4.16. Analysis.
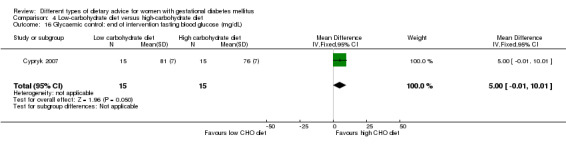
Comparison 4 Low‐carbohydrate diet versus high‐carbohydrate diet, Outcome 16 Glycaemic control: end of intervention fasting blood glucose (mg/dL).
4.17. Analysis.
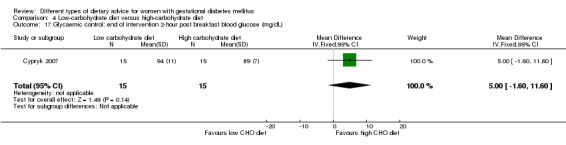
Comparison 4 Low‐carbohydrate diet versus high‐carbohydrate diet, Outcome 17 Glycaemic control: end of intervention 2‐hour post breakfast blood glucose (mg/dL).
4.18. Analysis.
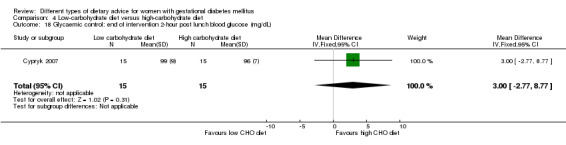
Comparison 4 Low‐carbohydrate diet versus high‐carbohydrate diet, Outcome 18 Glycaemic control: end of intervention 2‐hour post lunch blood glucose (mg/dL).
4.19. Analysis.
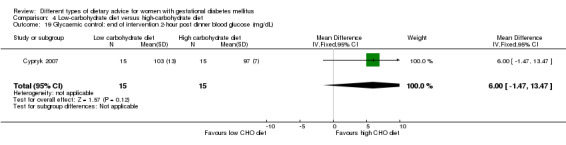
Comparison 4 Low‐carbohydrate diet versus high‐carbohydrate diet, Outcome 19 Glycaemic control: end of intervention 2‐hour post dinner blood glucose (mg/dL).
Cypryk 2007 additionally reported some information relating to women's views of the intervention "A clear majority of patients (25 out of 30) reported that is was easiest to accept and adjust to the number of meals in the course of the day and to follow the fruit‐vegetable supplements planned in the menu... ".
The two trials did not report on the other secondary outcomes for the mother in the perinatal period.
Maternal outcomes: long term
The two trials did not report on any of the secondary outcomes for the mother in the long term.
Health services outcomes
The two trials did not report on any of the secondary outcomes relating to the use and costs of health services.
5. High unsaturated fat diet versus low unsaturated fat diet with matching calories
Two trials (Lauszus 2001; Wang 2015) which randomised 111 women and their babies were included in this comparison. The author of Lauszus 2001 was contacted and contributed additional unpublished outcome data.
Primary outcomes
Fetal/neonatal/childhood outcomes
In Lauszus 2001 there was no clear difference in the risk of being born large‐for‐gestational age for babies born to mothers in the high unsaturated fat diet group versus the low unsaturated fat diet group (RR 0.54, 95% CI 0.21 to 1.37; 27 infants) (Analysis 5.1).
5.1. Analysis.
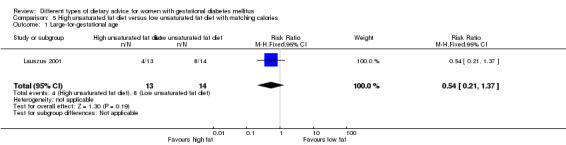
Comparison 5 High unsaturated fat diet versus low unsaturated fat diet with matching calories, Outcome 1 Large‐for‐gestational age.
The trials did not report on the other primary outcomes for the fetus/neonate/child: perinatal mortality; neonatal mortality or morbidity; neurosensory disability.
Maternal outcomes
There were no cases of pre‐eclampsia in Lauszus 2001 (Analysis 5.2), and no clear difference between the high unsaturated fat diet group and the low unsaturated fat diet group for the risks of hypertension in pregnancy (RR 0.54, 95% CI 0.06 to 5.26; 27 women) (Analysis 5.3) and caesarean section birth (RR 1.08, 95% CI 0.07 to 15.50; 27 women) (Analysis 5.4).
5.2. Analysis.
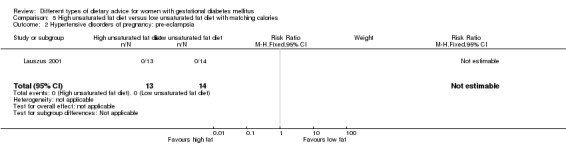
Comparison 5 High unsaturated fat diet versus low unsaturated fat diet with matching calories, Outcome 2 Hypertensive disorders of pregnancy: pre‐eclampsia.
5.3. Analysis.
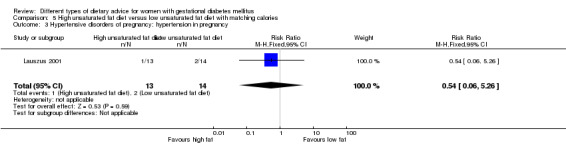
Comparison 5 High unsaturated fat diet versus low unsaturated fat diet with matching calories, Outcome 3 Hypertensive disorders of pregnancy: hypertension in pregnancy.
5.4. Analysis.
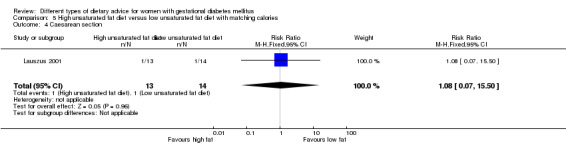
Comparison 5 High unsaturated fat diet versus low unsaturated fat diet with matching calories, Outcome 4 Caesarean section.
Lauszus 2001 reported on the diagnosis of diabetes at one to two weeks postpartum and four to 13 months postpartum, and did not find any clear differences between groups for these outcomes ('diabetic' on oral glucose tolerance test (OGTT) at one to two weeks: RR 2.00, 95% CI 0.45 to 8.94; 24 women) (Analysis 5.5) ('diabetic' on OGTT at four to 13 months: RR 1.00, 95% CI 0.10 to 9.61; six women) (Analysis 5.6).
5.5. Analysis.
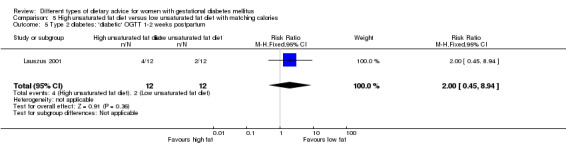
Comparison 5 High unsaturated fat diet versus low unsaturated fat diet with matching calories, Outcome 5 Type 2 diabetes: 'diabetic' OGTT 1‐2 weeks postpartum.
5.6. Analysis.
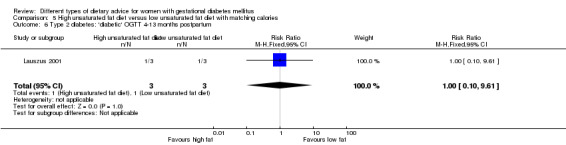
Comparison 5 High unsaturated fat diet versus low unsaturated fat diet with matching calories, Outcome 6 Type 2 diabetes: 'diabetic' OGTT 4‐13 months postpartum.
Secondary outcomes
Fetal/neonatal outcomes
In regards to gestational age at birth, no clear difference was observed between groups in Lauszus 2001 (MD 0.10 weeks, 95% CI ‐0.73 to 0.93; 27 infants). In Wang 2015, the mean gestational age at birth for the high unsaturated fat diet group was reported to be 39.8 (SD: 6.05) weeks, and 38.8 (SD: 1.05) weeks in the low unsaturated fat diet group, though no cases of preterm birth were reported in this trial. Due to uncertainty regarding the SD reported for the high unsaturated fat diet group in Wang 2015, we have chosen not to pool data from the two trials for this outcome (Analysis 5.7). As discussed, there were reported to be no cases of preterm birth in Wang 2015 (Analysis 5.8). No clear differences between groups were seen macrosomia (RR 0.53, 95% CI 0.18 to 1.56; two trials, 111 infants) (Analysis 5.9) and birthweight (MD ‐138.19 g, 95% CI ‐292.59 to 16.21; two trials, 111 infants) (Analysis 5.10).
5.7. Analysis.
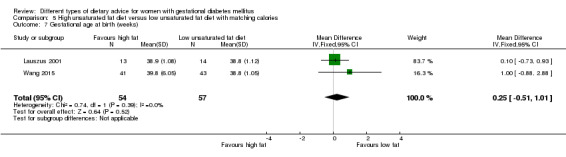
Comparison 5 High unsaturated fat diet versus low unsaturated fat diet with matching calories, Outcome 7 Gestational age at birth (weeks).
5.8. Analysis.
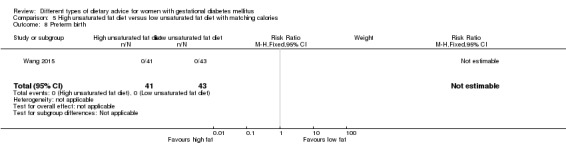
Comparison 5 High unsaturated fat diet versus low unsaturated fat diet with matching calories, Outcome 8 Preterm birth.
5.9. Analysis.
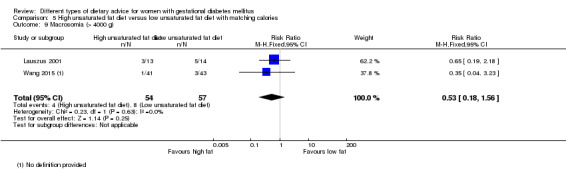
Comparison 5 High unsaturated fat diet versus low unsaturated fat diet with matching calories, Outcome 9 Macrosomia (> 4000 g).
5.10. Analysis.
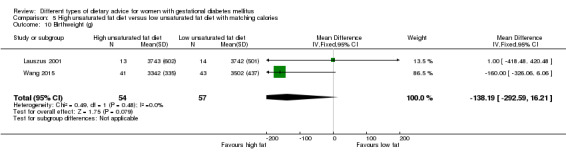
Comparison 5 High unsaturated fat diet versus low unsaturated fat diet with matching calories, Outcome 10 Birthweight (g).
The trials did not report on the other secondary outcomes for the fetus/neonate.
Childhood outcomes
Neither of the included trials reported on secondary outcomes for the child.
Adulthood outcomes
Neither of the included trials reported on secondary outcomes for the adult.
Maternal outcomes: perinatal
There were no cases of placental abruption in either group in Lauszus 2001. While in Wang 2015, there was no clear difference in gestational weight gain between groups (MD ‐1.98 kg, 95% CI ‐4.32 to 0.36; 84 women) (Analysis 5.12), in Lauszus 2001, women in the high unsaturated fat diet group had a higher BMI (MD 3.90 kg/m², 95% CI 2.41 to 5.39; 27 women) (Analysis 5.13) and higher weight at birth (MD 11.90 kg, 95% CI 7.47 to 16.33; 27 women) (Analysis 5.14) compared with women in the low unsaturated fat diet group. However, women in the high unsaturated fat diet group had a higher trial entry BMI (mean (SD): 35 (2.4) kg/m²) when compared with women in the low unsaturated fat diet group (mean (SD): 32.2 (1.5) kg/m²).
5.12. Analysis.
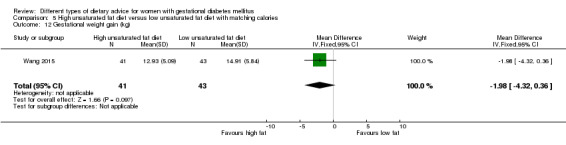
Comparison 5 High unsaturated fat diet versus low unsaturated fat diet with matching calories, Outcome 12 Gestational weight gain (kg).
5.13. Analysis.
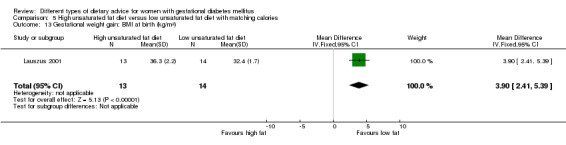
Comparison 5 High unsaturated fat diet versus low unsaturated fat diet with matching calories, Outcome 13 Gestational weight gain: BMI at birth (kg/m²).
5.14. Analysis.
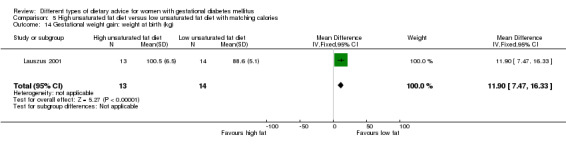
Comparison 5 High unsaturated fat diet versus low unsaturated fat diet with matching calories, Outcome 14 Gestational weight gain: weight at birth (kg).
In Lauszus 2001, women in the high unsaturated fat diet group had higher 38‐week insulin compared with women in the low unsaturated fat diet group (MD 4.40 mU/L, 95% CI 2.59 to 6.21; 24 women) (Analysis 5.15), however no clear difference in 38‐week insulin sensitivity was observed (MD ‐0.08 10‐5 min‐1 per mU/L min, 95% CI ‐0.21 to 0.05; 24 women) (Analysis 5.16); and in Wang 2015 there was no clear in intermediate acting insulin (IAI) at the end of the intervention (MD 0.04, 95% CI ‐0.28 to 0.36; 84 women) (Analysis 5.17).
5.15. Analysis.
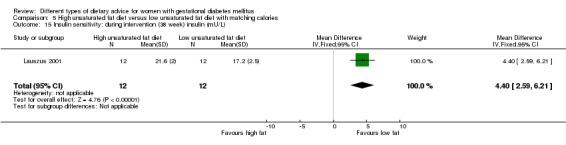
Comparison 5 High unsaturated fat diet versus low unsaturated fat diet with matching calories, Outcome 15 Insulin sensitivity: during intervention (38 week) insulin (mU/L).
5.16. Analysis.
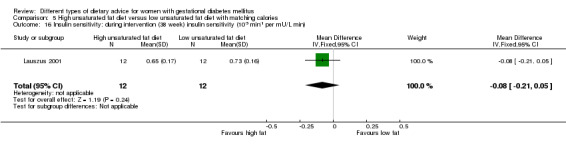
Comparison 5 High unsaturated fat diet versus low unsaturated fat diet with matching calories, Outcome 16 Insulin sensitivity: during intervention (38 week) insulin sensitivity (10‐5 min‐1 per mU/L min).
5.17. Analysis.
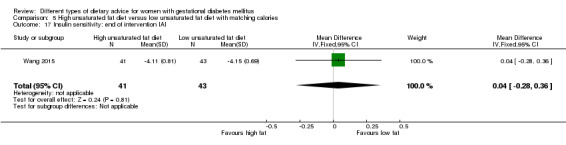
Comparison 5 High unsaturated fat diet versus low unsaturated fat diet with matching calories, Outcome 17 Insulin sensitivity: end of intervention IAI.
In both trials, there was no use of additional pharmacotherapy in either group (Analysis 5.18). In regards to glycaemic control, in Lauszus 2001, women in the high unsaturated fat diet group had higher during intervention (38‐week) fasting blood glucose (MD 0.50 mmol/L, 95% CI 0.30 to 0.70; 24 women) (Analysis 5.19), postprandial glucose (MD 0.90 mmol/L, 95% CI 0.58 to 1.22; 25 women) (Analysis 5.20) and HbA1c (MD 0.40 %, 95% CI 0.32 to 0.48; 25 women) (Analysis 5.21) compared with women in the low unsaturated fat diet group. In Wang 2015, there were no clear differences between groups in end of intervention fasting blood glucose (MD 0.18 mmol/L, 95% CI ‐0.17 to 0.53; 84 women) (Analysis 5.22) and two‐hour postprandial blood glucose (MD ‐0.02 mmol/L, 95% CI ‐0.29 to 0.25; 84 women) (Analysis 5.23).
5.18. Analysis.

Comparison 5 High unsaturated fat diet versus low unsaturated fat diet with matching calories, Outcome 18 Use of additional pharmacotherapy.
5.19. Analysis.
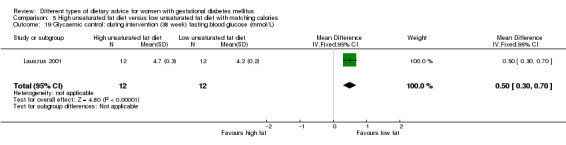
Comparison 5 High unsaturated fat diet versus low unsaturated fat diet with matching calories, Outcome 19 Glycaemic control: during intervention (38 week) fasting blood glucose (mmol/L).
5.20. Analysis.
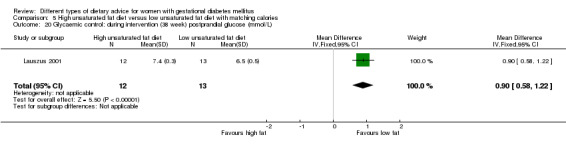
Comparison 5 High unsaturated fat diet versus low unsaturated fat diet with matching calories, Outcome 20 Glycaemic control: during intervention (38 week) postprandial glucose (mmol/L).
5.21. Analysis.
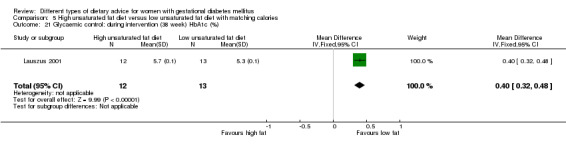
Comparison 5 High unsaturated fat diet versus low unsaturated fat diet with matching calories, Outcome 21 Glycaemic control: during intervention (38 week) HbA1c (%).
5.22. Analysis.
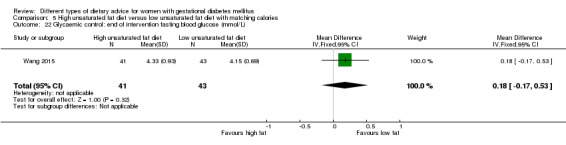
Comparison 5 High unsaturated fat diet versus low unsaturated fat diet with matching calories, Outcome 22 Glycaemic control: end of intervention fasting blood glucose (mmol/L).
5.23. Analysis.
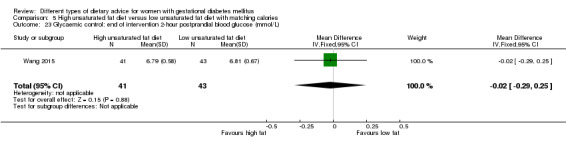
Comparison 5 High unsaturated fat diet versus low unsaturated fat diet with matching calories, Outcome 23 Glycaemic control: end of intervention 2‐hour postprandial blood glucose (mmol/L).
In regards to adherence, Lauszus 2001 reported that "The two groups… reported different intake at in MUFA, fat and carbohydrate in week 37… The H‐MUFA group increased their MUFA and total fat intake and consequently their carbohydrate and protein intake decreased" and "Compliance to the diet was confirmed as the percentage of MUFA increased in the blood samples drawn". Wang 2015 reported that "Post‐intervention… Fat, SFA, monounsaturated fatty acids (MUFA), and PUFA were significantly higher in the experimental group than the control group, while the carbohydrate intake was significantly lower in the experimental group than the control group (p<0.001)".
The trials did not report on the other secondary outcomes for the mother in the perinatal period.
Maternal outcomes: long term
In Lauszus 2001, women in the higher unsaturated fat diet group had on average, a higher BMI at five to nine months postpartum (MD 4.10 kg/m², 95% CI 2.34 to 5.86; 27 women) (Analysis 5.24) compared with women in the low unsaturated fat diet group. There were no clear differences between groups in Lauszus 2001 for impaired glucose: 'borderline' OGTT at one to two weeks postpartum (RR 1.50, 95% CI 0.30 to 7.43; 24 women) (Analysis 5.25) or four to 13 months postpartum (RR 0.27, 95% CI 0.01 to 4.93; seven women) (Analysis 5.26).
5.24. Analysis.
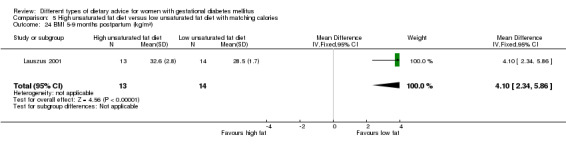
Comparison 5 High unsaturated fat diet versus low unsaturated fat diet with matching calories, Outcome 24 BMI 5‐9 months postpartum (kg/m²).
5.25. Analysis.
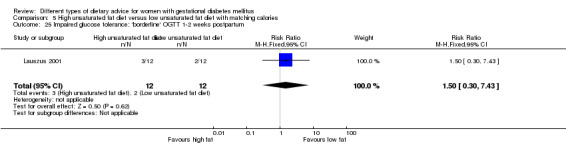
Comparison 5 High unsaturated fat diet versus low unsaturated fat diet with matching calories, Outcome 25 Impaired glucose tolerance: 'borderline' OGTT 1‐2 weeks postpartum.
5.26. Analysis.
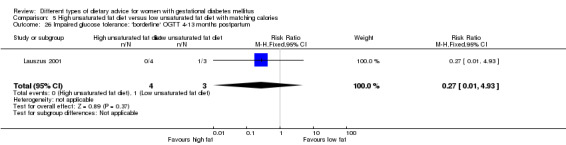
Comparison 5 High unsaturated fat diet versus low unsaturated fat diet with matching calories, Outcome 26 Impaired glucose tolerance: 'borderline' OGTT 4‐13 months postpartum.
The trials did not report on the other secondary outcomes for the mother in the long term.
Health services outcomes
Neither of the included trials reported on secondary outcomes relating to the use or costs of health services.
6. Low‐GI diet versus high‐fibre moderate‐GI diet
One trial (Louie 2011) which randomised 99 women and their babies was included in this comparison. Authors were contacted for unpublished outcome data and the full report before the publication of this trial (Louie 2011).
Primary outcomes
Fetal/neonatal/childhood outcomes
No clear difference between the low‐GI and high‐fibre moderate‐GI groups was shown in the risk of being born large‐for‐gestational age (RR 2.87, 95% CI 0.61 to 13.50; 92 infants) (Analysis 6.1). Louie 2011 did not report on the other primary outcomes for the fetus/neonate/child: perinatal mortality; neonatal mortality or morbidity composite; neurosensory disability.
6.1. Analysis.
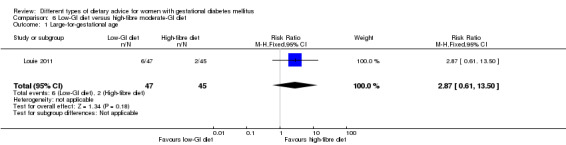
Comparison 6 Low‐GI diet versus high‐fibre moderate‐GI diet, Outcome 1 Large‐for‐gestational age.
Maternal outcomes
No clear differences between the low‐GI and high‐fibre moderate‐GI groups were shown for the risks of caesarean section (RR 1.91, 95% CI 0.91 to 4.03; 92 women) (Analysis 6.2), and type 2 diabetes development at three months postpartum (RR 0.76, 95% CI 0.11 to 5.01; 58 women) (Analysis 6.3).
6.2. Analysis.
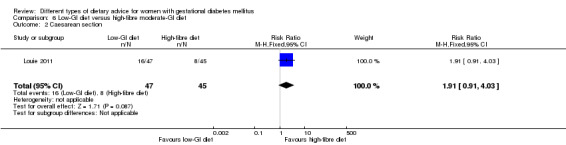
Comparison 6 Low‐GI diet versus high‐fibre moderate‐GI diet, Outcome 2 Caesarean section.
6.3. Analysis.
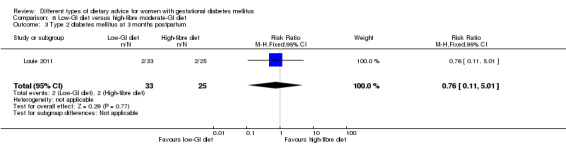
Comparison 6 Low‐GI diet versus high‐fibre moderate‐GI diet, Outcome 3 Type 2 diabetes mellitus at 3 months postpartum.
Louie 2011 did not report on the other primary outcome for the mother: hypertensive disorders of pregnancy.
Secondary outcomes
Fetal/neonatal outcomes
No clear differences between groups were shown for any of the secondary fetal/neonatal outcomes reported, including: gestational age at birth (MD ‐0.10 weeks, 95% CI ‐0.39 to 0.19; 92 infants) (Analysis 6.4); preterm birth (RR 0.96, 95% CI 0.14 to 6.53; 96 infants) (Analysis 6.5); macrosomia (RR 0.32, 95% CI 0.03 to 2.96; 92 infants) (Analysis 6.6); small‐for‐gestational age (RR 1.20, 95% CI 0.34 to 4.18; 92 infants) (Analysis 6.7); birthweight (MD 0.00 g, 95% CI ‐277.18 to 277.18; 92 infants) (Analysis 6.8); head circumference at birth (MD ‐0.20 cm, 95% CI ‐0.91 to 0.51; 82 infants) (Analysis 6.9); length at birth (MD 0.00 cm, 95% CI ‐0.83 to 0.83; 92 infants) (Analysis 6.10); and ponderal index at birth (MD 0.20 kg/m³, 95% CI ‐0.79 to 1.19; 92 infants) (Analysis 6.11).
6.4. Analysis.
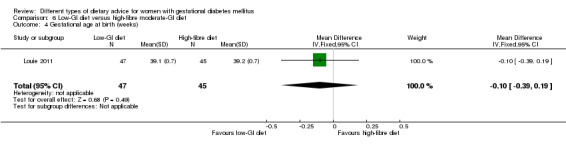
Comparison 6 Low‐GI diet versus high‐fibre moderate‐GI diet, Outcome 4 Gestational age at birth (weeks).
6.5. Analysis.
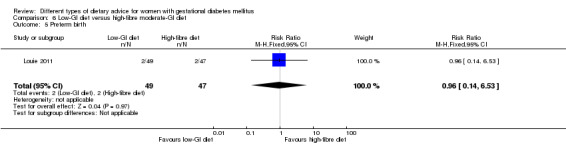
Comparison 6 Low‐GI diet versus high‐fibre moderate‐GI diet, Outcome 5 Preterm birth.
6.6. Analysis.
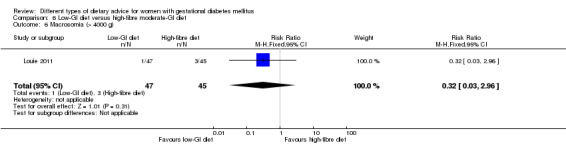
Comparison 6 Low‐GI diet versus high‐fibre moderate‐GI diet, Outcome 6 Macrosomia (> 4000 g).
6.7. Analysis.
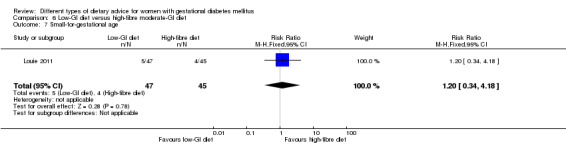
Comparison 6 Low‐GI diet versus high‐fibre moderate‐GI diet, Outcome 7 Small‐for‐gestational age.
6.8. Analysis.
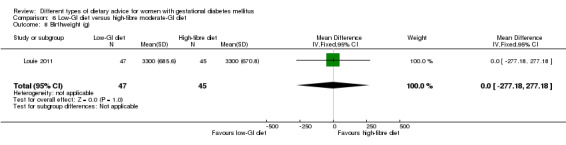
Comparison 6 Low‐GI diet versus high‐fibre moderate‐GI diet, Outcome 8 Birthweight (g).
6.9. Analysis.
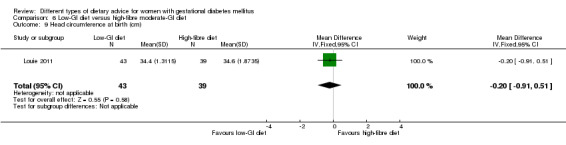
Comparison 6 Low‐GI diet versus high‐fibre moderate‐GI diet, Outcome 9 Head circumference at birth (cm).
6.10. Analysis.
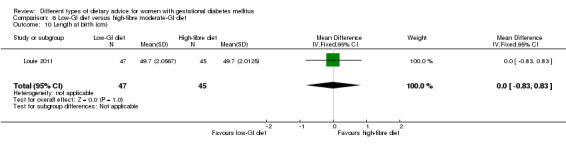
Comparison 6 Low‐GI diet versus high‐fibre moderate‐GI diet, Outcome 10 Length at birth (cm).
6.11. Analysis.
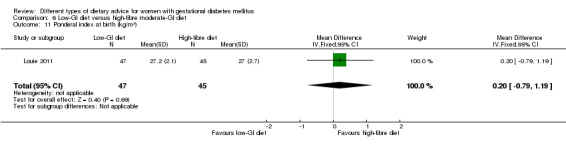
Comparison 6 Low‐GI diet versus high‐fibre moderate‐GI diet, Outcome 11 Ponderal index at birth (kg/m³).
Louie 2011 did not report on the other secondary outcomes for the fetus/neonate.
Childhood outcomes
Louie 2011 reported on child weight and height at three months postpartum: weight for age percentile; length for age percentile; and weight for length percentile (all adjusted for breastfeeding status), and showed no clear differences between groups (Analysis 6.12).
6.12. Analysis.
Comparison 6 Low‐GI diet versus high‐fibre moderate‐GI diet, Outcome 12 Weight and height at 3 months postpartum.
| Weight and height at 3 months postpartum | |||
|---|---|---|---|
| Study | Low‐GI diet (N =31) | High‐fibre moderate‐GI diet (N =21) | P value |
| Weight for age percentile (adjusted for breastfeeding status) | |||
| Louie 2011 | Mean (95% CI): 69.6 (60.5–78.8) | Mean (95% CI): 68.0 (56.9–79.1) | 0.720 |
| Length for age percentile (adjusted for breastfeeding status) | |||
| Louie 2011 | Mean (95% CI): 47.9 (38.6–57.2) | Mean (95% CI): 48.1 (36.9–59.3) | 0.977 |
| Weight for length percentile (adjusted for breastfeeding status) | |||
| Louie 2011 | Mean (95% CI): 72.4 (61.2–83.6) | Mean (95% CI): 64.6 (51.0–78.1) | 0.511 |
Louie 2011 did not report on the other secondary outcomes for the child.
Adulthood outcomes
Louie 2011 did not report on any of the secondary outcomes for the adult.
Maternal outcomes: perinatal
No clear differences between groups were shown for weight gain during pregnancy (MD ‐1.20 kg, 95% CI ‐3.43 to 1.03; 87 women) (Analysis 6.13); adherence to the dietary intervention (women who 'fully applied the recommended menu' assessed by a 24‐hour recall when women were attending their dietitian appointments) (RR 0.84, 95% CI 0.64 to 1.11; 92 women) (Analysis 6.14); insulin sensitivity: end of intervention HOMA2‐IR (MD ‐0.10, 95% CI ‐0.38 to 0.18; 77 women) (Analysis 6.15); end of intervention insulin (MD 10.80 pmol/L, 95% CI ‐22.36 to 43.96; 70 women) (Analysis 6.16); use of additional pharmacotherapy (RR 0.83, 95% CI 0.58 to 1.17; 92 women) (Analysis 6.17); glycaemic control: end of intervention blood glucose (MD ‐0.10 mmol/L, 95% CI ‐0.38 to 0.18; 74 women) (Analysis 6.18); or end of intervention HbA1c (%) (the SEM for the high‐fibre moderate‐GI diet group was reported to be 0.0, and thus these data have been presented in an 'other data' table) (Analysis 6.19).
6.13. Analysis.
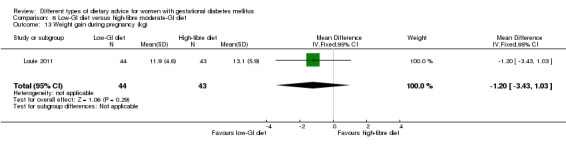
Comparison 6 Low‐GI diet versus high‐fibre moderate‐GI diet, Outcome 13 Weight gain during pregnancy (kg).
6.14. Analysis.
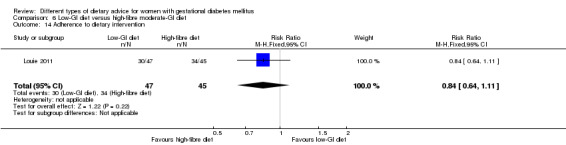
Comparison 6 Low‐GI diet versus high‐fibre moderate‐GI diet, Outcome 14 Adherence to dietary intervention.
6.15. Analysis.
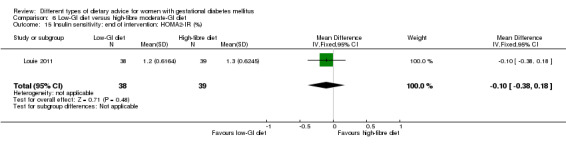
Comparison 6 Low‐GI diet versus high‐fibre moderate‐GI diet, Outcome 15 Insulin sensitivity: end of intervention: HOMA2‐IR (%).
6.16. Analysis.
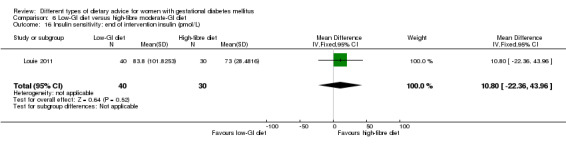
Comparison 6 Low‐GI diet versus high‐fibre moderate‐GI diet, Outcome 16 Insulin sensitivity: end of intervention insulin (pmol/L).
6.17. Analysis.
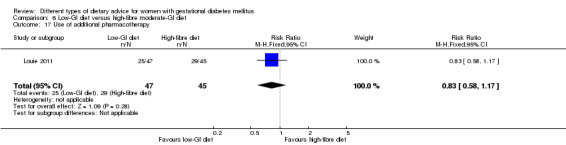
Comparison 6 Low‐GI diet versus high‐fibre moderate‐GI diet, Outcome 17 Use of additional pharmacotherapy.
6.18. Analysis.
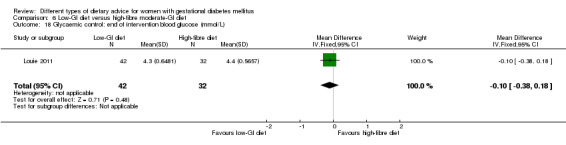
Comparison 6 Low‐GI diet versus high‐fibre moderate‐GI diet, Outcome 18 Glycaemic control: end of intervention blood glucose (mmol/L).
6.19. Analysis.
Comparison 6 Low‐GI diet versus high‐fibre moderate‐GI diet, Outcome 19 Glycaemic control: end of intervention HbA1c (%).
| Glycaemic control: end of intervention HbA1c (%) | |||
|---|---|---|---|
| Study | Low‐GI diet (N =43) | High‐fibre moderate‐GI diet (N =41) | P value |
| Louie 2011 | Mean (SEM): 5.5 (0.1) | Mean (SEM): 5.5 (0.0) | 0.665 |
Also in regards to adherence to the dietary intervention, Louie 2011 reported that "At the end of the intervention (36–37 weeks' gestation), the diets were matched for macro‐ and micronutrients, but the LGI group had a significantly lower GI and GL than the HF group as per protocol (both P,0.001)".
Louie 2011 did not report on the other secondary outcomes for the mother in the perinatal period.
Maternal outcomes: long term
There were no clear differences between groups, at three months postpartum, in the number of women who had returned to within 1 kg of their pre‐pregnancy weight (RR 1.15, 95% CI 0.43 to 3.07; 55 women) (Analysis 6.20); maternal BMI (MD ‐0.50 kg/m², 95% CI ‐2.79 to 1.79; 52 women) (Analysis 6.21); the number of women with impaired glucose tolerance (RR 1.33, 95% CI 0.44 to 4.04; 58 women) (Analysis 6.22); or insulin sensitivity: insulin (MD ‐14.20 pmol/L, 95% CI ‐32.58 to 4.18; 55 women) (Analysis 6.23) or (HOMA‐IR) (MD ‐0.30, 95% CI ‐0.66 to 0.06; 53 women) (Analysis 6.24).
6.20. Analysis.
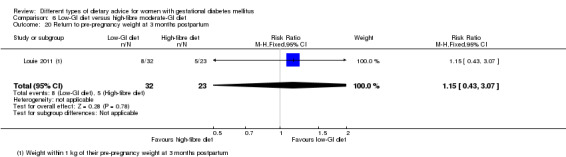
Comparison 6 Low‐GI diet versus high‐fibre moderate‐GI diet, Outcome 20 Return to pre‐pregnancy weight at 3 months postpartum.
6.21. Analysis.
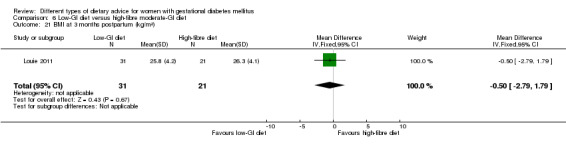
Comparison 6 Low‐GI diet versus high‐fibre moderate‐GI diet, Outcome 21 BMI at 3 months postpartum (kg/m²).
6.22. Analysis.
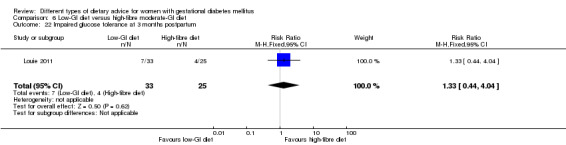
Comparison 6 Low‐GI diet versus high‐fibre moderate‐GI diet, Outcome 22 Impaired glucose tolerance at 3 months postpartum.
6.23. Analysis.
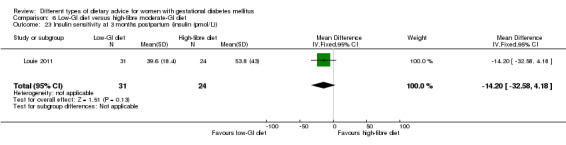
Comparison 6 Low‐GI diet versus high‐fibre moderate‐GI diet, Outcome 23 Insulin sensitivity at 3 months postpartum (insulin (pmol/L)).
6.24. Analysis.
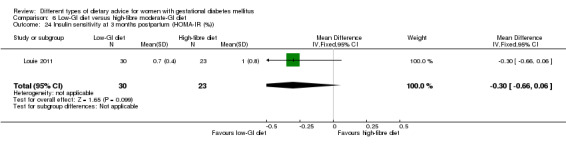
Comparison 6 Low‐GI diet versus high‐fibre moderate‐GI diet, Outcome 24 Insulin sensitivity at 3 months postpartum (HOMA‐IR (%)).
Louie 2011 did not report on the mother long‐term outcomes for the mother.
Health services outcomes
Louie 2011 did not report on any of the secondary outcomes relating to the use and costs of health services.
7. Diet recommendation plus diet‐related behavioural advice versus diet recommendation only
One trial (Bo 2014) which randomised 99 women and their babies was included in this comparison.
Primary outcomes
Fetal/neonatal/childhood outcomes
In Bo 2014, no clear difference was shown between the groups receiving diet recommendations plus diet‐related behavioural advice versus diet recommendations only for the outcome large‐for‐gestational age (RR 0.73, 95% CI 0.25 to 2.14; 99 infants) (Analysis 7.1).
7.1. Analysis.
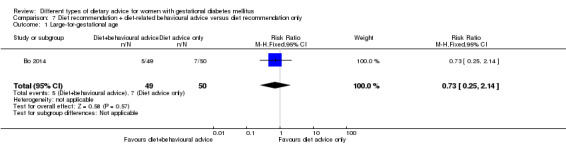
Comparison 7 Diet recommendation + diet‐related behavioural advice versus diet recommendation only, Outcome 1 Large‐for‐gestational age.
Bo 2014 did not report on the other primary outcomes for the fetus/neonate/child: perinatal mortality; mortality and morbidity composite; neurosensory disability.
Maternal outcomes
In Bo 2014, no clear difference was shown between groups for the risk of caesarean section (RR 0.78, 95% CI 0.38 to 1.62; 99 women) (Analysis 7.2).
7.2. Analysis.
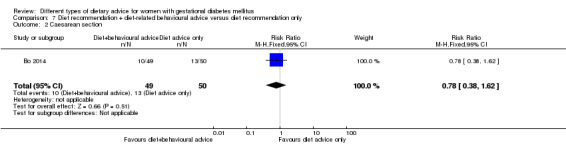
Comparison 7 Diet recommendation + diet‐related behavioural advice versus diet recommendation only, Outcome 2 Caesarean section.
Bo 2014 did not report on the other primary maternal outcomes: hypertensive disorders of pregnancy; type 2 diabetes development.
Secondary outcomes
Fetal/neonatal outcomes
No clear difference between groups in Bo 2014 was shown for the risk of preterm birth (RR 0.51, 95% CI 0.10 to 2.66; 99 infants) (Analysis 7.3).
7.3. Analysis.
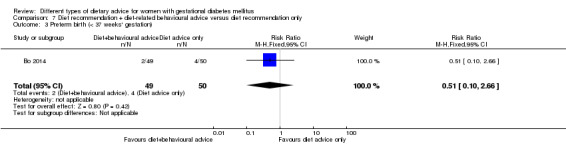
Comparison 7 Diet recommendation + diet‐related behavioural advice versus diet recommendation only, Outcome 3 Preterm birth (< 37 weeks' gestation).
Bo 2014 did not report on the other secondary outcomes for the fetus/neonate.
Childhood outcomes
Bo 2014 did not report on any secondary outcomes for the child.
Adulthood outcomes
Bo 2014 did not report on any secondary outcomes for the adult.
Maternal outcomes: perinatal
In Bo 2014, no clear differences were shown between groups for gestational weight gain: BMI at the end of the intervention (MD 0.00 kg/m², 95% CI ‐1.75 to 1.75; 99 women) (Analysis 7.4); weight at the end of the intervention (MD ‐0.10 kg, 95% CI ‐4.91 to 4.71; 99 women) (Analysis 7.5); insulin sensitivity: end of intervention HOMA‐IR (MD ‐0.30, 95% CI ‐0.77 to 0.17; 99 women) (Analysis 7.6); end of intervention fasting insulin (MD ‐0.50 µU/mL, 95% CI ‐2.69 to 1.69; 99 women) (Analysis 7.7); use of additional pharmacotherapy (RR 0.61, 95% CI 0.15 to 2.42; 99 women) (Analysis 7.8); glycaemic control: end of intervention fasting glucose (MD 0.00 mg/dL, 95% CI ‐4.25 to 4.25; 99 women) (Analysis 7.9); and end of intervention HbA1c (MD ‐0.10%, 95% CI ‐0.28 to 0.08; 99 women) (Analysis 7.11). Also in regards to glycaemic control, women in the group receiving the additional diet‐related behavioural advice had lower end of intervention postprandial glucose (MD ‐9.30 mg/dL, 95% CI ‐15.58 to ‐3.02; 99 women) (Analysis 7.10).
7.4. Analysis.
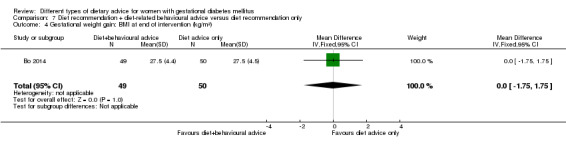
Comparison 7 Diet recommendation + diet‐related behavioural advice versus diet recommendation only, Outcome 4 Gestational weight gain: BMI at end of intervention (kg/m²).
7.5. Analysis.
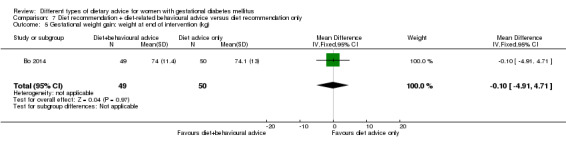
Comparison 7 Diet recommendation + diet‐related behavioural advice versus diet recommendation only, Outcome 5 Gestational weight gain: weight at end of intervention (kg).
7.6. Analysis.
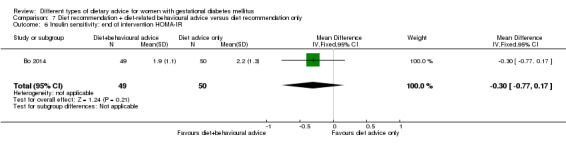
Comparison 7 Diet recommendation + diet‐related behavioural advice versus diet recommendation only, Outcome 6 Insulin sensitivity: end of intervention HOMA‐IR.
7.7. Analysis.
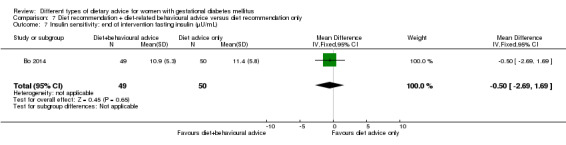
Comparison 7 Diet recommendation + diet‐related behavioural advice versus diet recommendation only, Outcome 7 Insulin sensitivity: end of intervention fasting insulin (µU/mL).
7.8. Analysis.
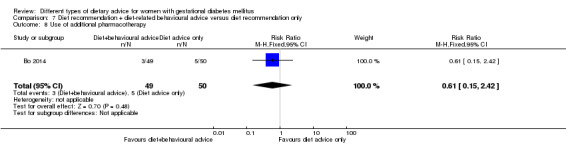
Comparison 7 Diet recommendation + diet‐related behavioural advice versus diet recommendation only, Outcome 8 Use of additional pharmacotherapy.
7.9. Analysis.
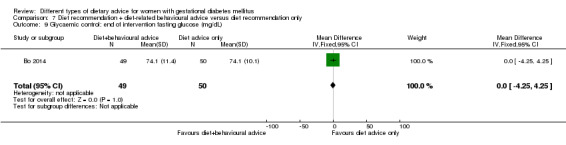
Comparison 7 Diet recommendation + diet‐related behavioural advice versus diet recommendation only, Outcome 9 Glycaemic control: end of intervention fasting glucose (mg/dL).
7.11. Analysis.
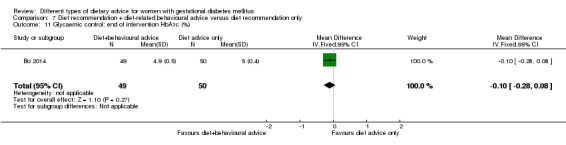
Comparison 7 Diet recommendation + diet‐related behavioural advice versus diet recommendation only, Outcome 11 Glycaemic control: end of intervention HbA1c (%).
7.10. Analysis.
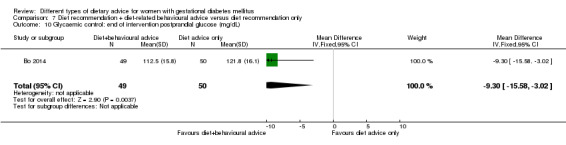
Comparison 7 Diet recommendation + diet‐related behavioural advice versus diet recommendation only, Outcome 10 Glycaemic control: end of intervention postprandial glucose (mg/dL).
In relation to adherence, Bo 2014 reported "The dietary pattern improved in all groups: total energy intake, total fat, saturated fat, and sodium decreased, alcohol was abolished, and protein and fibre intake increased (all p‐values <0.01). Adherence to nutritional recommendations did not differ among groups".
Bo 2014 did not report on the other secondary outcomes for the mother in the perinatal period.
Maternal outcomes: long term
Bo 2014 did not report on any secondary outcomes for the mother in the long term.
Health services outcomes
In Bo 2014, there was no clear difference between groups in the number of babies who had a postpartum stay of more than four days (RR 1.33, 95% CI 0.73 to 2.44; 99 infants) (Analysis 7.12).
7.12. Analysis.
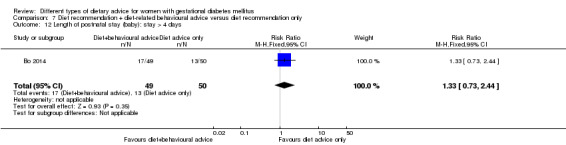
Comparison 7 Diet recommendation + diet‐related behavioural advice versus diet recommendation only, Outcome 12 Length of postnatal stay (baby): stay > 4 days.
Bo 2014 did not report on the other secondary outcomes relating to the use and costs of health services.
8. Soy protein‐enriched diet versus no soy protein diet
One trial (Jamilian 2015) which randomised 68 women and their babies was included in this comparison.
Primary outcomes
Fetal/neonatal/childhood outcomes
Jamilian 2015 did not report on any of the primary outcomes for the fetus/neonate/child.
Maternal outcomes
In Jamilian 2015, no clear differences between the soy protein‐enriched and no soy protein‐enriched diet groups were shown for the outcomes: hypertensive disorders of pregnancy (pre‐eclampsia) (RR 2.00, 95% CI 0.19 to 21.03; 68 women) (Analysis 8.1), or caesarean section (RR 1.00, 95% CI 0.57 to 1.77; 68 women) (Analysis 8.2).
8.1. Analysis.
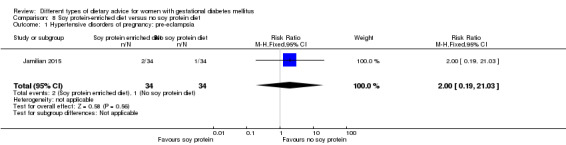
Comparison 8 Soy protein‐enriched diet versus no soy protein diet, Outcome 1 Hypertensive disorders of pregnancy: pre‐eclampsia.
8.2. Analysis.
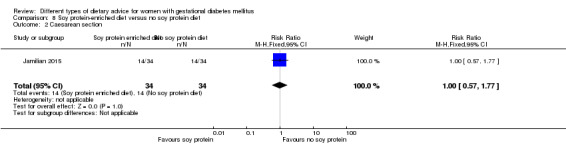
Comparison 8 Soy protein‐enriched diet versus no soy protein diet, Outcome 2 Caesarean section.
Jamilian 2015 did not report on the other primary outcome for the mother: type 2 diabetes development.
Secondary outcomes
Fetal/neonatal outcomes
No clear differences between groups were seen in Jamilian 2015 for the outcomes: gestational age at birth (MD 0.40 weeks, 95% CI ‐0.23 to 1.03; 68 infants) (Analysis 8.3); preterm birth (RR 2.00, 95% CI 0.19 to 21.03; 68 infants) (Analysis 8.4); macrosomia (RR 0.60, 95% CI 0.16 to 2.31; 68 infants) (Analysis 8.5); birthweight (MD ‐142.60 g, 95% CI ‐360.40 to 75.20; 68 infants) (Analysis 8.6); head circumference at birth (MD ‐0.20 cm, 95% CI ‐1.01 to 0.61; 68 infants) (Analysis 8.7); length at birth (MD ‐0.10 cm, 95% CI ‐1.07 to 0.87; 68 infants) (Analysis 8.8); and neonatal hypoglycaemia (RR 3.00, 95% CI 0.33 to 27.42; 68 infants) (Analysis 8.9). Fewer babies born to mothers in the soy protein‐enriched diet group versus the no soy protein‐enriched diet group developed neonatal hyperbilirubinaemia (RR 0.27, 95% CI 0.08 to 0.89; 68 infants) (Analysis 8.10).
8.3. Analysis.
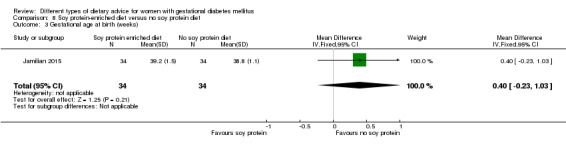
Comparison 8 Soy protein‐enriched diet versus no soy protein diet, Outcome 3 Gestational age at birth (weeks).
8.4. Analysis.
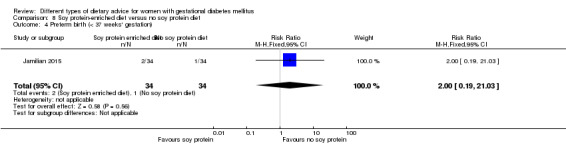
Comparison 8 Soy protein‐enriched diet versus no soy protein diet, Outcome 4 Preterm birth (< 37 weeks' gestation).
8.5. Analysis.
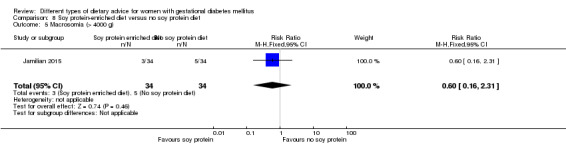
Comparison 8 Soy protein‐enriched diet versus no soy protein diet, Outcome 5 Macrosomia (> 4000 g).
8.6. Analysis.
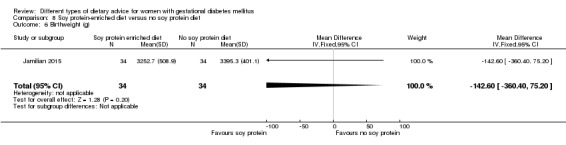
Comparison 8 Soy protein‐enriched diet versus no soy protein diet, Outcome 6 Birthweight (g).
8.7. Analysis.
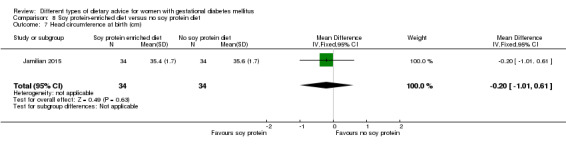
Comparison 8 Soy protein‐enriched diet versus no soy protein diet, Outcome 7 Head circumference at birth (cm).
8.8. Analysis.
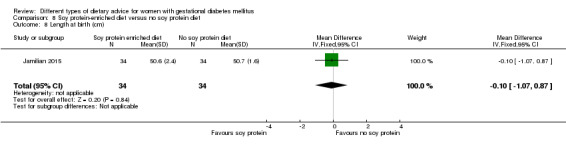
Comparison 8 Soy protein‐enriched diet versus no soy protein diet, Outcome 8 Length at birth (cm).
8.9. Analysis.
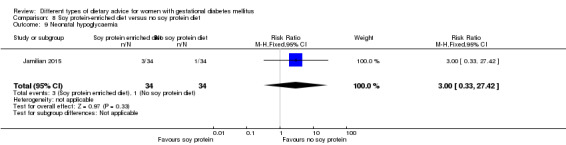
Comparison 8 Soy protein‐enriched diet versus no soy protein diet, Outcome 9 Neonatal hypoglycaemia.
8.10. Analysis.
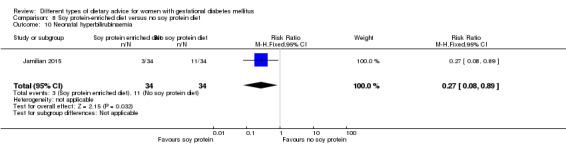
Comparison 8 Soy protein‐enriched diet versus no soy protein diet, Outcome 10 Neonatal hyperbilirubinaemia.
Jamilian 2015 did not report on the other secondary outcomes for the fetus/neonate.
Childhood outcomes
Jamilian 2015 did not report on any secondary outcomes for the child.
Adulthood outcomes
Jamilian 2015 did not report on any secondary outcomes for the adult.
Maternal outcomes: perinatal
No clear differences between groups were seen in Jamilian 2015 for the outcomes: gestational weight gain: BMI at the end of the intervention (MD 0.60 kg/m², 95% CI ‐1.43 to 2.63; 68 women) (Analysis 8.11); weight at the end of the intervention (MD 3.50 kg, 95% CI ‐1.47 to 8.47; 68 women) (Analysis 8.12); insulin sensitivity: end of intervention HOMA‐IR (MD ‐1.00, 95% CI ‐2.20 to 0.20; 68 women) (Analysis 8.13); end of intervention QUICKI (MD 0.00, 95% CI ‐0.01 to 0.01; 68 women) (Analysis 8.14); end of intervention insulin (MD ‐2.60 µIU/mL, 95% CI ‐8.03 to 2.83; 68 women) (Analysis 8.15); or the use of additional pharmacotherapy (RR 1.00, 95% CI 0.15 to 6.70; 68 women) (Analysis 8.16). In regards to glycaemic control, women in the soy protein‐enriched diet group versus the no soy protein‐enriched diet group had lower end of intervention fasting plasma glucose (MD ‐10.60 mg/dL, 95% CI ‐15.37 to ‐5.83; 68 women) (Analysis 8.17).
8.11. Analysis.
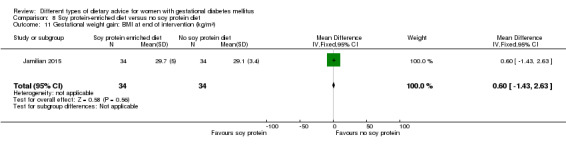
Comparison 8 Soy protein‐enriched diet versus no soy protein diet, Outcome 11 Gestational weight gain: BMI at end of intervention (kg/m²).
8.12. Analysis.
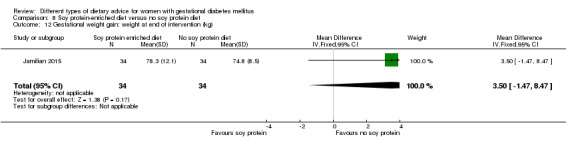
Comparison 8 Soy protein‐enriched diet versus no soy protein diet, Outcome 12 Gestational weight gain: weight at end of intervention (kg).
8.13. Analysis.
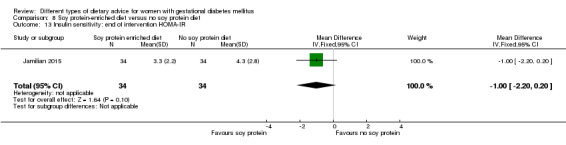
Comparison 8 Soy protein‐enriched diet versus no soy protein diet, Outcome 13 Insulin sensitivity: end of intervention HOMA‐IR.
8.14. Analysis.
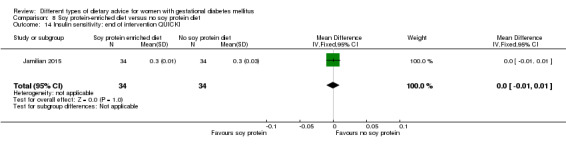
Comparison 8 Soy protein‐enriched diet versus no soy protein diet, Outcome 14 Insulin sensitivity: end of intervention QUICKI.
8.15. Analysis.
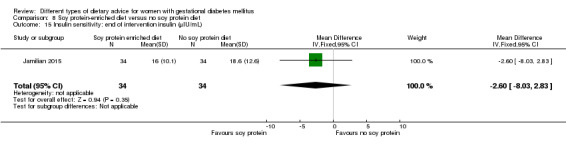
Comparison 8 Soy protein‐enriched diet versus no soy protein diet, Outcome 15 Insulin sensitivity: end of intervention insulin (µIU/mL).
8.16. Analysis.
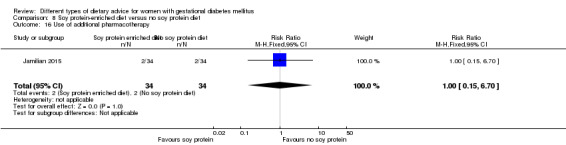
Comparison 8 Soy protein‐enriched diet versus no soy protein diet, Outcome 16 Use of additional pharmacotherapy.
8.17. Analysis.
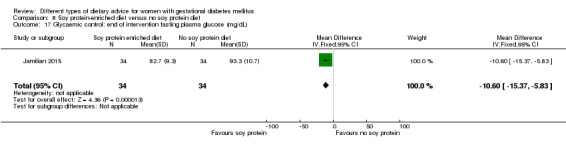
Comparison 8 Soy protein‐enriched diet versus no soy protein diet, Outcome 17 Glycaemic control: end of intervention fasting plasma glucose (mg/dL).
Jamilian 2015 did not report on the other secondary outcomes for the mother in the perinatal period.
Maternal outcomes: long term
Jamilian 2015 did not report on any secondary outcomes for the mother in the long term.
Health services outcomes
There were no clear differences between groups in Jamilian 2015 in the number of maternal hospitalisations (RR 0.75, 95% CI 0.18 to 3.10; 68 women) (Analysis 8.18); or in the number of newborn hospitalisation ("defined as hypoxia, low‐risk Apgar scores 6‐7 (at 5 or 15 min of age), high‐risk Apgar scores at 1 minute 0–5 and at 5 or 15 minutes less than 6, hyperbilirubinaemia, birth weight less than 2500 g, and/or gestational age less than 32 weeks, sepsis, pneumonia, or meningitis, hypoglycaemia (blood glucose < 1.7 mmol/L)") (RR 0.14, 95% CI 0.02 to 1.10; 68 infants) (Analysis 8.19).
8.18. Analysis.
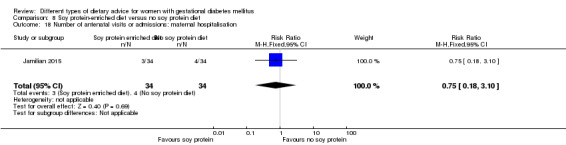
Comparison 8 Soy protein‐enriched diet versus no soy protein diet, Outcome 18 Number of antenatal visits or admissions: maternal hospitalisation.
8.19. Analysis.
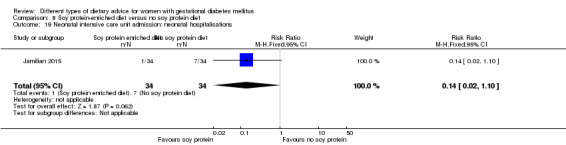
Comparison 8 Soy protein‐enriched diet versus no soy protein diet, Outcome 19 Neonatal intensive care unit admission: neonatal hospitalisations.
Jamilian 2015 did not report on the other secondary outcomes relating to the use and costs of health services.
9. High‐fibre diet versus standard‐fibre diet
One trial (Reece 1995) which randomised 22 women and their babies was included in this comparison.
Primary outcomes
Fetal/neonatal/childhood outcomes
Reece 1995 did not report on any of the primary outcomes for the fetus/neonate/child.
Maternal outcomes
Reece 1995 did not report on any of the primary outcomes for the mother.
Secondary outcomes
Fetal/neonatal outcomes
No clear differences between the high‐fibre and standard‐fibre diet groups were shown for the outcomes gestational age at birth (MD 0.00 weeks, 95% CI ‐1.30 to 1.30; 22 infants) (Analysis 9.1) and birthweight (MD ‐94.00 g, 95% CI ‐446.71 to 258.71; 22 infants) (Analysis 9.2).
9.1. Analysis.
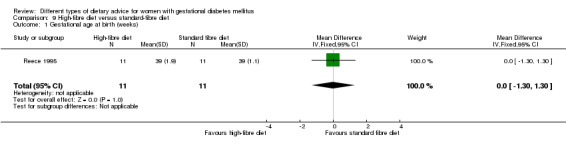
Comparison 9 High‐fibre diet versus standard‐fibre diet, Outcome 1 Gestational age at birth (weeks).
9.2. Analysis.
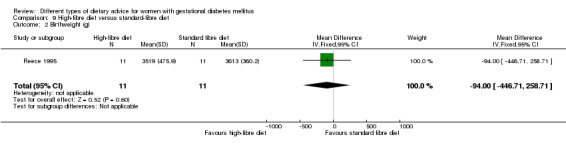
Comparison 9 High‐fibre diet versus standard‐fibre diet, Outcome 2 Birthweight (g).
Reece 1995 did not report on the other secondary outcomes for the fetus/neonate.
Childhood outcomes
Reece 1995 did not report on any of the secondary outcomes for the child.
Adulthood outcomes
Reece 1995 did not report on any of the secondary outcomes for the adult.
Maternal outcomes: perinatal
No clear differences between the high‐fibre and standard‐fibre diet groups were shown for gestational weight gain (MD 2.40 kg, 95% CI ‐2.20 to 7.00; 22 women) (Analysis 9.3); glycaemic control during/at the end of the intervention: mean blood glucose (MD 0.00 mg/dL, 95% CI ‐8.26 to 8.26; 22 women) (Analysis 9.5); or maternal hypoglycaemia (mean number of events) (MD ‐1.00 event, 95% CI ‐2.08 to 0.08; 22 women) (Analysis 9.6). No woman in either group required additional pharmacotherapy (Analysis 9.4).
9.3. Analysis.
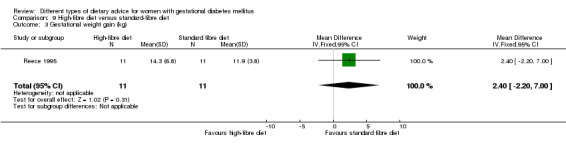
Comparison 9 High‐fibre diet versus standard‐fibre diet, Outcome 3 Gestational weight gain (kg).
9.5. Analysis.
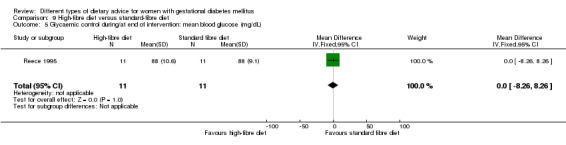
Comparison 9 High‐fibre diet versus standard‐fibre diet, Outcome 5 Glycaemic control during/at end of intervention: mean blood glucose (mg/dL).
9.6. Analysis.
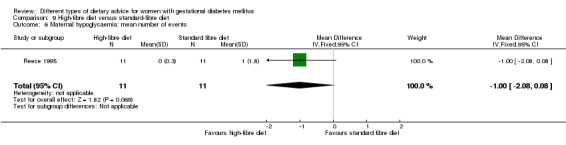
Comparison 9 High‐fibre diet versus standard‐fibre diet, Outcome 6 Maternal hypoglycaemia: mean number of events.
9.4. Analysis.
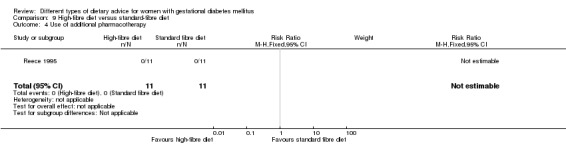
Comparison 9 High‐fibre diet versus standard‐fibre diet, Outcome 4 Use of additional pharmacotherapy.
In regards to adherence, Reece 1995 reported that "Dietary compliance was good in 60% and acceptable in 40%; in none was compliance considered unacceptable"; however information regarding adherence was not reported separately for the subset of women with GDM.
Reece 1995 did not report on the other secondary outcomes for the mother in the perinatal period.
Maternal outcomes: long term
Reece 1995 did not report on any of the secondary outcomes for the mother in the long term.
Health services outcomes
Reece 1995 did not report on any of the secondary outcomes relating to the use and costs of health services.
10. Ethnic‐specific diet versus standard healthy diet
One trial (Valentini 2012) which randomised 20 women and their babies was included in this comparison.
Primary outcomes
Fetal/neonatal/childhood outcomes
In Valentini 2012, there was no clear difference in the risk of large‐for‐gestational age between the groups of infants born to mothers receiving ethnic‐specific versus standard healthy diet advice (RR 0.14, 95% CI 0.01 to 2.45; 20 infants) (Analysis 10.1). No infants born to women in either group experienced the neonatal composite outcome, defined by Valentini 2012 as: hypoglycaemia, neonatal asphyxia, respiratory distress syndrome, and hyperbilirubinaemia, or hypocalcaemia (Analysis 10.2).
10.1. Analysis.

Comparison 10 Ethnic‐specific diet versus standard healthy diet, Outcome 1 Large‐for‐gestational age.
10.2. Analysis.
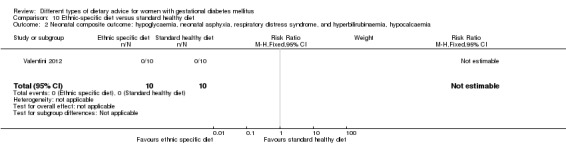
Comparison 10 Ethnic‐specific diet versus standard healthy diet, Outcome 2 Neonatal composite outcome: hypoglycaemia, neonatal asphyxia, respiratory distress syndrome, and hyperbilirubinaemia, hypocalcaemia.
Valentini 2012 did not report on the other primary outcomes for the fetus/neonate/child: perinatal mortality; neurosensory disability.
Maternal outcomes
There were no clear differences between groups in Valentini 2012 for the outcomes: hypertensive disorders of pregnancy (gestational hypertension) (RR 0.33, 95% CI 0.02 to 7.32; 20 women) (Analysis 10.3), or caesarean birth (RR 1.20, 95% CI 0.54 to 2.67; 20 women) (Analysis 10.4).
10.3. Analysis.
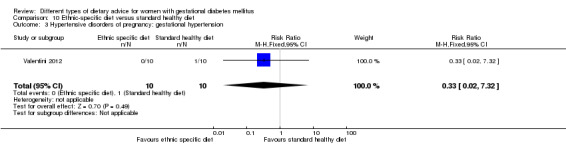
Comparison 10 Ethnic‐specific diet versus standard healthy diet, Outcome 3 Hypertensive disorders of pregnancy: gestational hypertension.
10.4. Analysis.
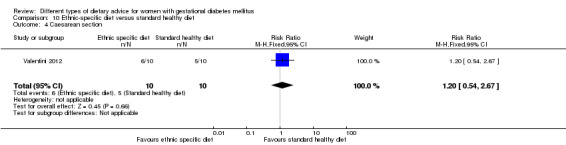
Comparison 10 Ethnic‐specific diet versus standard healthy diet, Outcome 4 Caesarean section.
Valentini 2012 did not report on the other primary outcome for the mother: type 2 diabetes development.
Secondary outcomes
Fetal/neonatal outcomes
There were no clear differences between groups in Valentini 2012 for the outcomes: gestational age at birth (MD ‐0.40 weeks, 95% CI ‐1.15 to 0.35; 20 infants) (Analysis 10.5); macrosomia (RR 0.20, 95% CI 0.01 to 3.70; 20 infants) (Analysis 10.6); small‐for‐gestational age (RR 0.33, 95% CI 0.02 to 7.32; 20 infants) (Analysis 10.7); birthweight (MD ‐370.00 g, 95% CI ‐928.87 to 188.87; 20 infants) (Analysis 10.8). There were no infants with respiratory distress syndrome (Analysis 10.9); neonatal hypoglycaemia (Analysis 10.10); neonatal hyperbilirubinaemia (Analysis 10.11) or neonatal hypocalcaemia (Analysis 10.12) born to mothers in either group.
10.5. Analysis.
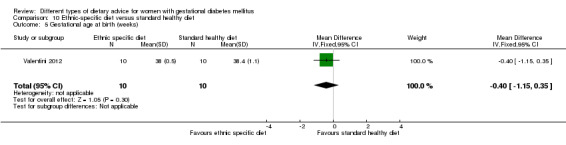
Comparison 10 Ethnic‐specific diet versus standard healthy diet, Outcome 5 Gestational age at birth (weeks).
10.6. Analysis.
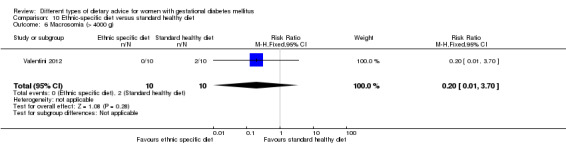
Comparison 10 Ethnic‐specific diet versus standard healthy diet, Outcome 6 Macrosomia (> 4000 g).
10.7. Analysis.
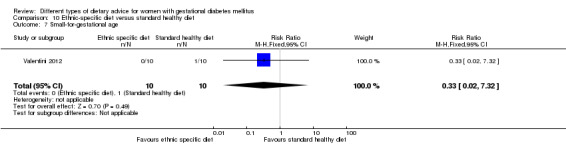
Comparison 10 Ethnic‐specific diet versus standard healthy diet, Outcome 7 Small‐for‐gestational age.
10.8. Analysis.
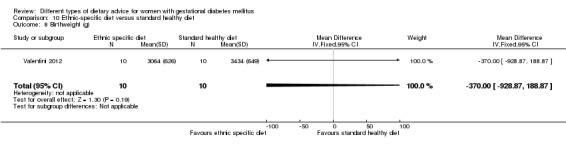
Comparison 10 Ethnic‐specific diet versus standard healthy diet, Outcome 8 Birthweight (g).
10.9. Analysis.

Comparison 10 Ethnic‐specific diet versus standard healthy diet, Outcome 9 Respiratory distress syndrome.
10.10. Analysis.

Comparison 10 Ethnic‐specific diet versus standard healthy diet, Outcome 10 Neonatal hypoglycaemia.
10.11. Analysis.
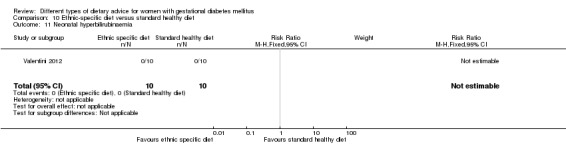
Comparison 10 Ethnic‐specific diet versus standard healthy diet, Outcome 11 Neonatal hyperbilirubinaemia.
10.12. Analysis.

Comparison 10 Ethnic‐specific diet versus standard healthy diet, Outcome 12 Neonatal hypocalcaemia.
Valentini 2012 did not report on the other secondary outcomes for the fetus/neonate.
Childhood outcomes
Valentini 2012 did not report on any secondary outcomes for child.
Adulthood outcomes
Valentini 2012 did not report on any secondary outcomes for the adult.
Maternal outcomes: perinatal
There were no clear differences between groups in Valentini 2012 for the outcomes: gestational weight gain (MD ‐2.20 kg, 95% CI ‐7.24 to 2.84; 20 women) (Analysis 10.13); and use of additional pharmacotherapy (RR 2.00, 95% CI 0.21 to 18.69; 20 women) (Analysis 10.15).
10.13. Analysis.
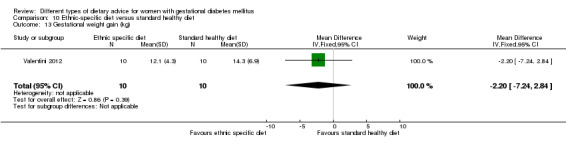
Comparison 10 Ethnic‐specific diet versus standard healthy diet, Outcome 13 Gestational weight gain (kg).
10.15. Analysis.
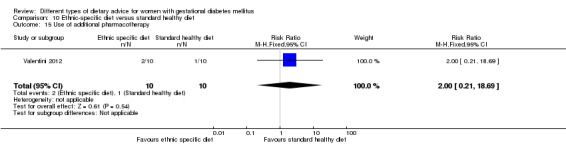
Comparison 10 Ethnic‐specific diet versus standard healthy diet, Outcome 15 Use of additional pharmacotherapy.
In Valentini 2012, adherence to the dietary intervention was measured using a 24‐hour food intake recall method; women with an intake of more than 20% higher than prescribed received a score of 0; those with an intake of 10% to 20% higher received a score of 1; and women with intake consistent with the plan or up to 10% lower received a score of 2. 'Good adherence' was defined as women being scored a 1 or 2. There was no clear difference between group in adherence to the dietary intervention (good adherence) (RR 3.50, 95% CI 0.95 to 12.90; 20 women) (Analysis 10.14).
10.14. Analysis.
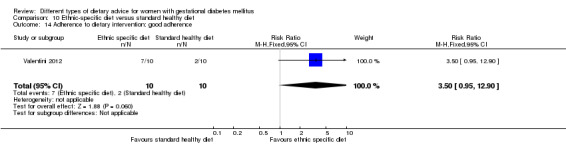
Comparison 10 Ethnic‐specific diet versus standard healthy diet, Outcome 14 Adherence to dietary intervention: good adherence.
Valentini 2012 also reported information related to glycaemic control: "The EMP group had better FPG, 1hPPPG, and HbA1c values than the SMP group"; and "The group treated with the ethnic meal plan achieved a better metabolic control at the end of the pregnancy... (though the difference was not statistically significant);" however these data were not able to be included in meta‐analyses.
Valentini 2012 did not report on the other secondary outcomes for the mother in the perinatal period.
Maternal outcomes: long term
Valentini 2012 did not report on any secondary outcomes for the mother in the long term.
Health services outcomes
Valentini 2012 did not report on any secondary outcomes relating to the use or costs of health services.
Subgroup analyses and sensitivity analyses
Due to the small number of trials included and limited data available under each of the comparisons, the planned subgroup analyses or sensitivity analyses were not able to be conducted in this version of the review.
Discussion
Summary of main results
In this review, we included 19 trials assessing different types of dietary advice interventions under 10 comparisons.
No clear differences between types of dietary advice interventions were observed for the primary review outcomes (fetal/neonatal/childhood: large‐for‐gestational age; perinatal mortality; neonatal mortality or morbidity composite; neurosensory disability; maternal: hypertensive disorders of pregnancy; caesarean section; type 2 diabetes) across any of the 10 comparisons, except for the outcome caesarean birth. Women receiving a Dietary Approaches to Stop Hypertension (DASH) diet compared with a control diet were shown to have a 47% relative reduction in the risk of caesarean section birth (two trials, 86 women); the quality of the two small trials contributing data for this outcome was however unclear.
In regards to secondary outcomes, the following possible differences were observed.
Low‐moderate GI diet versus moderate‐high GI diet: there were possible benefits observed for glycaemic control (lower end of intervention two‐hour postprandial glucose) for women in the low‐moderate GI diet group (one trial, 83 women).
Energy‐restricted diet versus no energy‐restriction diet: there were more neonates with hypocalcaemia born to women in the energy‐restricted group compared with the no energy‐restriction group (one trial, 299 infants); however there were possible benefits observed for glycaemic control (lower end of intervention fasting glucose, 24‐hour mean plasma glucose, and one‐hour postprandial glucose) for energy‐restricted group (two trials, 311 women).
DASH diet versus control diet with matching macronutrient contents: fewer babies born to mothers in the DASH diet group were macrosomic, and they had smaller head circumferences, lower ponderal indices and lower birthweights (two trials, 86 infants); there was less use of additional pharmacotherapy among women in the DASH diet group (two trials, 86 women), and these women experienced possible benefits for insulin sensitivity (lower end of intervention homeostatic model assessment of insulin resistance (HOMA‐IR) and blood insulin) (one trial, 32 women) and glycaemic control (end of intervention fasting glucose) (two trials, 66 women).
Low‐carbohydrate diet versus high‐carbohydrate diet: gestational weight gain was less among women in the low‐carbohydrate group (one trial, 145 women).
High unsaturated fat diet versus low unsaturated fat diet with matching calories: women in the high unsaturated fat diet had higher body mass index (BMI) and weight at birth and BMI at five to nine months postpartum (one trial, 27 women), and less favourable observations for insulin sensitivity (higher 38‐week insulin) (one trial, 24 women), and glycaemic control (higher 38‐week fasting glucose, postprandial glucose and HbA1c) (one trial, 25 women).
Diet recommendation plus diet‐related behavioural advice versus diet recommendation only: women receiving additional diet‐related behavioural advice experienced possible benefits related to glycaemic control (lower end of intervention postprandial glucose) (one trial, 99 women).
Soy protein‐enriched diet versus no soy protein diet: fewer babies born to mothers in the soy protein‐enriched diet group developed hyperbilirubinaemia (one trial, 68 infants); and there were possible benefits in relation to glycaemic control for women in the soy protein‐enriched diet group (lower end of intervention fasting plasma glucose) (one trial, 69 women).
No clear differences were observed for secondary outcomes in the following comparisons: low‐GI diet versus high‐fibre moderate‐GI diet (one trial); high‐fibre versus standard‐fibre diet (one trial); ethnic‐specific diet versus standard healthy diet (one trial).
Overall completeness and applicability of evidence
The evidence assessing different types of dietary advice interventions for women with GDM is incomplete. Although a wide range of dietary advice interventions have been investigated, few trials have compared the same or similar interventions; largely trials have been small and have reported limited outcome data. Thus, many of the results presented in this review are based on data from single, small trials.
Considering our primary review outcomes, the most commonly reported was caesarean section birth, reported by 12 of the 19 included trials (Asemi 2013a; Asemi 2014; Bo 2014; Cypryk 2007; Garner 1997; Jamilian 2015; Lauszus 2001; Louie 2011; Moreno‐Castilla 2013; Moses 2009; Rae 2000; Valentini 2012). Hypertensive disorders of pregnancy were reported by nine trials (Asemi 2013a; Asemi 2013b; Asemi 2014; Jamilian 2015; Lauszus 2001; Ma 2015; Moreno‐Castilla 2013; Rae 2000; Valentini 2012); large‐for‐gestational age by eight trials (Bo 2014; Grant 2011; Lauszus 2001; Louie 2011; Moreno‐Castilla 2013; Moses 2009; Rae 2000; Valentini 2012); and perinatal mortality, type 2 diabetes development for the mother and neonatal mortality or morbidity composite, by only three (Garner 1997; Moreno‐Castilla 2013; Rae 2000), two (Lauszus 2001; Louie 2011) and one (Valentini 2012) trials, respectively. None of the included trials reported on neurosensory disability.
Many of the review's secondary outcomes had limited data reported by the included trials, particularly outcomes relating to longer‐term health for both women and their babies as children and adults, and the use and costs of health services. Only two of the 19 trials (Lauszus 2001; Louie 2011) have reported any data relating to long‐term health outcomes for women, with Lauszus 2001 reporting on type 2 diabetes development and impaired glucose at one to two weeks and four to 13 months postpartum, and BMI at five to nine months postpartum; and Louie 2011 reporting on return to pre‐pregnancy weight, BMI, impaired glucose tolerance, and insulin sensitivity at three months postpartum. Only one trial (Louie 2011) has reported on long‐term follow‐up for the infant, but this has been limited to assessment of weight and height at three months postpartum; and none of the included trials have reported on follow‐up of the infants into adulthood. Only two trials (Bo 2014; Jamilian 2015) have reported on some outcomes related to the use of health services but not the associated costs.
While the absence of observed clear differences in the included trials to date may reflect lack of statistical power, this may also be associated with lack of intervention uptake. The effectiveness of different types of dietary advice interventions is likely to be influenced by many factors, including background dietary habits and barriers such as affordability, satisfaction with changes and convenience. In the included trials, information regarding adherence and women's views, has to date been limited, and where reported, results have been mixed.
Though the included trials have been conducted across a variety of countries (12 in high‐income countries (including Australia, Canada, Denmark, Italy, Poland, Spain, USA), and seven in low‐ and middle‐income countries (including China, Iran and Mexico)), the applicability of the current available evidence is limited due to the small number of trials involved in each of our dietary advice comparisons, the small sample sizes, and the variable methodological quality of the included trials.
Quality of the evidence
The 'Risk of bias' figures (Figure 2; Figure 3) indicate that the methodological quality was generally unclear for several of the included trials. Eight of the included studies had unclear risk of selection bias based on unclear methods for sequence generation and a further six had unclear methods for allocation concealment; thus only four were judged to be at low risk of selection bias. In 13 of the included trials, it was not possible to blind women or study personnel, and these trials were judged to be at high risk of performance bias. Only two of the trials were judged to be at low risk of detection bias, with blinding of outcome assessment reported; the remainder were at unclear risk of bias. The majority of trials had an unclear or high risk of reporting bias, often with few outcomes reported, and no trial registrations/protocols available.
In this update, we have (where possible) assessed the quality of the evidence using the GRADE approach as outlined in the GRADE Handbook for pre‐specified outcomes analysed in two main comparisons. For the comparison of low‐moderate GI diet versus moderate‐high GI diet, our assessment was that the evidence was low (large‐for‐gestational age; caesarean section; induction of labour) or very‐low quality (hypertensive disorders of pregnancy). Similarly, for the comparison of energy‐restricted diet versus no energy‐restricted diet, our assessment was that the evidence was low (large‐for‐gestational age; perinatal mortality; hypertensive disorders of pregnancy; caesarean section; induction of labour) or very‐low quality (neonatal hypoglycaemia). These judgements were largely based on design limitations in the included trials, small sample sizes in those trials contributing data, wide confidence intervals crossing the line of no effect, and often few or no events. See Table 2; Table 1; Table 4; Table 3.
Potential biases in the review process
We took steps to minimise the introduction of bias during the review process. At least two review authors independently assessed trials for inclusion, performed data extraction, and assessment of risk of bias for each of the included trials. We undertook a comprehensive, systematic search of databases to reduce the potential for publication bias, without language or publication status restrictions.
Agreements and disagreements with other studies or reviews
Our review found no convincing evidence of benefit for one type of dietary advice intervention for women with GDM over another. We identified two additional reviews assessing dietary advice interventions for women with GDM: one systematic literature review which included epidemiological and interventional studies that assessed GI and/or GL as the exposure variable and pregnancy outcomes as the primary outcome variable in healthy pregnant women and women with GDM (Louie 2010); and one systematic review and meta‐analysis (Viana 2014), which assessed randomised controlled trials of dietary interventions in GDM or pregnancy with hyperglycaemia.
While the Louie 2010 review assessed eight studies, only one was a randomised trial in women with GDM ‐ the Moses 2009 trial, which was also included in our review. Louie 2010 similarly noted that "direct evidence to support the use of a low‐GI diet during pregnancy complicated by GDM is currently limited;" and noted no differences in "key fetal and obstetric outcomes".
Viana 2014 included nine randomised controlled trials, which were categorised as assessing: low GI, total energy restriction, low carbohydrates, or 'other' dietary interventions; eight of the trials were also included in our review, while one (Perichart‐Perara 2012) was excluded from our review as outcome data for the subgroup of women with GDM were not reported separately.
Viana 2014 assessed four trials (Grant 2011; Louie 2011; Moses 2009; Perichart‐Perara 2012) under a comparison of low‐GI diet versus control diet. In our review, in light of the different categories of GI used across the included trials, we assessed Louie 2011 and Moses 2009 under a 'low‐moderate GI versus moderate‐high GI' comparison, and Grant 2011 was assessed under a separate 'low‐GI versus moderate‐GI' comparison. Additionally, we identified two further trials (Balas‐Nakash 2010; Ma 2015) not included in Viana 2014 in our 'low‐moderate GI versus moderate‐high GI' comparison. As such, some of our results observed differed. We did not observe less frequent insulin use with a low‐GI diet, as was observed in Viana 2014 (we also note that the data included in the Viana 2014 meta‐analysis for Moses 2009 related to women meeting the criteria to start on insulin (9/31 versus 19/32), not actual use of insulin (9/31 versus 10/32), as we have included), and we also did not observe a reduction in birthweight with low‐GI diet. Similar to our review however, no clear differences with a low‐GI were seen in meta‐analyses in Viana 2014 for caesarean birth, maternal weight gain, macrosomia or small‐for‐gestational age.
Viana 2014 assessed two trials (Garner 1997; Rae 2000) under a comparison of energy‐restriction diet versus control diet; in our review, we additionally included Magee 1990. Similar to our review, Viana 2014 reported no clear differences for caesarean birth, macrosomia and neonatal hypoglycaemia under this comparison. Also similar to our review, Viana 2014 assessed two trials under a comparisons of low‐carbohydrate diet versus control (Cypryk 2007; Moreno‐Castilla 2013), and reached the same conclusions, of no clear differences for the outcomes insulin use, caesarean birth and macrosomia. Finally, Viana 2014 also included the Valentini 2012 trial under an 'other: ethnic diet' comparison, and likewise found no clear differences for any reported outcomes.
Authors' conclusions
Implications for practice.
Evidence from 19 trials of different dietary advice interventions for women with gestational diabetes mellitus (GDM), assessed under 10 different comparisons, suggests no clear differences between types of diets for primary review outcomes: hypertensive disorders of pregnancy (assessed by nine trials, under six comparisons), large‐for‐gestational age (assessed by eight trials under seven comparisons), perinatal morality (assessed by three trials under two comparisons), type 2 diabetes development for the mother (assessed by two trials under two comparisons), and neonatal mortality or morbidity composite (assessed by one trial under one comparison). No clear difference was seen for caesarean section (assessed by 10 trials under eight comparisons), except for a reduction with a DASH diet (rich in fruits, vegetables, whole grains and low‐fat dairy products, and low in saturated fat, cholesterol, refined grains and sweets) compared with a control diet in two trials. None of the included trials reported on neurosensory disability. Few differences were seen for secondary review outcomes.
For outcomes assessed using GRADE for our two main comparisons (1) low‐moderate GI diet versus moderate‐high GI diet; 2) energy‐restricted diet versus no energy‐restricted diet), the evidence was considered to be low to very‐low quality, with downgrading based on study limitations (risk of bias), imprecision, and inconsistency.
There is thus a limited and incomplete body of evidence from randomised trials assessing the effects of different dietary advice interventions for women with GDM, which is insufficient to guide practice.
Implications for research.
The impact of different types of dietary advice for women with GDM on health outcomes for women (including hypertensive disorders of pregnancy; caesarean birth; and type 2 diabetes) and their babies (including large‐for‐gestational age; perinatal mortality; neonatal mortality or morbidity composite; and neurosensory disability) is unclear. Any future studies of different types of dietary advice for women with GDM should be high quality, and sufficiently powered to allow important differences in relevant clinical outcomes for women and babies to be detected, and to allow longer‐term infant, child and/or adult outcomes, and the impact on health care, to be assessed. Such trials should aim to collect and report on core outcomes for GDM research, such as those that are pre‐specified in the review. The data in the current review are further complicated by differing diagnostic criteria for GDM, varying levels of detail provided describing dietary advice interventions, and differing outcome descriptions and definitions; these are important issues to consider in any future trials.
What's new
| Date | Event | Description |
|---|---|---|
| 18 April 2017 | Amended | Corrected typographical error in 'Summary of findings' table 4 for risk with energy‐restricted diet (perinatal mortality). Changed risk from '0 per 10000' to '0 per 1000'. |
History
Protocol first published: Issue 8, 2011 Review first published: Issue 3, 2013
| Date | Event | Description |
|---|---|---|
| 8 March 2016 | New citation required and conclusions have changed | For this update we have added ten new included studies and 22 new excluded studies. There are now 10 comparisons (four new comparisons in this update). None of the main/results conclusions have changed for the six comparisons that were included in the previous version of the review. |
| 8 March 2016 | New search has been performed | Search and methods updated. One new author joined the team for this update. |
Acknowledgements
Thanks to Professor Thomas Wolever, Professor Robert Moses, Ms Anne Rae, Mr Jimmy Louie, Professor Jennie Brand‐Miller, and Associate Professor Finn Friis Lauszus for providing additional information regarding their trials. Thanks to Rosie Helmore for her help in translation of Balas‐Nakash 2010's manuscript from Spanish to English.
As part of the pre‐publication editorial process, this review has been commented on by three peers (an editor and two referees who are external to the editorial team) and the Group's Statistical Adviser.
This project was supported by the National Institute for Health Research, via Cochrane Programme Grant funding to Cochrane Pregnancy and Childbirth. The views and opinions expressed therein are those of the authors and do not necessarily reflect those of the Systematic Reviews Programme, NIHR, NHS or the Department of Health.
Appendices
Appendix 1. PSANZ Trial Registry search strategy
We searched trials in the Perinatal Society of Australia and New Zealand (PSANZ) Trial Registry using the terms of "gestational diabetes mellitus", "pregnancy", "pregnant", "glucose intolerance", "diet", "dietary advice", "nutrition". We reviewed all relevant trials listed under the search results.
Data and analyses
Comparison 1. Low‐moderate GI diet versus moderate‐high GI diet.
| Outcome or subgroup title | No. of studies | No. of participants | Statistical method | Effect size |
|---|---|---|---|---|
| 1 Large‐for‐gestational age | 2 | 89 | Risk Ratio (M‐H, Fixed, 95% CI) | 0.71 [0.22, 2.34] |
| 2 Hypertensive disorders of pregnancy (severe hypertension or pre‐eclampsia) | 1 | 95 | Risk Ratio (M‐H, Fixed, 95% CI) | 1.02 [0.07, 15.86] |
| 3 Hypertensive disorders of pregnancy (eclampsia) | 1 | 83 | Risk Ratio (M‐H, Fixed, 95% CI) | 0.34 [0.01, 8.14] |
| 4 Caesarean section | 1 | 63 | Risk Ratio (M‐H, Fixed, 95% CI) | 0.66 [0.29, 1.47] |
| 5 Gestational age at birth (weeks) | 1 | 62 | Mean Difference (IV, Fixed, 95% CI) | 0.30 [‐0.30, 0.90] |
| 6 Preterm birth | 2 | 146 | Risk Ratio (M‐H, Fixed, 95% CI) | 0.64 [0.22, 1.85] |
| 7 Macrosomia | 3 | 172 | Risk Ratio (M‐H, Fixed, 95% CI) | 0.59 [0.16, 2.26] |
| 8 Small‐for‐gestational age | 1 | 63 | Risk Ratio (M‐H, Fixed, 95% CI) | 5.16 [0.26, 103.27] |
| 9 Birthweight (g) | 2 | 145 | Mean Difference (IV, Fixed, 95% CI) | ‐55.98 [‐201.90, 89.95] |
| 10 Head circumference at birth (cm) | 1 | 59 | Mean Difference (IV, Fixed, 95% CI) | 0.40 [‐0.58, 1.38] |
| 11 Length at birth (cm) | 1 | 60 | Mean Difference (IV, Fixed, 95% CI) | ‐0.5 [‐1.54, 0.54] |
| 12 Ponderal index at birth (kg/m³) | 1 | 60 | Mean Difference (IV, Fixed, 95% CI) | 0.10 [‐0.03, 0.23] |
| 13 Normal vaginal birth | 1 | 63 | Risk Ratio (M‐H, Fixed, 95% CI) | 1.35 [0.89, 2.07] |
| 14 Operative vaginal birth | 1 | 63 | Risk Ratio (M‐H, Fixed, 95% CI) | 0.62 [0.16, 2.37] |
| 15 Induction of labour | 1 | 63 | Risk Ratio (M‐H, Fixed, 95% CI) | 0.88 [0.33, 2.34] |
| 16 Postpartum haemorrhage | 1 | 83 | Risk Ratio (M‐H, Fixed, 95% CI) | 1.02 [0.15, 6.93] |
| 17 Postpartum infection | 1 | 83 | Risk Ratio (M‐H, Fixed, 95% CI) | 0.34 [0.01, 8.14] |
| 18 Gestational weight gain (kg) | 1 | 83 | Mean Difference (IV, Fixed, 95% CI) | ‐0.47 [‐2.18, 1.24] |
| 19 Use of additional pharmacotherapy | 4 | 221 | Risk Ratio (M‐H, Random, 95% CI) | 0.82 [0.39, 1.74] |
| 20 Glycaemic control: end of intervention fasting plasma glucose (mmol/L) | 1 | 83 | Mean Difference (IV, Fixed, 95% CI) | ‐0.15 [‐0.55, 0.25] |
| 21 Glycaemic control: end of intervention 2‐hour postprandial glucose (mmol/L) | 1 | 83 | Mean Difference (IV, Fixed, 95% CI) | ‐0.71 [‐1.21, ‐0.21] |
| 22 Glycaemic control: end of intervention HbA1c (%) | 1 | 83 | Mean Difference (IV, Fixed, 95% CI) | 0.01 [‐0.18, 0.20] |
Comparison 2. Energy‐restricted diet versus no energy‐restricted diet.
| Outcome or subgroup title | No. of studies | No. of participants | Statistical method | Effect size |
|---|---|---|---|---|
| 1 Large‐for‐gestational age | 1 | 123 | Risk Ratio (M‐H, Fixed, 95% CI) | 1.17 [0.65, 2.12] |
| 2 Perinatal mortality (stillbirth and neonatal mortality) | 2 | 423 | Risk Ratio (M‐H, Fixed, 95% CI) | 0.0 [0.0, 0.0] |
| 3 Hypertensive disorders of pregnancy: pre‐eclampsia | 1 | 117 | Risk Ratio (M‐H, Fixed, 95% CI) | 1.0 [0.51, 1.97] |
| 4 Caesarean section | 2 | 420 | Risk Ratio (M‐H, Fixed, 95% CI) | 1.12 [0.80, 1.56] |
| 5 Stillbirth | 2 | 423 | Risk Ratio (M‐H, Fixed, 95% CI) | 0.0 [0.0, 0.0] |
| 6 Neonatal mortality | 2 | 423 | Risk Ratio (M‐H, Fixed, 95% CI) | 0.0 [0.0, 0.0] |
| 7 Gestational age at birth (weeks) | 2 | 423 | Mean Difference (IV, Random, 95% CI) | ‐0.16 [‐0.67, 0.36] |
| 8 Macrosomia (> 4000 g) | 2 | 421 | Risk Ratio (M‐H, Fixed, 95% CI) | 0.99 [0.64, 1.53] |
| 9 Macrosomia (> 4500 g) | 1 | 299 | Risk Ratio (M‐H, Fixed, 95% CI) | 1.01 [0.33, 3.05] |
| 10 Birthweight (g) | 1 | 299 | Mean Difference (IV, Fixed, 95% CI) | ‐107.0 [‐240.32, 26.32] |
| 11 Shoulder dystocia | 2 | 418 | Risk Ratio (M‐H, Fixed, 95% CI) | 0.12 [0.01, 2.26] |
| 12 Bone fracture | 1 | 299 | Risk Ratio (M‐H, Fixed, 95% CI) | 0.0 [0.0, 0.0] |
| 13 Nerve palsy | 1 | 299 | Risk Ratio (M‐H, Fixed, 95% CI) | 0.0 [0.0, 0.0] |
| 14 Neonatal hypoglycaemia | 2 | 408 | Risk Ratio (M‐H, Random, 95% CI) | 1.06 [0.48, 2.32] |
| 15 Neonatal hyperbilirubinemia | 1 | 299 | Risk Ratio (M‐H, Fixed, 95% CI) | 0.81 [0.33, 1.98] |
| 16 Neonatal hypocalcaemia | 1 | 299 | Risk Ratio (M‐H, Fixed, 95% CI) | 1.36 [1.00, 1.86] |
| 17 Normal vaginal birth | 2 | 420 | Risk Ratio (M‐H, Fixed, 95% CI) | 0.96 [0.86, 1.08] |
| 18 Operative vaginal birth | 1 | 121 | Risk Ratio (M‐H, Fixed, 95% CI) | 0.98 [0.38, 2.54] |
| 19 Induction of labour | 1 | 114 | Risk Ratio (M‐H, Fixed, 95% CI) | 1.02 [0.68, 1.53] |
| 20 Gestational weight gain (kg) | 1 | 117 | Mean Difference (IV, Fixed, 95% CI) | 1.88 [‐1.96, 5.72] |
| 21 Gestational weight gain: weight at birth (kg) | 1 | 299 | Mean Difference (IV, Fixed, 95% CI) | ‐3.15 [‐7.29, 0.99] |
| 22 Insulin sensitivity: during intervention fasting plasma insulin (pM) | 1 | 12 | Mean Difference (IV, Fixed, 95% CI) | 100.0 [‐26.02, 226.02] |
| 23 Insulin sensitivity: end of intervention fasting plasma insulin (pM) | 1 | 12 | Mean Difference (IV, Fixed, 95% CI) | ‐20.0 [‐127.70, 87.70] |
| 24 Use of additional pharmacotherapy | 2 | Risk Ratio (M‐H, Random, 95% CI) | Subtotals only | |
| 25 Glycaemic control: during intervention preprandial/fasting glucose (mmol/L) | 2 | 311 | Mean Difference (IV, Random, 95% CI) | 0.21 [‐0.58, 0.99] |
| 26 Glycaemic control: during intervention 24 hour mean plasma glucose (mmol/L) | 1 | 12 | Mean Difference (IV, Fixed, 95% CI) | 0.10 [‐0.82, 1.02] |
| 27 Glycaemic control: during intervention 1 hour postprandial glucose (mmol/L) | 1 | 299 | Mean Difference (IV, Fixed, 95% CI) | ‐0.25 [‐0.68, 0.18] |
| 28 Glycaemic control: end of intervention preprandial/fasting glucose (mmol/L) | 2 | 311 | Mean Difference (IV, Fixed, 95% CI) | ‐0.23 [‐0.44, ‐0.03] |
| 29 Glycaemic control: end of intervention 24‐hour mean plasma glucose (mmol/L) | 1 | 12 | Mean Difference (IV, Fixed, 95% CI) | ‐1.30 [‐2.25, ‐0.35] |
| 30 Glycaemic control: end of intervention 1‐hour postprandial glucose (mmol/L) | 1 | 299 | Mean Difference (IV, Fixed, 95% CI) | ‐0.51 [‐0.89, ‐0.13] |
| 31 Glycaemic control: during/at end of intervention fasting glucose (mmol/L) | 1 | 117 | Mean Difference (IV, Fixed, 95% CI) | 0.10 [‐0.18, 0.38] |
| 32 Glycaemic control: during/at end of intervention mean plasma glucose (mmol/L) | 1 | 117 | Mean Difference (IV, Fixed, 95% CI) | 0.10 [‐0.34, 0.54] |
| 33 Glycaemic control: during/at end of intervention mean HbA1c (%) | 1 | 117 | Mean Difference (IV, Fixed, 95% CI) | ‐0.20 [‐0.64, 0.24] |
Comparison 3. DASH diet versus control diet with matching macronutrient contents.
| Outcome or subgroup title | No. of studies | No. of participants | Statistical method | Effect size |
|---|---|---|---|---|
| 1 Hypertensive disorders of pregnancy: pre‐eclampsia | 3 | 136 | Risk Ratio (M‐H, Fixed, 95% CI) | 1.0 [0.31, 3.26] |
| 2 Caesarean section | 2 | 86 | Risk Ratio (M‐H, Fixed, 95% CI) | 0.53 [0.37, 0.76] |
| 3 Gestational age at birth (weeks) | 1 | 52 | Mean Difference (IV, Fixed, 95% CI) | 0.20 [‐0.45, 0.85] |
| 4 Macrosomia (≥ 4000 g) | 1 | 52 | Risk Ratio (M‐H, Fixed, 95% CI) | 0.1 [0.01, 0.73] |
| 5 Birthweight (g) | 2 | 86 | Mean Difference (IV, Fixed, 95% CI) | ‐581.27 [‐790.32, ‐372.22] |
| 6 Head circumference at birth (cm) | 1 | 52 | Mean Difference (IV, Fixed, 95% CI) | ‐0.90 [‐1.44, ‐0.36] |
| 7 Length at birth(cm) | 1 | 52 | Mean Difference (IV, Fixed, 95% CI) | ‐0.5 [‐1.59, 0.59] |
| 8 Ponderal index at birth (kg/m³) | 1 | 52 | Mean Difference (IV, Fixed, 95% CI) | ‐0.37 [‐0.54, ‐0.20] |
| 9 Placental abruption | 1 | 58 | Risk Ratio (M‐H, Fixed, 95% CI) | 3.0 [0.13, 70.74] |
| 10 Gestational weight gain: BMI at end of intervention (kg/m²) | 2 | 66 | Mean Difference (IV, Random, 95% CI) | ‐0.83 [‐3.76, 2.11] |
| 11 Gestational weight gain: weight at end of intervention (kg) | 2 | 66 | Mean Difference (IV, Fixed, 95% CI) | ‐2.88 [‐8.48, 2.71] |
| 12 Insulin sensitivity: end of intervention HOMA‐IR | 1 | 32 | Mean Difference (IV, Fixed, 95% CI) | 1.00 [‐1.34, ‐0.66] |
| 13 Insulin sensitivity: end of intervention insulin (µIU/mL) | 1 | 32 | Mean Difference (IV, Fixed, 95% CI) | ‐3.26 [‐4.42, ‐2.10] |
| 14 Use of additional pharmacotherapy | 2 | 86 | Risk Ratio (M‐H, Fixed, 95% CI) | 0.28 [0.14, 0.53] |
| 15 Glycaemic control: end of intervention fasting blood glucose (mmol/L) | 2 | 66 | Mean Difference (IV, Fixed, 95% CI) | ‐0.42 [‐0.53, ‐0.32] |
| 16 Glycaemic control: at end of intervention HbA1c (%) | 1 | 34 | Mean Difference (IV, Fixed, 95% CI) | ‐0.25 [‐0.76, 0.26] |
Comparison 4. Low‐carbohydrate diet versus high‐carbohydrate diet.
| Outcome or subgroup title | No. of studies | No. of participants | Statistical method | Effect size |
|---|---|---|---|---|
| 1 Large‐for‐gestational age | 1 | 149 | Risk Ratio (M‐H, Fixed, 95% CI) | 0.51 [0.13, 1.95] |
| 2 Perinatal mortality (stillbirth and neonatal mortality) | 1 | 150 | Risk Ratio (M‐H, Fixed, 95% CI) | 3.0 [0.12, 72.49] |
| 3 Hypertensive disorders of pregnancy: maternal hypertension | 1 | 150 | Risk Ratio (M‐H, Fixed, 95% CI) | 0.4 [0.13, 1.22] |
| 4 Caesarean section | 2 | 179 | Risk Ratio (M‐H, Fixed, 95% CI) | 1.29 [0.84, 1.99] |
| 5 Stillbirth | 1 | 150 | Risk Ratio (M‐H, Fixed, 95% CI) | 3.0 [0.12, 72.49] |
| 6 Gestational age at birth (weeks) | 2 | 180 | Mean Difference (IV, Fixed, 95% CI) | 0.10 [‐0.42, 0.62] |
| 7 Macrosomia (> 4000 g) | 2 | 179 | Risk Ratio (M‐H, Fixed, 95% CI) | 0.20 [0.02, 1.69] |
| 8 Small‐for‐gestational age | 1 | 149 | Risk Ratio (M‐H, Fixed, 95% CI) | 0.68 [0.29, 1.56] |
| 9 Birthweight (g) | 1 | 30 | Mean Difference (IV, Fixed, 95% CI) | 22.0 [‐241.06, 285.06] |
| 10 Neonatal hypoglycaemia | 1 | 149 | Risk Ratio (M‐H, Fixed, 95% CI) | 0.91 [0.39, 2.12] |
| 11 Normal vaginal birth | 1 | 30 | Risk Ratio (M‐H, Fixed, 95% CI) | 0.78 [0.39, 1.54] |
| 12 Operative vaginal birth | 1 | 30 | Risk Ratio (M‐H, Fixed, 95% CI) | 1.0 [0.07, 14.55] |
| 13 Gestational weight gain: maternal weight gain (kg) | 1 | 145 | Mean Difference (IV, Fixed, 95% CI) | ‐0.90 [‐1.60, ‐0.20] |
| 14 Adherence to dietary intervention: fully applied the recommended menu | 1 | 30 | Risk Ratio (M‐H, Fixed, 95% CI) | 1.09 [0.73, 1.62] |
| 15 Use of additional pharmacotherapy. | 2 | 180 | Risk Ratio (M‐H, Fixed, 95% CI) | 1.02 [0.77, 1.37] |
| 16 Glycaemic control: end of intervention fasting blood glucose (mg/dL) | 1 | 30 | Mean Difference (IV, Fixed, 95% CI) | 5.0 [‐0.01, 10.01] |
| 17 Glycaemic control: end of intervention 2‐hour post breakfast blood glucose (mg/dL) | 1 | 30 | Mean Difference (IV, Fixed, 95% CI) | 5.0 [‐1.60, 11.60] |
| 18 Glycaemic control: end of intervention 2‐hour post lunch blood glucose (mg/dL) | 1 | 30 | Mean Difference (IV, Fixed, 95% CI) | 3.0 [‐2.77, 8.77] |
| 19 Glycaemic control: end of intervention 2‐hour post dinner blood glucose (mg/dL) | 1 | 30 | Mean Difference (IV, Fixed, 95% CI) | 6.0 [‐1.47, 13.47] |
Comparison 5. High unsaturated fat diet versus low unsaturated fat diet with matching calories.
| Outcome or subgroup title | No. of studies | No. of participants | Statistical method | Effect size |
|---|---|---|---|---|
| 1 Large‐for‐gestational age | 1 | 27 | Risk Ratio (M‐H, Fixed, 95% CI) | 0.54 [0.21, 1.37] |
| 2 Hypertensive disorders of pregnancy: pre‐eclampsia | 1 | 27 | Risk Ratio (M‐H, Fixed, 95% CI) | 0.0 [0.0, 0.0] |
| 3 Hypertensive disorders of pregnancy: hypertension in pregnancy | 1 | 27 | Risk Ratio (M‐H, Fixed, 95% CI) | 0.54 [0.06, 5.26] |
| 4 Caesarean section | 1 | 27 | Risk Ratio (M‐H, Fixed, 95% CI) | 1.08 [0.07, 15.50] |
| 5 Type 2 diabetes: 'diabetic' OGTT 1‐2 weeks postpartum | 1 | 24 | Risk Ratio (M‐H, Fixed, 95% CI) | 2.0 [0.45, 8.94] |
| 6 Type 2 diabetes: 'diabetic' OGTT 4‐13 months postpartum | 1 | 6 | Risk Ratio (M‐H, Fixed, 95% CI) | 1.0 [0.10, 9.61] |
| 7 Gestational age at birth (weeks) | 2 | 111 | Mean Difference (IV, Fixed, 95% CI) | 0.25 [‐0.51, 1.01] |
| 8 Preterm birth | 1 | 84 | Risk Ratio (M‐H, Fixed, 95% CI) | 0.0 [0.0, 0.0] |
| 9 Macrosomia (> 4000 g) | 2 | 111 | Risk Ratio (M‐H, Fixed, 95% CI) | 0.53 [0.18, 1.56] |
| 10 Birthweight (g) | 2 | 111 | Mean Difference (IV, Fixed, 95% CI) | ‐138.19 [‐292.59, 16.21] |
| 11 Placental abruption | 1 | 27 | Risk Ratio (M‐H, Fixed, 95% CI) | 0.0 [0.0, 0.0] |
| 12 Gestational weight gain (kg) | 1 | 84 | Mean Difference (IV, Fixed, 95% CI) | ‐1.98 [‐4.32, 0.36] |
| 13 Gestational weight gain: BMI at birth (kg/m²) | 1 | 27 | Mean Difference (IV, Fixed, 95% CI) | 3.90 [2.41, 5.39] |
| 14 Gestational weight gain: weight at birth (kg) | 1 | 27 | Mean Difference (IV, Fixed, 95% CI) | 11.90 [7.47, 16.33] |
| 15 Insulin sensitivity: during intervention (38 week) insulin (mU/L) | 1 | 24 | Mean Difference (IV, Fixed, 95% CI) | 4.40 [2.59, 6.21] |
| 16 Insulin sensitivity: during intervention (38 week) insulin sensitivity (10‐5 min‐1 per mU/L min) | 1 | 24 | Mean Difference (IV, Fixed, 95% CI) | ‐0.08 [‐0.21, 0.05] |
| 17 Insulin sensitivity: end of intervention IAI | 1 | 84 | Mean Difference (IV, Fixed, 95% CI) | 0.04 [‐0.28, 0.36] |
| 18 Use of additional pharmacotherapy | 2 | 111 | Risk Ratio (M‐H, Fixed, 95% CI) | 0.0 [0.0, 0.0] |
| 19 Glycaemic control: during intervention (38 week) fasting blood glucose (mmol/L) | 1 | 24 | Mean Difference (IV, Fixed, 95% CI) | 0.5 [0.30, 0.70] |
| 20 Glycaemic control: during intervention (38 week) postprandial glucose (mmol/L) | 1 | 25 | Mean Difference (IV, Fixed, 95% CI) | 0.90 [0.58, 1.22] |
| 21 Glycaemic control: during intervention (38 week) HbA1c (%) | 1 | 25 | Mean Difference (IV, Fixed, 95% CI) | 0.40 [0.32, 0.48] |
| 22 Glycaemic control: end of intervention fasting blood glucose (mmol/L) | 1 | 84 | Mean Difference (IV, Fixed, 95% CI) | 0.18 [‐0.17, 0.53] |
| 23 Glycaemic control: end of intervention 2‐hour postprandial blood glucose (mmol/L) | 1 | 84 | Mean Difference (IV, Fixed, 95% CI) | ‐0.02 [‐0.29, 0.25] |
| 24 BMI 5‐9 months postpartum (kg/m²) | 1 | 27 | Mean Difference (IV, Fixed, 95% CI) | 4.10 [2.34, 5.86] |
| 25 Impaired glucose tolerance: 'borderline' OGTT 1‐2 weeks postpartum | 1 | 24 | Risk Ratio (M‐H, Fixed, 95% CI) | 1.5 [0.30, 7.43] |
| 26 Impaired glucose tolerance: 'borderline' OGTT 4‐13 months postpartum | 1 | 7 | Risk Ratio (M‐H, Fixed, 95% CI) | 0.27 [0.01, 4.93] |
5.11. Analysis.
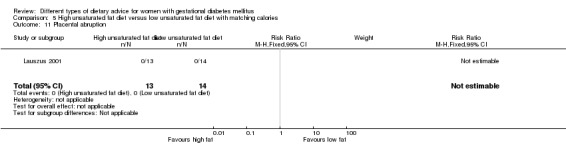
Comparison 5 High unsaturated fat diet versus low unsaturated fat diet with matching calories, Outcome 11 Placental abruption.
Comparison 6. Low‐GI diet versus high‐fibre moderate‐GI diet.
| Outcome or subgroup title | No. of studies | No. of participants | Statistical method | Effect size |
|---|---|---|---|---|
| 1 Large‐for‐gestational age | 1 | 92 | Risk Ratio (M‐H, Fixed, 95% CI) | 2.87 [0.61, 13.50] |
| 2 Caesarean section | 1 | 92 | Risk Ratio (M‐H, Fixed, 95% CI) | 1.91 [0.91, 4.03] |
| 3 Type 2 diabetes mellitus at 3 months postpartum | 1 | 58 | Risk Ratio (M‐H, Fixed, 95% CI) | 0.76 [0.11, 5.01] |
| 4 Gestational age at birth (weeks) | 1 | 92 | Mean Difference (IV, Fixed, 95% CI) | ‐0.10 [‐0.39, 0.19] |
| 5 Preterm birth | 1 | 96 | Risk Ratio (M‐H, Fixed, 95% CI) | 0.96 [0.14, 6.53] |
| 6 Macrosomia (> 4000 g) | 1 | 92 | Risk Ratio (M‐H, Fixed, 95% CI) | 0.32 [0.03, 2.96] |
| 7 Small‐for‐gestational age | 1 | 92 | Risk Ratio (M‐H, Fixed, 95% CI) | 1.20 [0.34, 4.18] |
| 8 Birthweight (g) | 1 | 92 | Mean Difference (IV, Fixed, 95% CI) | 0.0 [‐277.18, 277.18] |
| 9 Head circumference at birth (cm) | 1 | 82 | Mean Difference (IV, Fixed, 95% CI) | ‐0.20 [‐0.91, 0.51] |
| 10 Length at birth (cm) | 1 | 92 | Mean Difference (IV, Fixed, 95% CI) | 0.0 [‐0.83, 0.83] |
| 11 Ponderal index at birth (kg/m³) | 1 | 92 | Mean Difference (IV, Fixed, 95% CI) | 0.20 [‐0.79, 1.19] |
| 12 Weight and height at 3 months postpartum | Other data | No numeric data | ||
| 12.1 Weight for age percentile (adjusted for breastfeeding status) | Other data | No numeric data | ||
| 12.2 Length for age percentile (adjusted for breastfeeding status) | Other data | No numeric data | ||
| 12.3 Weight for length percentile (adjusted for breastfeeding status) | Other data | No numeric data | ||
| 13 Weight gain during pregnancy (kg) | 1 | 87 | Mean Difference (IV, Fixed, 95% CI) | ‐1.20 [‐3.43, 1.03] |
| 14 Adherence to dietary intervention | 1 | 92 | Risk Ratio (M‐H, Fixed, 95% CI) | 0.84 [0.64, 1.11] |
| 15 Insulin sensitivity: end of intervention: HOMA2‐IR (%) | 1 | 77 | Mean Difference (IV, Fixed, 95% CI) | ‐0.10 [‐0.38, 0.18] |
| 16 Insulin sensitivity: end of intervention insulin (pmol/L) | 1 | 70 | Mean Difference (IV, Fixed, 95% CI) | 10.80 [‐22.36, 43.96] |
| 17 Use of additional pharmacotherapy | 1 | 92 | Risk Ratio (M‐H, Fixed, 95% CI) | 0.83 [0.58, 1.17] |
| 18 Glycaemic control: end of intervention blood glucose (mmol/L) | 1 | 74 | Mean Difference (IV, Fixed, 95% CI) | ‐0.10 [‐0.38, 0.18] |
| 19 Glycaemic control: end of intervention HbA1c (%) | Other data | No numeric data | ||
| 20 Return to pre‐pregnancy weight at 3 months postpartum | 1 | 55 | Risk Ratio (M‐H, Fixed, 95% CI) | 1.15 [0.43, 3.07] |
| 21 BMI at 3 months postpartum (kg/m²) | 1 | 52 | Mean Difference (IV, Fixed, 95% CI) | ‐0.5 [‐2.79, 1.79] |
| 22 Impaired glucose tolerance at 3 months postpartum | 1 | 58 | Risk Ratio (M‐H, Fixed, 95% CI) | 1.33 [0.44, 4.04] |
| 23 Insulin sensitivity at 3 months postpartum (insulin (pmol/L)) | 1 | 55 | Mean Difference (IV, Fixed, 95% CI) | ‐14.20 [‐32.58, 4.18] |
| 24 Insulin sensitivity at 3 months postpartum (HOMA‐IR (%)) | 1 | 53 | Mean Difference (IV, Fixed, 95% CI) | ‐0.30 [‐0.66, 0.06] |
Comparison 7. Diet recommendation + diet‐related behavioural advice versus diet recommendation only.
| Outcome or subgroup title | No. of studies | No. of participants | Statistical method | Effect size |
|---|---|---|---|---|
| 1 Large‐for‐gestational age | 1 | 99 | Risk Ratio (M‐H, Fixed, 95% CI) | 0.73 [0.25, 2.14] |
| 2 Caesarean section | 1 | 99 | Risk Ratio (M‐H, Fixed, 95% CI) | 0.78 [0.38, 1.62] |
| 3 Preterm birth (< 37 weeks' gestation) | 1 | 99 | Risk Ratio (M‐H, Fixed, 95% CI) | 0.51 [0.10, 2.66] |
| 4 Gestational weight gain: BMI at end of intervention (kg/m²) | 1 | 99 | Mean Difference (IV, Fixed, 95% CI) | 0.0 [‐1.75, 1.75] |
| 5 Gestational weight gain: weight at end of intervention (kg) | 1 | 99 | Mean Difference (IV, Fixed, 95% CI) | ‐0.10 [‐4.91, 4.71] |
| 6 Insulin sensitivity: end of intervention HOMA‐IR | 1 | 99 | Mean Difference (IV, Fixed, 95% CI) | ‐0.30 [‐0.77, 0.17] |
| 7 Insulin sensitivity: end of intervention fasting insulin (µU/mL) | 1 | 99 | Mean Difference (IV, Fixed, 95% CI) | ‐0.5 [‐2.69, 1.69] |
| 8 Use of additional pharmacotherapy | 1 | 99 | Risk Ratio (M‐H, Fixed, 95% CI) | 0.61 [0.15, 2.42] |
| 9 Glycaemic control: end of intervention fasting glucose (mg/dL) | 1 | 99 | Mean Difference (IV, Fixed, 95% CI) | 0.0 [‐4.25, 4.25] |
| 10 Glycaemic control: end of intervention postprandial glucose (mg/dL) | 1 | 99 | Mean Difference (IV, Fixed, 95% CI) | ‐9.30 [‐15.58, ‐3.02] |
| 11 Glycaemic control: end of intervention HbA1c (%) | 1 | 99 | Mean Difference (IV, Fixed, 95% CI) | ‐0.10 [‐0.28, 0.08] |
| 12 Length of postnatal stay (baby): stay > 4 days | 1 | 99 | Risk Ratio (M‐H, Fixed, 95% CI) | 1.33 [0.73, 2.44] |
Comparison 8. Soy protein‐enriched diet versus no soy protein diet.
| Outcome or subgroup title | No. of studies | No. of participants | Statistical method | Effect size |
|---|---|---|---|---|
| 1 Hypertensive disorders of pregnancy: pre‐eclampsia | 1 | 68 | Risk Ratio (M‐H, Fixed, 95% CI) | 2.0 [0.19, 21.03] |
| 2 Caesarean section | 1 | 68 | Risk Ratio (M‐H, Fixed, 95% CI) | 1.0 [0.57, 1.77] |
| 3 Gestational age at birth (weeks) | 1 | 68 | Mean Difference (IV, Fixed, 95% CI) | 0.40 [‐0.23, 1.03] |
| 4 Preterm birth (< 37 weeks' gestation) | 1 | 68 | Risk Ratio (M‐H, Fixed, 95% CI) | 2.0 [0.19, 21.03] |
| 5 Macrosomia (> 4000 g) | 1 | 68 | Risk Ratio (M‐H, Fixed, 95% CI) | 0.6 [0.16, 2.31] |
| 6 Birthweight (g) | 1 | 68 | Mean Difference (IV, Fixed, 95% CI) | ‐142.60 [‐360.40, 75.20] |
| 7 Head circumference at birth (cm) | 1 | 68 | Mean Difference (IV, Fixed, 95% CI) | ‐0.20 [‐1.01, 0.61] |
| 8 Length at birth (cm) | 1 | 68 | Mean Difference (IV, Fixed, 95% CI) | ‐0.10 [‐1.07, 0.87] |
| 9 Neonatal hypoglycaemia | 1 | 68 | Risk Ratio (M‐H, Fixed, 95% CI) | 3.0 [0.33, 27.42] |
| 10 Neonatal hyperbilirubinaemia | 1 | 68 | Risk Ratio (M‐H, Fixed, 95% CI) | 0.27 [0.08, 0.89] |
| 11 Gestational weight gain: BMI at end of intervention (kg/m²) | 1 | 68 | Mean Difference (IV, Fixed, 95% CI) | 0.60 [‐1.43, 2.63] |
| 12 Gestational weight gain: weight at end of intervention (kg) | 1 | 68 | Mean Difference (IV, Fixed, 95% CI) | 3.50 [‐1.47, 8.47] |
| 13 Insulin sensitivity: end of intervention HOMA‐IR | 1 | 68 | Mean Difference (IV, Fixed, 95% CI) | ‐1.0 [‐2.20, 0.20] |
| 14 Insulin sensitivity: end of intervention QUICKI | 1 | 68 | Mean Difference (IV, Fixed, 95% CI) | 0.0 [‐0.01, 0.01] |
| 15 Insulin sensitivity: end of intervention insulin (µIU/mL) | 1 | 68 | Mean Difference (IV, Fixed, 95% CI) | ‐2.60 [‐8.03, 2.83] |
| 16 Use of additional pharmacotherapy | 1 | 68 | Risk Ratio (M‐H, Fixed, 95% CI) | 1.0 [0.15, 6.70] |
| 17 Glycaemic control: end of intervention fasting plasma glucose (mg/dL) | 1 | 68 | Mean Difference (IV, Fixed, 95% CI) | ‐10.60 [‐15.37, ‐5.83] |
| 18 Number of antenatal visits or admissions: maternal hospitalisation | 1 | 68 | Risk Ratio (M‐H, Fixed, 95% CI) | 0.75 [0.18, 3.10] |
| 19 Neonatal intensive care unit admission: neonatal hospitalisations | 1 | 68 | Risk Ratio (M‐H, Fixed, 95% CI) | 0.14 [0.02, 1.10] |
Comparison 9. High‐fibre diet versus standard‐fibre diet.
| Outcome or subgroup title | No. of studies | No. of participants | Statistical method | Effect size |
|---|---|---|---|---|
| 1 Gestational age at birth (weeks) | 1 | 22 | Mean Difference (IV, Fixed, 95% CI) | 0.0 [‐1.30, 1.30] |
| 2 Birthweight (g) | 1 | 22 | Mean Difference (IV, Fixed, 95% CI) | ‐94.0 [‐446.71, 258.71] |
| 3 Gestational weight gain (kg) | 1 | 22 | Mean Difference (IV, Fixed, 95% CI) | 2.40 [‐2.20, 7.00] |
| 4 Use of additional pharmacotherapy | 1 | 22 | Risk Ratio (M‐H, Fixed, 95% CI) | 0.0 [0.0, 0.0] |
| 5 Glycaemic control during/at end of intervention: mean blood glucose (mg/dL) | 1 | 22 | Mean Difference (IV, Fixed, 95% CI) | 0.0 [‐8.26, 8.26] |
| 6 Maternal hypoglycaemia: mean number of events | 1 | 22 | Mean Difference (IV, Fixed, 95% CI) | ‐1.0 [‐2.08, 0.08] |
Comparison 10. Ethnic‐specific diet versus standard healthy diet.
| Outcome or subgroup title | No. of studies | No. of participants | Statistical method | Effect size |
|---|---|---|---|---|
| 1 Large‐for‐gestational age | 1 | 20 | Risk Ratio (M‐H, Fixed, 95% CI) | 0.14 [0.01, 2.45] |
| 2 Neonatal composite outcome: hypoglycaemia, neonatal asphyxia, respiratory distress syndrome, and hyperbilirubinaemia, hypocalcaemia | 1 | 20 | Risk Ratio (M‐H, Fixed, 95% CI) | 0.0 [0.0, 0.0] |
| 3 Hypertensive disorders of pregnancy: gestational hypertension | 1 | 20 | Risk Ratio (M‐H, Fixed, 95% CI) | 0.33 [0.02, 7.32] |
| 4 Caesarean section | 1 | 20 | Risk Ratio (M‐H, Fixed, 95% CI) | 1.2 [0.54, 2.67] |
| 5 Gestational age at birth (weeks) | 1 | 20 | Mean Difference (IV, Fixed, 95% CI) | ‐0.40 [‐1.15, 0.35] |
| 6 Macrosomia (> 4000 g) | 1 | 20 | Risk Ratio (M‐H, Fixed, 95% CI) | 0.2 [0.01, 3.70] |
| 7 Small‐for‐gestational age | 1 | 20 | Risk Ratio (M‐H, Fixed, 95% CI) | 0.33 [0.02, 7.32] |
| 8 Birthweight (g) | 1 | 20 | Mean Difference (IV, Fixed, 95% CI) | ‐368.00 [‐928.87, 188.87] |
| 9 Respiratory distress syndrome | 1 | 20 | Risk Ratio (M‐H, Fixed, 95% CI) | 0.0 [0.0, 0.0] |
| 10 Neonatal hypoglycaemia | 1 | 20 | Risk Ratio (M‐H, Fixed, 95% CI) | 0.0 [0.0, 0.0] |
| 11 Neonatal hyperbilirubinaemia | 1 | 20 | Risk Ratio (M‐H, Fixed, 95% CI) | 0.0 [0.0, 0.0] |
| 12 Neonatal hypocalcaemia | 1 | 20 | Risk Ratio (M‐H, Fixed, 95% CI) | 0.0 [0.0, 0.0] |
| 13 Gestational weight gain (kg) | 1 | 20 | Mean Difference (IV, Fixed, 95% CI) | ‐2.20 [‐7.24, 2.84] |
| 14 Adherence to dietary intervention: good adherence | 1 | 20 | Risk Ratio (M‐H, Fixed, 95% CI) | 3.5 [0.95, 12.90] |
| 15 Use of additional pharmacotherapy | 1 | 20 | Risk Ratio (M‐H, Fixed, 95% CI) | 2.0 [0.21, 18.69] |
Characteristics of studies
Characteristics of included studies [ordered by study ID]
Asemi 2013a.
| Methods | Randomised controlled trial. | |
| Participants | 40 women. Inclusion criteria: pregnant women aged 18 to 40 years diagnosed with GDM by a 100 g OGTT (see notes) at 24 to 28 weeks' gestation. Exclusion criteria: untreated hypothyroidism, smoking, kidney or liver diseases, taking oestrogen therapies. Setting: Iran. |
|
| Interventions |
DASH diet (n = 20 randomised; 17 analysed)
Control diet with matching macronutrients (n = 20 randomised; 17 analysed)
All women:
|
|
| Outcomes | Data in meta‐analyses for: hypertensive disorders of pregnancy (pre‐eclampsia); caesarean section; birthweight; gestational weight gain (BMI and weight at the end of intervention); use of additional pharmacotherapy; glycaemic control (end of intervention fasting blood glucose; end of intervention HbA1c). | |
| Notes | GDM diagnosis based on ADA criteria: 2 or more values met or exceeded the following 100 g 3‐hour OGTT:
|
|
| Risk of bias | ||
| Bias | Authors' judgement | Support for judgement |
| Random sequence generation (selection bias) | Low risk | Described as "Random assignment was done by the use of computer‐generated random numbers". |
| Allocation concealment (selection bias) | Unclear risk | Described as above; no further details provided regarding allocation concealment. |
| Blinding of participants and personnel (performance bias) All outcomes | Low risk | Described as "with the exception of the study dietitian, who provided the dietary education, all study personnel and participants were blinded to the dietary assignment". Although the study dietitian was not blinded, all other research personnel were reported to be blinded, and thus the risk of performance bias was judged to be low. |
| Blinding of outcome assessment (detection bias) All outcomes | Low risk | Described as above and the un‐blinded dietitian was not involved in outcome data collection. |
| Incomplete outcome data (attrition bias) All outcomes | Low risk | Post‐randomisation exclusions: 3 in the DASH diet group: pre‐eclampsia (n = 2) and complete bed rest (n = 1). 3 in the control diet group: pre‐eclampsia (n = 2) and insulin therapy (n = 1). No losses to follow‐up. |
| Selective reporting (reporting bias) | Unclear risk | No access to study protocol; therefore not able to confidently assess the risk of selective reporting. Data reported for a limited number of review outcomes. |
| Other bias | Low risk | No other obvious risk of bias. |
Asemi 2013b.
| Methods | Randomised controlled trial. | |
| Participants | 38 women. Inclusion criteria: pregnant women aged 18 to 40 years, diagnosed with GDM by a 100 g OGTT (see notes) at 24 to 28 weeks' gestation; no previous history of GDM, non‐smoker. Exclusion criteria: premature preterm rupture of membrane, placental abruption, pre‐eclampsia, need to commence insulin therapy or on insulin therapy, recommendation for complete bed rest. Setting: Iran. |
|
| Interventions |
DASH diet (n = 19 randomised; 16 analysed)
Control diet with matching macronutrients (n = 19 randomised; 16 analysed)
All women:
|
|
| Outcomes | Data in meta‐analyses for: hypertensive disorders of pregnancy (pre‐eclampsia); gestational weight gain (BMI and weight at end of intervention); insulin sensitivity (end of intervention insulin and HOMA‐IR); glycaemic control (end of intervention fasting blood glucose). | |
| Notes | GDM diagnosis based on ADA criteria: 2 or more values met or exceeded following 100 g 3‐hour OGTT;
|
|
| Risk of bias | ||
| Bias | Authors' judgement | Support for judgement |
| Random sequence generation (selection bias) | Low risk | Described as "random assignment was done by the use of computer‐generated random numbers. A trained midwife at the maternity clinic performed randomization". |
| Allocation concealment (selection bias) | Unclear risk | Described as above; no further details provided regarding allocation concealment. |
| Blinding of participants and personnel (performance bias) All outcomes | Low risk | Described as "with the exception of the study dietitian, who provided the dietary education, all study personnel and participants were blinded to the dietary assignment". Although the study dietitian was not blinded, all other research personnel were reported to be blinded, and thus the risk of performance bias was judged to be low. |
| Blinding of outcome assessment (detection bias) All outcomes | Unclear risk | It was unclear whether the un‐blinded dietitian was involved in outcome assessment. |
| Incomplete outcome data (attrition bias) All outcomes | Low risk | Post‐randomisation exclusions: 3 in the DASH diet group: pre‐eclampsia (n = 2) and complete bed rest (n = 1). 3 in the control diet group: pre‐eclampsia (n = 2) and insulin therapy (n = 1). No losses to follow‐up. |
| Selective reporting (reporting bias) | Unclear risk | No access to study protocol; therefore not able to confidently assess the risk of selective reporting. Data reported for a limited number of review outcomes. |
| Other bias | Low risk | No other obvious risk of bias. |
Asemi 2014.
| Methods | Randomised controlled trial. | |
| Participants | 58 women. Inclusion criteria: primigravid pregnant women aged 18 to 40 years, diagnosed with GDM by a 100 g OGTT (see notes) at 24 to 28 weeks' gestation. Exclusion criteria: previous glucose intolerance or GDM diagnosis, premature preterm rupture of membrane, placenta abruption, pre‐eclampsia, requiring insulin therapy during intervention or complete bed rest, hypothyroidism, urinary tract infection, smoking and kidney or liver diseases, taking oestrogen therapy. Setting: Iran. |
|
| Interventions |
DASH diet (n = 29 randomised; 26 analysed)
Control diet with matching macronutrients (n = 19 randomised; 26 analysed)
All women:
|
|
| Outcomes | Data in meta‐analyses for: hypertensive disorders of pregnancy (pre‐eclampsia); caesarean section; gestational age at birth; macrosomia; birthweight; head circumference at birth; length at birth; ponderal index at birth; placental abruption; use of additional; pharmacotherapy. | |
| Notes | GDM diagnosis based on ADA criteria: 2 or more values met or exceeded following 100g 3‐hour OGTT;
|
|
| Risk of bias | ||
| Bias | Authors' judgement | Support for judgement |
| Random sequence generation (selection bias) | Low risk | Described as "random assignment was done using computer‐generated random numbers". |
| Allocation concealment (selection bias) | Unclear risk | Described as above; no further detail provided regarding allocation concealment. |
| Blinding of participants and personnel (performance bias) All outcomes | Unclear risk | No information about whether women or personnel were blinded. |
| Blinding of outcome assessment (detection bias) All outcomes | Unclear risk | No information about whether outcome assessors were blinded. |
| Incomplete outcome data (attrition bias) All outcomes | Low risk | Post‐randomisation exclusions: 3 in the DASH diet group: pre‐eclampsia (n = 1), placenta abruption (n = 1) and complete bed rest (n = 1). 3 in the control diet group: premature preterm rupture of membrane (n = 1), needed to commence insulin therapy during intervention (n = 1) and pre‐eclampsia (n = 1). No losses to follow‐up. |
| Selective reporting (reporting bias) | Unclear risk | No access to study protocol; therefore not able to confidently assess the risk of selective reporting. Data reported for a limited number of review outcomes. |
| Other bias | Low risk | No other obvious risk of bias. |
Balas‐Nakash 2010.
| Methods | Randomised controlled trial. | |
| Participants | 37 women. A total of 69 women were involved in the trial, but only 37 women were diagnosed with GDM and provided outcome data for this review. Inclusion criteria: women ≤ 30 weeks' gestation, diagnosed with type A2 GDM (see notes), who were planning to give birth at the NIPerIER and required medical treatment from the Department of Endocrinology. Exclusion criteria: women with type 1 diabetes, type A1 GDM (see notes), glucose intolerance, multiple pregnancies, kidney or liver disease and hyperthyroidism or hypothyroidism. Setting: Mexico. |
|
| Interventions |
Low‐moderate GI diet (n = 19) Only foods with a low‐to‐moderate GI were recommended. Moderate‐high GI diet (n = 18) Control group: any type of carbohydrate was permitted. All women:
|
|
| Outcomes | Data in meta‐analyses for: use of additional pharmacotherapy. | |
| Notes |
|
|
| Risk of bias | ||
| Bias | Authors' judgement | Support for judgement |
| Random sequence generation (selection bias) | Unclear risk | Described as "women included in this study were randomly divided into two study groups", no further information available. |
| Allocation concealment (selection bias) | Unclear risk | No information was provided regarding allocation concealment. |
| Blinding of participants and personnel (performance bias) All outcomes | High risk | It is unlikely that women were able to be blinded due to the nature of behavioural intervention used in this study. No information on whether research personnel were able to be blinded or not. |
| Blinding of outcome assessment (detection bias) All outcomes | Unclear risk | No information about whether outcome assessors were blinded. |
| Incomplete outcome data (attrition bias) All outcomes | High risk | Of the total randomised cohort of 108 eligible women (mixed cohort of women with GDM and type 2 diabetes) in a clinical trial, 20 declined (15.8%) to participate in the trial with reasons unclear. Another 19 women (17.5%) were excluded due to incomplete dietary information. No information was available for these excluded participants. |
| Selective reporting (reporting bias) | Unclear risk | No access to study protocol; therefore not able to confidently assess the risk of selective reporting; information obtained from translation. |
| Other bias | Low risk | No other obvious risk of bias. |
Bo 2014.
| Methods | Randomised controlled trial. | |
| Participants | 99 women. Inclusion criteria: women aged 18 to 50 years; 24th to 26th weeks of gestational age; diagnosed with GDM by a 75 g OGTT (see notes); singleton pregnancies. Exclusion criteria: BMI > 40 kg/m², any known diseases, medications or obstetric absolute or relative contraindications to exercise. Setting: Italy. |
|
| Interventions |
Diet recommendation and diet‐related behavioural advice (n = 49)
Diet recommendation only (n = 50)
All women:
|
|
| Outcomes | Data in meta‐analyses for: large‐for‐gestational age; caesarean section; preterm birth; gestational weight gain (BMI and weight at end of intervention); insulin sensitivity (end of intervention insulin, HOMA‐IR); use of additional pharmacotherapy; glycaemic control (end of intervention fasting glucose, postprandial glucose, HbA1c); length of postnatal stay (baby; > 4 days). | |
| Notes | GDM was diagnosed by 75 g OGTT; no diagnostic criteria specified. | |
| Risk of bias | ||
| Bias | Authors' judgement | Support for judgement |
| Random sequence generation (selection bias) | Low risk | Described as "randomization was stratified by baseline body mass index (BMI) and METs, and was implemented through a website (www.epiclin.it)". |
| Allocation concealment (selection bias) | Low risk | Described as above. |
| Blinding of participants and personnel (performance bias) All outcomes | High risk | It is considered unlikely that women were able to be blinded. |
| Blinding of outcome assessment (detection bias) All outcomes | Low risk | "The dieticians, the obstetricians who reported maternal/neonatal complications, and the laboratory personnel were blinded to the group assignment." |
| Incomplete outcome data (attrition bias) All outcomes | Low risk | No loss to follow‐up or post‐randomisation exclusions. |
| Selective reporting (reporting bias) | Unclear risk | No access to study protocol, not able to confidently assess the risk of selective reporting. Trial registration reports birthweight as a secondary outcome, however data not reported for this outcome in the manuscript. |
| Other bias | Low risk | No other obvious risk of bias. |
Cypryk 2007.
| Methods | Randomised controlled trial. | |
| Participants | 30 women. Inclusion criteria: Caucasian women with newly diagnosed GDM (see notes). Exclusion criteria: not reported. Setting: Poland. |
|
| Interventions |
Low‐carbohydrate diet (n = 15) Daily total energy divided as carbohydrate: 45%, protein: 25%, fat: 30% (based on daily total energy of 1800 kcal). Women were encouraged to have the diet until birth. High‐carbohydrate diet (n = 15) Daily total energy divided as carbohydrate: 60%, protein: 25%, fat: 15% (based on daily total energy of 1800 kcal). Women were encouraged to follow the diet until birth. All women:
|
|
| Outcomes | Data in meta‐analyses for: caesarean section; gestational age at birth; macrosomia; birthweight; normal vaginal birth; operative vaginal birth; adherence to dietary intervention; use of additional pharmacotherapy; glycaemic control (end of intervention fasting and post breakfast, lunch and dinner 2‐hour blood glucose). | |
| Notes | GDM diagnosis based on WHO criteria: 1 or more value met or exceeded:
|
|
| Risk of bias | ||
| Bias | Authors' judgement | Support for judgement |
| Random sequence generation (selection bias) | Unclear risk | Described as "the patients were randomised into two groups"; no further details available. |
| Allocation concealment (selection bias) | Unclear risk | No information was provided regarding allocation concealment. |
| Blinding of participants and personnel (performance bias) All outcomes | High risk | It is considered unlikely that women were able to be blinded. No information on whether research personnel were able to be blinded or not. |
| Blinding of outcome assessment (detection bias) All outcomes | Unclear risk | No information about whether outcome assessors were blinded. |
| Incomplete outcome data (attrition bias) All outcomes | Low risk | No loss to follow‐up or post‐randomisation exclusions. |
| Selective reporting (reporting bias) | High risk | Maternal weight gain was reported incompletely "The proper weight change was observed in all the patients studied;" and data reported for a limited number of review outcomes. No access to study protocol to further assess the risk of selective reporting. |
| Other bias | Low risk | No other obvious risk of bias. |
Garner 1997.
| Methods | Randomised controlled trial. | |
| Participants | 300 women. Inclusion criteria: pregnant women diagnosed with GDM (see notes) between 24 and 32 weeks' gestation in otherwise low‐risk pregnancies. Exclusion criteria: multiple gestation; maternal‐fetal blood group incompatibility; known congenital anomaly; prior evidence of placenta praevia or abruptio placentae; significant maternal disease including chronic hypertension, connective tissue disease, endocrine disorders, and chronic hepatic disease; long‐term medical therapy affecting glucose metabolism such as steroids and β‐mimetic tocolytic agents; and imminent birth. Setting: Canada. |
|
| Interventions |
Energy‐restricted diet (n = 150 randomised; 149 analysed)
No energy‐restricted diet (n = 150 randomised and analysed)
|
|
| Outcomes | Data in meta‐analyses for: perinatal mortality; caesarean birth; stillbirth; neonatal mortality; gestational age at birth; macrosomia; birthweight; shoulder dystocia; bone fracture; nerve palsy; neonatal hypoglycaemia; hyperbilirubinaemia; hypocalcaemia; normal vaginal birth; gestational weight gain (weight at birth); use of additional pharmacotherapy; glycaemic control (during and end of intervention fasting and postprandial 1‐hour glucose). | |
| Notes | Intention‐to‐treat analysis: data from 'failed control' group was analysed with the no energy‐restricted diet group data. Hatem criteria used for GDM diagnosis: following 75 g OGTT
|
|
| Risk of bias | ||
| Bias | Authors' judgement | Support for judgement |
| Random sequence generation (selection bias) | Low risk | Described as "those women who agreed to participate in the study signed an informed consent form and were randomly allocated to treatment or control groups by randomisation tables". |
| Allocation concealment (selection bias) | Unclear risk | No further detail regarding allocation concealment provided. |
| Blinding of participants and personnel (performance bias) All outcomes | High risk | It is unlikely that study women were able to be blinded. It was reported that healthcare workers involved in the trial were blinded to the home blood glucose monitoring results for women in the no energy‐restricted diet group; no further information was available. |
| Blinding of outcome assessment (detection bias) All outcomes | Unclear risk | No information on whether outcome assessors were blinded. |
| Incomplete outcome data (attrition bias) All outcomes | Low risk | 1 woman from the energy‐restricted diet group was lost to follow‐up. No post‐randomisation exclusions or withdrawals. |
| Selective reporting (reporting bias) | Unclear risk | No access to study protocol; therefore not able to confidently assess the risk of selective reporting. |
| Other bias | Unclear risk | There were 16 women in the no energy‐restricted diet group who received the same interventions as those in the energy‐restricted diet group (failed control); intention‐to‐treat analysis was applied. |
Grant 2011.
| Methods | Randomised controlled trial. | |
| Participants | 29 women. A total of 43 women were involved in the trial, but only 29 women were diagnosed with GDM and provided outcome data for this review. Inclusion criteria: pregnant women, 18 to 45 years, diagnosed with GDM (see notes), and who had been referred to the Diabetes in Pregnancy, St. Michael's Hospital, Canada. Exclusion criteria: presence of a multiple pregnancy or an acute or chronic illness affecting carbohydrate metabolism; presence of type 1 or 2 diabetes prior to the current pregnancy; use of insulin treatment prior to providing consent; greater than 34 weeks' gestation; unable to communicate in English with no translator available. Setting: Canada. |
|
| Interventions |
Low‐moderate GI diet (n = 13) Women were asked to select their starch choices from an exchange list of low‐GI foods. Moderate‐high GI diet (n = 16) Women were asked to select their starch choices from an exchange list of intermediate‐ and high‐GI foods, reflecting the usual intake of typical diabetes in pregnancy clinic patients. All women:
|
|
| Outcomes | Data in meta‐analyses for: large‐for‐gestational age; macrosomia; use of additional pharmacotherapy. | |
| Notes | CDA criteria used for GDM diagnosis: 2 of the values are met or exceeded following 76 g OGTT:
|
|
| Risk of bias | ||
| Bias | Authors' judgement | Support for judgement |
| Random sequence generation (selection bias) | Low risk | Randomisation order was created by 1 of the investigators who was not involved in recruitment. It is unclear how the sequence was generated; it was considered likely to be a computer‐generated sequence. |
| Allocation concealment (selection bias) | Low risk | Sealed, numbered, opaque envelopes were used, and various block sizes in randomisation were used. |
| Blinding of participants and personnel (performance bias) All outcomes | High risk | Described as an "open‐label" pilot study. |
| Blinding of outcome assessment (detection bias) All outcomes | Unclear risk | No information on whether outcome assessors were blinded. |
| Incomplete outcome data (attrition bias) All outcomes | Low risk | 3 women in the low‐moderate GI group withdrew after randomisation, reasons given. Data were analysed on an intent‐to‐treat basis. |
| Selective reporting (reporting bias) | Unclear risk | No access to study protocol; therefore not able to confidently assess the risk of selective reporting. Data reported for a limited number of review outcomes. |
| Other bias | Low risk | No other obvious risk of bias. |
Jamilian 2015.
| Methods | Randomised controlled trial. | |
| Participants | 68 women. Inclusion criteria: pregnant women with GDM (see notes), aged 18 to 40 years, at week 24 to 28 gestation. Exclusion criteria: women with a fasting plasma glucose > 5.8 mmol/L and 2‐hour > 6.7 mmol/L ("because of ethical consideration, because they might needed insulin therapy"); with a history of diabetes (type 1 or 2 diagnosed in the current pregnancy), significant renal impairment, with premature preterm rupture of membranes, placental abruption, pre‐eclampsia, eclampsia, chronic hypertension or hypothyroidism. Setting: Iran. |
|
| Interventions |
Soy protein‐enriched diet (n = 34) Diet containing 0.8 g/kg protein with 35% animal protein, 35% soy protein, and 30% other plant proteins. Women received textured soy protein (Sobhan) and were educated regarding the preparation of their meals with soy protein. A trained nutritionist explained that soy protein should be washed and soaked for 30 minutes and then cooked in boiling water with turmeric, lemon juice, and tomato paste for 10 minutes. No soy protein diet (n = 34) Diet containing 0.8 g/kg protein with 70% animal and 30% plant proteins. All women:
|
|
| Outcomes | Data in meta‐analyses for: hypertensive disorders of pregnancy (pre‐eclampsia); caesarean section; gestational age at birth; preterm birth; macrosomia; birthweight; head circumference at birth; length at birth; neonatal hypoglycaemia; hyperbilirubinaemia; gestational weight gain (BMI and weight at end of intervention); insulin sensitivity (end of intervention HOMA‐IR; QUICKI; insulin); use of additional pharmacotherapy; glycaemic control (end of intervention fasting glucose); maternal hospitalisation; neonatal hospitalisations. | |
| Notes | GDM was diagnosed by a "one‐step" 2 hour 75 g OGTT, based on the ADA criteria. GDM diagnosed when any of the values were met or exceeded:
|
|
| Risk of bias | ||
| Bias | Authors' judgement | Support for judgement |
| Random sequence generation (selection bias) | Unclear risk | Quote: "Randomization and allocation were done by a trained midwife and were masked from the researcher and patients until the main analyses were completed." |
| Allocation concealment (selection bias) | Unclear risk | As above. |
| Blinding of participants and personnel (performance bias) All outcomes | High risk | "Randomization and allocation were done by a trained midwife and were masked from the researcher and patients until the main analyses were completed." Considered unlikely to have been successful in view of the interventions. |
| Blinding of outcome assessment (detection bias) All outcomes | Unclear risk | Not clearly reported. |
| Incomplete outcome data (attrition bias) All outcomes | Low risk | 2 women from the no soy protein diet group were excluded "due to personal reasons"; however all women were included in the analyses. |
| Selective reporting (reporting bias) | Unclear risk | No access to study protocol; therefore not able to confidently assess the risk of selective reporting. Trial registered online, but retrospectively. |
| Other bias | Low risk | No other obvious risk of bias. |
Lauszus 2001.
| Methods | Randomised controlled trial. | |
| Participants | 27 women. Inclusion criteria: women with GDM diagnosed by a positive 3‐hour 75 g OGTT (see notes) before the 34 weeks' gestation. Exclusion criteria: use of any hypoglycaemic, anti‐lipidaemic or antihypertensive medication. Setting: Denmark. |
|
| Interventions |
High unsaturated fat diet (n = 13) From 34 weeks' gestation women had a high‐monounsaturated fat diet; no details about high‐monounsaturated fat diet provided. Low unsaturated fat diet (n = 14) From 34 weeks' gestation women had a high‐carbohydrate diet; no details about high‐carbohydrate diet provided. All women: after being diagnosed with GDM, all women were instructed to follow a high‐carbohydrate diet until the 34th week. |
|
| Outcomes | Data in meta‐analyses for: large‐for‐gestational age; hypertensive disorders of pregnancy (pre‐eclampsia; hypertension); caesarean section; type 2 diabetes; gestational age at birth; macrosomia; birthweight; placental abruption; gestational weight gain (BMI and weight at birth); insulin sensitivity (during intervention); use of additional pharmacotherapy; glycaemic control (during intervention fasting and postprandial glucose, HbA1c); BMI postpartum; impaired glucose tolerance postpartum. | |
| Notes | GDM diagnosis based on 3‐hour 75 g OGTT, bloods taken every 30 minutes; GDM was defined as 2 or more plasma glucose concentrations above 3 SD of the mean. | |
| Risk of bias | ||
| Bias | Authors' judgement | Support for judgement |
| Random sequence generation (selection bias) | Low risk | Reported as "the randomisation was performed block‐wise stratified for pre‐pregnancy weight with an expected ratio of obese to normal weight of three to one. The block sizes were six and two in the two strata". |
| Allocation concealment (selection bias) | Low risk | Reported as that "the randomisation was performed by a third person at an independent centre outside our institution, which produced information about the outcome of randomisation at baseline measurement in week 33". |
| Blinding of participants and personnel (performance bias) All outcomes | High risk | It is unlikely that women were able to be blinded. No information on whether research personnel were able to be blinded or not. |
| Blinding of outcome assessment (detection bias) All outcomes | Unclear risk | No information on whether outcome assessors were blinded. |
| Incomplete outcome data (attrition bias) All outcomes | Low risk | Data were missing at multiple collection points for 1 to 2 women but this was explained in the text and was considered unlikely to impact outcomes. Only women who had a positive OGTT at early postnatal period or those who were unable to attend the early postnatal follow‐up, were followed up at ≥ 4 months postpartum, Therefore, there were only 6 women who provided outcome data for development of type 2 diabetes and 7 women provided outcome data for development of glucose intolerance at ≥ 4 months postpartum. |
| Selective reporting (reporting bias) | Unclear risk | No access to study protocol; therefore not able to confidently assess the risk of selective reporting. |
| Other bias | High risk | Women in the high‐monounsaturated fat diet group had a higher trial entry BMI (mean (SD): 35 (2.4) kg/m²) when compared with women in the high‐carbohydrate group (mean (SD): 32.2 (1.5) kg/m²). |
Louie 2011.
| Methods | Randomised controlled trial. | |
| Participants | 99 women. Inclusion criteria: women aged at 18 to 45 years, diagnosed with GDM by a 75 g OGTT (see notes) between 20 and 32 weeks' gestation, with an otherwise healthy singleton pregnancy. Exclusion criteria: women who had special dietary requirements (including vegetarianism/veganism), pre‐existing diabetes, or pregnancy achieved by assisted reproduction and those who smoked or consumed alcohol during pregnancy. Setting: Australia. |
|
| Interventions |
Low‐GI diet (n = 50 randomised, 47 analysed) Diet GI target of ≤ 50; other nutrients were the same as the comparison group. High‐fibre moderate‐GI diet (n = 49 randomised, 45 analysed) Diet GI target of around 60, which represented average GI of Australian population. All women:
|
|
| Outcomes | Data in meta‐analyses for: large‐for‐gestational age; caesarean section; type 2 diabetes; gestational age at birth; preterm birth; macrosomia; small‐for‐gestational age; birthweight; head circumference at birth; length at birth; ponderal index; weight and height at 3 months postpartum; weight gain during pregnancy; adherence to intervention; insulin sensitivity (end of intervention HOMA‐IR, insulin); use of additional pharmacotherapy; glycaemic control (end of intervention blood glucose, HbA1c); return to pre‐pregnancy weight and BMI at 3 months postpartum; impaired glucose tolerance and insulin sensitivity at 3 months postpartum. | |
| Notes | Insulin treatment was commenced if the mean fasting blood glucose or 1‐hour postprandial blood glucose in the preceding week exceeded 5.2 and 7.5 mmol/L, respectively. ADIPS criteria used for GDM diagnosis: 1 or more value met or exceeded:
WHO criteria used for diagnosis of type 2 diabetes and impaired glucose tolerance:
|
|
| Risk of bias | ||
| Bias | Authors' judgement | Support for judgement |
| Random sequence generation (selection bias) | Low risk | Described as "the enrolled subjects were centrally randomised to study diet by computer generated random numbers, stratified by BMI and weeks of gestation". |
| Allocation concealment (selection bias) | Low risk | Described as "the allocation sequence was unpredictable and concealed from the recruiter". |
| Blinding of participants and personnel (performance bias) All outcomes | Low risk | Reported that (besides research dietitian who provided trial intervention) all study personnel and women were blinded to dietary assignment. |
| Blinding of outcome assessment (detection bias) All outcomes | High risk | Un‐blinded research dietitian was responsible for data collection. |
| Incomplete outcome data (attrition bias) All outcomes | High risk | In the low‐GI diet group, 1 woman was excluded due to incorrect GDM diagnosis, 3 women withdrew after intervention, 2 women had preterm births, leaving 44 women who completed the study, and 47 women were included in analyses. In high‐fibre moderate‐GI diet group, 2 women withdrew after group allocation, another 2 women withdrew after intervention; 2 women had preterm births, leaving 43 women who completed the study and 45 women who were included in analyses. Only 58 of the 99 women randomised and their babies participated the 3‐month follow‐up. |
| Selective reporting (reporting bias) | Unclear risk | No access to study protocol; therefore not able to confidently assess the risk of selective reporting. |
| Other bias | High risk | At baseline, 2‐hour post 75 g glucose load blood glucose concentrations for women in low‐GI group were significantly higher than those in high‐fibre moderate‐GI group (mean (SD): low‐GI group 8.6 (1.2) mmol/L versus high‐fibre moderate GI group 8.0 (1.3) mmol/L; P = 0.024). |
Ma 2015.
| Methods | Randomised controlled trial. | |
| Participants | 95 women. Inclusion criteria: women who were residents of Guangzhow, aged between 18 and 40 years, with GDM diagnosed at 24 to 26 weeks' gestation (see notes). Exclusion criteria: pre‐pregnancy diabetes; multiple gestation; other severe diseases (hypertension, chronic hepatic and kidney disease and cancer); use of insulin or hypoglycaemic medications; less than 9 years of formal schooling; previous intensive nutrition education or intervention for diabetes. Setting: China. |
|
| Interventions |
Low‐moderate GI diet (n = 47 randomised; 41 analysed) The exchange lists provided contained low‐GL foods. Moderate‐high GI diet (n = 48 randomised; 42 analysed) The exchange lists comprised intermediate to high‐GL foods (typical Guangzhou diet). All women:
|
|
| Outcomes | Data in meta‐analyses for: hypertensive disorders of pregnancy (severe hypertension or pre‐eclampsia; eclampsia); preterm birth; macrosomia; birthweight; postpartum haemorrhage; postpartum infection; gestational weight gain; use of additional pharmacotherapy; glycaemic control (end of intervention fasting and 2‐hour postprandial glucose, and HbA1c). | |
| Notes | Women were screened with a 50 g OGCT according to guidelines of the Chinese Medical Association and the ADA; positive cases (glucose ≥ 7.8 mmol/L following OGCT) were confirmed by further evaluation with a 3‐hour 75 g OGTT, and were diagnosed if they met at least 2 of the following:
|
|
| Risk of bias | ||
| Bias | Authors' judgement | Support for judgement |
| Random sequence generation (selection bias) | Low risk | Random numbers were generated by Excel software. |
| Allocation concealment (selection bias) | High risk | Discussion: "We did not use allocation concealment." |
| Blinding of participants and personnel (performance bias) All outcomes | High risk | Discussion: "Both the researchers (the dietitians) and the participants could not be blinded to group status." |
| Blinding of outcome assessment (detection bias) All outcomes | Unclear risk | Not detailed. |
| Incomplete outcome data (attrition bias) All outcomes | Unclear risk | "A modified intention‐to‐treat principle including all participants who completed the baseline and follow‐up assessments was used in the analysis." 6 women from the low‐moderate GI group were excluded from the analyses (protocol violation: 3; insulin treatment: 1; pre‐eclampsia: 1; declined: 1); 6 women from the moderate‐high GI group were excluded from the analyses (protocol violation: 3; insulin treatment: 2; severe hypertension: 1). |
| Selective reporting (reporting bias) | Unclear risk | No access to study protocol; therefore not able to confidently assess the risk of selective reporting. |
| Other bias | Low risk | No other obvious sources of bias. |
Magee 1990.
| Methods | Randomised controlled trial. | |
| Participants | 12 women. Inclusion criteria: obese women (defined as: pre‐pregnancy weight > 120% of ideal body weight as specified by the Corrected 1959 Metropolitan Life Insurance table) with GDM (see notes). Exclusion criteria: not reported. Setting: the USA. |
|
| Interventions | During the second hospitalised week: Energy‐restricted diet (n = 7) Energy‐restricted diet of 1200 kcal/day diet by reducing serving size without changing the pattern and content of the diet in the first hospitalised week. No energy‐restricted diet (n = 5) Continued the standard diet prescribed as the first week, for about 2400 kcal/day. All women: hospitalised for the 2 weeks duration. Studies and diet during the first week were identical for all patients. During the first hospitalised week:
|
|
| Outcomes | Data in meta‐analyses for: insulin sensitivity (during and end of intervention fasting insulin); glycaemic control (during and end of intervention fasting and 24‐hour plasma glucose). | |
| Notes | Carpenter and Coustan's criteria used for GDM diagnosis: 2 or more values meeting the following in 100 g 3‐hour OGTT;
|
|
| Risk of bias | ||
| Bias | Authors' judgement | Support for judgement |
| Random sequence generation (selection bias) | Unclear risk | Described as "subjects were randomised to the control or calorie‐restricted group". |
| Allocation concealment (selection bias) | Unclear risk | No information was given on allocation concealment. |
| Blinding of participants and personnel (performance bias) All outcomes | Unclear risk | No information on whether women or research personnel were blinded or not. |
| Blinding of outcome assessment (detection bias) All outcomes | Unclear risk | No information on whether outcome assessors were blinded. |
| Incomplete outcome data (attrition bias) All outcomes | Low risk | No loss to follow‐up or post‐randomisation exclusions reported. |
| Selective reporting (reporting bias) | Unclear risk | No clinical outcomes were reported (data available regarding insulin sensitivity and glycaemic control only). No access to study protocol; therefore not able to confidently assess the risk of selective reporting. |
| Other bias | Low risk | No other obvious risk of bias. |
Moreno‐Castilla 2013.
| Methods | Randomised controlled trial. | |
| Participants | 152 women randomised. Inclusion criteria: women aged 18 to 45 years, diagnosed with GDM (see notes) with singleton pregnancies and a gestational age ≤ 35 weeks. Exclusion criteria: women who were unwilling to follow a prescribed diet, unable to understand Spanish, pregnancy co‐morbidities other than obesity, hypertension, and/or dyslipidaemia. Setting: Spain |
|
| Interventions |
Low‐carbohydrate diet (n = 76 randomised; 75 analysed)
High‐carbohydrate diet (n = 76 randomised; 75 analysed)
For both groups: energy content of the diet for each patient was calculated on the basis of pre‐gestational weight with a minimum of 1800 kcal/day. |
|
| Outcomes | Data in meta‐analyses for: large‐for‐gestational age; perinatal mortality; hypertensive disorders of pregnancy (hypertension); caesarean section; stillbirth; gestational age at birth; macrosomia; small‐for‐gestational age; neonatal hypoglycaemia; gestational weight gain; use of additional pharmacotherapy. | |
| Notes | Screening and diagnosis of GDM based on the 2006 National Diabetes and Pregnancy clinical guidelines. All women were screened for GDM at 24 to 28 weeks with 50 g OGCT. If OGCT ≥ 7.8 mmol/L, they underwent an OGTT; diagnostic criteria were based on the National Diabetes Data Group criteria: 2 or more values met or exceeded the following in 100 g 3‐hour OGTT;
|
|
| Risk of bias | ||
| Bias | Authors' judgement | Support for judgement |
| Random sequence generation (selection bias) | Unclear risk | Described as "group allocation was performed using a sealed envelope". |
| Allocation concealment (selection bias) | Unclear risk | As above; no further details provided. |
| Blinding of participants and personnel (performance bias) All outcomes | High risk | Described as "two‐arm, open, parallel, randomised controlled trial". |
| Blinding of outcome assessment (detection bias) All outcomes | Unclear risk | No information on whether outcome assessors were blinded. |
| Incomplete outcome data (attrition bias) All outcomes | Unclear risk | Post‐randomisation exclusion:
Although intention‐to‐treat principles were employed in the analyses (including those women who discontinued the intervention), a considerable number of women discontinued their allocated diet during the study period, and more women in the high‐carbohydrate diet group discontinued their diet. Discontinued intervention:
|
| Selective reporting (reporting bias) | Unclear risk | No access to study protocol; therefore not able to confidently assess the risk of selective reporting. |
| Other bias | Low risk | No other obvious risk of bias. |
Moses 2009.
| Methods | Randomised controlled trial. | |
| Participants | 63 women. Inclusion criteria: women aged at 18 to 40 years diagnosed with GDM (see notes), with a singleton pregnancy, no previous GDM, non‐smokers, and seen for the first dietary visit between 28 and 32 weeks' gestation, with an ability to follow the protocol requirements. Exclusion criteria: any condition or medication that could affect glucose concentrations and unwillingness to follow the prescribed diet. Setting: Australia. |
|
| Interventions |
Low‐moderate GI diet (n = 31) Diet based on previously verified low–GI food, including pasta, grain breads, and unprocessed breakfast cereals with a high‐fibre content. Women were specifically asked to avoid consuming white bread, processed commercial breakfast cereals, potatoes, and some rice varieties. Moderate‐high GI diet (n = 32) Women were advised to follow a diet with a high‐fibre and low‐sugar content, with no specific mention of the GI. Potatoes, whole wheat bread, and specific high‐fibre, moderate‐to‐high GI breakfast cereals were recommended. All women:
|
|
| Outcomes | Data in meta‐analyses for: large‐for‐gestational age; caesarean section; gestational age at birth; preterm birth; macrosomia; small‐for‐gestational age; birthweight; head circumference at birth; length at birth; ponderal index at birth; normal vaginal birth; operative vaginal birth; induction of labour; use of additional pharmacotherapy. | |
| Notes | ADIPS criteria used for GDM diagnosis: 1 or more value met or exceeded:
|
|
| Risk of bias | ||
| Bias | Authors' judgement | Support for judgement |
| Random sequence generation (selection bias) | Low risk | Described as: "participants were randomly assigned to receive one of two different diets using permuted blocks of unequal size with the list generated using STATA (Version 7.0)". |
| Allocation concealment (selection bias) | Unclear risk | Described as above; unclear methods for allocation concealment. |
| Blinding of participants and personnel (performance bias) All outcomes | High risk | Women and study dietitian were not blinded. The physician caring for the women was blinded to group allocation. |
| Blinding of outcome assessment (detection bias) All outcomes | Unclear risk | No information on whether outcome assessors were blinded. |
| Incomplete outcome data (attrition bias) All outcomes | Low risk | No loss to follow‐up or post‐randomisation exclusion. |
| Selective reporting (reporting bias) | Unclear risk | Data reported incompletely for some outcomes in the manuscript; "There were no significant differences between the women in either group with respect to weight gain from baseline to delivery, induction of labor, method of delivery, or gestational age at delivery (data not shown)." Trial authors provided additional unpublished data. |
| Other bias | Low risk | No other obvious risk of bias. |
Rae 2000.
| Methods | Randomised controlled trial. | |
| Participants | 125 women. Inclusion criteria: women at ≤ 35 weeks and 6 days gestation; > 110% of ideal body weight for height (adjusted for expected pregnancy weight gain and using a BMI of 25 as equal to 100% ideal body weight); diagnosed with GDM (see notes). Exclusion criteria: not reported. Setting: Australia. |
|
| Interventions |
Energy‐restricted diet (n = 67 randomised; 63 analysed) Women were placed on a diabetic diet providing between 6800 and 7600 kJ energy per day, which represented 70% of the Recommended Dietary Intake for pregnant women (30% energy restriction). No energy‐restricted diet (n = 58 randomised; 54 analysed): Women were placed on diabetic diet without energy restriction, providing 8600 to 9500 kJ energy per day. All women:
|
|
| Outcomes | Data in meta‐analyses for: large‐for‐gestational age; caesarean section; gestational age at birth; preterm birth; macrosomia; small‐for‐gestational age; birthweight; head circumference at birth; length at birth; ponderal index at birth; normal vaginal birth; operative vaginal birth; induction of labour; use of additional pharmacotherapy. | |
| Notes | 7 sets of twins were included in the study, 3 sets in the energy‐restricted diet group and 4 sets in the no energy‐restricted diet group. GDM diagnosed if:
|
|
| Risk of bias | ||
| Bias | Authors' judgement | Support for judgement |
| Random sequence generation (selection bias) | Unclear risk | Described as "women were allocated at random by draw of opaque numbered envelopes". |
| Allocation concealment (selection bias) | Unclear risk | Described as above. |
| Blinding of participants and personnel (performance bias) All outcomes | Low risk | Women and diabetes service staff were blinded to allocation to diet group. |
| Blinding of outcome assessment (detection bias) All outcomes | Unclear risk | Described as that "demographic, obstetric and neonatal data were collected prospectively". No information on whether or not outcome assessors were able to be blinded to group allocation. |
| Incomplete outcome data (attrition bias) All outcomes | Low risk | A total of 8 women (4 from each group) withdrew and were excluded from data analysis; reasons for withdrawal and baseline details about these 8 women were not given. Some data points have small numbers of lost women that are unexplained in the text; this was considered unlikely to have affected the overall outcomes. |
| Selective reporting (reporting bias) | High risk | A number of outcomes for the neonate were reported incompletely and thus data could not be used in a meta‐analysis: e.g. SE not reported for birthweight in energy‐restricted diet group; and "The mean maximum bilirubin level measured in the two groups was the same." No access to study protocol to further assess the risk of selective reporting. |
| Other bias | High risk | "The reported maternal medical and obstetric histories were similar in the two groups except for a significantly higher proportion of women with a history of preterm labour in the control group." |
Reece 1995.
| Methods | Randomised controlled trial. | |
| Participants | 22 women. A total of 50 women were involved in the trial, but only 22 women were diagnosed with GDM and provided outcome data for this review. Inclusion criteria: women diagnosed with GDM (see notes) between 24 and 29 weeks' gestation. Exclusion criteria: diagnosis of GDM after 29 weeks' gestation. Setting: United States. |
|
| Interventions |
High‐fibre diet (n = 11) Diet containing 80 g fibre per day; 20% daily energy intake derived from fat, and 60% derived from carbohydrate. Standard‐fibre diet (n = 11) ADA diet; diet containing 20 g fibre per day; 30% daily energy intake derived from fat, and 50% derived from carbohydrate. All women: Capillary blood glucose assessments 6 times a day (before and after each meal), twice weekly. |
|
| Outcomes | Data in meta‐analyses for: gestational age at birth; birthweight; gestational weight gain; use of additional pharmacotherapy; glycaemic control (mean blood glucose); maternal hypoglycaemia. | |
| Notes | GDM diagnostic criteria not reported. | |
| Risk of bias | ||
| Bias | Authors' judgement | Support for judgement |
| Random sequence generation (selection bias) | Low risk | Randomisation was done using a random numbers table. |
| Allocation concealment (selection bias) | Unclear risk | Detail regarding allocation concealment was not reported. |
| Blinding of participants and personnel (performance bias) All outcomes | High risk | Women were unlikely to have been blinded. The research dietitian and the diabetes nurse specialist who were responsible for monitoring diet compliance and glycaemic control were unlikely to have been blinded. Unclear whether other research personnel were able to be blinded or not. |
| Blinding of outcome assessment (detection bias) All outcomes | Unclear risk | No information on whether outcome assessors were blinded. |
| Incomplete outcome data (attrition bias) All outcomes | Unclear risk | Women with insulin‐dependent diabetes and GDM were included in the trial. It was reported that 11 women (5 in the standard‐fibre diet group and 6 in the high‐fibre diet) were excluded from the study after randomisation: 1 had a spontaneous abortion, 2 moved away, and 4 from each group were noncompliant. It is unclear how many of these 11 women excluded after randomisation were women with GDM. |
| Selective reporting (reporting bias) | Unclear risk | No access to study protocol; therefore not able to confidently assess the risk of selective reporting. |
| Other bias | Low risk | No other obvious risk of bias. |
Valentini 2012.
| Methods | Randomised controlled trial. | |
| Participants | 20 women. Inclusion criteria: pregnant immigrant women with GDM (see notes). Exclusion criteria: not reported. Setting: Italy. |
|
| Interventions |
Ethnic‐specific diet (n = 10)
Standard healthy diet (n = 10)
All women
|
|
| Outcomes | Data in meta‐analyses for: large‐for‐gestational age; neonatal composite outcome; hypertensive disorders of pregnancy (gestational hypertension); caesarean section; gestational age at birth; macrosomia; small‐for‐gestational age; birthweight; respiratory distress syndrome; neonatal hypoglycaemia; hyperbilirubinaemia; hypocalcaemia; gestational weight gain; adherence to intervention; use of additional pharmacotherapy. | |
| Notes | Screening for GDM was done with a OGCT between weeks 24 and 28 of gestation, and the diagnosis was confirmed with a 100 g OGTT as recommended by the 4th International Workshop Conference on GDM: GDM diagnosed when ≥ 2 values were met or exceeded:
|
|
| Risk of bias | ||
| Bias | Authors' judgement | Support for judgement |
| Random sequence generation (selection bias) | Unclear risk | Described as "the women enrolled were randomly assigned to two groups". |
| Allocation concealment (selection bias) | Unclear risk | As above. |
| Blinding of participants and personnel (performance bias) All outcomes | High risk | Women and dietitian were unlikely to have been blinded. Unclear whether other research personnel were able to be blinded or not. |
| Blinding of outcome assessment (detection bias) All outcomes | Unclear risk | No information on whether outcome assessors were blinded. |
| Incomplete outcome data (attrition bias) All outcomes | Low risk | No loss to follow‐up or post‐randomisation exclusion. |
| Selective reporting (reporting bias) | High risk | Metabolic outcomes reported in Figures, with no variance measures reported; therefore unable to be included in meta‐analyses. No access to study protocol; therefore unable to further assess the risk of selective reporting. |
| Other bias | Low risk | No other obvious risk of bias. |
Wang 2015.
| Methods | Randomised controlled trial. | |
| Participants | 84 women. Inclusion criteria: women diagnosed with GDM (see notes), aged 22 to 38 years and between 24 and 28 weeks' gestation; residents of Changzhou and only performed light physical activity (such as type writing, 6 hours per day); did not have pregnancy‐related complications and had no history of diabetes, hypertension or GDM; willingness to accept dietary intervention, cook and dine out. Exclusion criteria: not reported. Setting: China. |
|
| Interventions |
High unsaturated fat diet (n = 41) Carbohydrates accounted for 50% to 54% of the total energy; fat accounted for 31% to 35% of the total energy; sunflower oil (45 g to 50 g daily) was used as cooking oil. Low unsaturated fat diet (n = 43) Carbohydrates accounted for 55% to 60% of the total energy; fat accounted for 25% to 30% of the total energy, sunflower oil (20 g daily) was used as cooking oil. All women
|
|
| Outcomes | Data in meta‐analyses for: gestational age at birth; preterm birth; macrosomia; birthweight; gestational weight gain; insulin sensitivity (end of intervention IAI); use of additional pharmacotherapy; glycaemic control (end of intervention fasting and 2‐hour postprandial glucose). | |
| Notes | GDM diagnosis was based on 75 g OGTT at 24 to 28 weeks' gestation. The IADPSG diagnostic criteria used for GDM diagnosis: if the glucose concentration exceeded any of:
|
|
| Risk of bias | ||
| Bias | Authors' judgement | Support for judgement |
| Random sequence generation (selection bias) | Unclear risk | Described as "they were randomly divided into 2 groups: 41 and 43 patients were included in the experimental and control groups, respectively." |
| Allocation concealment (selection bias) | Unclear risk | As above. |
| Blinding of participants and personnel (performance bias) All outcomes | High risk | Women and the nutritionist were unlikely to have been blinded. Unclear whether other research personnel were able to be blinded or not. |
| Blinding of outcome assessment (detection bias) All outcomes | Unclear risk | No information on whether outcome assessors were blinded. |
| Incomplete outcome data (attrition bias) All outcomes | Low risk | No loss to follow‐up or post‐randomisation exclusion. |
| Selective reporting (reporting bias) | Unclear risk | No access to study protocol; therefore not able to confidently assess the risk of selective reporting. |
| Other bias | Low risk | No other obvious risk of bias. |
Abbreviations ADA: the American Diabetes Association ADIPS: Australian Diabetes in Pregnancy Society BMI: body mass index CDA: Canadian Diabetes Association DASH: Dietary Approaches to Stop Hypertension g: gram GDM: gestational diabetes mellitus GI: glycaemic index GL: glycaemic load HbA1c: glycated haemoglobin HOMA‐IR: homeostatic model assessment of insulin resistance IADPSG: International Association of Diabetes and Pregnancy Study Group IAI: intermediate acting insulin MET: metabolic equivalent N: number NIPerIER: National Institute of Perinatology Isidro Espinosa de los Reyes OGCT: oral glucose challenge test OGTT: oral glucose tolerance test QUICKI: quantitative insulin sensitivity check index SD: standard deviation SE: standard error WHO: World Health Organization
Characteristics of excluded studies [ordered by study ID]
| Study | Reason for exclusion |
|---|---|
| Cao 2012 | This randomised trial did not compare types of dietary advice. Comprehensive intensive therapy (individualised diabetes education; diet and exercise advice; instructions on how to self‐monitor glucose; and regular review by a diabetes physician) was compared with a standard therapeutic regimen (group education on the importance of diet, exercise and self‐monitoring of glucose; instructions on how to self‐monitor glucose (but not advised to monitor as frequently) for women with GDM. |
| Chua 2008 | This randomised trial did not compare types of dietary advice, but rather assessed magnesium chloride supplementation for women with GDM. |
| Corrado 2011 | This randomised trial did not compare types of dietary advice, but rather compared myoinositol and folic acid with folic acid alone for women with GDM. |
| Deveer 2013 | This randomised trial was not conducted in women with GDM; women with positive 50 g OGCT and negative 100 g OGTT were included. |
| Ehrlich 2014 | This randomised trial did not compare types of dietary advice, but rather assessed a lifestyle intervention (which included diet, exercise and breastfeeding interventions) for women with GDM. |
| Gillen 2004 | This randomised trial did not compare types of dietary advice, but rather compared standard clinical practice also including advice for targeted intakes of foods rich in unsaturated fats, with standard clinical practice, for women with GDM. |
| Gillmer 1986 | This randomised trial did not compare types of dietary advice, but rather compared dietary advice alone or insulin therapy with dietary advice for women with GDM. |
| Gonai 2014 | This randomised trial did not compare types of dietary advice, but rather assessed the effect of lactobacilli GG yogurt for women with GDM. |
| Hernandez 2012 | This was a randomised cross‐over trial assessing a high complex carbohydrate/low‐fat diet and a low‐carbohydrate/higher‐fat diet for women with GDM. |
| Hernandez 2014 | This was a randomised cross‐over trial assessing a high complex carbohydrate/low‐fat diet and a low‐carbohydrate/higher‐fat diet for women with GDM. |
| Hernandez 2016 | This was a randomised cross‐over trial assessing a high complex carbohydrate/low‐fat diet and a low‐carbohydrate/higher‐fat diet for women with GDM. |
| Hosseinzadeh‐Shamsi‐Anar 2012 | This randomised trial did not compare types of dietary advice, but rather assessed vitamin D supplementation for women with GDM. |
| Hu 2014 | This randomised trial did not compare types of dietary advice, but rather assessed a 5‐day low‐GI staple diet for women with GDM. |
| Ilic 1999 | This was a randomised cross‐over trial assessing a saturated fat and monounsaturated fat diet for women with GDM. |
| Jamilian 2016 | This randomised trial did not compare types of dietary advice, but rather assessed omega‐3 fatty acid supplementation for women with GDM. |
| Knopp 1991 | This was not a randomised controlled trial; it was a literature review management of GDM. |
| Li 2013 | This randomised trial did not compare types of dietary advice, but rather assessed omega‐3 fatty acid supplementation for women with GDM |
| Lindsay 2014 | This randomised trial did not assess dietary advice for women with GDM; it assessed a probiotic capsule for obese pregnant women (excluding women with GDM). |
| Lindsay 2015 | This randomised trial did not compare types of dietary advice, but rather assessed a probiotic for women with GDM. |
| Louie 2013 | This was a randomised cross‐over trial assessing a carbohydrate‐controlled, low‐GI bread‐based breakfast and an energy and macronutrient matched high‐GI bread‐based breakfast for women with GDM. |
| Ma 2011 | This randomised trial included women with 'abnormal glucose metabolism'; not specifically women with GDM. |
| Nolan 1984 | This was a randomised cross‐over trial assessing a low‐fat, high unrefined‐carbohydrate diet and a low‐carbohydrate diet. |
| Perichart‐Perara 2012 | This randomised trial included women with GDM and women with type 2 diabetes; outcome data have not been reported separately for the group of women with GDM in the published paper. |
| Reader 2006 | This randomised trial did not compare types of dietary advice, but rather compared different types of care for women with GDM. Women in the intervention group were cared according to the nutrition practice guidelines for GDM, that emphasised 3 major areas of setting individualised medical nutrition therapy goals, blood glucose monitoring, a minimum of 3 nutrition visits with follow‐ups via phone or in person. Women in the control group received usual prenatal nutrition care. |
| Samimi 2015 | This randomised trial did not compare types of dietary advice, but rather assessed omega‐3 fatty acid supplementation for women with GDM. |
| Thangaratinam 2014 | This ongoing randomised trial was not designed to be conducted in women with GDM; eligible participants are pregnant women with metabolic risk factors (i.e. at least 1 of 1) BMI ≥ 30 kg/m²; 2) raised serum triglycerides ≥ 1.7 mmol/L; 3) raised blood pressure of systole ≥ 140 mm Hg or diastole ≥ 90 mm Hg). |
| Yu 2013 | This randomised trial did not compare types of dietary advice, but rather assessed a nutritional liquid supplement for women with GDM. |
| Yuan 2015 | This randomised trial did not compare types of dietary advice, but rather assessed capsaicin for women with GDM. |
BMI: body mass index GDM: gestational diabetes mellitus GI: glycaemic index OGCT: oral glucose challenge test
Differences between protocol and review
In this update of the review:
we have updated our primary and secondary review outcomes in line with those that are/will be used in other Cochrane Pregnancy and Childbirth GDM reviews;
we have updated the methods in line with those in the standard template used by the Cochrane Pregnancy and Childbirth Group;
we have used the GRADE approach to assess the quality of the body of evidence and we have included 'Summary of findings' tables.
Contributions of authors
For this update of the review: Shanshan Han, Emer Van Ryswyk and Emily Shephered assessed studies for inclusion, extracted data and assessed the risk of bias of included studies. Shanshan Han and Emily Shepherd drafted the update, and all authors reviewed drafts and contributed to the final version.
For the previous version of the review: Shanshan Han wrote drafts of the protocol and review, with Caroline Crowther and Philippa Middleton contributing to data extraction, and commenting on and editing all drafts. Emer Van Ryswyk was involved in data extraction and assessment of risk of bias of the included studies.
Sources of support
Internal sources
ARCH, Robinson Research Institute, The University of Adelaide, Australia.
External sources
NHMRC: National Health and Medical Research Council, Australia.
-
National Institute for Health Research (NIHR), UK.
Cochrane Programme Grant Project: 13/89/05 – Pregnancy and childbirth systematic reviews to support clinical guidelines, UK
Declarations of interest
Shanshan Han: none known.
Philippa Middleton: none known.
Emily Shepherd: none known.
Emer Van Ryswyk: none known.
Caroline A Crowther: none known.
Edited (no change to conclusions)
References
References to studies included in this review
Asemi 2013a {published data only}
- Asemi Z, Tabassi Z, Samimi M, Fahiminejad T, Esmaillzadeh A. Favourable effects of the Dietary Approaches to Stop Hypertension diet on glucose tolerance and lipid profiles in gestational diabetes: a randomised clinical trial. British Journal of Nutrition 2013;109(11):2024‐30. [DOI] [PubMed] [Google Scholar]
Asemi 2013b {published data only}
- Asemi Z, Samimi M, Tabassi Z, Sabihi SS, Esmaillzadeh A. A randomized controlled clinical trial investigating the effect of DASH diet on insulin resistance, inflammation, and oxidative stress in gestational diabetes. Nutrition 2013;29(4):619‐24. [DOI] [PubMed] [Google Scholar]
Asemi 2014 {published data only}
- Asemi Z, Samimi M, Tabassi Z, Esmaillzadeh A. The effect of DASH diet on pregnancy outcomes in gestational diabetes: A randomized controlled clinical trial. European Journal of Clinical Nutrition 2014;68(4):490‐5. [DOI] [PubMed] [Google Scholar]
Balas‐Nakash 2010 {published data only}
- Balas‐Nakash M, Rodriguez‐Cano A, Munoz‐Manrique C, Vasquez‐Pena P, Perichart‐Perera O. Adherence to a medical nutrition therapy program in pregnant women with diabetes, measured by three methods, and its association with glycemic control [Tres metodos para medir la adherencia a un programa de terapia medica y nutricia en mujeres embarazadas con diabetes y su asociacion con el control glucemico]. Revista De Investigacion Clinica 2010;62(3):235‐43. [PubMed] [Google Scholar]
Bo 2014 {published data only}
Cypryk 2007 {published data only}
- Cypryk K, Kaminska P, Kosinski M, Pertynska‐Marczewska M, Lewinski A. A comparison of the effectiveness, tolerability and safety of high and low carbohydrate diets in women with gestational diabetes. Endokrynologia Polska 2007;58(4):314‐9. [PubMed] [Google Scholar]
Garner 1997 {published data only}
- Garner P, Okun N, Keely E, Wells G, Perkins S, Sylvain J, et al. A randomized controlled trial of strict glycemic control and tertiary level obstetric care versus routine obstetric care in the management of gestational diabetes: a pilot study. American Journal of Obstetrics and Gynecology 1997;177(1):190‐5. [DOI] [PubMed] [Google Scholar]
Grant 2011 {published and unpublished data}
- Grant SM, Wolever TMS, O'Connor DL, Nisenbaum R, Josse RG. Effect of a low glycaemic index diet on blood glucose in women with gestational hyperglycaemia. Diabetes Research and Clinical Practice 2011;91(1):15‐22. [DOI] [PubMed] [Google Scholar]
Jamilian 2015 {published data only}
- Jamilian M, Asemi Z. The effect of soy intake on metabolic profiles of women with gestational diabetes mellitus. Journal of Clinical Endocrinology and Metabolism 2015;100(12):4654‐61. [DOI] [PubMed] [Google Scholar]
Lauszus 2001 {published and unpublished data}
- Lauszus FF, Rasmussen OW, Henriksen JE, Klebe JG, Jensen L, Lauszus KS, et al. Effect of a high monounsaturated fatty acid diet on blood pressure and glucose metabolism in women with gestational diabetes mellitus. European Journal of Clinical Nutrition 2001;55(6):436‐43. [DOI] [PubMed] [Google Scholar]
Louie 2011 {published and unpublished data}
- Louie JC, Markovic TP, Perera N, Foote D, Petocz P, Ross GP, et al. Randomized controlled trial investigating the effects of a low‐glycemic index diet on pregnancy outcomes in gestational diabetes mellitus. Diabetes Care 2011;34(11):2341‐6. [DOI] [PMC free article] [PubMed] [Google Scholar]
- Louie JC, Markovic TP, Ross TP, Foote D, Brand‐Miller JC. Effect of a low glycaemic index diet in gestational diabetes mellitus on post‐natal outcomes after 3 months of birth: a pilot follow‐up study. Maternal and Child Nutrition 2015; Vol. 11, issue 3:409‐14. [DOI] [PMC free article] [PubMed]
Ma 2015 {published data only}
- Ma WJ, Huang ZH, Huang BX, Qi BH, Zhang YJ, Xiao BX, et al. Intensive low‐glycaemic‐load dietary intervention for the management of glycaemia and serum lipids among women with gestational diabetes: a randomized control trial. Public Health Nutrition 2015;18(8):1506‐13. [DOI] [PMC free article] [PubMed] [Google Scholar]
Magee 1990 {published data only}
- Magee MS, Knopp RH, Benedetti TJ. Metabolic effects of 1200‐kcal diet in obese pregnant women with gestational diabetes. Diabetes 1990;39:234‐40. [DOI] [PubMed] [Google Scholar]
Moreno‐Castilla 2013 {published data only}
- Moreno‐Castilla C, Hernandez M, Bergua M, Alvarez MC, Arce MA, Rodriguez K, et al. Low carbohydrate diet for the treatment of gestational diabetes mellitus: a randomized controlled trial. Diabetes Care 2013;36(8):2233‐8. [DOI] [PMC free article] [PubMed] [Google Scholar]
Moses 2009 {published and unpublished data}
- Moses RG, Barker M, Winter M, Petocz P, Brand‐Miller JC. Can a low‐glycemic index diet reduce the need for insulin in gestational diabetes mellitus? A randomized trial. Diabetes Care 2009;32(6):996‐1000. [DOI] [PMC free article] [PubMed] [Google Scholar]
Rae 2000 {published data only}
- Rae A, Bond D, Evans S, North F, Roberman B, Walters B. A randomised controlled trial of dietary energy restriction in the management of obese women with gestational diabetes. Australian and New Zealand Journal of Obstetrics and Gynaecology 2000;40(4):416‐22. [DOI] [PubMed] [Google Scholar]
Reece 1995 {published data only}
- Reece EA, Hagay Z, Gay LJ, O'Connor T, DeGennaro N, Homko CJ, et al. A randomized clinical trial of a fiber‐enriched diabetic diet vs. the standard American Diabetes Association‐recommended diet in the management of diabetes mellitus in pregnancy. Journal of Maternal‐Fetal Investigation 1995;5:8‐12. [Google Scholar]
Valentini 2012 {published data only}
- Valentini R, Dalfra MG, Masin M, Barison A, Marialisa M, Pegoraro E, et al. A pilot study on dietary approaches in multiethnicity: two methods compared. International Journal of Endocrinology 2012;2012:985136. [DOI] [PMC free article] [PubMed] [Google Scholar]
Wang 2015 {published data only}
- Wang H, Jiang H, Yang L, Zhang M. Impacts of dietary fat changes on pregnant women with gestational diabetes mellitus: a randomized controlled study. Asia Pacific Journal of Clinical Nutrition 2015;24(1):58‐64. [DOI] [PubMed] [Google Scholar]
References to studies excluded from this review
Cao 2012 {published data only}
- Cao X, Wang Z, Yang C, Mo X, Xiu L, Li Y, et al. Comprehensive intensive therapy for Chinese gestational diabetes benefits both newborns and mothers. Diabetes Technology and Therapeutics 2012;14(11):1002‐7. [DOI] [PubMed] [Google Scholar]
Chua 2008 {published data only}
- Chua CV, Inocentes P, Yap M, Brito I. A randomized controlled study on the effect of magnesium chloride supplementation in gestational diabetes mellitus patients. Philippine Journal of Obstetrics and Gynecology 2008;32(4):163‐8. [Google Scholar]
Corrado 2011 {published data only}
- Corrado F, D'Anna R, Veste G, Giordano D, Pintaudi B, Santamaria A, et al. The effect of myoinositol supplementation on insulin resistance in patients with gestational diabetes. Diabetic Medicine 2011;28(8):972‐5. [DOI] [PubMed] [Google Scholar]
Deveer 2013 {published data only}
- Deveer R, Deveer M, Akbaba E, Engin‐Ustun Y, Aydogan P, Celikkaya H, et al. The effect of diet on pregnancy outcomes among pregnant with abnormal glucose challenge test. European Review for Medical and Pharmacological Sciences 2013;17(9):1258‐61. [PubMed] [Google Scholar]
Ehrlich 2014 {published data only}
- Ehrlich SF, Hedderson MM, Feng J, Crites Y, Quesenberry CP, Ferrara A. Lifestyle intervention improves postpartum fasting glucose levels in women with gestational diabetes. Diabetes 2014;63(Suppl 1):A95, Abstract no: 363‐OR. [Google Scholar]
Gillen 2004 {published data only}
- Gillen LJ, Tapsell LC. Advice that includes food sources of unsaturated fat supports future risk management of gestational diabetes mellitus. Journal of the American Dietetic Association 2004;104:1863‐7. [DOI] [PubMed] [Google Scholar]
Gillmer 1986 {published data only}
- Gillmer MDG, Maresh M, Beard RW, Elkeles RS, Alderson C, Bloxham B. Low energy diets in the treatment of gestational diabetes. Acta Endocrinologica. Supplementum 1986;277:44‐9. [DOI] [PubMed] [Google Scholar]
Gonai 2014 {published data only}
- Gonai M, Nakadaira I, Kurasaki K, Hamano K. The effects of lactobacilli on glycemic control and the secretion of glucagon‐like peptide‐1 in Japanese gestational diabetes mellitus patients. Diabetes 2014;63(Suppl 1):A333, Abstract no: 1278‐P. [Google Scholar]
Hernandez 2012 {published data only}
- Hernandez TL, Barbour LA, Friedman JE, Reece MS, Krause MA, Pelt RE. Higher carboydrate versus higher fat diet in gestational diabetes: a pilot study. Journal of Obstetric, Gynecologic, and Neonatal Nursing 2012;41:S124. [Google Scholar]
- Hernandez TL, Vanpelt RE, Krause MA, Reece MS, Donahoo WT, Mande A, et al. Higher carbohydrate vs. higher fat diet in gestational diabetes: A randomized study. Diabetes 2012;61 Suppl 1:A50. [Google Scholar]
Hernandez 2014 {published data only}
- Hernandez TL, Pelt RE, Anderson MA, Daniels LJ, West NA, Donahoo WT, et al. A higher‐complex carbohydrate diet in gestational diabetes mellitus achieves glucose targets and lowers postprandial lipids: a randomized crossover study. Diabetes Care 2014;37(5):1254‐62. [DOI] [PMC free article] [PubMed] [Google Scholar]
Hernandez 2016 {published data only}
- Hernandez TL, Pelt RE, Anderson MA, Reece MS, Reynolds RM, Houssaye BA, et al. Women with gestational diabetes randomized to a higher‐complex carbohydrate/low‐fat diet manifest lower adipose tissue insulin resistance, inflammation, glucose, and free fatty acids: a pilot study. Diabetes Care 2016;39(1):39‐42. [DOI] [PMC free article] [PubMed] [Google Scholar]
Hosseinzadeh‐Shamsi‐Anar 2012 {published data only}
- Hosseinzadeh‐Shamsi‐Anar M, Mozaffari‐Khosravi H, Salami MA, Hadinedoushan H, Mozayan MR. The efficacy and safety of a high dose of vitamin d in mothers with gestational diabetes mellitus: A randomized controlled clinical trial. Iranian Journal of Medical Sciences 2012;37(3):159‐65. [PMC free article] [PubMed] [Google Scholar]
Hu 2014 {published data only}
- Hu ZG, Tan RS, Jin D, Li W, Zhou XY. A low glycemic index staple diet reduces postprandial glucose values in Asian women with gestational diabetes mellitus. Journal of Investigative Medicine 2014;62(8):975‐9. [DOI] [PubMed] [Google Scholar]
Ilic 1999 {published data only}
- Ilic S, Jovanovic L, Pettitt DJ. Comparison of the effect of saturated and monounsaturated fat on postprandial plasma glucose and insulin concentration in women with gestational diabetes mellitus. American Journal of Perinatology 1999;16(9):489‐95. [DOI] [PubMed] [Google Scholar]
Jamilian 2016 {published data only}
- Jamilian M, Samimi M, Kolahdooz F, Khalaji F, Razavi M, Asemi Z. Omega‐3 fatty acid supplementation affects pregnancy outcomes in gestational diabetes: a randomized, double‐blind, placebo‐controlled trial. Journal of Maternal‐Fetal and Neonatal Medicine 2016;29(4):669‐75. [DOI] [PubMed] [Google Scholar]
Knopp 1991 {published data only}
- Knopp RH, Magee MS, Raisys V, Benedetti T, Bonet B. Hypocaloric diets and ketogenesis in the management of obese gestational diabetic women. Journal of the American College of Nutrition 1991;10(6):649‐67. [DOI] [PubMed] [Google Scholar]
Li 2013 {published data only}
- NCT01912170. Effect of omega‐3 fatty acids on insulin sensitivity in Chinese gestational diabetic patients. clinicaltrials.gov/ct2/show/NCT01912170 Date first received: 27 July 2013.
Lindsay 2014 {published data only}
- ISRCTN97241163. A randomised control trial of probiotics in pregnancy to reduce maternal glucose in obese and gestational diabetic women. isrctn.com/ISRCTN97241163 Date first recieved: 9 March 2012.
- Lindsay KL, Kennelly M, Culliton M, Smith T, Maguire OC, Shanahan F, et al. Probiotics in obese pregnancy do not reduce maternal fasting glucose: a double‐blind, placebo‐controlled, randomized trial (Probiotics in Pregnancy Study). American Journal of Clinical Nutrition 2014;99(6):1432‐9. [DOI] [PubMed] [Google Scholar]
Lindsay 2015 {published data only}
- Lindsay KL, Brennan L, Kennelly MA, Maguire OC, Smith T, Curran S, et al. Impact of probiotics in women with gestational diabetes mellitus on metabolic health: a randomized controlled trial. American Journal of Obstetrics and Gynecology 2015;212:496.e1‐11. [DOI] [PubMed] [Google Scholar]
Louie 2013 {published data only}
- Louie JCY, Markovic TP, Ross GP, Foote D, Brand‐Miller JC. Timing of peak blood glucose after breakfast meals of different glycemic index in women with gestational diabetes. Nutrients 2013;5(1):1‐9. [DOI] [PMC free article] [PubMed] [Google Scholar]
Ma 2011 {published data only}
- Ma WJ, Qi BH, Zhang YJ, Huang ZH, Xiao BX, Li YH, et al. Application of different nutrition therapies in pregnancy with abnormal glucose metabolism. Zhonghua yu fang yi xue za zhi [Chinese Journal of Preventive Medicine] 2011;45(5):426‐9. [PubMed] [Google Scholar]
Nolan 1984 {published data only}
- Nolan CJ. Improved glucose tolerance in gestational diabetic women on a low fat, high unrefined carbohydrate diet. Australian and New Zealand Journal of Obstetrics and Gynaecology 1984;24(3):174‐7. [DOI] [PubMed] [Google Scholar]
Perichart‐Perara 2012 {published data only}
- Perichart‐Perera O, Balas‐Nakash M, Rodríguez‐Cano A, Legorreta‐Legorreta J, Parra‐Covarrubias A, Vadillo‐Ortega F. Low glycemic index carbohydrates versus all types of carbohydrates for treating diabetes in pregnancy: a randomized clinical trial to evaluate the effect of glycemic control. International Journal of Endocrinology 2012;2012:296017. [DOI: 10.1155/2012/296017] [DOI] [PMC free article] [PubMed] [Google Scholar]
Reader 2006 {published data only}
- Reader D, Splett P, Gunderson EP, for the Diabetes Care and Education Dietetic Practice Group. Impact of gestational diabetes mellitus nutrition practice guidelines implemented by registered dietitians on pregnancy outcomes. Journal of the American Dietetic Association 2006;106(9):1426‐33. [DOI] [PubMed] [Google Scholar]
Samimi 2015 {published data only}
- Samimi M, Jamilian M, Asemi Z, Esmaillzadeh A. Effects of omega‐3 fatty acid supplementation on insulin metabolism and lipid profiles in gestational diabetes: Randomized, double‐blind, placebo‐controlled trial. Clinical Nutrition 2015;34(3):385‐93. [DOI] [PubMed] [Google Scholar]
Thangaratinam 2014 {published data only}
- NCT02218931. Effect of simple, targeted diet in pregnant women with metabolic risk factors on pre‐eclampsia (ESTEEM): a randomised trial. clinicaltrials.gov/ct2/show/NCT02218931 Date first received: 11 July 2014.
Yu 2013 {published data only}
- Yu XY, Zhang H. Effects of a nutritional liquid supplement designed for diabetes mellitus on postprandial glucose and pregnancy outcomes in patients with gestational diabetes mellitus. Zhonghua Yi Xue Za Zhi 2013;93(43):3450‐3. [PubMed] [Google Scholar]
Yuan 2015 {published data only}
- Yuan LJ, Qin Y, Wang L, Zeng Y, Chang H, Wang J, et al. Capsaicin‐containing chili improved postprandial hyperglycemia, hyperinsulinemia, and fasting lipid disorders in women with gestational diabetes mellitus and lowered the incidence of large‐for‐gestational‐age newborns. Clinical Nutrition 2016;35(2):388‐93. [DOI] [PubMed] [Google Scholar]
Additional references
ACOG 2005
- American College of Obstetricians and Gynecologists (ACOG). ACOG Committee Opinion number 315, September 2005. Obesity in pregnancy. Obstetrics and Gynecology 2005;106(3):671‐5. [DOI] [PubMed] [Google Scholar]
ACOG 2013
- American College of Obstetricians and Gynecologists (ACOG) Committee on Practice Bulletins ‐ Obstetrics. Practice Bulletin No. 137: Gestational diabetes mellitus. Obstetrics and Gynecology 2013;122(2 Pt 1):406‐16. [DOI] [PubMed] [Google Scholar]
Alwan 2009
- Alwan N, Tuffnell DJ, West J. Treatments for gestational diabetes. Cochrane Database of Systematic Reviews 2009, Issue 3. [DOI: 10.1002/14651858.CD003395.pub2] [DOI] [PMC free article] [PubMed] [Google Scholar]
Anderberg 2010
- Anderberg E, Kallen K, Berntorp K. The impact of gestational diabetes mellitus on pregnancy outcome comparing different cut‐off criteria for abnormal glucose tolerance. Acta Obstetricia et Gynecologica Scandinavica 2010;89(12):1532‐7. [DOI] [PubMed] [Google Scholar]
Atkinson 2008
- Atkinson FS, Foster‐Powell K, Brand‐Miller JC. International tables of glycemic index and glycemic load values: 2008. Diabetes Care 2008;31(12):2281‐3. [DOI] [PMC free article] [PubMed] [Google Scholar]
Baker 1994
- Barker D. Mothers, Babies and Diseases in Later Life. London: BMJ Publishing Group, 1994. [Google Scholar]
Balsells 2015
- Balsells M, García‐Patterson A, Solà I, Roqué M, Gich I, Corcoy R. Glibenclamide, metformin, and insulin for the treatment of gestational diabetes: a systematic review and meta‐analysis. BMJ 2015;350:h102. [DOI] [PMC free article] [PubMed] [Google Scholar]
Bellamy 2009
- Bellamy L, Casas JP, Hingorani AD, Williams D. Type 2 diabetes mellitus after gestational diabetes: a systematic review and meta‐analysis. Lancet 2009;373(9677):1173‐9. [DOI] [PubMed] [Google Scholar]
Bottalico 2007
- Bottalico JN. Recurrent gestational diabetes: risk factors, diagnosis, management, and implications. Seminars in Perinatology 2007;31(3):176‐84. [DOI] [PubMed] [Google Scholar]
Brown 2015
- Brown J, Alwan NA, West J, Brown S, McKinlay CJD, et al. Lifestyle interventions for the treatment of women with gestational diabetes. Cochrane Database of Systematic Reviews 2015, Issue 11. [DOI: 10.1002/14651858.CD011970] [DOI] [PMC free article] [PubMed] [Google Scholar]
Brown 2016
- Brown J, Crawford TJ, Alsweiler J, Crowther CA. Dietary supplementation with myo‐inositol in women during pregnancy for treating gestational diabetes. Cochrane Database of Systematic Reviews 2016, Issue 9. [DOI: 10.1002/14651858.CD012048.pub2] [DOI] [PMC free article] [PubMed] [Google Scholar]
Chasan‐Taber 2008
- Chasan‐Taber L, Schmidt MD, Pekow P, Sternfeld B, Manson JE, Solomon CG. Physical activity and gestational diabetes mellitus among Hispanic women. Journal of Women's Health 2008;17(6):999‐1008. [DOI] [PubMed] [Google Scholar]
Cheung 2009
- Cheung NW. The management of gestational diabetes. Journal of Vascular Health and Risk Management 2009;5(1):153‐64. [DOI] [PMC free article] [PubMed] [Google Scholar]
Clapp 2002
- Clapp JF. Maternal carbohydrate intake and pregnancy outcome. Proceedings of the Nutrition Society 2002;61(1):45‐50. [DOI] [PubMed] [Google Scholar]
Clapp 2006
- Clapp JF. Effects of diet and exercise on insulin resistance during pregnancy. Metabolic Syndrome and Related Disorders 2006;4(2):84‐90. [DOI] [PubMed] [Google Scholar]
Colagiuri 2009
- Colagiuri R, Girgis S, Eigenmann C, Gomez M, Griffiths R. National Evidence Based Guideline for Patient Education in Type 2 Diabetes. Canberra: Diabetes Australia and the NHMRC, 2009. [Google Scholar]
Crowther 2005
- Crowther CA, Hiller JE, Moss JR, McPhee AJ, Jeffries WS, Robinson JS, et al. Effect of treatment of gestational diabetes mellitus on pregnancy outcomes. New England Journal of Medicine 2005;352(24):2477‐86. [DOI] [PubMed] [Google Scholar]
Cypryk 2008
- Cypryk K, Szymczak W, Czupryniak L, Sobczak M, Lewinski A. Gestational diabetes mellitus ‐ an analysis of risk factors. Endokrynologia Polska (Warszawa) 2008;59(5):393‐7. [PubMed] [Google Scholar]
Dabelea 2005
- Dabelea D, Snell‐Bergeon JK, Hartsfield CL, Bischoff KJ, Hamman RF, McDuffie RS, et al. Increasing prevalence of gestational diabetes mellitus (GDM) over time and by birth cohort: Kaiser Permanente of Colorado GDM Screening Program. Diabetes Care 2005;28(3):579‐84. [DOI] [PubMed] [Google Scholar]
De Veciana 1995
- Veciana M, Major CA, Morgan MA, Asrat T, Toohey JS, Lien JM, et al. Postprandial versus preprandial blood glucose monitoring in women with gestational diabetes mellitus requiring insulin therapy. New England Journal of Medicine 1995;333(19):1237‐41. [DOI] [PubMed] [Google Scholar]
Devlieger 2008
- Devlieger R, Casteels K, Assche FA. Reduced adaptation of the pancreatic B cells during pregnancy is the major causal factor for gestational diabetes: current knowledge and metabolic effects on the offspring. Acta Obstetricia et Gynecologica Scandinavica 2008;87(12):1266‐70. [DOI] [PubMed] [Google Scholar]
Dodd 2007
- Dodd JM, Crowther CA, Antoniou G, Baghurst P, Robinson JS. Screening for gestational diabetes: the effect of varying blood glucose definitions in the prediction of adverse maternal and infant health outcomes. Australian and New Zealand Journal of Obstetrics and Gynaecology 2007;47(4):307‐12. [DOI] [PubMed] [Google Scholar]
Dornhorst 2002
- Dornhorst A, Frost G. The principles of dietary management of gestational diabetes: reflection on current evidence. Journal of Human Nutrition and Dietetics 2002;15(2):145‐56. [DOI] [PubMed] [Google Scholar]
Esakoff 2009
- Esakoff TF, Cheng YW, Sparks TN, Caughey AB. The association between birthweight 4000 g or greater and perinatal outcomes in patients with and without gestational diabetes mellitus. American Journal of Obstetrics and Gynecology 2009;200(6):672.e1‐4. [DOI] [PubMed] [Google Scholar]
Falavigna 2012
- Falavigna M, Schmidt MI, Trujillo J, Alves LF, Wendland ER, Torloni MR, et.al. Effectiveness of gestational diabetes treatment: a systematic review with quality of evidence assessment. Diabetes Research and Clinical Practice 2012;98(3):396‐405. [DOI] [PubMed] [Google Scholar]
Guerrero‐Romero 2010
- Guerrero‐Romero F, Aradillas‐García C, Simental‐Mendia LE, Monreal‐Escalante E, Cruz Mendoza E, Rodríguez‐Moran M. Birth weight, family history of diabetes, and metabolic syndrome in children and adolescents. Journal of Pediatrics 2010;156(5):719‐23. [DOI] [PubMed] [Google Scholar]
Harder 2009
- Harder T, Roepke K, Diller N, Stechling Y, Dudenhausen JW, Plagemann A. Birth weight, early weight gain, and subsequent risk of type 1 diabetes: systematic review and meta‐analysis. American Journal of Epidemiology 2009;169(12):1428‐36. [DOI] [PubMed] [Google Scholar]
Hedderson 2010
- Hedderson MM, Gunderson EP, Ferrara A. Gestational weight gain and risk of gestational diabetes mellitus. Obstetrics and Gynecology 2010;115(3):597‐604. [DOI] [PMC free article] [PubMed] [Google Scholar]
Henriksen 2008
- Henriksen T. The macrosomic fetus: a challenge in current obstetrics. Acta Obstetricia et Gynecologica Scandinavica 2008;87(2):134‐45. [DOI] [PubMed] [Google Scholar]
Higgins 2011
- Higgins JPT, Green S, editors. Cochrane Handbook for Systematic Reviews of Interventions Version 5.1.0 [updated March 2011]. The Cochrane Collaboration, 2011. Available from www.cochrane‐handbook.org.
Hoffman 1998
- Hoffman L, Nolan C, Wilson JD, Oats JJ, Simmons D. Gestational diabetes mellitus‐‐management guidelines. The Australasian Diabetes in Pregnancy Society. Medical Journal of Australia 1998;169(2):93‐7. [DOI] [PubMed] [Google Scholar]
Horvath 2010
- Horvath K, Koch K, Jeitler K, Matyas E, Bender R, Bastian H, et. al. Effects of treatment in women with gestational diabetes mellitus: systematic review and meta‐analysis. BMJ 2010;340:c1395. [DOI] [PMC free article] [PubMed] [Google Scholar]
IOM 2009
- Rasmussen KM, Yaktine AL, Institute of Medicine (US) and National Research Council (US) Committee to Reexamine IOM Pregnancy Weight Guidelines. Weight Gain During Pregnancy: Reexamining the Guidelines. Washington, DC: National Academies Press, 2009. [PubMed] [Google Scholar]
Jastrow 2010
- Jastrow N, Roberge S, Gauthier RJ, Laroche L, Duperron L, Brassard N, et al. Effect of birth weight on adverse obstetric outcomes in vaginal birth after cesarean delivery. Obstetrics and Gynecology 2010;115(2 Pt 1):338‐43. [DOI] [PubMed] [Google Scholar]
Jenkins 1981
- Jenkins DJ, Wolever TM, Taylor RH, Barker H, Fielden H, Baldwin JM, et al. Glycemic index of foods: a physiological basis for carbohydrate exchange. American Journal of Clinical Nutrition 1981;34(3):362‐6. [DOI] [PubMed] [Google Scholar]
Ju 2008
- Ju H, Rumbold AR, Willson KJ, Crowther CA. Borderline gestational diabetes mellitus and pregnancy outcomes. BMC Pregnancy and Childbirth 2008;8:31. [DOI] [PMC free article] [PubMed] [Google Scholar]
Kim 2002
- Kim C, Newton KM, Knopp RH. Gestational diabetes and the incidence of type 2 diabetes: a systematic review. Diabetes Care 2002;25:1862‐8. [DOI] [PubMed] [Google Scholar]
Kim 2010a
- Kim C. Gestational diabetes: risks, management, and treatment options. International Journal of Women's Health 2010;7(2):339‐51. [DOI] [PMC free article] [PubMed] [Google Scholar]
Kim 2010b
- Kim SY, England L, Wilson HG, Bish C, Satten GA, Dietz P. Percentage of gestational diabetes mellitus attributable to overweight and obesity. American Journal of Public Health 2010;100(6):1047‐52. [DOI] [PMC free article] [PubMed] [Google Scholar]
Landon 2009
- Landon MB, Spong CY, Thom E, Carpenter MW, Ramin SM, Casey B, et al. A multicenter, randomized trial of treatment for mild gestational diabetes. New England Journal of Medicine 2009;361(14):1339‐48. [DOI] [PMC free article] [PubMed] [Google Scholar]
Langer 2005
- Langer O, Yogev Y, Most O, Xenakis EM. Gestational diabetes: the consequences of not treating. American Journal of Obstetrics and Gynecology 2005;192(4):989‐97. [DOI] [PubMed] [Google Scholar]
Louie 2010
- Louie JC, Brand‐Miller JC, Markovic TP, Ross GP, Moses RG. Glycemic index and pregnancy: a systematic literature review. Journal of Nutrition and Metabolism 2010;2010:282464. [DOI] [PMC free article] [PubMed] [Google Scholar]
Major 1998
- Major CA, Henry MJ, Veciana M, Morgan MA. The effects of carbohydrate restriction in patients with diet‐controlled gestational diabetes. Obstetrics and Gynecology 1998;91(4):600‐4. [DOI] [PubMed] [Google Scholar]
Metzger 1998
- Metzger BE, Coustan DR. Summary and recommendations of the Fourth International Workshop‐Conference on Gestational Diabetes Mellitus. The Organizing Committee. Diabetes Care 1998;21(Suppl 2):B161‐7. [PubMed] [Google Scholar]
Metzger 2007
- Metzger BE, Buchanan TA, Coustan DR, Leiva A, Dunger DB, Hadden DR. Summary and recommendations of the Fifth International Workshop‐Conference on Gestational Diabetes Mellitus. Diabetes Care 2007;30(Suppl 2):S251‐60. [DOI] [PubMed] [Google Scholar]
Metzger 2008
- HAPO Study Cooperative Research Group, Metzger BE, Lowe LP, Dyer AR, Trimble ER, Chaovarindr U, Coustan DR, et al. Hyperglycemia and adverse pregnancy outcomes. New England Journal of Medicine 2008;358(19):1991‐2002. [DOI] [PubMed] [Google Scholar]
Ministry of Health 2014
- Ministry of Health. Screening, Diagnosis and Management of Gestational Diabetes in New Zealand: A clinical practice guideline. Ministry of Health. Wellington, 2014.
Morisset 2010
- Morisset AS, St‐Yves A, Veillette J, Weisnagel SJ, Tchernof A, Robitaille J. Prevention of gestational diabetes mellitus: a review of studies on weight management. Diabetes Metabolism Research and Reviews 2010;26(1):17‐25. [DOI] [PubMed] [Google Scholar]
Morrison 2008
- Morrison JA, Friedman LA, Wang P, Glueck CJ. Metabolic syndrome in childhood predicts adult metabolic syndrome and type 2 diabetes mellitus 25 to 30 years later. Journal of Pediatrics 2008;152(2):201‐6. [DOI] [PubMed] [Google Scholar]
Mulla 2010
- Mulla WR, Henry TQ, Homko CJ. Gestational diabetes screening after HAPO: has anything changed?. Current Diabetes Reports 2010;10(3):224‐8. [DOI] [PubMed] [Google Scholar]
NICE 2015
- National Institute for Health and Clinical Excellence (NICE). Diabetes in Pregnancy: Management of Diabetes and its Complications from Pre‐conception to the Postnatal Period. NICE clinical guideline [NG3]. London: NICE, 2015. [Google Scholar]
Petitt 1985
- Petitt DJ, Bennett PH, Knowler WC, Baird HR, Aleck KA. Gestational diabetes mellitus and impaired glucose tolerance during pregnancy. Long‐term effects on obesity and glucose tolerance in the offspring. Diabetes 1985;34(Suppl 2):119‐22. [DOI] [PubMed] [Google Scholar]
Petry 2010
- Petry CJ. Gestational diabetes: risk factors and recent advances in its genetics and treatment. British Journal of Nutrition 2010;104(6):775‐87. [DOI] [PubMed] [Google Scholar]
Pettitt 1993
- Pettitt DJ, Nelson RG, Saad MF, Bennett PH, Knowler WC. Diabetes and obesity in the offspring of Pima Indian women with diabetes during pregnancy. Diabetes Care 1993;16(1):310‐4. [DOI] [PubMed] [Google Scholar]
Reader 2007
- Reader DM. Medical nutrition therapy and lifestyle interventions. Diabetes Care 2007;30(Suppl 2):S188‐93. [DOI] [PubMed] [Google Scholar]
Reece 2009
- Reece EA, Leguizamon G, Wiznitzer A. Gestational diabetes: the need for a common ground. Lancet 2009;373(9677):1789‐97. [DOI] [PubMed] [Google Scholar]
RevMan 2014 [Computer program]
- The Nordic Cochrane Centre, The Cochrane Collaboration. Review Manager (RevMan). Version 5.3. Copenhagen: The Nordic Cochrane Centre, The Cochrane Collaboration, 2014.
Rizzo 1997
- Rizzo TA, Metzger BE, Dooley SL, Cho NH. Early malnutrition and child neurobehavioral development: insights from the study of children of diabetic mothers. Child Development 1997;68(1):26‐38. [PubMed] [Google Scholar]
Romon 2001
- Romon M, Nuttens MC, Vambergue A, Verier‐Mine O, Biausque S, Lemaire C, et al. Higher carbohydrate intake is associated with decreased incidence of newborn macrosomia in women with gestational diabetes. Journal of the American Dietetic Association 2001;101(8):897‐902. [DOI] [PubMed] [Google Scholar]
Silva 2010
- Silva JC, Pacheco C, Bizato J, Souza BV, Ribeiro TE, Bertini AM. Metformin compared with glyburide for the management of gestational diabetes. International Journal of Gynecology and Obstetrics 2010;111(1):37‐40. [DOI] [PubMed] [Google Scholar]
Simmons 2004
- Simmons D, Walters BN, Rowan JA, McIntyre HD. Metformin therapy and diabetes in pregnancy. Medical Journal of Australia 2004;180(9):462‐4. [PubMed] [Google Scholar]
Soler 1978
- Soler NG, Soler SM, Malins JM. Neonatal morbidity among infants of diabetic mothers. Diabetes Care 1978;1(6):340‐50. [DOI] [PubMed] [Google Scholar]
Solomon 1997
- Solomon CG, Willett WC, Carey VJ, Rich‐Edwards J, Hunter DJ, Colditz GA, et al. A prospective study of pregravid determinants of gestational diabetes mellitus. JAMA 1997;278(13):1078‐83. [PubMed] [Google Scholar]
Thomas 2010
- Thomas DE, Elliott EJ. The use of low‐glycaemic index diets in diabetes control. British Journal of Nutrition 2010;104(6):797‐802. [DOI] [PubMed] [Google Scholar]
Tieu 2008
- Tieu J, Crowther CA, Middleton P. Dietary advice in pregnancy for preventing gestational diabetes mellitus. Cochrane Database of Systematic Reviews 2008, Issue 2. [DOI: 10.1002/14651858.CD006674.pub2] [DOI] [PubMed] [Google Scholar]
Viana 2014
- Viana L, Gross J, Azevedo M. Dietary intervention in patients with gestational diabetes mellitus: a systematic review and meta‐analysis of randomized clinical trials on maternal and newborn outcomes. Diabetes Care 2014;37:3345‐55. [DOI: 10.2337/dc14-1530] [DOI] [PubMed] [Google Scholar]
Whincup 2008
- Whincup PH, Kaye SJ, Owen CG, Huxley R, Cook DG, Anazawa S, et al. Birth weight and risk of type 2 diabetes: a systematic review. JAMA 2008;300(24):2886‐97. [DOI] [PubMed] [Google Scholar]
WHO 2013
- World Health Organization. Diagnostic Criteria and Classification of Hyperglycaemia First Detected in Pregnancy. WHO/NMH/MND/13.2. Geneva: World Health Organization, 2013. [PubMed] [Google Scholar]
Zhang 2006
- Zhang C, Solomon CG, Manson JE, Hu FB. A prospective study of pregravid physical activity and sedentary behaviors in relation to the risk for gestational diabetes mellitus. Archives of Internal Medicine 2006;166(5):543‐8. [DOI] [PubMed] [Google Scholar]
References to other published versions of this review
Han 2011
- Han S, Crowther CA, Middleton P. Different types of dietary advice for women with gestational diabetes mellitus. Cochrane Database of Systematic Reviews 2011, Issue 8. [DOI: 10.1002/14651858.CD009275] [DOI] [PubMed] [Google Scholar]
Han 2013
- Han S, Crowther CA, Middleton P, Heatley E. Different types of dietary advice for women with gestational diabetes mellitus. Cochrane Database of Systematic Reviews 2013, Issue 3. [DOI: 10.1002/14651858.CD009275.pub2] [DOI] [PubMed] [Google Scholar]