Abstract
Background
Pneumonia, caused by Streptococcus pneumoniae, is a major cause of morbidity and mortality among children in low‐income countries. The effectiveness of pneumococcal conjugate vaccines (PCVs) against invasive pneumococcal disease (IPD), pneumonia, and mortality needs to be evaluated.
Objectives
To update the 2004 review on the efficacy of PCVs in preventing vaccine‐serotypes IPD (VT‐IPD) , X‐ray defined pneumonia among HIV‐1 negative children, and other new outcomes.
Search methods
We searched the Cochrane Central Register of Controlled Trials (CENTRAL) (The Cochrane Library 2009, issue 1), which contains the Cochrane Acute Respiratory Infections Group's Specialised Register; MEDLINE (1990 to Week 4 February 2009); and EMBASE (1974 to March 2009).
Selection criteria
Randomised controlled trials (RCTs) comparing PCV with placebo, or another vaccine, in children under two with IPD and clinical / radiographic pneumonia as outcomes.
Data collection and analysis
Two review authors independently identified studies, extracted data, and evaluated their corresponding risks of bias. Differences were resolved by discussion. Meta‐analysis used the inverse variance method.
Main results
We identified 11 publications from six RCTs conducted in Africa, US, Philippines and Finland where 57,015 children received PCV; while 56,029 received placebo or another vaccine. Seven publications provided high quality evidence on PCV efficacy against IPD and four provided moderate quality evidence against pneumonia. None of the five trials with all‐cause mortality data were powered to investigate this outcome. Only two trials have data on all‐cause admissions.
The main analysis for this review involved HIV‐1 negative children and used the pooled results of random‐effects model, intent‐to‐treat analysis (ITT).
Pooled vaccine efficacy (VE) for VT‐IPD was 80% (95% confidence interval (CI) 58% to 90%, P < 0.0001); all serotypes‐IPD, 58% (95% CI 29% to 75%, P = 0.001); World Health Organization X‐ray defined pneumonia was 27% (95% CI 15% to 36%, P < 0.0001); clinical pneumonia, 6% (95% CI 2% to 9%, P = 0.0006); and all‐cause mortality, 11% (95% CI ‐1% to 21%, P = 0.08). Analysis involving HIV‐1 positive children had similar findings.
Authors' conclusions
PCV is effective in preventing IPD, X‐ray defined pneumonia, and clinical pneumonia among HIV‐1 negative and HIV‐1 positive children under two years. The impact was greater for VT‐IPD than for all serotypes‐IPD, and for X‐ray defined pneumonia than for clinical pneumonia. An 11% reduction with a 95% CI of ‐1% to 21% and a P = 0.08 is compatible with reduction in all‐cause mortality.
Plain language summary
Vaccines against overwhelming blood infection due to pneumococcus bacteria and lung infection (pneumonia) among children less than two years of age
Pneumococcus is one of the major causes of overwhelming blood infection and lung infection (pneumonia) among young children. Pneumococci resistant to antibiotics are now being found in great numbers worldwide which may reduce the effectiveness of recommended antibiotic treatment. Preventive measures like vaccination are needed. This review found two trials from the US, two from Africa, one from the Philippines, and another from Finland that involved 113,044 children less than two years of age. In these studies, PCV was able to prevent overwhelming pneumococcal blood infection and pneumonia.
Summary of findings
for the main comparison.
| 11 PCV for preventing vaccine‐type invasive pneumococcal disease and X‐ray defined pneumonia in children less than two years of age | ||||||
|
Patient or population: Children under two years of age Intervention: 11PCV Comparison: Placebo or other vaccines | ||||||
| Outcomes | Illustrative comparative risks* (95% CI) | Relative effect (95% CI) | No of Participants (studies) | Quality of the evidence (GRADE) | Comments | |
| Assumed risk | Corresponding risk | |||||
| Placebo or other vaccines | 11PCV | |||||
| VT‐IPD, ITT (random) (follow‐up: mean 24 months) | Medium risk population | RR 0.20 (0.10 to 0.42) | 113,044 (7) | ++++ high3,4,5 | ||
| 2 per 10001,2 | 0 per 1000 (0 to 1)1,2 | |||||
| High risk population | ||||||
| 5 per 10001,2 | 1 per 1000 (1 to 2)1,2 | |||||
| All serotypes‐IPD, ITT (random) (follow‐up: mean 24 months) | Medium risk population | RR 0.42 (0.25 to 0.71) | 113,044 (7) | ++++ high3,4,5 | ||
| 4 per 10001,2 | 2 per 1000 (1 to 3)1,2 | |||||
| High risk population | ||||||
| 8 per 10001,2 | 3 per 1000 (2 to 6)1,2 | |||||
| X‐ray defined pneumonia, ITT (random) (follow‐up: mean 24 months) | Low risk population | RR 0.73 (0.64 to 0.85) | 104,755 (4) | +++O moderate6 | ||
| 3 per 10001,2 | 2 per 1000 (2 to 3)1,2 | |||||
| Medium risk population | ||||||
| 17 per 10001,2 | 12 per 1000 (11 to 14)1,2 | |||||
| High risk population | ||||||
| 63 per 10001,2 | 46 per 1000 (40 to 54)1,2 | |||||
| Clinical pneumonia, ITT (random) (follow‐up: mean 24 months) | Low risk population | RR 0.94 (0.91 to 0.98) | 104,755 (4) | +++O moderate6 | ||
| 59 per 10001,2 | 55 per 1000 (54 to 58)1,2 | |||||
| Medium risk population | ||||||
| 126 per 10001,2 | 118 per 1000 (115 to 123)1,2 | |||||
| High risk population | ||||||
| 315 per 10001,2 | 296 per 1000 (287 to 309)1,2 | |||||
| *The basis for the assumed risk (for example, the median control group risk across studies) is provided in footnotes. The corresponding risk (and its 95% confidence interval) is based on the assumed risk in the comparison group and the relative effect of the intervention (and its 95% CI). CI: Confidence interval; [other abbreviations, for example, RR, OR, etc]; GRADE: GRADE Working Group grades of evidence (see explanations) | ||||||
GRADE Working Group grades of evidence High quality (++++): Further research is very unlikely to change our confidence in the estimate of effect. Moderate quality (+++O): Further research is likely to have an important impact on our confidence in the estimate of effect and may change the estimate. Low quality (++OO): Further research is very likely to have an important impact on our confidence in the estimate of effect and is likely to change the estimate. Very low quality (+OOO): We are very uncertain about the estimate.
1No data on total population obtained for Cutts 2005 <24 months old children; Used data on children <29 months for denominator 2 Corresponding intervention risk (per 1000 people) = 1000 x ACR x RR where ACR = Assumed Control Risk, RR = Risk Ratio or Relative Risk, Assumed risk was calculated from low, medium, and high control group risk from the included studies 3 Incomplete accounting of patients and outcome events for the Finnish trial (Eskola 2001 and Kilpi 2003) and early stopping for the US trials (Black 2000 and O'Brien 2003) 4 Total number of events for VT‐IPD (142) and all serotypes‐IPD (233) is less than 300 (criteria from the GRADEPro 2008) which should further downgrade the quality of evidence for imprecision. However, the event rates (0.1 for VT‐IPD and 0.2 for all serotypes) were considered low. Therefore the quality of evidence was not downgraded. 5 Since the effect was large (RR < 0.5) with RR of 0.20 for VT‐IPD and 0.42 for all serotypes‐IPD, the “serious” limitation was removed and the evidence was upgraded to high. 6 Early stopping for the NCKP trial (Black 2002a; Hansen 2006); effect was not large therefore quality of evidence was not increased.
Background
Description of the condition
Streptococcus pneumoniae (S. pneumoniae) is one of the leading causes of invasive disease, bacterial pneumonia and meningitis among children in low‐income countries (Berman 1985; Shann 1986; Tupasi 1990). It is also an important bacterial cause of acute otitis media (AOM) worldwide. According to the World Health Organization (WHO), pneumococcal pneumonia and meningitis are responsible for 800,000 to 1 million child deaths each year (GAVI 2004; WHO 2003). All possible means (curative or preventive) to combat this affliction will help in the realisation of one of the Millennium Development Goals of the United Nations, which is to reduce child mortality (UNGA 2000). These infections place a heavy burden on health services and are associated with frequent use of antibiotics.
Description of the intervention
The successful WHO pneumonia control programme depends heavily on antibiotic treatment (Sazawal 1992). The emergence of antibiotic resistant strains of target bacteria like the pneumococcus (Crewe‐Brown 1997) may in the future affect the impact of the programme on pneumonia mortality. Thus, prevention of pneumococcal disease in children by vaccination is a logical approach to improving health outcomes.
A seven‐valent pneumococcal conjugate vaccine (7PCV) manufactured by Wyeth Vaccines was licensed in the USA in 2000 for use among infants and toddlers to prevent invasive pneumococcal disease (IPD). Other countries have introduced this vaccine into their immunisation programmes; the schedule is different for each country but is usually given before the child is six months of age. Three doses are given with four to eight week intervals starting at six weeks or two months of age. Nine‐valent PCV and 11‐valent PCV have been studied in Africa and the Philippines, respectively, to determine their efficacy on IPD and pneumonia among children under two years of age.
How the intervention might work
There are more than 90 pneumococcal serotypes but only a few commonly cause IPD. A 14‐valent pneumococcal polysaccharide (PS) vaccine was licensed in 1977. It was replaced by a 23‐valent PS vaccine in 1984. However, vaccines using capsular PS, which are T‐cell independent antigens, are generally not immunogenic in children under two years of age. These children lack mature B‐lymphocytes necessary for T‐cell independent antibody‐mediated immunity. A vaccine is effective in young children only if it can stimulate a T‐cell dependent antibody response present soon after birth (Giebink 2001). Covalent conjugation of a capsular PS to a protein carrier converts T‐cell independent anti‐PS antibody response to a T‐cell dependent one. This leads to good antibody responses and subsequent immunity in children less than two years of age. This vaccine is capable of inducing memory in the immune system and is the vaccine used for children.
Why it is important to do this review
This is an update of a Cochrane review first published in 2004 (Lucero 2004) where findings from only four trials were evaluated. This update now includes results from two more trials, Cutts 2005 and Lucero 2009, and an unpublished study (O'Brien 2002) in which results were provided by O'Brien in a personal communication (O'Brien 2009c). Moreover, in the 2004 review, the investigators from the USA (Black 2002a) employed the regular method of assessing pneumonia on chest radiography. This current review utilizes updated information of the radiology outcome from Black 2002a which Hansen re‐analysed (Hansen 2006) using films re‐read according to the WHO standardised guidelines used by all the other trials. Other outcomes were added such as all‐cause admissions and all‐cause mortality.
This current review makes use of the most recent version of Review Manager (RevMan 2008) which is now more rigorous in investigating individual trials as to the presence of bias (through the domain‐based approach) and to the quality of the evidence presented in the publications.
Objectives
The primary objective was to determine the efficacy of PCV in reducing the incidence of IPD due to vaccine serotypes (VT) and X‐ray defined pneumonia according to WHO standardised guidelines (WHO X‐ray pneumonia) among HIV‐1 negative children who received PCV before 12 months of age, compared to a group of children with the same characteristics who received either placebo, or control vaccine.
The secondary objective was to determine the efficacy of PCV against other outcomes such as all serotypes‐IPD, non‐vaccine serotypes IPD (NVT), vaccine‐related IPD (VRT), clinical pneumonia, all‐cause admissions, and all‐cause mortality in HIV‐1 negative children less than 24 months of age.
Methods
Criteria for considering studies for this review
Types of studies
Randomised controlled trials (RCTs), including cluster‐RCTs.
Types of participants
Healthy infants who participated in trials with primary series immunisations (three doses) given before 12 months of age and followed up to 24 months of age.
Types of interventions
PCV (any valency) compared to placebo, or other vaccines.
Types of outcome measures
Invasive disease caused by S. pneumoniae, including vaccine serotypes (VT), which are serotypes contained in the study vaccine; all serotypes combined; non‐vaccine serotypes (NVT), serotypes that are not contained in the study vaccine; and vaccine‐related serotypes (VRT).
Pneumonia: (i) X‐ray defined pneumonia according to WHO standard guidelines; (ii) clinical pneumonia (of unspecified aetiology), with or without X‐ray confirmation (clinical diagnosis only).
Primary outcomes
IPD: vaccine serotypes IPD (VT‐IPD).
X‐ray defined pneumonia according to WHO standardised guidelines (WHO X‐ray pneumonia).
Secondary outcomes
IPD: all serotypes, NVT, VRT.
Clinical pneumonia.
All‐cause admissions.
All‐cause mortality.
Search methods for identification of studies
Electronic searches
In this updated review we searched the Cochrane Central Register of Controlled Trials (CENTRAL) (The Cochrane Library 2009, issue 1), which contains the Cochrane Acute Respiratory Infections Group's Specialised Register; MEDLINE (1990 to week 4 February 2009); and EMBASE (1974 to March 2009). The MEDLINE search was not commenced until 1990 as relevant trials were published only after 1997.
We combined specific search terms with the Cochrane Highly Sensitive Search Strategy for identifying randomised trials in MEDLINE (Lefebvre 2008). The search strategy was adapted for EMBASE (see Appendix 1). We did not apply language or publication restrictions.
MEDLINE (Ovid) 1 exp Pneumonia/ 2 pneumonia.mp. 3 exp Pneumococcal Infections/ 4 pneumococc$.mp. 5 or/1‐4 6 exp Pneumococcal Vaccines/ 7 (pneumococc$ adj vaccin$).mp. 8 or/6‐7 9 Child/ 10 Infant/ 11 (children or infant$1 or pediatric or paediatric).mp. 12 or/9‐11 13 5 and 8 and 12
Searching other resources
The following sources were also searched to identify additional relevant studies:
Unpublished literature such as conference proceedings (see Appendix 2 for details); personal communication with authors of publications included or considered for inclusion; other pneumococcal conjugate vaccine trialists; and vaccine manufacturers to identify ongoing or future phase three trials;
Handsearching of relevant journals and phase two trial results to identify future countries, vaccine manufacturers, or principal investigators (PI) participating in PCV phase three trials;
Reference lists of all identified relevant studies; and
Published books pertaining to pneumococcal vaccines.
Data collection and analysis
Selection of studies
Two review authors (VED, LTN) independently screened results of the literature search and selected eligible studies according to the criteria for considering studies in this review. Differences were resolved through discussion. To check if we missed any other trial, or outcomes of trials on pneumococcal vaccines, we consulted the book Pneumococcal Vaccines, which considered all pneumococcal conjugate vaccine trials that have been conducted to date, with particular emphasis on the years following the introduction of the conjugate vaccines (PneumoVac 2008).
Data extraction and management
Two review authors (VED, LTN) independently extracted data from each of the studies using a data extraction form designed according to the Cochrane Collaboration’s checklist of items to consider in data collection (Higgins 2008b). For the included studies already considered in the 2004 publication of this review (Lucero 2004), we simply added the items in the collaboration’s checklist that were previously not found in the earlier data extraction form. In particular, we extracted the type of conjugate vaccine (valency, serotypes contained, carrier protein); control information; method of enrolment; allocation of participants; study site; participants' information (ethnicity, age on enrolment, number allocated to either intervention or control); vaccination schedule (study/control and Expanded Program on Immunization (EPI)); outcome measures; results per outcome measure; and miscellaneous information including the key conclusions, and funding source. We also updated the information needed to assess individual studies of their risks of bias. Disagreements were resolved by discussion.
Assessment of risk of bias in included studies
Two review authors (VED, LTN) independently appraised the validity of included trials through assessment of their corresponding risks of bias. We used the Cochrane Collaboration’s two‐part 'Risk of bias' tool, a domain‐based evaluation in which critical assessments for each of the six domains were made separately for each study. The six domains consist of 1) sequence generation; 2) allocation concealment; 3) blinding of participants, personnel and outcome assessors; 4) incomplete outcome data; 5) selective outcome reporting; and 6) topic‐specific, design‐specific, or other threats to validity. Each domain includes one or more specific entries in a ‘Risk of bias’ table. Within each entry, the first part of the tool involves describing what was reported to have happened in the study. The second part of the tool involves assigning a judgement relating to the risk of bias for that entry. This is achieved by answering a pre‐specified question about the adequacy of the study in relation to the entry, such that a judgement of ‘Yes’ indicates low risk of bias, ‘No’ indicates high risk of bias, and ‘Unclear’ indicates unclear or unknown risk of bias (Higgins 2008a). See the 'Characteristics of included studies' table for details of the risk of bias assessment for each study.
Assessment information not found in the publication was obtained through personal communication with authors. Instead of asking directly about the six domains, we used open ended questions when asking trial authors for information about study design and conduct in order to avoid overly positive answers. Any disagreement was resolved through discussion.
Measures of treatment effect
The intention‐to‐treat (ITT) principle was used in the primary analysis since it aims to include all participants randomised into a trial regardless of the number of doses received subsequently and is often recommended as the least biased way to estimate intervention effects in randomised trials (Lewis 1993; Newell 1992). The risk ratio (RR) was used to measure treatment effect. We determined RR by first obtaining the vaccine efficacy (VE) of the PCV as reported in the article. The VE and 95% confidence interval (CI) of each PCV on the outcome parameters were encoded into a pre‐programed Microsoft (MS) Excel worksheet. The MS Excel file calculated RR and 95% CI from the VE as specified in the published article, logarithm of RR to the base e (logRR), and the standard error of this logarithm (SE (logRR)) for each outcome parameter.
In publications where VE was not presented, RR and 95% CI were calculated using PROC FREQ of SAS version 9.1. Due to the small number of IPD events in the Finnish (Eskola 2001; Kilpi 2003) and Philippines (Lucero 2009) trials, some cells contained zero events. We conducted analysis using continuity correction to take into account these cells with zero events. In fact we conducted analyses using three methods of continuity correction which included a) constant, b) "treatment arm", and c) empirical continuity corrections (Sweeting 2004). In constant continuity correction, a factor which is often equal to 0.5 is added to both the treatment and control group cells. The "treatment arm" continuity correction requires adding a factor of the reciprocal of the size of the opposite treatment arm. The empirical continuity correction on the other hand, adopted an empirical approach where all the studies in the meta‐analysis without a zero event are used to calculate a pooled effect measure. Using this estimate, a continuity correction can be calculated, which will produce effect measure estimates close to the pooled effect measure in the studies with zero events in both treatment and control arms. The calculated continuity correction factor may act as a "prior" and will be added to the observed events. These continuity correction methods were applied to VT‐IPD, NVT‐IPD, VRT‐IPD and all‐cause mortality outcomes where one or two studies have zero events in either treatment or control arms (Table 2). The three continuity correction methods gave almost similar results (Table 3). The main method that we present in the meta‐analyses is the constant continuity correction. In the meta‐analyses, we reported separately the outcomes from the two different PCV arms in the Finnish trial (Eskola 2001; Kilpi 2003). To avoid counting twice the children allocated to the control arm of this study, we halved the number of children and number of outcome events in the control arm.
1. Results from analysis using three types of continuity corrections by outcome for publications with zero events in either treatment or control arms.
| Outcome | Study | Group | Event | No Event | Total | Constant (0.5) | Treatment Arm | Empirical |
| RR (95% CI) | RR (95% CI) | RR (95% CI) | ||||||
| IPD, vaccine serotypes, ITT (Random) | Eskola 2001 | Treatment | 0 | 831 | 831 | 0.17 (0.01, 4.09) | 0.10 (0, 4.14) | 0.03 (0, 15.25) |
| Control | 1 | 414.5 | 415.5 | |||||
| Kilpi 2003 | Treatment | 0 | 835 | 835 | 0.17 (0.01, 4.07) | 0.10 (0, 4.12) | 0.03 (0, 15.17) | |
| Control | 1 | 414.5 | 415.5 | |||||
| IPD, non‐vaccine serotypes, ITT (Random) | Lucero 2009 | Treatment | 0 | 6097 | 6097 | 0.33 (0.01, 8.18) | 0.33 (0.01, 8.18) | 0.33 (0.01, 8.18) |
| Control | 1 | 6093 | 6094 | |||||
| IPD, non‐vaccine serotypes, PP (Random) | Lucero 2009 | Treatment | 0 | 6013 | 6013 | 0.33 (0.01, 8.19) | 0.33 (0.01, 8.19) | 0.28 (0.01, 8.01) |
| Control | 1 | 6017 | 6018 | |||||
| IPD, vaccine‐related serotypes, ITT (Random) | Lucero 2009 | Treatment | 0 | 6097 | 6097 | 0.33 (0.01, 8.18) | 0.33 (0.01, 8.18) | 0.35 (0.01, 8.27) |
| Control | 1 | 6093 | 6094 | |||||
| IPD, vaccine‐related serotypes, PP (Random) | Lucero 2009 | Treatment | 0 | 6013 | 6013 | 0.33 (0.01, 8.19) | 0.33 (0.01, 8.19) | 0.32 (0.01, 8.11) |
| Control | 1 | 6017 | 6018 | |||||
| All‐cause mortality, ITT (Random) | Eskola 2001 | Treatment | 1 | 830 | 831 | 1.50 (0.06, 36.79) | 0.99 (0.05, 18.71) | 0.95 (0.05, 17.52) |
| Control | 0 | 415.5 | 415.5 | |||||
| Kilpi 2003 | Treatment | 1 | 834 | 835 | 1.49 (0.06, 36.61) | 0.99 (0.05, 18.62) | 0.95 (0.05, 17.44) | |
| Control | 0 | 415.5 | 415.5 |
2. Comparison of results of pooled estimates (RR) using the three types of continuity correction.
| Outcome | Constant (0.5) | Treatment Arm | Emprical |
| IPD, vaccine serotypes, ITT | 0.20 [0.10, 0.42] | 0.20 [0.09, 0.42] | 0.21 [0.09, 0.52]* |
| IPD, non‐vaccine serotypes, ITT | 0.92 [0.39, 2.17] | 0.92 [0.39, 2.17] | 0.92 [0.39, 2.17] |
| IPD, non‐vaccine serotypes, PP | 0.68 [0.20, 2.32] | 0.68 [0.20, 2.32] | 0.68 [0.20, 2.31] |
| IPD, vaccine‐related serotypes, ITT | 0.89 [0.24, 3.36] | 0.89 [0.24, 3.36] | 0.90 [0.24, 3.36] |
| IPD, vaccine‐related serotypes, PP | 0.60 [0.07, 4.87] | 0.60 [0.07, 4.87] | 0.59 [0.07, 4.85] |
| All‐cause mortality, ITT | 0.89 [0.79, 1.01] | 0.89 [0.79, 1.01] | 0.89 [0.79, 1.01] |
*Without Kilpi 2003 and Eskola 2001
In the South African trial, VE against several outcomes was calculated among all children (regardless of HIV status) and that of HIV‐1 negative children. In the Gambian trial, what was published was the per‐protocol VE among children < 29 months old and further stratified among those three to 11 months, 12 to 23 and 24 to 29 months of age for IPD and X‐ray defined pneumonia. Thus, we had to ask for ITT data from the Gambian investigators. We received the results for the stratified analysis of the same age‐groups from which we calculated the ITT‐VE for IPD, X‐ray defined pneumonia and clinical pneumonia for children < 24 months old. For generic inverse‐variance method only the VE (95% CI) or RR (95% CI) was needed to calculate the pooled effect estimates. However, when total population was calculated, we had to use the population < 29 months old since we did not have data for children < 24 months old from Gambia. We also obtained from Hansen (Hansen 2007) data on children younger than 24 months of age for the outcome of X‐ray defined pneumonia. It must be emphasised that the results of individual RR and VE in this review will be different from the ones published in Cutts 2005 and Hansen 2006 since we obtained through personal communication the actual data for children younger than 24 months of age. Despite these differences, we have cited the main publications as the references, i.e. Cutts 2005 for Cutts 2007 and Jaffar 2007 and Hansen 2006 for Hansen 2007. The pooled RR from each meta‐analysis of relevant outcomes was later converted to VE (pooled) and is reported together with the pooled RR. RevMan 5 includes the assessment of quality of trials through the use of the software Grade Profiler (GRADEPro 2008). This software incorporates characteristics of each study entered in the software to come up with a summary of findings table. These characteristics include numbers of events for relevant outcomes, total numbers of participants studied, presence of limitations (in the form of bias), inconsistency, imprecision, and indirectness. The resultant pooled RR for each outcome after the meta‐analysis, is used together with the number of events and participants, to come up with the absolute effect of the PCV against the outcomes studied.
Unit of analysis issues
The review involved RCTs whether individual‐randomised or cluster‐randomised. Only one trial (with two, separate offshoot publications: O'Brien 2002, O'Brien 2003) used the cluster‐randomised study design. Because of the inclusion of this trial with this study design, the pooled RR and 95% CI were calculated using the generic inverse variance method. This approach allows a cluster‐randomised trial to be included in the meta‐analysis of mostly individual randomised trials.
Dealing with missing data
Data missing from the articles, like VE for certain outcomes and age groups were obtained from the authors through personal communication. However, not all trials studied all outcomes relevant for PCV efficacy. We could ask for missing data from the trial investigators only if the outcome had been studied. Meta‐analysis was therefore done only for trials which had relevant outcomes. From reading the book Pneumococcal Vaccines (PneumoVac 2008), we were able to obtain missing information on the effect of PCV against X‐ray pneumonia from the American Indian trial. Although O’Brien presented orally in Alaska in 2002 the findings of the efficacy of PCV on X‐ray defined pneumonia (O'Brien 2002), these did not appear in the printed abstract and it remains to be formally published in a journal. Through personal communication with Madhi, O’Brien gave the actual VE and 95% Cl for this outcome (Madhi 2008). However, the value for VE in this book was erroneous according to O'Brien (O'Brien 2009b) and she gave us the correct value to use for VE (95% CI, P value) against per‐protocol (PP) and ITT X‐ray pneumonia (O'Brien 2009c).
Assessment of heterogeneity
An initial qualitative comparison of all individually analysed publications was conducted to determine if pooling of results (meta‐analysis) was reasonable. This took into account differences in study populations, interventions, outcome assessment, presence of bias, estimated effect size and sample size used, based on the primary outcome of the study.
To determine how variable the studies included in the analysis were (heterogeneity), the value of Chi2 test for heterogeneity (P < 0.05) and the I2 statistic (Deeks 2008) were sought. Although we chose ≥ 34% as the threshold for interpreting the I2 statistic, this threshold is arbitrary. Thresholds for the interpretation of I2 can be misleading, since the importance of inconsistency depends on other factors. A rough guide to interpretation is as follows (Deeks 2008): 0% to 40%, might not be important; 30% to 60%, may represent moderate heterogeneity; 50% to 90%, may represent substantial heterogeneity; 75% to 100%, considerable heterogeneity. It is important to note that although the value 0% to 40% is interpreted as “might not be important”, the values overlap with that of moderate heterogeneity. Moreover, the importance of the observed value of I2 also depends on (i) magnitude and direction of effects and, (ii) strength of evidence for heterogeneity (for example, P value from the chi‐squared test, or a confidence interval for I2). We looked for possible explanations of the heterogeneity by reviewing individual outcomes and their respective effect estimates. Possible explanations for heterogeneity include the presence of a) outliers, or studies which had results with a direction totally different from other studies and, b) studies with small number of events. Please see 'Additional Tables' Table 4 and Table 5.
3. Sensitivity analysis to explore heterogeneity for VT‐IPD, ITT (Random).
| Study | log RR | SE | Weight | Point estimate RR (95% CI) | Reasons for exclusion | |
| Outlier | Small number of events | |||||
| Eskola 2001 | ‐1.7904 | 1.6323 | 4.70% | 0.17 [0.01, 4.09] | ||
| Kilpi 2003 | ‐1.7952 | 1.6311 | 4.70% | 0.17 [0.01, 4.06] | ||
| Lucero 2009 | 1.0953 | 1.1545 | 8.50% | 2.99 [0.31, 28.73] | ||
| Klugman 2003 | ‐1.772 | 0.7684 | 15.50% | 0.17 [0.04, 0.77] | ||
| O'Brien 2003 | ‐1.7487 | 0.7662 | 15.60% | 0.17 [0.04, 0.78] | ||
| Black 2000 | ‐2.7969 | 0.6658 | 18.60% | 0.06 [0.02, 0.22] | ||
| Cutts 2005 | ‐1.4159 | 0.3525 | 32.50% | 0.24 [0.12, 0.48] | ||
| Total RR (95% CI) | 0.20 [0.10, 0.42] | 0.18 [0.11, 0.30] | 0.17 [0.09, 0.31] | |||
| Note: Shaded cells represent excluded studies | Heterogeneity: Tau² = 0.30; Chi² = 9.07, df = 6 (P = 0.17); I² = 34% | Heterogeneity: Tau² = 0.00; Chi² = 3.37, df = 5 (P = 0.64); I² = 0% | Heterogeneity: Tau² = 0.04; Chi² = 3.37, df = 3 (P = 0.34); I² = 11% | |||
| Test for overall effect: Z = 4.31 (P < 0.0001) | Test for overall effect: Z = 6.58 (P < 0.00001) | Test for overall effect: Z = 5.90 (P < 0.00001) | ||||
4. Sensitivity analysis to explore heterogeneity for WHO X‐ray defined pneumonia, ITT (Random).
| Study | log RR | SE | Weight |
Point estimate RR (95% CI) |
Reasons for exclusion | ||
| Outlier | Presence of bias | Highest estimate or presence of bias | |||||
| Cutts 2005 | ‐0.4368 | 0.0666 | 24.80% | 0.65 [0.57, 0.74] | |||
| Hansen 2006 | ‐0.3299 | 0.2149 | 12.90% | 0.72 [0.47, 1.10] | |||
| Klugman 2003 | ‐0.2231 | 0.1047 | 21.70% | 0.80 [0.65, 0.98] | |||
| Lucero 2009 | ‐0.1744 | 0.1247 | 19.90% | 0.84 [0.66, 1.07] | |||
| O'Brien 2002 1 | 0.1044 | 0.1157 | 20.7% | 1.11 [0.88, 1.39] | |||
| Total RR (95% CI) | 0.81 [0.66, 1.00] | 0.73 [0.64, 0.85] | 0.74 [0.62, 0.88] | 0.80 [0.69, 0.93] | |||
| 1 Aside from being an outlier, the parent trial also has bias (early stopping of trial) | Heterogeneity: Tau² = 0.04; Chi² = 17.61, df = 4 (P = 0.001); I² = 77% | Heterogeneity: Tau² = 0.01; Chi² = 5.12, df = 3 (P = 0.16); I² = 41% | Heterogeneity: Tau² = 0.01; Chi² = 5.12, df = 2 (P = 0.08); I² = 61% | Heterogeneity: Tau² = 0.00; Chi² = 0.40, df = 2 (P = 0.82); I² = 0% | |||
| Note: Shaded cells represent excluded studies | Test for overall effect: Z = 2.00 (P = 0.05) | Test for overall effect: Z = 4.23 (P < 0.0001) | Test for overall effect: Z = 3.36 (P = 0.0008) | Test for overall effect: Z = 2.91 (P = 0.004) | |||
Assessment of reporting biases
The authors of this review identified the relevant articles that should be included in the review of phase three trials determining the efficacy of a pneumococcal conjugate vaccine against the outcomes included in the objectives.
There were only six trials reviewed and these were too few to be able to assess reporting bias using a funnel plot. We initially assessed O'Brien 2002 as having reporting bias since the investigators failed to publish the results of the X‐ray defined pneumonia outcome, particularly since the results were different from the other trials. However, the results, although not published, were presented in a conference. Thus, we revised this assessment and only reported this as a time‐lag bias.
Data synthesis
Random‐effects model, which assumes trial heterogeneity, and fixed‐effect model, which assumes trial homogeneity, were used in the calculation of pooled RR and 95% CI but conclusions were made based on the random‐effects model. The random‐effects method incorporates an assumption that the different studies are estimating different, yet related, intervention effects and is based on the inverse‐variance approach that makes adjustment to the study weights according to the extent of variation, or heterogeneity, among the varying intervention effects. We used the inverse‐variance approach since the American Indian trial is a cluster‐randomised study. The random‐effects method and the fixed‐effect method will give identical results when there is no heterogeneity among the studies. Where there is heterogeneity, Cls for the average intervention effect will be wider if the random‐effects method is used rather than a fixed‐effect method, and corresponding claims of statistical significance will be more conservative. It is also possible that the central estimate of the intervention effect will change if there are relationships between observed intervention effects and sample sizes (Deeks 2008).
Subgroup analysis and investigation of heterogeneity
We performed subgroup analyses on children < 24 months of age against HIV status; and on children < 29 months of age against HIV status.
Since only the South African trial reported results for both HIV‐1 negative and HIV‐1 positive children, we decided to have as the main population for analysis the HIV‐1 negative children. The other trials did not report HIV‐1 status and children were presumed to be HIV‐1 negative. Although the main population included only HIV‐1 negative children, we conducted a sub‐group analysis including the HIV‐1 positive children from South Africa to determine whether there would be a change in the pooled RR against the outcomes. This subgroup of HIV‐1 positive children in the South African study was included in the randomisation process. Thus, the results are actual randomised comparisons and not observational in nature.
The Gambian trial included children younger than 29 months of age. Since the original review objective only studied children younger than 24 months of age, we obtained from the author data for this population. Nonetheless, we also conducted an analysis of children younger than 29 months of age to determine if there would be differences in pooled VE compared to that of the group younger than 24 months of age.
Sensitivity analysis
We had to make decisions about the validity and robustness of the pooled estimates that we obtained depending on the studies included in the meta‐analysis. Thus, for some outcomes, we conducted sensitivity analysis by excluding some studies in the model when a study differed from others in terms of methods of collection of outcome data (only inpatient data collected, IPD data as primary outcome or not), and when studies had VE clearly different from the other studies (outliers).
Results
Description of studies
Results of the search
From the series of searches conducted in four batches between 2005 and 2009, we obtained a combined number of hits as follows: MEDLINE 541; EMBASE 222; and CENTRAL 301 hits. All 1064 articles downloaded were entered into the reference management software EndNote and duplicates were discarded. A total of 624 references were left from which 263 duplicates of the references in this review's first publication in 2004 (Lucero 2004) were likewise eliminated. With further removal of 312 non‐PCV and non‐RCT articles, the search yield was trimmed down to 49 articles which we considered potentially eligible for inclusion: 46 were eventually excluded for reasons stated in the 'Characteristics of excluded studies' table; three new publications were included from the electronic search (Cutts 2005; Hansen 2006; Madhi 2005a). A handsearched, unpublished study (O'Brien 2002), and a newly published study (Lucero 2009) were also included. A total of five publications were included in this update, giving a grand total of 11 publications in the 'Included studies' section. Of the 55 references in the 'Additional references' section, 16 are personal communications with authors through which additional information or data sets were obtained (Black 2003; Black 2004; Black 2008; Cutts 2007; Cutts 2008; Hansen 2007; Hansen 2008a; Hansen 2008b; Jaffar 2007; Klugman 2004; Klugman 2008a; O'Brien 2009a; O'Brien 2009b; O'Brien 2009c; Palmu 2003a; Palmu 2003b).
Included studies
There were ten publications from six adequately randomised clinical trials that met the eligibility criteria and were considered in this review: Black 2000, Black 2002a, and Hansen 2006 of the Northern California Kaiser Permanente (NCKP) trial; Eskola 2001 and Kilpi 2003 of the Finnish Otitis Media trial; Klugman 2003 and Madhi 2005a of the South African trial; O'Brien 2003 of the American Indian trial; Cutts 2005 of the Gambian Trial; and Lucero 2009 of the Philippines trial. There is one unpublished study from the American Indian trial for the outcome of X‐ray pneumonia (O'Brien 2002). This was an oral presentation in the 3rd International Symposium on Pneumococci and Pneumococcal Diseases (ISPPD‐3) in Alaska in 2002 that remains unpublished to this day, but the result of which was found in a section of a book Pneumococcal Vaccines (Madhi 2008). The results published in this book were later corrected in O'Brien 2009c and we have included these results in the evaluation of the effectiveness of PCV against X‐ray pneumonia, bringing to 11 the total number of included studies considered in this review. Details of these publications are available in the 'Characteristics of included studies' table.
Design
All included publications are individual‐randomised, double‐blind, placebo‐controlled trials, except for the American Indian trial, which is cluster‐randomised. The authors of the trial discussed this particular design in a separate publication (Moulton 2001).
Sample size, setting, participants and interventions
The participants in each trial were healthy infants < 12 months of age who were eligible for vaccination with vaccines in their national immunisation programmes or EPI. Each one had their own exclusion criteria for not enrolling children into their trials. The important exclusion criteria that we gathered from the publications were: non‐residence in trial area; low likelihood of receiving three doses of vaccine because of possible migration; children with sickle cell disease; known immunodeficiency; any serious chronic or progressive disease; a history of seizures or a history of either pneumococcal or meningococcal disease; previous receipt of diphtheria‐pertussis‐tetanus (DPT) or Haemophilus influenzae type b (Hib) vaccines; age younger than 40 days or older than 364 days; inclusion in a previous vaccine trial; hypersensitivity to any components of the vaccine; contraindications specified on the manufacturers’ package inserts for any routine non study vaccines that the child would receive; any medical condition (for example, one that required frequent or long‐term referrals to health‐care facilities outside the trial area) which, in the opinion of the investigator, might interfere with the assessment of the study objectives; or a moderate or severe illness with or without fever until resolved.
In all six trials included in this review, children were enrolled for the first dose of the vaccine when they were approximately six weeks to less than seven months of age. Two trials were done in the US. One trial (Black 2000; Black 2002a; Hansen 2006) involved 37,868 infants of diverse ethnic backgrounds (Asian, Afro‐American, Hispanic, White, etc.) from Northern California, while the other trial (O'Brien 2002; O'Brien 2003) was done among 8292 American Indian and White Mountain Apache infants in Central Arizona. In both trials, three doses of a 7‐valent CRM197 PCV were given before the child turned 12 months old. However, the American Indian trial, also enrolled children more than seven months old who were classified into two "catch‐up" groups (seven to 11 months and 12 to 23 months). These in particular, were not analysed in this review. In the three‐arm trial conducted in Finland (Eskola 2001; Kilpi 2003), three doses of either heptavalent PCV CRM197, PCV OMP, or hepatitis B vaccine as control were given to 2497 children using the same immunisation schedule. Both the US and Finnish trials gave a booster dose of PCV starting at 12 months of age. In a study conducted among infants in South Africa, three doses of either a 9‐valent CRM197 PCV, or placebo were given to 39,836 children before they reached nine months of age. No booster dose was given. Moreover, this study involved both HIV‐1 negative and HIV‐1 positive infants. However, only HIV‐1 negative infants were included in the analysis of the primary outcome in this review. In the trial conducted in Eastern Gambia, three doses of either a 9‐valent PCV, or placebo were given to 17,437 children before they turned 12 months old. No booster was given. In the Philippines trial, three doses of an 11‐valent PCV, or placebo were given to 12,191 children in the province of Bohol, Philippines before they reached nine months of age. As with the South African and Gambian trials, no booster was given.
Outcomes
Three of these publications (Black 2000; Black 2002a; Hansen 2006) are reports of three types of outcomes (IPD, clinical pneumonia and X‐ray defined pneumonia, respectively) from one phase three trial. The data on X‐ray defined pneumonia outcome, originally reported by Black 2002a in the 2004 publication of this review (Lucero 2004), was superseded by that of Hansen 2006, which re‐evaluated radiographs from the Northern California Kaiser Permanente trial using the standardised WHO criteria for interpretation of chest radiographs in children. However, Black 2002a remains the source of the clinical pneumonia outcome for this trial. Similarly, the publications of Eskola 2001 and Kilpi 2003 are reports from the same three‐arm Finnish Otitis Media trial. The difference between the two publications lies in the protein conjugate used for the PCV: Eskola reported on the PCV CRM197 arm compared to the control group, while Kilpi reported on the PCV OMP arm compared to the same control group utilised in Eskola 2001. Although the two publications reported AOM as their primary outcome, they considered four cases each of IPD in their safety reporting and for this reason they are included in this review. The South African trial (Klugman 2003) reported on IPD and X‐ray defined pneumonia, with Madhi 2005a reporting later on the clinical pneumonia outcome. The American Indian trial (O'Brien 2003) reported only IPD as an outcome, but an earlier, unpublished oral presentation in the ISPPD‐3 in Alaska in 2002 (O'Brien 2002) reported an outcome on X‐ray pneumonia. The Gambian trial (Cutts 2005) and the Philippines trial (Lucero 2009) both reported on five outcomes, namely, X‐ray defined pneumonia, clinical pneumonia, IPD, all‐cause admissions, and all‐cause mortality. Overall, in terms of specific outcomes of IPD, seven publications reported on both VT‐IPD and all serotypes‐IPD (Black 2000; Cutts 2005; Eskola 2001; Kilpi 2003; Klugman 2003; Lucero 2009; O'Brien 2003); six publications reported on NVT‐IPD (Black 2000; Eskola 2001; Kilpi 2003; Klugman 2003; Lucero 2009; O'Brien 2003); and four on VRT‐IPD (Black 2000; Klugman 2003; Lucero 2009; O'Brien 2003). For all the other outcomes, five publications reported on X‐ray pneumonia (Cutts 2005; Hansen 2006; Klugman 2003; Lucero 2009; O'Brien 2002); and only four on clinical pneumonia (Black 2002a; Cutts 2005; Lucero 2009; Madhi 2005a). There were only two publications that had data on all‐cause admissions (Cutts 2005; Lucero 2009); and five with data on all‐cause mortality (Cutts 2005; Eskola 2001; Kilpi 2003; Klugman 2003; Lucero 2009). It should be noted that although Cutts 2005 reported ITT data on NVT‐IPD and VRT‐IPD, her population covered < 29 months old children. The above publications compared populations covering only children < 24 months of age. Please refer to the Data and Analyses Section comparisons 3 and 4 for details on Cutts' NVT‐IPD and VRT‐IPD on children < 29 months.
Additional information on the included studies can be found in Table 6, Table 7, Table 8, Table 9, Table 10, Table 11, and Table 12.
5. Characteristics of studies with invasive disease outcome.
| Study | Age at enrolment | Follow up | Age at completion of primary series | Setting | No. of participants | PCV serotypes |
| Black 2000 | 2‐4 months | Earliest of the following dates: onset of first invasive disease, death, end of trial | 12 months | Northern California Kaiser Permanente (NCKP) | 37,868 | 4, 6B, 9V, 14, 18C, 19F, 23F |
| Cutts 2005 | 6‐51 weeks | Earliest of the following dates: first episode of the relevant endpoint, withdrawal, death, age 30 months, end of follow‐up on April 30, 2004 | 6 months | The Gambia | 17,437 | 1, 4, 5, 6B, 9V, 14, 18C, 19F, 23F |
| Eskola 2001 | 6‐13 weeks | 24 months of age | 6 months | Finland | 1246.5 | 4, 6B, 9V, 14, 18C, 19F, 23F |
| Kilpi 2003 | 6‐13 weeks | 24 months of age | 6 months | Finland | 1250.5 | 4, 6B, 9V, 14, 18C, 19F, 23F |
| Klugman 2003 (HIV‐1 negative children only) | 28‐84 days old | 60‐1354 days after enrolment | 9 months | Soweto, South Africa | 37,259 | 1, 4, 5, 6B, 9V, 14, 18C, 19F, 23F |
| Lucero 2009 | 6 weeks ‐ < 6 months | earliest of the following dates: 24 months of age, end of follow‐up on December 31, 2004 | 6 months | Philippines | 12,191 | 1, 3, 4, 5, 6B, 7F, 9V, 14, 18C, 19F, 23F |
| O'Brien 2003 | 6 weeks‐7 months of age | First 24 months of life | 12 months | American Indian and Apache Indian Reservations | 5792 | 4, 6B, 9V, 14, 18C, 19F, 23F |
6. Characteristics of studies with WHO X‐ray defined pneumonia.
| Study | Age at enrolment | Follow up | Age at completion of primary series | Setting | No. of participants | PCV serotypes |
| Hansen 2006 | 2 months | Earliest of the following dates: onset of first invasive disease, death, end of trial | 12 months | Northern California Kaiser Permanente (NCKP) | 37,868 | 4, 6B, 9V, 14, 18C, 19F, 23F |
| Cutts 2005 | 6‐51 weeks | Earliest of the following dates: first episode of the relevant endpoint, withdrawal, death, age 30 months, end of follow‐up on April 30, 2004 | 6 months | The Gambia | 17,437 | 1, 4, 5, 6B, 9V, 14, 18C, 19F, 23F |
| Klugman 2003 (HIV‐1 negative children only) |
28‐84 days | 60‐1354 days after enrolment | 9 months | Soweto, South Africa | 37,259 | 1, 4, 5, 6B, 9V, 14, 18C, 19F, 23F |
| Lucero 2009 | 6 weeks‐ < 6 months | Earliest of the following dates: 24 months of age, end of follow‐up on December 31, 2004 | 6 months | Philippines | 12,191 | 1, 3, 4, 5, 6B, 7F, 9V, 14, 18C, 19F, 23F |
| O'Brien 2002 | 6 weeks‐7 months of age | First 24 months of life | 12 months | American Indian and Apache Indian Reservations | 5792 | 4, 6B, 9V, 14, 18C, 19F, 23F |
7. Characteristics of studies with clinical pneumonia as outcome.
| Study | Age at enrolment | Follow up | Age at completion of primary series | Setting | No. of participants | PCV serotypes |
| Black 2002a | 2 months | Earliest of the following dates: onset of first invasive disease, death, end of trial | 12 months | Northern California Kaiser Permanente (NCKP) | 37,868 | 4, 6B, 9V, 14, 18C, 19F, 23F |
| Cutts 2005 | 6‐51 weeks | Earliest of the following dates: first episode of the relevant endpoint, withdrawal, death, age 30 months, end of follow‐up on April 30, 2004 | 6 months | The Gambia | 17,437 | 1, 4, 5, 6B, 9V, 14, 18C, 19F, 23F |
| Lucero 2009 | 6 weeks‐ < 6 months | Earliest of the following dates: 24 months of age, end of follow‐up on December 31, 2004 | 6 months | Philippines | 12,191 | 1, 3, 4, 5, 6B, 7F, 9V, 14, 18C, 19F, 23F |
| Madhi 2005a (HIV‐1 negative children only) | 28‐84 days old | 60‐1354 days after enrolment | 9 months | Soweto, South Africa | 37,259 | 1, 4, 5, 6B, 9V, 14, 18C, 19F, 23F |
8. Vaccine and control group's events (invasive disease and WHO X‐ray defined pneumonia).
| Outcome | Study | Vaccine denominator | Vaccine events | Control denominator | Control events | VE (95% CI) | RR (95% CI) |
| IPD, all serotypes, ITT | Black 2000 | 18,927 | 6 | 18,941 | 55 | 89.1 (73.7 to 95.8) | 0.109 (0.042 to 0.263) |
| Cutts 2005 (all children) | 8718 | 41 (not in published article, personal communication with the author) | 8719 | 74 (not in published article, personal communication with the author) | 45 (19 to 62) | 0.55 (0.38 to 0.81) | |
| Cutts 2005 (younger than 24 months children) | 14,094 (person‐time) | 38 (not in published article, personal communication with the author) | 13,956 (person‐time) | 66 (not in published article, personal communication with the author) | 42.99 (15.08 to 61.72) | 0.5701 (0.3828 to 0.8492) | |
| Eskola 2001 | 831 | 1 | 415.5 | 1.5 | 66.67 (‐317.43 to 97.34) | 0.3333 (0.0266 to 4.1743) | |
| Kilpi 2003 | 835 | 1 | 415.5 | 1.5 | 66.83 (‐315.43 to 97.35) | 0.3317 (0.0265 to 4.1543) | |
| Klugman 2003 (all children) | 19,922 | 33 | 19,914 | 66 | 50 (23 to 68) | 0.50 (0.32 to 0.77) | |
| Not all children had serum taken for HIV testing (personal communication with Klugman). | |||||||
| Klugman 2003 (HIV‐negative) | 18,633 (Madhi 2005a) | 11 | 18,626 (Madhi 2005a) | 19 | 42 (‐28 to 75) | 0.58 (0.25 to 1.28) | |
| Klugman 2003 (HIV‐positive) | 1289 (from Madhi 2005a) | 22 | 1288 (from Madhi 2005a) | 47 | 53 (21 to 73) | 0.47 (0.27 to 0.79) | |
| Lucero 2009 | 6097 | 3 | 6094 | 3 | 0.4 (‐393 to 79.9) | 0.996 (0.201 to 4.93) | |
| O'Brien 2003 | 4951 (person‐years) | 9 | 4742 (person‐years) | 18 | 52.1 (‐6.6 to 78.5) | 0.479 (0.215 to 1.066) | |
| 2974 (number of children) | 9 | 2818 (number of children) | 18 | ||||
| IPD, all serotypes, PP | Black 2000 | 13,549 (not in published article, personal communication with the author) | 3 (not in published article, personal communication with the author) | 13,569 (not in published article, personal communication with the author) | 42 (not in published article, personal communication with the author) | 92.87 (77.01 to 97.79) | 0.0713 (0.0221 to 0.2299) |
| Cutts 2005 (all children) | 8189 | 30 | 8151 | 59 | 50 (21 to 69) | 0.50 (0.31 to 0.79) | |
| Cutts 2005 (younger than 24 months children) | 10,717 (person‐time) | 27 (not in published article, personal communication with the author) | 10,554 (person‐time) | 51 (not in published article, personal communication with the author) | 47.86 (16.94 to 67.27) | 0.5214 (0.3273 to 0.8306) | |
| Lucero 2009 | 6013 | 2 | 6018 | 3 | 33.7 (‐297 to 88.9) | 0.663 (0.111 to 3.97) | |
| O'Brien 2003 | 2879 (person‐years) | 5 | 2674 (person‐years) | 12 | 61.3 (‐9.7 to 86.35) | 0.3870 (0.1365 to 1.0970) | |
| 2472 (number of children) | 5 | 2283 (number of children) | 12 | ||||
| IPD, vaccine serotypes, ITT | Black 2000 | 18,927 | 3 | 18,941 | 49 | 93.9 (79.6 to 98.5) | 0.061 (0.015 to 0.204) |
| Cutts 2005 (all children) | 8718 | 13 (not in published article, personal communication with Dr Cutts) | 8719 | 45 (not in published article, personal communication with Dr Cutts) | 71 (46 to 86) | 0.29 (0.14 to 0.54) | |
| Cutts 2005 (younger than 24 months children) | 14,167 (person‐time) | 10 (not in published article, personal communication with the author) | 14,095 (person‐time) | 41 (not in published article, personal communication with the author) | 75.73 (51.58 to 87.84) | 0.2427 (0.1216 to 0.4842) | |
| Eskola 2001 | 831 | 0 | 415.5 | 1 | 75 (‐643.66 to 99.16) | 0.25 (0.0084 to 7.4366) | |
| Kilpi 2003 | 835 | 0 | 415.5 | 1 | 75.12 (‐640.1 to 99.16) | 0.2488 (0.0084 to 7.4010) | |
| Klugman 2003 (all children) | 19,922 | 12 | 19,914 | 43 | 72 (46 to 87) | 0.28 (0.13 to 0.54) | |
| Klugman 2003 (HIV‐negative) | 18,633 (Madhi 2005a) | 3 | 18,626 (Madhi 2005a) | 17 | 83 (39 to 97) | 0.17 (0.03 to 0.61) | |
| Klugman 2003 (HIV‐positive) | 1289 (Madhi 2005a) | 9 | 1288 (Madhi 2005a) | 26 | 65 (24 to 86) | 0.35 (0.14 to 0.76) | |
| Lucero 2009 | 6097 | 3 | 6094 | 1 | ‐199 (‐2772 to 68.9) | 2.99 (0.311 to 28.72) | |
| O'Brien 2003 | 4951 (person‐years) | 2 | 4742 (person‐years) | 11 | 82.6 (21.4 to 96.1) | 0.174 (0.039 to 0.786) | |
| 2974 (number of children) | 2 | 2818 (number of children) | 11 | ||||
| IPD, vaccine serotypes, PP | Black 2000 | 13,549 (not in published article, personal communication with the author) | 1 | 13,569 (not in published article, personal communication with the author) | 39 | 97.4 (82.7 to 99.9) | 0.026 (0.001 to 0.173) |
| Cutts 2005 (all children) | 8189 | 9 | 8151 | 38 | 77 (51 to 90) | 0.23 (0.10 to 0.49) | |
| Cutts 2005 (younger than 24 months children) | 10,476 (person‐time) | 6 (not in published article, personal communication with the author) | 10,733 (person time) | 34 (not in published article, personal communication with the author) | 81.92 (56.95 to 92.41) | 0.1808 (0.0759 to 0.4305) | |
| Klugman 2003 (all children) | 18,245 (Madhi 2005a) | not specified | 18,268 (Madhi 2005a) | not specified | not specified | not specified | |
| Klugman 2003 (HIV‐negative) | 17,356 (Madhi 2005a) | 2 | 17,350 (Madhi 2005a) | 13 | 85 (32 to 98) | 0.15 (0.02 to 0.68) | |
| Klugman 2003 (HIV‐positive) | 1201 (Madhi 2005a) | not specified | 1200 (Madhi 2005a) | not specified | 65 (24 to 86) | 0.35 (0.14 to 0.76) | |
| Lucero 2009 | 6013 | 2 | 6018 | 1 | ‐99 (‐2095 to 82.0) | 1.99 (0.18 to 21.95) | |
| O'Brien 2003 | 2879 (person‐years) | 2 | 2674 (person‐years) | 8 | 76.8 (‐9.4 to 95.1) | 0.232 (0.049 to 1.094) | |
| 2472 (number of children) | 2 | 2283 (number of children) | 8 | ||||
| IPD, non‐vaccine serotypes, ITT | Black 2000 | 18,927 | 2 | 18,941 | 3 | 33.28 (‐299.23 to 88.85) | 0.6672 (0.1115 to 3.9923) |
| Cutts 2005 (all children) | 8718 | 28 (not in published article, personal communication with the author) | 8719 | 29 (not in published article, personal communication with the author) | 3.7 (‐68 to 45) | 0.963 (0.55 to 1.68) | |
| Eskola 2001 | 831 | 1 | 415.5 | 0.5 | 0 (‐2874 to 96.64) | 1 (0.0336 to 29.7466) | |
| Kilpi 2003 | 835 | 1 | 415.5 | 0.5 | 0.48 (‐2860.42 to 96.65) | 0.9952 (0.0335 to 29.6042) | |
| Klugman 2003 (all children) | 19,922 | 13 | 19,914 | 9 | ‐44 (‐283 to 43) | 1.44 (0.57 to 3.83) | |
| Klugman 2003 (HIV‐negative) | 18,633 (Madhi 2005a) | 4 | 18,626 (Madhi 2005a) | 1 | ‐300 (‐19599 to 60) | 4 (0.4 to 196.99) | |
| Klugman 2003 (HIV‐positive) | 1289 (from Madhi 2005a) | 9 | 1288 (from Madhi 2005a) | 8 | ‐13 (‐235 to 62) | 1.13 (0.38 to 3.35) | |
| Lucero 2009 | 6097 | 0 | 6094 | 1 | 50.21 (‐1383.83 to 98.33) | 0.4979 (0.0167 to 14.8383) | |
| O'Brien 2003 | 4951 (person‐years) | 5 | 4742 (person‐years) | 5 | 4.22 (‐230.63 to 72.25) | 0.9578 (0.2775 to 3.3063) | |
| 2974 (number of children) | 5 | 2818 (number of children) | 5 | ||||
| IPD, non‐vaccine serotypes, PP | Black 2000 | 13,549 (not in published article, personal communication with the author) | 2 | 13,569 (not in published article, personal communication with the author) | 3 | 33.38 (‐298.07 to 88.88) | 0.6652 (0.1112 to 3.9807) |
| Cutts 2005 (all children) | 8189 | 15 | 8151 | 9 | ‐65 (‐327 to 32) | 1.65 (0.68 to 4.27) | |
| Lucero 2009 | 6013 | 0 | 6018 | 1 | 50.24 (‐1383.01 to 98.33) | 0.4976 (0.0167 to 14.8301) | |
| O'Brien 2003 | 2879 (person‐years) | 2 | 2674 (person‐years) | 2 | 7.12 (‐558.89 to 86.91) | 92.88 (0.1309 to 6.5889) | |
| 2472 (number of children) | 2283 (number of children) | ||||||
| IPD, vaccine‐related serotypes, ITT | Black 2000 | 18,927 | 1 | 18,941 | 3 | 66.64 (‐220.66 to 96.53) | 0.3336 (0.0347 to 3.2066) |
| Cutts 2005 (all children) | 8718 | 10 (not in published article, personal communication with the author) | 8719 | 16 (not in published article, personal communication with the author) | 38 (‐46 to 75) | 0.62 (0.25 to 1.46) | |
| Klugman 2003 (all children) | 19,922 | 10 | 19,914 | 17 | 41 (‐36 to 75) | 0.59 (0.25 to 1.36) | |
| Klugman 2003 (HIV‐negative) | 18,633 (Madhi 2005a) | 4 | 18,626 (Madhi 2005a) | 1 | ‐300 (‐19599 to 60) | 4 (0.4 to 196.99) | |
| Klugman 2003 (HIV‐positive) | 1289 (Madhi 2005a) | 6 | 1288 (Madhi 2005a) | 16 | 63 (‐1 to 88) | 0.37 (0.12 to 1.01) | |
| Lucero 2009 | 6097 | 0 | 6094 | 1 | 50.21 (‐1383 to 98.33) | 0.4979 (0.0167 to 14.8383) | |
| O'Brien 2003 | 4951 (person‐years) | 2 | 4742 (person‐years) | 1 | ‐91.56 (‐2011.83 to 82.62) | 1.9156 (0.1738 to 21.1183) | |
| 2974 (number of children) | 2 | 2818 (number of children) | 1 | ||||
| IPD, vaccine‐related serotypes, PP | Cutts 2005 (all children) | 8189 | 6 | 8151 | 11 | 46 (‐59 to 84) | 0.54 (0.16 to 1.59) |
| Lucero 2009 | 6013 | 0 | 6018 | 1 | 50.24 (‐1383.01 to 98.33) | 0.4976 (0.0167 to 14.8301) | |
| O'Brien 2003 | 2879 (person‐years) | 1 | 2674 (person‐years) | 1 | 7.12 (‐1384.17 to 94.19) | 0.9288 (0.0581 to 14.8417) | |
| 2472 (number of children) | 2283 (number of children) | ||||||
| X‐ray pneumonia, ITT | Hansen 2006 | 8396 (person‐years, not in published article, personal communication with the author) | 38 (not in published article, personal communication with the author) | 8382 (person‐years, not in published article, personal communication with the author) | 51(not in published article, personal communication with the author) | 28.1 (‐9.6 to 52.8) | 0.719 (0.472 to 1.096) |
| Cutts 2005 (all children) | 8718 | 388 (not in published article, personal communication with the author) | 8719 | 590 (not in published article, personal communication with the author) | 35 (26 to 43) | 0.65 (0.57 to 0.74) | |
| Cutts 2005 (younger than 24 months children) | 13,728 (person‐time) | 361(not in published article, personal communication with the author) | 13,537 (person‐time) | 551 (not in published article, personal communication with the author) | 35.39 (26.38 to 43.3) | 0.6461 (0.567 to 0.7362) | |
| Klugman 2003 (all children) | 19,922 | 356 | 19,914 | 428 | 17 (4 to 28) | 0.83 (0.72 to 0.96) | |
| Klugman 2003 (HIV‐negative) | 18,633 (Madhi 2005a) | 169 | 18,626 (Madhi 2005a) | 212 | 20 (2 to 35) | 0.80 (0.65 to 0.98) | |
| Klugman 2003 (HIV‐positive) | 1289 (Madhi 2005a) | 182 | 1288 (Madhi 2005a) | 209 | 13 (‐7 to 29) | 0.87 (0.71 to 1.07) | |
| Lucero 2009 | 6097 | 119 | 6094 | 141 | 16 (‐7.3 to 34.2) | 0.84 (0.658 to 1.073) | |
| O'Brien 2002 | 4058 (person‐years) | 162 | 3866 (person‐years) | 139 | ‐11.0 (‐39.3 to 11.5) | 1.11 (0.885 to 1.393) | |
| 2974 (number of children) | 162 | 2818 (number of children) | 139 | ||||
| X‐ray pneumonia, PP | Hansen 2006 | 5634 (person‐years, not in published article, personal communication with the author) | 28 (not in published article, personal communication with the author) | 5594 (person‐years, not in published article, personal communication with the author) | 45 (not in published article, personal communication with the author) | 41.0 (5.2 to 63.3) | 0.59 (0.367 to 0.948) |
| Cutts 2005 (all children) | 8189 | 333 | 8151 | 513 | 37 (27 to 45) | 0.63 (0.55 to 0.73) | |
| Cutts 2005 (younger than 24 months children) | 10,620 (person‐time) | 305 (not in published article, personal communication with the author) | 10,382 (person‐time) | 473 (not in published article, personal communication with the author) | 36.96 (27.39 to 45.27) | 0.6304 (0.5473 to 0.7261) | |
| Klugman 2003 (all children) | 18,245 (Madhi 2005a) | not specified | 18,268 (Madhi 2005a) | not specified | not specified | not specified | |
| Klugman 2003 (HIV‐negative) | 17,356 (Madhi 2005a) | 119 | 17,350 (Madhi 2005a) | 158 | 25 (4 to 41) | 0.75 (0.59 to 0.96) | |
| Klugman 2003 (HIV‐positive) | 1201 (Madhi 2005a) | not specified | 1200 (Madhi 2005a) | not specified | not specified | not specified | |
| Lucero 2009 | 6013 | 93 | 6018 | 120 | 22.9 (‐1.1 to 41.2) | 0.771 (0.5888 to 1.011) | |
| O'Brien 2002 | 2350 (person‐years) | 147 | 2176 (person‐years) | 126 | ‐8.0 (‐37.0 to 14.9) | 1.08 (0.851 to 1.37) | |
| 2472 (number of children) | 147 | 2283 (number of children) | 126 |
9. Vaccine and control group's events (clinical pneumonia, all‐cause admissions and all‐cause mortality).
| Outcome | Study | Vaccine denominator | Vaccine events | Control denominator | Control events | VE (95% CI) | RR (95% CI) |
| Clinical pneumonia, ITT | Black 2002a | 30,301 (person‐years) | 43.8 (cases per 1000 person years) | 30,327 (person‐years) | 47.1 (cases per 1000 person years) | 6.9 (‐0.3 to 13.6) | 0.931 (0.864 to 1.003) |
| 18,926 (number of children) | 18,942 (number of children) | ||||||
| Cutts 2005 (all children) | 8718 | 2808 (not in published article, personal communication with the author) | 8719 | 2943 (not in published article, personal communication with the author) | 6 (1 to 11) | 0.94 (0.89 to 0.99) | |
| Cutts 2005 (younger than 24 months children) | 11,695 (person‐time) | 2603 (not in published article, personal communication with the author) | 11,527 (person‐time) | 2746 (not in published article, personal communication with the author) | 6.57 (2.07 to 10.86) | 0.9343 (0.8914 to 0.9793) | |
| Lucero 2009 | 6097 | 1093 | 6094 | 1080 | ‐0.8 (‐9.6 to 7.4) | 1.008 (0.926 to 1.096) | |
| Madhi 2005a (all children) | 19,922 | 1493 | 19,914 | 1646 | 9 (3 to 15) | 0.91 (0.85 to 0.97) | |
| Madhi 2005a (HIV‐negative) | 18,633 | 1033 | 18,626 | 1106 | 7 (‐1 to 14) | 0.93 (0.86 to 1.01) | |
| Madhi 2005a (HIV‐positive) | 1289 | 412 | 1288 | 487 | 15 (6 to 24) | 0.85 (0.76 to 0.94) | |
| Clinical pneumonia, PP | Black 2002a | 17,645 (person‐years) | 53.6 (cases per 1000 person years) | 17,695 (person‐years) | 56.8 (cases per 1000 person years) | 5.5 (‐3.3 to 13.5) | 0.945 (0.865 to 1.033) |
| 16,901 (number of children) | 16,865 (number of children) | ||||||
| Cutts 2005 (all children) | 8189 | 2172 | 8151 | 2284 | 7 (1 to 12) | 0.93 (0.88 to 0.99) | |
| Cutts 2005 (younger than 24 months children) | 8007 (person‐time) | 2000 (not in published article, personal communication with the author) | 7865 (person‐time) | 2120 (not in published article, personal communication with the author) | 7.33 (2.33 to 12.08) | 0.9267 (0.8792 to 0.9767) | |
| Lucero 2009 | 6013 | 934 | 6018 | 930 | 0.1 (‐9.4 to 8.7) | 0.999 (0.913 to 1.094) | |
| Madhi 2005a (all children) | 18,245 | 858 | 18,268 | 970 | 11 (3 to 19) | 0.89 (0.81 to 0.97) | |
| Madhi 2005a (HIV‐negative) | 17,356 | 650 | 17,350 | 717 | 9 (‐1 to 18) | 0.91 (0.82 to 1.01) | |
| Madhi 2005a (HIV‐positive) | 1201 | 186 | 1200 | 228 | 18 (3 to 31) | 0.82 (0.69 to 0.97) | |
| All‐cause admissions, ITT | Cutts 2005 (all children) | 8718 | 1313 (not in published article, personal communication with the author) | 8719 | 1485 (not in published article, personal communication with the author) | 13 (6 to 19) | 0.87 (0.81 to 0.94) |
| Cutts 2005 (younger than 24 months children) | 12,996 (person‐time) | 1215 (not in published article, personal communication with the author) | 12,827 (person‐time) | 1353 (not in published article, personal communication with the author) | 11.37 (4.61 to 17.65) | 0.8863 (0.8235 to 0.9539) | |
| Lucero 2009 | 6097 | 1538 | 6094 | 1506 | 2.4 (‐9.23 to 4) | 1.024 (0.96 to 1.0923) | |
| All‐cause admissions, PP | Cutts 2005 (all children) | 8189 | 1065 | 8151 | 1216 | 15 (7 to 21) | 0.85 (0.79 to 0.93) |
| Cutts 2005 (younger than 24 months children) | 9949 (person‐time) | 964 (not in published article, personal communication with the author) | 9718 (person‐time) | 1081 (not in published article, personal communication with the author) | 12.89 (5.43 to 19.77) | 0.8711 (0.8023 to 0.9457) | |
| Lucero 2009 | 6013 | 1396 | 6018 | 1387 | ‐0.78 (‐7.76 to 5.75) | 1.0078 (0.9425 to 1.0776) | |
| All‐cause mortality, ITT | Cutts 2005 (all children) | 8718 | 426 (not in published article, personal communication with the author) | 8719 | 491 (not in published article, personal communication with the author) | 14 (2 to 24) | 0.86 (0.76 to 0.98) |
| Cutts 2005 (younger than 24 months children) | 14,006 (person‐time) | 376 (not in published article, personal communication with the author) | 13,962 (person‐time) | 424 (not in published article, personal communication with the author) | 11.6 (‐1.36 to 22.91) | 0.884 (0.7709 to 1.0136) | |
| Eskola 2001 | 831 | 1 | 415.5 | 0 | 0 (‐2874.66 to 96.64) | 1 (0.0336 to 29.7466) | |
| Kilpi 2003 | 835 | 1 | 415.5 | 0 | 0.48 (‐2860.42 to 96.65) | 0.9952 (0.0335 to 29.6042) | |
| Klugman 2003 (all children) | 19,922 | 229 | 19,914 | 242 | 5.41 (‐13.2 to 20.96) | 0.9459 (0.7904 to 1.132) | |
| Klugman 2003 (HIV‐negative) | 18,633 (Madhi 2005a) | 36 | 18,626 (Madhi 2005a) | 36 | 0.04 (‐58.59 to 36.99) | 0.9996 (0.6301 to 1.5859) | |
| Klugman 2003 (HIV‐positive) | 1289 (Madhi 2005a) | 166 | 1288 (Madhi 2005a) | 176 | 5.75 (‐14.82 to 22.65) | 0.9425 (0.7735 to 1.1482) | |
| Lucero 2009 | 6097 | 30 | 6094 | 34 | 12.14 (‐43.45 to 46.18) | 0.8786 (0.5382 to 1.4345) | |
| All‐cause mortality, PP | Cutts 2005 (all children) | 8189 | 330 | 8151 | 389 | 16 (3 to 28) | 0.84 (0.72 to 0.97) |
| Cutts 2005 (younger than 24 months children) | 10,823 (person‐time) | 281 (not in published article, personal communication with the author) | 10,708 (person‐time) | 324 (not in published article, personal communication with the author) | 14.19 (‐0.45 to 26.7) | 0.8581 (0.733 to 1.0045) | |
| Lucero 2009 | 6013 | 29 | 6018 | 33 | 12.62 (‐43.78 to 46.9) | 0.8738 (0.531 to 1.4378) |
10. Invasive pneumococcal disease events rates.
| Outcome | Study | All children | All events | Vaccine events rate | Control events rate | All events rate |
| (randomized) | (vaccine+control events) | (per 100,000 children) | (per 100,000 children) | (per 100,000 children) | ||
| IPD, all serotypes, ITT | Black 2000 | 37,868 | 61 | 32 | 290 | 161 |
| Cutts 2005 (<29 months old children) | 17,437 | 115 | 470 | 849 | 660 | |
| Eskola 2001 | 1246.5 | 2.5 | 120 | 361 | 201 | |
| Kilpi 2003 | 1250.5 | 2.5 | 120 | 361 | 200 | |
| Klugman 2003 (HIV‐negative children) | 37,259 | 30 | 59 | 102 | 81 | |
| Lucero 2009 | 12,191 | 6 | 49 | 49 | 49 | |
| O'Brien 2003 | 5792 | 27 | 303 | 639 | 466 | |
| All studies | 113,044 | 244 | 126 | 307 | 216 | |
| IPD, vaccine serotypes, ITT | Black 2000 | 37,868 | 52 | 16 | 259 | 137 |
| Cutts 2005 (<29 months old children) | 17,437 | 58 | 149 | 516 | 333 | |
| Eskola 2001 | 1246.5 | 1 | 0 | 241 | 80 | |
| Kilpi 2003 | 1250.5 | 1 | 0 | 241 | 80 | |
| Klugman 2003 (HIV‐negative children) | 37,259 | 20 | 16 | 91 | 54 | |
| Lucero 2009 | 12,191 | 4 | 49 | 16 | 33 | |
| O'Brien 2003 | 5792 | 13 | 67 | 390 | 224 | |
| All studies | 113,044 | 149 | 43 | 223 | 132 | |
| IPD, non‐vaccine serotypes, ITT | Black 2000 | 37,868 | 5 | 11 | 16 | 13 |
| Cutts 2005 (<29 months old children) | 17,437 | 57 | 321 | 333 | 327 | |
| Eskola 2001 | 1246.5 | 1.5 | 120 | 120 | 120 | |
| Kilpi 2003 | 1250.5 | 1.5 | 120 | 120 | 120 | |
| Klugman 2003 (HIV‐negative children) | 37,259 | 5 | 21 | 5 | 13 | |
| Lucero 2009 | 12,191 | 1 | 0 | 16 | 8 | |
| O'Brien 2003 | 5792 | 10 | 168 | 177 | 173 | |
| All studies | 113,044 | 81 | 81 | 71 | 72 | |
| IPD, vaccine‐related serotypes, ITT | Black 2000 | 37,868 | 4 | 5 | 16 | 11 |
| Cutts 2005 (<29 months old children) | 17,437 | 26 | 115 | 184 | 149 | |
| Klugman 2003 (HIV‐negative children) | 37,259 | 5 | 21 | 5 | 13 | |
| Lucero 2009 | 12,191 | 1 | 0 | 16 | 8 | |
| O'Brien 2003 | 5792 | 3 | 67 | 35 | 52 | |
| All children | 110,547 | 39 | 35 | 40 | 35 |
11. Proportion of IPD caused by vaccine type S. pneumoniae.
| Study | Vaccine group (%) | Control group (%) |
| Black 2000 | 50 | 89 |
| Cutts 2005 (<29 months old children) | 32 | 61 |
| Eskola 2001 | 0 | 67 |
| Kilpi 2003 | 0 | 67 |
| Klugman 2003 (HIV‐negative children) | 27 | 89 |
| Lucero 2009 | 100 | 33 |
| O'Brien 2003 | 22 | 61 |
Excluded studies
Forty‐six publications were initially considered for inclusion, despite having outcomes other than those specified in the inclusion criteria on account of possible cases of IPD and other outcomes. However, on closer scrutiny, they all turned out to have no IPD or X‐ray pneumonia as outcomes, or they were not RCTs.
Risk of bias in included studies
We assessed the methodological quality of 11 publications (Black 2000; Black 2002a; Cutts 2005; Eskola 2001; Hansen 2006; Kilpi 2003; Klugman 2003; Lucero 2009; Madhi 2005a; O'Brien 2002; O'Brien 2003). The methodological quality of Hansen 2006 and Madhi 2005a follows that of their parent trials Black 2000, and Klugman 2003, respectively. O'Brien 2002 follows the same methodological assessment of O'Brien 2003. In the case of Eskola 2001 and Kilpi 2003, they share the same methodological assessment in that they belong to one Finnish trial that utilised the same control population, differing only in the protein conjugates used for the treatment arms, Eskola 2001 having utilised the S. pneumoniae CRM197 while Kilpi 2003, the S. pneumoniae OMP. Details are available in the 'Risk of Bias' table in the 'Characteristics of included studies' table. Review Manager (RevMan 2008) automatically generates an individual 'Risk of bias' table and a corresponding risk of bias summary graph for all eleven included studies. To avoid making duplicates of assessment for publications arising from a single trial (i.e. Black 2000; Black 2002a; Hansen 2006 from the NCKP trial), we made a separate risk of bias summary graph for only six trials (instead of 11 publications) so that a true summary could be created (Figure 1).
1.
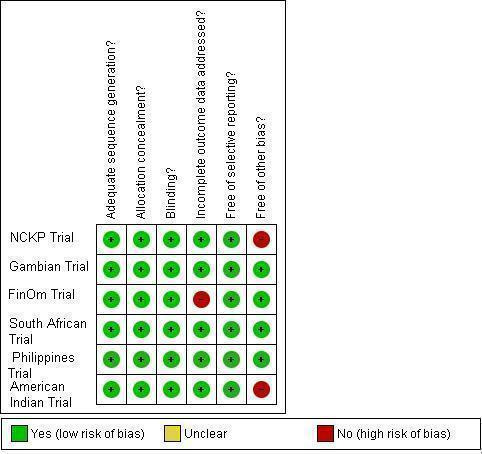
Methodological quality summary: review authors' judgements about each methodological quality item for each of the six included trials.
Allocation
All included trials had adequate sequence generation having made use of a computer‐generated random sequence. Five trials (Finnish, South African, American Indian, Philippines, and the Gambian Trial) stated explicitly in the published articles how the random sequence was generated. On further inquiry, the NCKP trial affirmed to have used a computer‐generated random sequence as well (Hansen 2008b).
All trials had adequate allocation concealment. The Finnish trial used sequentially‐labelled smaller envelopes in bigger envelopes prepared by an external consultant and a vaccinator who was not involved in any other activities (Palmu 2003a); the Gambian trial used sequentially‐numbered, opaque, sealed envelopes; the Philippines, the NCKP (Hansen 2008b), and the American Indian trials used sequentially‐labelled vaccine containers of identical appearance. The South African trial also used identical‐looking vaccine and placebo containers, but used colour‐codes instead of serial numbers (Klugman 2008a).
As all six trials had adequate generation of random sequence and concealment of allocation, all six trials were adequately randomised.
Blinding
All included trials, except for the NCKP trial, indicated explicitly in the published articles that blinding was done on participants, staff, and outcome assessors. On verification with Black (Black 2008), however, participants, staff and investigators were all blinded as well.
Incomplete outcome data
Except for Eskola 2001 and Kilpi 2003, all included publications adequately addressed the domain on incomplete data outcome. In Eskola 2001, 45 out of 831 in the S. pneumoniae CRM group and 37 out of 831 in the hepatitis B control group were not accounted for. Similarly for Kilpi 2003, 30 out of 835 in the S. pneumoniae OMPC group and 37 out of 831 in the hepatitis B control group were not accounted for. In both publications, the reasons for these exclusions were not addressed even though the patients had been allocated to the interventions. The investigators chose to do per protocol analysis instead of ITT analysis and the reason they gave was that compliance was excellent, with more than 95% of children enrolled having had complete follow‐up data.
Selective reporting
We did not encounter selective reporting in the trials that we reviewed.
Other potential sources of bias
Potential threats to validity were noted in two trials that stopped early for benefit, namely, the NCKP and the American Indian trials both of which tested Wyeth's 7PCV, because the vaccine was accepted for licensure during the course of the trial. Where early stopping for apparent benefit demonstrated at an interim evaluation used to be fairly acceptable in past years, studies have shown that this trend may introduce bias. Trials that were stopped early (whether or not as a result of a formal stopping rule) are more likely to show extreme intervention effects than those that continue to the end, particularly if they have very few events (Montori 2005). Alternatively, this might be the case when a study stops because early results show large, statistically significant, intervention effect, although it may also be the case if a study stops because of harm. If a study does not describe having a pre‐specified sample size, or any formal stopping rules, or the attained sample size is much less than the intended size but no explanation is given, then the study may have stopped at a point chosen because of the observed results, and so the available results may be biased (Higgins 2008a). In the O'Brien 2003 article itself, qualified in a personal communication (O'Brien 2009b), the authors mentioned that despite the limitations of a cluster‐randomised trial, only the mixing of the intervention and control groups was certain to have occurred to some degree in the trial. They had no trouble maintaining the masking (O'Brien 2009b). On the other hand, we maintain that because of early termination of trial, the appropriate sample size was not attained. As written earlier, we had assessed that the American Indian trial (O'Brien 2002; O'Brien 2009a) had time lag bias for late reporting of the X‐ray defined pneumonia outcome.
Summarising risk of bias for an outcome within a study (across domains)
All six trials reviewed showed a low risk of bias for three critical and important domains namely: sequence generation, allocation concealment, and blinding (see Figure 2 and Figure 1). However, based on the criteria set by RevMan 5, the Finnish trial would have been considered as having a high risk of bias in terms of incomplete data outcome (Figure 1). The US trials of Black (Black 2000; Black 2002a; Hansen 2006) and O'Brien (O'Brien 2002; O'Brien 2003), were considered as having a high risk of bias for the early stopping of trial. The late reporting of results for X‐ray defined pneumonia (results appearing five years after the trial ended) puts the American Indian trial at an added risk of time‐lag bias.
2.
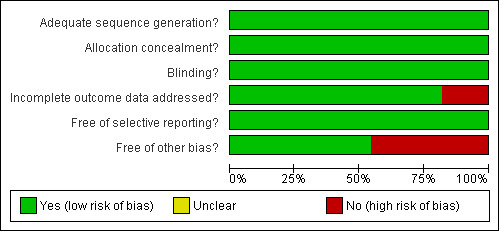
Methodological quality graph: review authors' judgements about each methodological quality item presented as percentages across all included studies.
Despite the biases mentioned, the authors of this review also considered other factors in their final judgment of risk of bias for particular outcomes. For example, the number of missing data for the IPD outcome in the Finnish trial was too few and was similar in both intervention and control groups. Moreover, the risk of IPD was very low for this particular study population that a few missing data would not impact on the effect estimate. The same is true for the USA trials. Even though it is true that the trials in the USA were stopped early for apparent benefit brought on by the intervention, the magnitude of the effect of the intervention against the IPD outcome was very large (RR < 0.5) offsetting any bias that may have been introduced by early stopping. The results are shown in several tables: the 'Summary of Findings' table provides much clearer and more detailed information in the 'Additional Tables' section, particularly Table 13 and Table 14 generated from GradePro 2008. Tables 18 and 19 were created using GRADEPro software as a single table with 14 columns. However, duplicating the table into RevMan's Additional table section was not possible because RevMan 5 can only create tables with a maximum of 10 columns.
12. Quality assessment of the studies reviewed using GRADEPRO criteria.
| No of studies | Design | Limitations | Inconsistency | Indirectness | Imprecision | Other factors considered |
| IPD, vaccine serotypes, ITT (Random) (follow‐up mean 24 months) | ||||||
| 7 | Randomized controlled trial | Serious1 | No serious inconsistency | No serious indirectness | No serious imprecision2 | strong association3 |
| IPD, all serotypes, ITT (Random) (follow‐up mean 24 months) | ||||||
| 7 | Randomized controlled trial | Serious1 | No serious inconsistency | No serious indirectness | No serious imprecision2 | strong association3 |
| X‐ray defined pneumonia, ITT (random) (follow‐up mean 24 months) | ||||||
| 4 | Randomized controlled trial | Serious4a,5 | No serious inconsistency | No serious indirectness | No serious imprecision | None (see 4b) |
| Clinical pneumonia, ITT (random) (follow‐up mean 24 months) | ||||||
| 4 | Randomized controlled trial | Serious4a | No serious inconsistency | No serious indirectness | No serious imprecision | None (see 4b) |
1 Incomplete accounting of patients and outcome events for the Finnish trial (Eskola 2001; Kilpi 2003) and early stopping for the US trials (Black 2000; O'Brien 2003)
2 Total number of events for VT (142) and all serotypes (233) IPD are less than 300 (criteria from the GRADEPro 2008) which should further downgrade the quality of evidence for imprecision. However, the event rates (0.1% for VT IPD and 0.2% for all serotypes) were considered low. Therefore the quality of evidence was not downgraded
3 Since the effect was large (RR < 0.5) with RR of 0.20 for VT‐IPD and 0.42 for all serotype IPD, the "serious" limitation was removed and the evidence was upgraded to high
4a Early stopping for the NCKP trial (Black 2002a; Hansen 2006); 4b effect was not large therefore quality of evidence was not increased
5 Excludes O'Brien 2002 since results are invalid for X‐ray pneumonia
13. Summary of Findings with absolute effects using GRADEPRO software.
| Number of events/Number of patients (rate in %) | Effect | Absolute effect4 in areas with varying risks of outcome (low, medium, high) | Quality of evidence | Importance of outcome | ||
| 11PCV | Placebo or other vaccines1 | Risk ratio (95% CI) | Absolute effect (95% CI) | |||
| IPD, vaccine serotypes, ITT (random) (follow‐up mean 24 months) | ||||||
| 21/57,015 (0%)2,3 | 121/56,029 (0.2%)2,3 | RR 0.20 (0.1 to 0.42) | 2 (1 to 2) fewer per 1000 | 2 fewer per 1,0006 | ⊕⊕⊕⊕ HIGH |
CRITICAL |
| 0.5% | 4 fewer per 1,0007 | |||||
| IPD, all serotypes, ITT (random) (follow‐up mean 24 months) | ||||||
| 69/57,015 (0.1%)2,3 | 164/56,029 (0.4%)2,3 | RR 0.42 (0.25 to 0.71) | 2 (1 to 2) fewer per 1000 | 2 fewer per 1,0006 | ⊕⊕⊕⊕ HIGH |
IMPORTANT |
| 0.8% | 5 fewer per 1,0007 | |||||
| X‐ray defined pneumonia, ITT (random) (follow‐up mean 24 months) | ||||||
| 687/52,374 (1.3%)2,3 | 955/52,381 (0.3%)7,8 | RR 0.73 (0.64 to 0.85) | 5 (3 to 6) fewer per 1000 | 1 fewer per 1,0005 | ⊕⊕⊕O MODERATE |
CRITICAL |
| 1.7% | 5 fewer per 1,0006 | |||||
| 6.3% | 17 fewer per 1,0007 | |||||
| Clinical pneumonia, ITT (random) (follow‐up mean 24 months) | ||||||
| 6057/52,374 (11.6%)2,3 | 6361/52,381 (5.9%)2,3 | RR 0.94 (0.91 to 0.98) | 7 (2 to 11) fewer per 1000 | 4 fewer per 1,0005 | ⊕⊕⊕O MODERATE |
IMPORTANT |
| 12.6% | 8 fewer per 1,0006 | |||||
| 31.5% | 19 fewer per 1,0007 | |||||
1 Risk of relevant outcome in control populations: VT‐IPD and all serotype IPD (Medium and High); X‐ray and clinical pneumonia (Low, Medium, and High)
2 Denominators from Cutts still used the numbers from children younger than 29 months of age because we could not obtain data from the authors (Cutts 2005)
3 Corresponding intervention risk (per 1000 people) = 1000 x ACR x RR where ACR = Assumed Control Risk, RR = Risk Ratio or Relative Risk; Assumed risk was calculated from low, medium, and high control group risk from the included studies
4 Absolute effect (per 1000 people) = 1000 x | CER x (1‐RR)| where CER = Control Event Rate (CER = number of people with event in control groups / total number of people in control groups) RR = Risk Ratio
5 Absolute effect in populations with Low risk of relevant outcome
6 Absolute effect in populations with Medium risk of relevant outcome
7 Absolute effect in populations with High risk of relevant outcome
Thus, for the IPD outcome, we have judged the publications to have a low risk of bias. Not so for the pneumonia outcomes. Although for IPD, the authors considered Black 2000 as having low risk of bias for reasons stated above, this is not true for the pneumonia outcomes (X‐ray defined and clinical pneumonia). A high risk of bias was retained for the USA study of Black 2000 for the pneumonia outcome. The pooled RR from the analysis for X‐ray defined pneumonia was not large, only 0.73 (VE of 27%), and although the result showed that the PCV reduced the incidence of X‐ray defined pneumonia, there is a possibility that the results could still be affected by small changes in the numbers analysed, if for example, the study had not been prematurely terminated, and more events could have been collected. Overall, for the pneumonia outcomes, there is a high risk of bias for both Black 2000 and O'Brien 2003 (early stopping of trial) and presence of time lag bias (O'Brien 2002). For all‐cause mortality, despite having data from five publications, these were not powered to detect VE against this outcome. The Gambian trial originally had all‐cause mortality as the primary outcome but this was changed during the course of the study to X‐ray defined pneumonia. Still, among the five publications with mortality data, it is possible that the Gambian trial may have come close to having power to detect a difference of impact between groups for this outcome. The other four did not attempt to have mortality as an outcome but reported whatever data they had in the publications emanating from their respective trials.
Effects of interventions
See: Table 1
A total of 113,044 children were randomised. The trial from South Africa reported the results of the efficacy of PCV among HIV‐1 negative and positive infants (Klugman 2003). The rest of the trials did not indicate the HIV‐1 status of participating infants and for this review, they were presumed to be HIV‐1 negative. The principal analysis involved HIV‐1 negative infants. However, we also conducted subgroup analysis combining the results for HIV‐1 negative and HIV‐1 positive infants from South Africa and pooled this with the results from other publications.
Results from analyses using data from HIV‐1 negative infants from the South African study and children <24 months of age from the Gambian study pooled with the other studies
(A) Risk ratio and vaccine efficacy for vaccine serotypes IPD (VT‐IPD); ITT analysis
Seven publications (Black 2000; Cutts 2005; Eskola 2001; Kilpi 2003; Klugman 2003; Lucero 2009; O'Brien 2003) had data for VT‐IPD. Using the ITT population, we conducted analysis using the generic inverse variance method and random‐effects model, to obtain a pooled RR. The pooled RR was 0.20 (95% CI 0.10 to 0.42, P < 0.0001). Thus, the pooled VE for VT‐IPD was 80% (95% CI 58% to 90%). The I2 was 34% (P = 0.17), representing some heterogeneity but which might not be important (Deeks 2008). Refer to Figure 3 for more details. Despite the low I2 of 34% we conducted a sensitivity analysis that took into account exclusion of publications according to the presence of characteristics peculiar to an individual or group of studies (see Table 4 – Summary of analysis to explore heterogeneity): a) Outlying study, i.e., having an effect or estimate with a different direction compared to the other publications (Lucero 2009). With the exclusion of just one study (Lucero 2009) that had an RR of 2.99 (95% CI 0.31 to 28.73) and the only one with a different direction of effect from the other publications, the I2 decreased considerably to 0% (P = 0.64) with a pooled RR of 0.18 (95% CI 0.11 to 0.30). b) Small number of outcome events (Eskola 2001; Kilpi 2003; Lucero 2009). With the exclusion of these publications from the model, the I2 decreased to 11% with a P = 0.34 with a RR of 0.17 (95% CI 0.09 to 0.31, P < 0.00001). The heterogeneity was thus explained by the presence of an outlier. Despite this, the point estimate remained high even after the sensitivity analysis using the above exclusion models. It must be noted that the authors have judged all the publications included in this review to have a low risk of bias for the IPD outcome.
3.
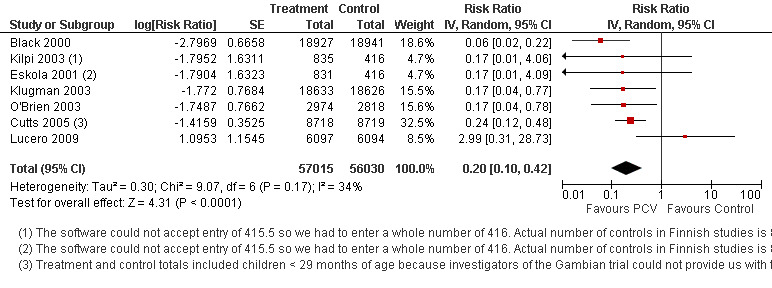
Forest plot of comparison: 1 HIV‐1 negative and <24 months children, outcome: 1.1 IPD, vaccine serotypes, ITT (Random‐effects model).
(B) Risk ratio and vaccine efficacy for all serotypes‐IPD; ITT analysis
From the same seven publications in (A) above and using the same methods of analysis (generic inverse and random‐effects), the pooled RR for all serotypes‐IPD was 0.42 (95% CI 0.25 to 0.71, P = 0.001). The pooled VE was 58% (95% CI 29% to 75%). The I2 was 49% and P = 0.07. See Figure 4.
4.
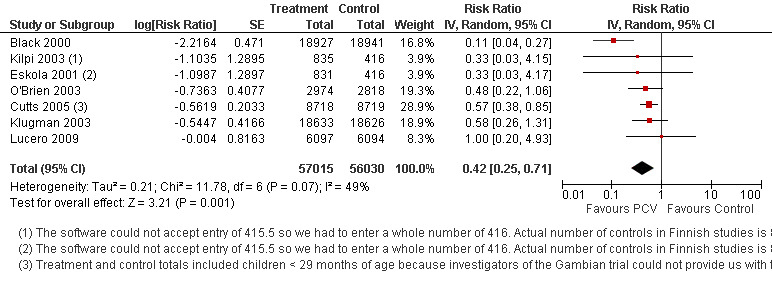
Forest plot of comparison: 1 HIV‐1 negative and <24 months children, outcome: 1.2 IPD, all serotypes, ITT (Random‐effects model).
Sensitivity analysis excluding Eskola 2001, Kilpi 2003, and Lucero 2009 did not explain the heterogeneity although the effect estimate improved to 0.39 (95% CI 0.20 to 0.75, P = 0.005, I2 = 72%, P = 0.01). Upon examination of individual effect estimates, Black 2000 had the highest VE (or lowest RR). Upon exclusion of Black 2000, the heterogeneity disappeared with an I2 of 0%, P = 0.96 but still with high pooled RR of 0.56 (95% CI 0.41 to 0.77).
(C) Risk ratio and vaccine efficacy for non‐vaccine serotypes IPD (NVT‐IPD); ITT analysis
Only six out of the seven publications in (A) had data on NVT‐IPD (Black 2000; Eskola 2001; Kilpi 2003; Klugman 2003; Lucero 2009; O'Brien 2003). Using the same method of analysis as (A) (generic inverse and random‐effects), the pooled RR was 0.92 (95% CI 0.39 to 2.17). The pooled VE for NVT‐IPD was 8% (95% CI ‐117% to 61%; P = 0.84). There was no heterogeneity (I2 0%, P = 0.93). See Figure 5.
5.

Forest plot of comparison: 1 HIV‐1 negative and <24 months children, outcome: 1.3 IPD, non‐vaccine serotypes, ITT (Random‐effects model).
(D) Risk ratio and vaccine efficacy for vaccine‐related serotypes IPD (VRT‐IPD); ITT analysis
Four publications provided information on VRT‐IPD (Black 2000; Klugman 2003; Lucero 2009; O'Brien 2003). Using the generic inverse and random‐effects model, the pooled RR was 0.89 (95% CI 0.24 to 3.36, P = 0.87) giving a pooled VE of 11% (95% CI ‐236% to 76%) for VRT‐IPD. There was no statistical heterogeneity (I2 0%, P = 0.50).
(E) Risk ratio and vaccine efficacy for WHO X‐ray defined pneumonia; ITT analysis
From four publications with results of analysis on the effect of PCV on WHO X‐ray defined pneumonia (Cutts 2005; Hansen 2006; Klugman 2003; Lucero 2009), and from O'Brien 2002 in which results were provided by O'Brien in a personal communication (O'Brien 2009c), the pooled RR was 0.81 (95% CI 0.66 to 1.00, P = 0.05, random‐effects model) giving a VE of 19% (95% CI 0% to 44%) for X‐ray defined pneumonia. Heterogeneity was present with I2 = 77%, and P = 0.001. The outlier was the American Indian trial with a VE of –11.0% (95% CI ‐39.3% to 11.5%). The PCV did not decrease the incidence of X‐ray defined pneumonia in this trial. See Figure 6.
6.

Forest plot of comparison: HIV‐1 negative and <24 months children, outcome: X‐ray defined pneumonia ITT (Random‐effects model) with five studies included in the model (includes the PCV X‐ray pneumonia effect among American Indian children as provided in O'Brien 2009c)
In exploring heterogeneity, sensitivity analysis was done taking out O'Brien 2002. The pooled estimate decreased with a RR of 0.73 (95% CI 0.64 to 0.85, P < 0.0001, I2 41%, P = 0.16, random‐effects model) giving a VE of 27% (95% CI 15% to 36%) for X‐ray defined pneumonia. I2 decreased but heterogeneity was still present although not significant. The RR was also not large (i.e., not < 0.5) even if significant. See Figure 7.
7.

Forest plot of comparison: HIV‐1 negative and <24 months children, outcome: X‐ray defined pneumonia ITT (Random‐effects model); excludes the outlier result of the PCV effect against X‐ray defined pneumonia among American Indian children
Because there were only four publications left in the model, we did not want to do sensitivity analysis excluding one more study. But we needed to know whether the other publication with a bias (Hansen 2006) would remove heterogeneity if excluded together with O'Brien 2002. Its exclusion only increased the I2 to 61%. Upon closer look at individual estimates of the publications left in the model (four including Hansen 2006 which was re‐included), the study of Cutts 2005 was the one which had the highest estimate. With exclusion of Cutts 2005 and O'Brien 2002, the heterogeneity disappeared (I2 = 0%) and with a pooled RR of 0.80 (95% CI 0.69 to 0.93) which was still significant. If only Cutts 2005 were excluded, heterogeneity remained (I2 = 49%) and the pooled RR was 0.88 (95% CI 0.73 to 1.05).
Thus for X‐ray defined pneumonia, the final model excluded the study of O'Brien in which the quality was doubtful because of the limitations previously mentioned (early stopping of trial and time lag bias). The final result for this outcome would therefore be: RR of 0.73 (95% CI 0.64 to 0.85, P < 0.0001, I2 41%, P = 0.16) giving a VE of 27% (95% CI 15% to 36%). Please see Table 5.
(F) Risk ratio and vaccine efficacy for clinical pneumonia; ITT analysis
Four publications (Black 2002a; Cutts 2005; Lucero 2009; Madhi 2005a) which had data on clinical pneumonia showed a pooled RR of 0.94 (95% CI 0.91 to 0.98, P = 0.0006, random‐effects model). The pooled VE was 6% (95% CI 2% to 9%). There was no statistical heterogeneity (I2 0%, P = 0.43). See Figure 8.
8.

Forest plot of comparison: 1 HIV‐1 negative and <24 months children, outcome: 1.6 Clinical pneumonia, ITT (Random‐effects model).
(G) Risk ratio and vaccine efficacy for all‐cause admissions; ITT analysis
From the data on all‐cause admissions for the two publications (Cutts 2005; Lucero 2009), the pooled RR was 0.95 (95% CI 0.83 to 1.10) for random‐effects model. The pooled VE was 5% (95% CI ‐10% to 17%, P = 0.50) for random‐effects model. There was statistical heterogeneity (I2 87%, P = 0.006). However, the results are not valid because there were only two publications reviewed.
(H) Risk ratio and vaccine efficacy for all‐cause mortality; ITT analysis
From five articles (Cutts 2005; Eskola 2001;Kilpi 2003; Klugman 2003; Lucero 2009) with data on all‐cause mortality, the pooled RR was 0.89 (95% CI 0.79 to 1.01, P = 0.08, random‐effects models) with VE of 11% (95% CI ‐1% to 21%). There was no statistical heterogeneity (I2 0%, P = 0.98). See Figure 9. Despite the absence of heterogeneity, we still conducted analysis excluding the four other publications which had mortality data results but not as primary or secondary outcomes (Eskola 2001;Kilpi 2003; Klugman 2003; Lucero 2009). The exclusion of one, two, three or even four publications did not change the pooled RR significantly (range of 0.88 to 0.89).
9.

Forest plot of comparison: 1 HIV‐1 negative and <24 months children, outcome: 1.8 All‐cause mortality, ITT (Random‐effects model).
Please refer to Table 15 for additional information.
14. Summary results (Children < 24 months and/or HIV‐1 negative children).
| Outcome | Heterogeneity P‐value | I2 | Effect P‐value | RR [95% CI] | VE [95% CI] | Included studies |
| IPD, vaccine serotypes, ITT (Random) | P = 0.17 | 34% | P < 0.0001 | 0.20 [0.10, 0.42] | 80 [58, 90] | Black 2000; Cutts 2005; Eskola 2001; Kilpi 2003; Klugman 2003; Lucero 2009; O'Brien 2003 |
| IPD, all serotypes, ITT (Random) | P = 0.07 | 49% | P = 0.001 | 0.42 [0.25, 0.71] | 58 [29, 75] | Black 2000; Cutts 2005; Eskola 2001; Kilpi 2003; Klugman 2003; Lucero 2009; O'Brien 2003 |
| IPD, non‐vaccine serotypes, ITT (Random) | P = 0.93 | 0% | P = 0.84 | 0.92 [0.39, 2.17] | 8 [‐117, 61] | Black 2000; Eskola 2001; Kilpi 2003; Klugman 2003; Lucero 2009; O'Brien 2003 |
| IPD, vaccine‐related serotypes, ITT (Random) | P = 0.50 | 0% | P = 0.87 | 0.89 [0.24, 3.36] | 11 [‐236, 76] | Black 2000; Klugman 2003; Lucero 2009; O'Brien 2003 |
| X‐ray defined pneumonia, ITT (Random) | P = 0.16 | 41% | P < 0.0001 | 0.73 [0.64, 0.85] | 27 [15, 36] | Cutts 2005; Hansen 2006; Klugman 2003; Lucero 2009 |
| Clinical pneumonia, ITT (Random) | P = 0.43 | 0% | P = 0.0006 | 0.94 [0.91, 0.98] | 6 [2, 9] | Black 2002a; Cutts 2005; Lucero 2009;Madhi 2005a |
| All‐cause admissions, ITT (Random) | P = 0.006 | 87% | P = 0.50 | 0.95 [0.83, 1.10] | 5 [‐10, 17] | Cutts 2005; Lucero 2009 |
| All‐cause mortality, ITT (Random) | P = 0.98 | 0% | P = 0.08 | 0.89 [0.79, 1.01] | 11 [‐1, 21] | Cutts 2005; Eskola 2001; Kilpi 2003; Klugman 2003; Lucero 2009 |
| IPD, vaccine serotypes, ITT (Fixed) | P = 0.17 | 34% | P < 0.00001 | 0.20 [0.12, 0.34] | 80 [66, 88] | Black 2000; Cutts 2005; Eskola 2001; Kilpi 2003; Klugman 2003; Lucero 2009; O'Brien 2003 |
| IPD, all serotypes, ITT (Fixed) | P = 0.07 | 49% | P < 0.00001 | 0.47 [0.35, 0.64] | 53 [36, 65] | Black 2000; Cutts 2005; Eskola 2001; Kilpi 2003; Klugman 2003; Lucero 2009; O'Brien 2003 |
| IPD, non‐vaccine serotypes, ITT (Fixed) | P = 0.93 | 0% | P = 0.84 | 0.92 [0.39, 2.17] | 8 [‐117, 61] | Black 2000; Eskola 2001; Kilpi 2003; Klugman 2003; Lucero 2009; O'Brien 2003 |
| IPD, vaccine‐related serotypes, ITT (Fixed) | P = 0.50 | 0% | P = 0.87 | 0.89 [0.24, 3.36] | 11 [‐236, 76] | Black 2000; Klugman 2003; Lucero 2009; O'Brien 2003 |
| X‐ray defined pneumonia, ITT (Fixed) | P = 0.16 | 41% | P < 0.00001 | 0.71 [0.65, 0.78] | 29 [22, 35] | Cutts 2005; Hansen 2006; Klugman 2003; Lucero 2009 |
| Clinical pneumonia, ITT (Fixed) | P = 0.43 | 0% | P = 0.0006 | 0.94 [0.91, 0.98] | 6 [2, 9] | Black 2002a; Cutts 2005; Lucero 2009;Madhi 2005a |
| All‐cause admissions, ITT (Fixed) | P = 0.006 | 87% | P = 0.08 | 0.96 [0.91, 1.01] | 4 [‐1, 9] | Cutts 2005; Lucero 2009 |
| All‐cause mortality, ITT (Fixed) | P = 0.98 | 0% | P = 0.08 | 0.89 [0.79, 1.01] | 11 [‐1, 21] | Cutts 2005; Eskola 2001; Kilpi 2003; Klugman 2003; Lucero 2009 |
| IPD, vaccine serotypes, PP (Random) | P = 0.19 | 34% | P = 0.0005 | 0.20 [0.08, 0.49] | 80 [51, 92] | Black 2000; Cutts 2005; Klugman 2003; Lucero 2009; O'Brien 2003 |
| IPD, all serotypes, PP (Random) | P = 0.02 | 70% | P = 0.01 | 0.31 [0.12, 0.79] | 69 [21, 88] | Black 2000; Cutts 2005; Lucero 2009; O'Brien 2003 |
| IPD, non‐vaccine serotypes, PP (Random) | P = 0.87 | 0% | P = 0.54 | 0.68 [0.20, 2.32] | 32 [‐132, 80] | Black 2000; Lucero 2009; O'Brien 2003 |
| IPD, vaccine‐related serotypes, PP (Random) | P = 0.64 | 0% | P = 0.63 | 0.60 [0.07, 4.87] | 40 [‐387, 93] | Lucero 2009; O'Brien 2003 |
| X‐ray defined pneumonia, PP (Random) | P = 0.42 | 0% | P < 0.00001 | 0.67 [0.60, 0.75] | 33 [25, 40] | Cutts 2005; Hansen 2006; Klugman 2003; Lucero 2009 |
| Clinical pneumonia, PP (Random) | P = 0.49 | 0% | P = 0.001 | 0.94 [0.91, 0.98] | 6 [2, 9] | Black 2002a; Cutts 2005; Lucero 2009;Madhi 2005a |
| All‐cause admissions, PP (Random) | P = 0.010 | 85% | P = 0.38 | 0.94 [0.81, 1.08] | 6 [‐8, 19] | Cutts 2005; Lucero 2009 |
| All‐cause mortality, PP (Random) | P = 0.95 | 0% | P = 0.05 | 0.86 [0.74, 1.00] | 14 [0, 26] | Cutts 2005; Lucero 2009 |
| IPD, vaccine serotypes, PP (Fixed) | P = 0.19 | 34% | P < 0.00001 | 0.19 [0.10, 0.37] | 81 [63, 90] | Black 2000; Cutts 2005; Klugman 2003; Lucero 2009; O'Brien 2003 |
| IPD, all serotypes, PP (Fixed) | P = 0.02 | 70% | P < 0.00001 | 0.41 [0.27, 0.60] | 59 [40, 73] | Black 2000; Cutts 2005; Lucero 2009; O'Brien 2003 |
| IPD, non‐vaccine serotypes, PP (Fixed) | P = 0.87 | 0% | P = 0.54 | 0.68 [0.20, 2.32] | 32 [‐132, 80] | Black 2000; Lucero 2009; O'Brien 2003 |
| IPD, vaccine‐related serotypes, PP (Fixed) | P = 0.64 | 0% | P = 0.63 | 0.60 [0.07, 4.87] | 40 [‐387, 93] | Lucero 2009; O'Brien 2003 |
| X‐ray defined pneumonia, PP (Fixed) | P = 0.42 | 0% | P < 0.00001 | 0.67 [0.60, 0.75] | 33 [25, 40] | Cutts 2005; Hansen 2006; Klugman 2003; Lucero 2009 |
| Clinical pneumonia, PP (Fixed) | P = 0.49 | 0% | P = 0.001 | 0.94 [0.91, 0.98] | 6 [2, 9] | Black 2002a; Cutts 2005; Lucero 2009;Madhi 2005a |
| All‐cause admissions, PP (Fixed) | P = 0.010 | 85% | P = 0.04 | 0.94 [0.89, 1.00] | 6 [0, 11] | Cutts 2005; Lucero 2009 |
| All‐cause mortality, PP (Fixed) | P = 0.95 | 0% | P = 0.05 | 0.86 [0.74, 1.00] | 14 [0, 26] | Cutts 2005; Lucero 2009 |
Results from analyses using data from all the infants in the South African study (HIV‐1 negative plus HIV‐1 positive infants) and children < 24 months of age from the Gambian study pooled with data from the other studies
(A) Risk ratio and vaccine efficacy for VT‐IPD, all serotypes‐IPD, NVT‐IPD, and VRT‐IPD; ITT analyses
With the inclusion of HIV‐1 positive infants into the ITT analyses for VT‐IPD, the pooled RR (random‐effects model) was 0.23 (95% CI 0.12 to 0.42) and a pooled VE of 77% (95% CI 58% to 88%). For All serotypes‐IPD, the pooled RR was 0.42 (95% CI 0.27 to 0.66, P = 0.0002), I2 = 48%, P = 0.07 with a VE of 58% (95% CI 34% to 73%).
The results for VT‐IPD and all serotypes‐IPD were similar to that involving only HIV‐1 negative children.
The results for NVT‐IPD showed a RR of 1.06 (95% CI 0.55 to 2.04, random‐effects model) and a decrease in VE to ‐6% (95% CI ‐104% to 45%). There was no statistical heterogeneity (I2 = 0%, P = 0.95).
For VRT‐IPD, the result showed that the pooled RR was 0.60 (95% CI 0.29 to 1.25, P = 0.17, random‐effects model) and VE was 40% (95% CI ‐25% to 71%). There was no statistical heterogeneity (I2 = 0%, P = 0.73).
(B) Risk ratio and vaccine efficacy for WHO X‐ray defined pneumonia; ITT analysis
The pooled RR was 0.75 (95% CI 0.64 to 0.88, random‐effects model, P = 0.0004). The pooled VE was 25% (95% CI 12% to 36%). The I2 was 61% (P = 0.05). The results were similar to that in HIV‐1 negative children. This was also true when sensitivity analysis was done.
(C) Risk ratio and vaccine efficacy for clinical pneumonia; ITT analysis
The pooled RR for clinical pneumonia was 0.94 (95% CI 0.91 to 0.97; P = 0.0006). The VE was 6 % (95% CI 3% to 9%). I2 was 18%, P = 0.30 (random‐effects model). The results were similar to that in HIV‐1 negative children.
(D) Risk ratio and vaccine efficacy for all‐cause admissions; ITT analysis
The pooled RR for all‐cause admissions was 0.95 (95% CI 0.83 to 1.10, P = 0.50). The VE was 5% (95% CI ‐10% to 17%). There was heterogeneity with an I2 of 87%, P = 0.006.
(E) Risk ratio and vaccine efficacy for all‐cause mortality; ITT analysis
The pooled RR was 0.91 (95% CI 0.81 to 1.01, P = 0.07, random‐effects model) with a VE of 9% (95% CI ‐0.01% to 19%). There was no statistical heterogeneity (I2 0%, P = 0.97).
Refer to Table 16 for additional information.
15. Summary results (Children < 24 months and/or HIV‐1 negative and HIV‐1 positive children).
| Outcome | Heterogeneity P‐value | I2 | Effect P‐value | RR [95% CI] | VE [95% CI] | Included Studies |
| IPD, vaccine serotypes, ITT (Random) | P = 0.15 | 36% | P < 0.00001 | 0.23 [0.12, 0.42] | 77 [58, 88] | Black 2000; Cutts 2005; Eskola 2001; Kilpi 2003; Klugman 2003; Lucero 2009; O'Brien 2003 |
| IPD, all serotypes, ITT (Random) | P = 0.07 | 48% | P = 0.0002 | 0.42 [0.27, 0.66] | 58 [34, 73] | Black 2000; Cutts 2005; Eskola 2001; Kilpi 2003; Klugman 2003; Lucero 2009; O'Brien 2003 |
| IPD, non‐vaccine serotypes, ITT (Random) | P = 0.95 | 0% | P = 0.86 | 1.06 [0.55, 2.04] | ‐6 [104, 45] | Black 2000; Eskola 2001; Kilpi 2003; Klugman 2003; Lucero 2009; O'Brien 2003 |
| IPD, vaccine‐related serotypes, ITT (Random) | P = 0.73 | 0% | P = 0.17 | 0.60 [0.29, 1.25] | 40 [‐25, 71] | Black 2000; Klugman 2003; Lucero 2009; O'Brien 2003 |
| X‐ray defined pneumonia, ITT (Random) | P = 0.05 | 61% | P = 0.0004 | 0.75 [0.64, 0.88] | 25 [12, 36] | Cutts 2005; Hansen 2006; Klugman 2003; Lucero 2009 |
| Clinical pneumonia, ITT (Random) | P = 0.30 | 18% | P = 0.0006 | 0.94 [0.91, 0.97] | 6 [3, 9] | Black 2002a; Cutts 2005; Lucero 2009; Madhi 2005a |
| All‐cause admissions, ITT (Random) | P = 0.006 | 87% | P = 0.50 | 0.95 [0.83, 1.10] | 5 [‐10, 17] | Cutts 2005; Lucero 2009 |
| All‐cause mortality, ITT (Random) | P = 0.97 | 0% | P = 0.07 | 0.91 [0.81, 1.01] | 9 [‐1, 19] | Cutts 2005; Eskola 2001; Kilpi 2003; Klugman 2003; Lucero 2009 |
| IPD, vaccine serotypes, ITT (Fixed) | P = 0.15 | 36% | P < 0.00001 | 0.23 [0.15, 0.35] | 77 [65, 85] | Black 2000; Cutts 2005; Eskola 2001; Kilpi 2003; Klugman 2003; Lucero 2009; O'Brien 2003 |
| IPD, all serotypes, ITT (Fixed) | P = 0.07 | 48% | P < 0.00001 | 0.47 [0.36, 0.61] | 53 [39, 64] | Black 2000; Cutts 2005; Eskola 2001; Kilpi 2003; Klugman 2003; Lucero 2009; O'Brien 2003 |
| IPD, non‐vaccine serotypes, ITT (Fixed) | P = 0.95 | 0% | P = 0.86 | 1.06 [0.55, 2.04] | ‐6 [‐104, 45] | Black 2000; Eskola 2001; Kilpi 2003; Klugman 2003; Lucero 2009; O'Brien 2003 |
| IPD, vaccine‐related serotypes, ITT (Fixed) | P = 0.73 | 0% | P = 0.17 | 0.60 [0.29, 1.25] | 40 [‐25, 71] | Black 2000; Klugman 2003; Lucero 2009; O'Brien 2003 |
| X‐ray defined pneumonia, ITT (Fixed) | P = 0.05 | 61% | P < 0.00001 | 0.74 [0.68, 0.81] | 26 [19, 32] | Cutts 2005; Hansen 2006; Klugman 2003; Lucero 2009 |
| Clinical pneumonia, ITT (Fixed) | P = 0.30 | 18% | P < 0.0001 | 0.94 [0.91, 0.97] | 6 [3, 9] | Black 2002a; Cutts 2005; Lucero 2009; Madhi 2005a |
| All‐cause admissions, ITT (Fixed) | P = 0.006 | 87% | P = 0.08 | 0.96 [0.91, 1.01] | 4 [‐1, 9] | Cutts 2005; Lucero 2009 |
| All‐cause mortality, ITT (Fixed) | P = 0.97 | 0% | P = 0.07 | 0.91 [0.81, 1.01] | 9 [‐1, 19] | Cutts 2005; Eskola 2001; Kilpi 2003; Klugman 2003; Lucero 2009 |
| IPD, vaccine serotypes, PP (Random) | P = 0.11 | 50% | P = 0.01 | 0.22 [0.07, 0.71] | 78 [29, 93] | Black 2000; Cutts 2005; Lucero 2009; O'Brien 2003 |
| IPD, all serotypes, PP (Random) | P = 0.02 | 70% | P = 0.01 | 0.31 [0.12, 0.79] | 69 [21, 88] | Black 2000; Cutts 2005; Lucero 2009; O'Brien 2003 |
| IPD, non‐vaccine serotypes, PP (Random) | P = 0.87 | 0% | P = 0.54 | 0.68 [0.20, 2.32] | 32 [‐132, 80] | Black 2000; Lucero 2009; O'Brien 2003 |
| IPD, vaccine‐related serotypes, PP (Random) | P = 0.64 | 0% | P = 0.63 | 0.60 [0.07, 4.87] | 40 [‐387, 93] | Lucero 2009; O'Brien 2003 |
| X‐ray defined pneumonia, PP (Random) | P = 0.40 | 0% | P < 0.00001 | 0.65 [0.58, 0.74] | 35 [26, 42] | Cutts 2005; Hansen 2006; Lucero 2009 |
| Clinical pneumonia, PP (Random) | P = 0.34 | 11% | P = 0.001 | 0.94 [0.90, 0.97] | 6 [3, 10] | Black 2002a; Cutts 2005; Lucero 2009; Madhi 2005a |
| All‐cause admissions, PP (Random) | P = 0.010 | 85% | P = 0.38 | 0.94 [0.81, 1.08] | 6 [‐8, 19] | Cutts 2005; Lucero 2009 |
| All‐cause mortality, PP (Random) | P = 0.95 | 0% | P = 0.05 | 0.86 [0.74, 1.00] | 14 [0, 26] | Cutts 2005; Lucero 2009 |
| IPD, vaccine serotypes, PP (Fixed) | P = 0.11 | 50% | P < 0.00001 | 0.20 [0.10, 0.40] | 80 [60, 90] | Black 2000; Cutts 2005; Lucero 2009; O'Brien 2003 |
| IPD, all serotypes, PP (Fixed) | P = 0.02 | 70% | P < 0.00001 | 0.41 [0.27, 0.60] | 59 [40, 73] | Black 2000; Cutts 2005; Lucero 2009; O'Brien 2003 |
| IPD, non‐vaccine serotypes, PP (Fixed) | P = 0.87 | 0% | P = 0.54 | 0.68 [0.20, 2.32] | 32 [‐132, 80] | Black 2000; Lucero 2009; O'Brien 2003 |
| IPD, vaccine‐related serotypes, PP (Fixed) | P = 0.64 | 0% | P = 0.63 | 0.60 [0.07, 4.87] | 40 [‐387, 93] | Lucero 2009; O'Brien 2003 |
| X‐ray defined pneumonia, PP (Fixed) | P = 0.40 | 0% | P < 0.00001 | 0.65 [0.58, 0.74] | 35 [26, 42] | Cutts 2005; Hansen 2006; Lucero 2009 |
| Clinical pneumonia, PP (Fixed) | P = 0.34 | 11% | P = 0.0004 | 0.94 [0.90, 0.97] | 6 [3, 10] | Black 2002a; Cutts 2005; Lucero 2009; Madhi 2005a |
| All‐cause admissions, PP (Fixed) | P = 0.010 | 85% | P = 0.04 | 0.94 [0.89, 1.00] | 6 [0, 11] | Cutts 2005; Lucero 2009 |
| All‐cause mortality, PP (Fixed) | P = 0.95 | 0% | P = 0.05 | 0.86 [0.74, 1.00] | 14 [0, 26] | Cutts 2005; Lucero 2009 |
Results from analyses using data from HIV‐1 negative infants from the South African study and children < 29 months of age from the Gambian study pooled with the other studies
The results of the analyses were almost similar to the results of analyses that included only HIV‐1 negative infants from the South African study and children < 24 months of age from the Gambian study pooled with data from the other trials. An important difference between the subgroup of < 24 month‐old children from that of the subgroup < 29 months old children was that for all‐cause mortality, the results were similar but the results had become statistically significant, with a pooled RR of 0.87 (95% CI 0.77 to 0.98).
For additional information, please see Table 17.
16. Summary results (Pooled with Cutts 2005 children < 29 months and/or HIV‐1 negative children).
| Outcome | Heterogeneity P‐value | I2 | Effect P‐value | RR [95% CI] | VE [95% CI] | Included Studies |
| IPD, vaccine serotypes, ITT (Random) | P = 0.14 | 38% | P < 0.0001 | 0.21 [0.10, 0.46] | 79 [54, 90] | Black 2000; Cutts 2005; Eskola 2001; Kilpi 2003; Klugman 2003; Lucero 2009; O'Brien 2003 |
| IPD, all serotypes, ITT (Random) | P = 0.07 | 48% | P = 0.0009 | 0.42 [0.25, 0.70] | 58 [30, 75] | Black 2000; Cutts 2005; Eskola 2001; Kilpi 2003; Klugman 2003; Lucero 2009; O'Brien 2003 |
| IPD, non‐vaccine serotypes, ITT (Random) | P = 0.97 | 0% | P = 0.83 | 0.95 [0.59, 1.52] | 5 [‐52, 41] | Black 2000; Cutts 2005; Eskola 2001; Kilpi 2003; Klugman 2003; Lucero 2009; O'Brien 2003 |
| IPD, vaccine‐related serotypes, ITT (Random) | P = 0.63 | 0% | P = 0.33 | 0.69 [0.33, 1.45] | 31 [‐45, 67] | Black 2000; Cutts 2005; Klugman 2003; Lucero 2009; O'Brien 2003 |
| X‐ray defined pneumonia, ITT (Random) | P = 0.18 | 38% | P < 0.0001 | 0.73 [0.64, 0.84] | 27 [16, 36] | Cutts 2005; Hansen 2006; Klugman 2003; Lucero 2009 |
| Clinical pneumonia, ITT (Random) | P = 0.46 | 0% | P = 0.002 | 0.95 [0.91, 0.98] | 5 [2, 9] | Black 2002a; Cutts 2005; Lucero 2009; Madhi 2005a |
| All‐cause admissions, ITT (Random) | P = 0.002 | 90% | P = 0.48 | 0.94 [0.80, 1.11] | 6 [‐11, 20] | Cutts 2005; Lucero 2009 |
| All‐cause mortality, ITT (Random) | P = 0.96 | 0% | P = 0.02 | 0.87 [0.77, 0.98] | 13 [2, 23] | Cutts 2005; Eskola 2001; Kilpi 2003; Klugman 2003; Lucero 2009 |
| IPD, vaccine serotypes, ITT (Fixed) | P = 0.14 | 38% | P < 0.00001 | 0.22 [0.14, 0.37] | 78 [63, 86] | Black 2000; Cutts 2005; Eskola 2001; Kilpi 2003; Klugman 2003; Lucero 2009; O'Brien 2003 |
| IPD, all serotypes, ITT (Fixed) | P = 0.07 | 48% | P < 0.00001 | 0.47 [0.35, 0.62] | 53 [38, 65] | Black 2000; Cutts 2005; Eskola 2001; Kilpi 2003; Klugman 2003; Lucero 2009; O'Brien 2003 |
| IPD, non‐vaccine serotypes, ITT (Fixed) | P = 0.97 | 0% | P = 0.83 | 0.95 [0.59, 1.52] | 5 [‐52, 41] | Black 2000; Cutts 2005; Eskola 2001; Kilpi 2003; Klugman 2003; Lucero 2009; O'Brien 2003 |
| IPD, vaccine related serotypes, ITT (Fixed) | P = 0.63 | 0% | P = 0.33 | 0.69 [0.33, 1.45] | 31 [‐45, 67] | Black 2000; Cutts 2005; Klugman 2003; Lucero 2009; O'Brien 2003 |
| X‐ray defined pneumonia, ITT (Fixed) | P = 0.18 | 38% | P < 0.00001 | 0.71 [0.65, 0.79] | 29 [21, 35] | Cutts 2005; Hansen 2006; Klugman 2003; Lucero 2009 |
| Clinical pneumonia, ITT (Fixed) | P = 0.46 | 0% | P = 0.002 | 0.95 [0.91, 0.98] | 5 [2, 9] | Black 2002a; Cutts 2005; Lucero 2009; Madhi 2005a |
| All‐cause admissions, ITT (Fixed) | P = 0.002 | 90% | P = 0.04 | 0.95 [0.90, 1.00] | 5 [0, 10] | Cutts 2005; Lucero 2009 |
| All‐cause mortality, ITT (Fixed) | P = 0.96 | 0% | P = 0.02 | 0.87 [0.77, 0.98] | 13 [2, 23] | Cutts 2005; Eskola 2001; Kilpi 2003; Klugman 2003; Lucero 2009 |
| IPD, vaccine serotypes, PP (Random) | P = 0.19 | 34% | P = 0.0008 | 0.22 [0.09, 0.53] | 78 [47, 91] | Black 2000; Cutts 2005; Klugman 2003; Lucero 2009; O'Brien 2003 |
| IPD, all serotypes, PP (Random) | P = 0.02 | 68% | P = 0.01 | 0.31 [0.13, 0.76] | 69 [24, 87] | Black 2000; Cutts 2005; Lucero 2009; O'Brien 2003 |
| IPD, non‐vaccine serotypes, PP (Random) | P = 0.67 | 0% | P = 0.63 | 1.20 [0.58, 2.50] | ‐20 [‐150, 42] | Black 2000; Cutts 2005; Lucero 2009; O'Brien 2003 |
| IPD, vaccine related serotypes, PP (Random) | P = 0.89 | 0% | P = 0.25 | 0.55 [0.20, 1.51] | 45 [‐51, 80] | Cutts 2005; Lucero 2009; O'Brien 2003 |
| X‐ray defined pneumonia, PP (Random) | P = 0.41 | 0% | P < 0.00001 | 0.67 [0.60, 0.75] | 33 [25, 40] | Cutts 2005; Hansen 2006; Klugman 2003; Lucero 2009 |
| Clinical pneumonia, PP (Random) | P = 0.53 | 0% | P = 0.004 | 0.94 [0.91, 0.98] | 6 [2, 9] | Black 2002a; Cutts 2005; Lucero 2009; Madhi 2005a |
| All‐cause admissions, PP (Random) | P = 0.002 | 89% | P = 0.37 | 0.93 [0.78, 1.09] | 7 [‐9, 22] | Cutts 2005; Lucero 2009 |
| All‐cause mortality, PP (Random) | P = 0.88 | 0% | P = 0.02 | 0.84 [0.73, 0.97] | 16 [3, 27] | Cutts 2005; Lucero 2009 |
| IPD, vaccine serotypes, PP (Fixed) | P = 0.19 | 34% | P < 0.00001 | 0.22 [0.12, 0.41] | 78 [59, 88] | Black 2000; Cutts 2005; Klugman 2003; Lucero 2009; O'Brien 2003 |
| IPD, all serotypes, PP (Fixed) | P = 0.02 | 68% | P < 0.00001 | 0.39 [0.27, 0.58] | 61 [42, 73] | Black 2000; Cutts 2005; Lucero 2009; O'Brien 2003 |
| IPD, non‐vaccine serotypes, PP (Fixed) | P = 0.67 | 0% | P = 0.63 | 1.20 [0.58, 2.50] | ‐20 [‐150, 42] | Black 2000; Cutts 2005; Lucero 2009; O'Brien 2003 |
| IPD, vaccine related serotypes, PP (Fixed) | P = 0.89 | 0% | P = 0.25 | 0.55 [0.20, 1.51] | 45 [‐51, 80] | Cutts 2005; Lucero 2009; O'Brien 2003 |
| X‐ray defined pneumonia, PP (Fixed) | P = 0.41 | 0% | P < 0.00001 | 0.67 [0.60, 0.75] | 33 [25, 40] | Cutts 2005; Hansen 2006; Klugman 2003; Lucero 2009 |
| Clinical pneumonia, PP (Fixed) | P = 0.53 | 0% | P = 0.004 | 0.94 [0.91, 0.98] | 6 [2, 9] | Black 2002a; Cutts 2005; Lucero 2009; Madhi 2005a |
| All‐cause admissions, PP (Fixed) | P = 0.002 | 89% | P = 0.01 | 0.93 [0.88, 0.99] | 7 [1, 12] | Cutts 2005; Lucero 2009 |
| All‐cause mortality, PP (Fixed) | P = 0.88 | 0% | P = 0.02 | 0.84 [0.73, 0.97] | 16 [3, 27] | Cutts 2005; Lucero 2009 |
Results from analyses using data from all the infants in the South African study (HIV‐1 negative plus HIV‐1 positive infants) and children < 29 months of age from the Gambian study pooled with data from the other studies
The results of the analyses were almost similar to the results of analyses that included HIV‐1 negative plus HIV‐1 positive infants from the South African study and children < 24 months of age from the Gambian study pooled with data from the other trials. As in HIV‐1 negative infants, the results in < 29 month‐old children for all‐cause mortality were similar but this time, the results had become statistically significant RR of 0.89 [95% CI 0.80 to 0.98].
Refer to Table 18 for additional information.
17. Summary results (Pooled with Cutts 2005 children < 29 months and/or HIV‐1 negative and HIV‐1 positive children).
| Outcome | Heterogeneity P‐value | I2 | Effect P‐value | RR [95% CI] | VE [95% CI] | Included Studies |
| IPD, vaccine serotypes, ITT (Random) | P = 0.14 | 38% | P < 0.0001 | 0.24 [0.12, 0.45] | 76 [55, 88] | Black 2000; Cutts 2005; Eskola 2001; Kilpi 2003; Klugman 2003; Lucero 2009; O'Brien 2003 |
| IPD, all serotypes, ITT (Random) | P = 0.08 | 47% | P = 0.0001 | 0.42 [0.27, 0.65] | 58 [35, 73] | Black 2000; Cutts 2005; Eskola 2001; Kilpi 2003; Klugman 2003; Lucero 2009; O'Brien 2003 |
| IPD, non‐vaccine serotypes, ITT (Random) | P = 0.98 | 0% | P = 0.99 | 1.00 [0.66, 1.53] | 0 [‐53, 34] | Black 2000; Cutts 2005; Eskola 2001; Kilpi 2003; Klugman 2003; Lucero 2009; O'Brien 2003 |
| IPD, vaccine related serotypes, ITT (Random) | P = 0.86 | 0% | P = 0.09 | 0.61 [0.35, 1.07] | 39 [‐7, 65] | Black 2000; Cutts 2005; Klugman 2003; Lucero 2009; O'Brien 2003 |
| X‐ray defined pneumonia, ITT (Random) | P = 0.06 | 59% | P = 0.0003 | 0.75 [0.64, 0.88] | 25 [12, 36] | Cutts 2005; Hansen 2006; Klugman 2003; Lucero 2009 |
| Clinical pneumonia, ITT (Random) | P = 0.30 | 17% | P = 0.001 | 0.94 [0.91, 0.98] | 6 [2, 9] | Black 2002a; Cutts 2005; Lucero 2009; Madhi 2005a |
| All‐cause admissions, ITT (Random) | P = 0.002 | 90% | P = 0.48 | 0.94 [0.80, 1.11] | 6 [‐11, 20] | Cutts 2005; Lucero 2009 |
| All‐cause mortality, ITT (Random) | P = 0.92 | 0% | P = 0.02 | 0.89 [0.80, 0.98] | 11 [2, 20] | Cutts 2005; Eskola 2001; Kilpi 2003; Klugman 2003; Lucero 2009 |
| IPD, vaccine serotypes, ITT (Fixed) | P = 0.14 | 38% | P < 0.00001 | 0.25 [0.16, 0.38] | 75 [62, 84] | Black 2000; Cutts 2005; Eskola 2001; Kilpi 2003; Klugman 2003; Lucero 2009; O'Brien 2003 |
| IPD, all serotypes, ITT (Fixed) | P = 0.08 | 47% | P < 0.00001 | 0.47 [0.36, 0.60] | 53 [40, 64] | Black 2000; Cutts 2005; Eskola 2001; Kilpi 2003; Klugman 2003; Lucero 2009; O'Brien 2003 |
| IPD, non‐vaccine serotypes, ITT (Fixed) | P = 0.98 | 0% | P = 0.99 | 1.00 [0.66, 1.53] | 0 [‐53, 34] | Black 2000; Cutts 2005; Eskola 2001; Kilpi 2003; Klugman 2003; Lucero 2009; O'Brien 2003 |
| IPD, vaccine related serotypes, ITT (Fixed) | P = 0.86 | 0% | P = 0.09 | 0.61 [0.35, 1.07] | 39 [‐7, 65] | Black 2000; Cutts 2005; Klugman 2003; Lucero 2009; O'Brien 2003 |
| X‐ray defined pneumonia, ITT (Fixed) | P = 0.06 | 59% | P < 0.00001 | 0.74 [0.68, 0.81] | 26 [19, 32] | Cutts 2005; Hansen 2006; Klugman 2003; Lucero 2009 |
| Clinical pneumonia, ITT (Fixed) | P = 0.30 | 17% | P = 0.0003 | 0.94 [0.91, 0.97] | 6 [3, 9] | Black 2002a; Cutts 2005; Lucero 2009; Madhi 2005a |
| All‐cause admissions, ITT (Fixed) | P = 0.002 | 90% | P = 0.04 | 0.95 [0.90, 1.00] | 5 [0, 10] | Cutts 2005; Lucero 2009 |
| All‐cause mortality, ITT (Fixed) | P = 0.92 | 0% | P = 0.02 | 0.89 [0.80, 0.98] | 11 [2, 20] | Cutts 2005; Eskola 2001; Kilpi 2003; Klugman 2003; Lucero 2009 |
| IPD, vaccine serotypes, PP (Random) | P = 0.12 | 49% | P = 0.01 | 0.24 [0.08, 0.75] | 76 [25, 92] | Black 2000; Cutts 2005; Lucero 2009; O'Brien 2003 |
| IPD, all serotypes, PP (Random) | P = 0.02 | 68% | P = 0.01 | 0.31 [0.13, 0.76] | 69 [24,87] | Black 2000; Cutts 2005; Lucero 2009; O'Brien 2003 |
| IPD, non‐vaccine serotypes, PP (Random) | P = 0.67 | 0% | P = 0.63 | 1.20 [0.58, 2.50] | ‐20 [‐150, 42] | Black 2000; Cutts 2005; Lucero 2009; O'Brien 2003 |
| IPD, vaccine‐related serotypes, PP (Random) | P = 0.89 | 0% | P = 0.25 | 0.55 [0.20, 1.51] | 45 [‐51, 80] | Cutts 2005; Lucero 2009; O'Brien 2003 |
| X‐ray defined pneumonia, PP (Random) | P = 0.39 | 0% | P < 0.00001 | 0.65 [0.58, 0.74] | 35 [26, 42] | Cutts 2005; Hansen 2006; Lucero 2009 |
| Clinical pneumonia, PP (Random) | P = 0.35 | 8% | P = 0.002 | 0.94 [0.90, 0.98] | 6 [2, 10] | Black 2002a; Cutts 2005; Lucero 2009; Madhi 2005a |
| All‐cause admissions, PP (Random) | P = 0.002 | 89% | P = 0.37 | 0.93 [0.78, 1.09] | 7 [‐9, 22] | Cutts 2005; Lucero 2009 |
| All‐cause mortality, PP (Random) | P = 0.88 | 0% | P = 0.02 | 0.84 [0.73, 0.97] | 16 [3, 27] | Cutts 2005; Lucero 2009 |
| IPD, vaccine serotypes, PP (Fixed) | P = 0.12 | 49% | P < 0.0001 | 0.23 [0.12, 0.45] | 77 [55, 88] | Black 2000; Cutts 2005; Lucero 2009; O'Brien 2003 |
| IPD, all serotypes, PP (Fixed) | P = 0.02 | 68% | P < 0.00001 | 0.39 [0.27, 0.58] | 61 [42, 73] | Black 2000; Cutts 2005; Lucero 2009; O'Brien 2003 |
| IPD, Non vaccine serotypes, PP (Fixed) | P = 0.67 | 0% | P = 0.63 | 1.20 [0.58, 2.50] | ‐20 [‐150, 42] | Black 2000; Cutts 2005; Lucero 2009; O'Brien 2003 |
| IPD, vaccine related serotypes, PP (Fixed) | P = 0.89 | 0% | P = 0.25 | 0.55 [0.20, 1.51] | 45 [‐51, 80] | Cutts 2005; Lucero 2009; O'Brien 2003 |
| X‐ray defined pneumonia, PP (Fixed) | P = 0.39 | 0% | P < 0.00001 | 0.65 [0.58, 0.74] | 35 [26, 42] | Cutts 2005; Hansen 2006; Lucero 2009 |
| Clinical pneumonia, PP (Fixed) | P = 0.35 | 8% | P = 0.001 | 0.94 [0.90, 0.97] | 6 [3, 10] | Black 2002a; Cutts 2005; Lucero 2009; Madhi 2005a |
| All‐cause admissions, PP (Fixed) | P = 0.002 | 89% | P = 0.01 | 0.93 [0.88, 0.99] | 7 [1, 12] | Cutts 2005; Lucero 2009 |
| All‐cause mortality, PP (Fixed) | P = 0.88 | 0% | P = 0.02 | 0.84 [0.73, 0.97] | 16 [3, 27] | Cutts 2005; Lucero 2009 |
Discussion
Summary of main results
This review included 11 publications arising from six trials. Seven publications provided high quality evidence for the outcome IPD. Evidence for the pneumonia outcomes from four publications was of moderate quality because of the presence of high risk of bias for the US trial of Black 2000 due to early stopping for benefit.
The PCV used by Black 2000; Cutts 2005; Eskola 2001; Klugman 2003; and O'Brien 2003 had CRM197 as the protein conjugate. Kilpi utilised OMP while Lucero had diphtheria / tetanus proteins as conjugate. Safety of the vaccine was not included in this review although three phase 3 trials (Black 2000; Cutts 2005; O'Brien 2003) showed the PCV to have an acceptable safety profile. There were some concerns on safety in the Klugman 2003 study, which showed an increase in the incidence of general seizures and asthma in those vaccinated with the PCV, and in the Philippines trial (diphtheria / tetanus conjugate) which showed an increase in the occurrence of respiratory events during the first week after the first dose of the vaccine. In general, the 7PCV CRM197 (Prevnar, Wyeth Lederle) has been found to be safe and tolerable in children under two years of age and has been incorporated into the national immunisation programmes of several countries.
For this review, the conclusions are focused on the prevention of the outcomes studied in the context of the baseline risk among children younger than two years of age as derived from the studies reviewed to understand the absolute benefit that can be expected from the use of the PCV. For countries or populations where there is a baseline rate of 0.2% (rate for VT‐IPD from the control group, Table 19), considered as medium risk among children younger than two years of age, PCV prevents about two VT‐IPD cases per 1000 children but this is increased to 4/1000 if VT‐IPD baseline risk is high at 0.5% (Table 19). PCV prevents two all serotypes‐IPD cases per 1000 children, and 5/1000, in medium‐risk (control event rate of 0.4%, Table 20) and high‐risk (control event rate of 0.8%, Table 20) populations, respectively. There was no reduction in the incidence of NVT‐IPD and VRT‐IPD with the use of PCV. However, we did not conduct a meta‐analysis for individual serotypes. In some studies, there was some cross protection observed for certain VRT like 6A (Klugman 2008b).
18. Assumed risk for VT‐IPD, ITT.
| Study ID | Control denominator | Number of events | Control event rate or Control Group Risk (CGR) | Range of assumed risk of disease in the population |
| Lucero 2009 | 6094 | 1 | 0.0% |
Low control risk 0.0% to 0.1% Medium control risk 0.2% to 0.4% High control risk> 0.5% |
| Klugman 2003 | 18,626 | 17 | 0.1% | |
| Eskola 2001 | 415.5 | 1 | 0.2% | |
| Kilpi 2003 | 415.5 | 1 | 0.2% | |
| Black 2000 | 18,941 | 49 | 0.3% | |
| O'Brien 2003 | 2818 | 11 | 0.4% | |
| Cutts 2005 | 8719 | 41 | 0.5% |
19. Assumed risk for all serotypes‐IPD, ITT.
| Study ID | Control denominator | Number of events | Control event rate or Control Group Risk (CGR) | Range of assumed risk of disease in the population |
| Lucero 2009 | 6094 | 3 | 0.0% |
Low control risk 0.0% to 0.3% Medium control risk 0.4% to 0.7% High control risk> 0.8% |
| Klugman 2003 | 18,626 | 19 | 0.1% | |
| Black 2000 | 18,941 | 55 | 0.3% | |
| Kilpi 2003 | 415.5 | 1.5 | 0.4% | |
| Eskola 2001 | 415.5 | 1.5 | 0.4% | |
| O'Brien 2003 | 2818 | 18 | 0.6% | |
| Cutts 2005 | 8719 | 66 | 0.8% |
For X‐ray defined pneumonia, the number of cases PCV prevented was one case per 1000 in areas with low baseline risk (control event rate of 0.3%, Table 21) but prevents five cases per 1000 children in medium‐risk populations (control event rate of 1.7%, Table 21), and 17/1000 children in high baseline‐risk (control event rate of 6.3%, Table 21) populations. PCV prevents four clinical pneumonia cases per 1000 children in low baseline‐risk populations (control event rate of 5.9%, Table 22), 8/1000 in medium baseline‐risk populations (control event rate of 12.6%, Table 22), and 19/1000 in high baseline‐risk populations (control event rate of 31.5%, Table 22).
20. Assumed risk for X‐ray defined pneumonia, ITT.
| Study ID | Control denominator | Number of events | Control event rate or Control Group Risk (CGR) | Range of assumed risk of disease in the population |
| Hansen 2006 | 18,942 | 51 | 0.3% |
Low control risk 0.0% to 1.6% Medium control risk 1.7% to 6.2% High control risk> 6.3% |
| Klugman 2003 | 18,626 | 212 | 1.1% | |
| Lucero 2009 | 6094 | 141 | 2.3% | |
| Cutts 2005 | 8719 | 551 | 6.3% |
21. Assumed risk for clinical pneumonia, ITT.
| Study ID | Control denominator | Number of events | Control event rate or Control Group Risk (CGR) | Range of assumed risk of disease in the population |
| Madhi 2005a | 18,626 | 1106 | 5.9% |
Low control risk 0.0% to 12.5% Medium control risk 12.6% to 30% High control risk > 31.5% |
| Black 2002a | 18,942 | 1429 | 7.5% | |
| Lucero 2009 | 6094 | 1080 | 17.7% | |
| Cutts 2005 | 8719 | 2746 | 31.5% |
The five publications with mortality data were not powered to assess the impact of PCV against all‐cause mortality but the Gambia trial probably came close to having power to detect a difference between groups since mortality was their original primary outcome. But we must further clarify that the meta‐analysis we did for the Gambia data included children < 24 months of age, ITT population, as obtained through personal communication (Cutts 2007), not children < 29 months of age Per Protocol population as published by Cutts (Cutts 2005). We received from the author ITT data for children < 29 months of age stratified in three groups: 3 to 11, 12 to 23, and 24 to 29 months old. From this information, we calculated the ITT mortality data for < 24 months old. Thus, the values included in the forest plot contain the VE for ITT in children < 24 months of age (Cutts 2007), with a model including the Finnish, SA, and Philippines publications. All these data are contained in the 'Additional Tables' with the relevant headings. The pooled estimate result did not present with heterogeneity. But a sensitivity analysis was still done using models with or without exclusion of the Finnish and Philippines data. With exclusion of the two Finnish studies, very little change was seen in the pooled VE. Although we assessed the quality of evidence for all‐cause mortality to be weak, we have considered the ITT‐VE of 11% with a 95% Cl of ‐1% to 21% to be compatible with reduction in all‐cause mortality and is clinically important. This assessment also took into account the results of sub‐group analysis including HIV‐1 negative children < 29 months of age where the ITT‐VE reached statistical significance (VE 13% (95% CI 2% to 23%)). Even the results of analysis for HIV‐1 negative and HIV‐1 positive < 29 months old children was significant.
Regarding all‐cause admissions, there were only two publications from which to evaluate this outcome. Thus, there is no strong evidence at this point in time to indicate whether or not PCV has an impact on all‐cause admissions.
Difference between the 2004 review and the 2009 update
General changes (methods)
Use of Review Manager version 5 (RevMan 5) in 2009 (RevMan version 4 in 2004). The latest version of RevMan (RevMan 2008) contains many modifications on how to assess studies and how to present results.
Assessment of the quality of publications (or trials from which the publications came from): There was a more stringent assessment of the publications included in the review using the new assessment criteria in the Cochrane Handbook of Systematic Reviews of Interventions in RevMan 5 not available in 2004. Publications regarded as having valid results in 2004, may have changed and now be considered as invalid due to certain criteria on how the trial was conducted.
Addition of a 'Summary of Findings' table: This is a summary of the findings with the addition of absolute effects of the intervention per outcome assessed including the quality of evidence presented using the software Grade Profiler (GRADEPro 2008).
Addition of new publications: Cutts 2005; Hansen 2006; Lucero 2009; Madhi 2005a; and O'Brien 2002.
Addition of new findings from revisions of definition of outcomes, particularly that of the radiology‐defined outcome with all definitions for this outcome fulfilling the criteria for WHO standardised definition of the presence of pneumonia on chest x‐ray (for example, general radiologist X‐ray readings of Black 2000 to the publication of Hansen 2006 article displaying the results of readings from readers conforming to the WHO definitions of X‐ray pneumonia.)
Addition of all‐cause mortality and all‐cause admissions as outcomes.
Specific Changes
Table 23 and Table 24 in the 'Additional Tables' section show a summary of the differences between the 2004 review and this 2009 update with regards the VE and 95% CI for the outcomes studied. In the 2004 review, empty cells for VE, 95% CI, effect P value, I2 statistic, and heterogeneity P value for particular outcomes, meant that data were not available at that time or the results of only one study was available. Below are some important changes for IPD and pneumonia:
22. Comparison of results between 2004 Review and 2009 Update (Children < 24 months and/or HIV‐1 negative children).
| Outcome | 2004 Results | Effect P‐value | I2 |
Heterogeneity P‐value |
2009 Update |
Effect P‐value |
I2 |
Heterogeneity P‐value |
Difference (%) |
| VE [95% CI] | VE [95% CI] | ||||||||
| Invasive pneumococcal disease (IPD) | |||||||||
| IPD, vaccine serotypes, ITT (Random) | 88 [73, 94] | P < 0.00001 |
0% | P = 0.77 |
80 [58, 90] | P < 0.0001 | 34% |
P = 0.17 | ‐9.09% |
| IPD, all serotypes, ITT (Random) | 68 [31, 85] | P = 0.003 |
51.1% | P = 0.09 |
58 [29, 75] | P = 0.001 | 49% | P = 0.07 | ‐14.71% |
| IPD, non‐vaccine serotypes, ITT (Random) | 1 [‐143, 60] | P = 0.99 |
0% | P = 0.91 |
8 [‐117, 61] | P = 0.84 | 0% | P = 0.93 | 700.00% |
| IPD, vaccine‐related serotypes, ITT (Random) | ‐9 [‐369, 74] | P = 0.90 |
0% | P = 0.38 |
11 [‐236, 76] | P = 0.87 | 0% | P = 0.50 | 222.22% |
| IPD, vaccine serotypes, ITT (Fixed) | 88 [73, 94] | P < 0.00001 |
0% | P = 0.77 |
80 [66, 88] | P < 0.00001 | 34% | P = 0.17 | ‐9.09% |
| IPD, all serotypes, ITT (Fixed) | 66 [46, 79] | P < 0.00001 |
51.1% | P = 0.09 |
53 [36, 65] | P < 0.00001 | 49% | P = 0.07 | ‐19.70% |
| IPD, non‐vaccine serotypes, ITT (Fixed) | 1 [‐143, 60] | P = 0.99 |
0% | P = 0.91 |
8 [‐117, 61] | P = 0.84 | 0% | P = 0.93 | 700.00% |
| IPD, vaccine‐related serotypes, ITT (Fixed) | ‐9 [‐369, 74] | P = 0.90 |
0% | P = 0.38 |
11 [‐236, 76] | P = 0.87 | 0% | P = 0.50 | 222.22% |
| IPD, vaccine serotypes, PP (Random) | 86 [60, 95] | P = 0.0003 |
25% | P = 0.36 |
80 [51, 92] | P = 0.0005 | 34% | P = 0.19 | ‐6.98% |
| IPD, all serotypes, PP (Random) | 69 [21, 88] | P = 0.01 | 70% | P = 0.02 | |||||
| IPD, non‐vaccine serotypes, PP (Random) | 32 [‐132, 80] | P = 0.54 | 0% | P = 0.87 | |||||
| IPD, vaccine‐related serotypes, PP (Random) | 40 [‐387, 93] | P = 0.63 | 0% | P = 0.64 | |||||
| IPD, vaccine serotypes, PP (Fixed) | 86 [61, 95] | P = 0.0002 | 25% | P = 0.36 | 81 [63, 90] | P < 0.00001 | 34% | P = 0.19 | ‐5.81% |
| IPD, all serotypes, PP (Fixed) | 59 [40, 73] | P < 0.00001 | 70% | P = 0.02 | |||||
| IPD, non‐vaccine serotypes, PP (Fixed) | 32 [‐132, 80] | P = 0.54 | 0% | P = 0.87 | |||||
| IPD, vaccine‐related serotypes, PP (Fixed) | 40 [‐387, 93] | P = 0.63 | 0% | P = 0.64 | |||||
| X‐ray defined pneumonia | |||||||||
| X‐ray defined pneumonia, ITT (Random) | 22 [11, 31] | P = 0.0002 | 0% | P = 0.80 |
27 [15, 36] | P < 0.0001 | 41% | P = 0.16 | 22.73% |
| X‐ray defined pneumonia, ITT (Fixed) | 22 [11, 31] | P = 0.0002 | 0% | P = 0.80 |
29 [22, 35] | P < 0.00001 | 41% | P = 0.16 | 31.82% |
| X‐ray defined pneumonia, PP (Random) | 24 [11, 35] | P = 0.0007 | 0% | P = 0.90 |
33 [25, 40] | P < 0.00001 | 0% | P = 0.42 | 37.50% |
| X‐ray defined pneumonia, PP (Fixed) | 24 [11, 35] | P =0.0007 | 0% | P = 0.90 | 33 [25, 40] | P < 0.00001 | 0% | P = 0.42 |
37.50% |
| Clinical pneumonia | |||||||||
| Clinical pneumonia, ITT (Random) | 7 [0, 14] | P = 0.06 |
N/A* | N/A* | 6 [2, 9] | P = 0.0006 | 0% | P = 0.43 | ‐14.29% |
| Clinical pneumonia, ITT (Fixed) | 7 [0, 14] | P = 0.06 |
N/A* | N/A* | 6 [2, 9] | P = 0.0006 | 0% | P = 0.43 | ‐14.29% |
| Clinical pneumonia, PP (Random) | 6 [‐3, 14] | P = 0.21 |
N/A* | N/A* | 6 [2, 9] | P = 0.001 | 0% | P = 0.49 | 0.00% |
| Clinical pneumonia, PP (Fixed) | 6 [‐3, 14] | P = 0.21 |
N/A* | N/A* | 6 [2, 9] | P = 0.001 | 0% | P = 0.49 | 0.00% |
| All‐cause admissions | |||||||||
| All‐cause admissions, ITT (Random) | 5 [‐10, 17] | P = 0.50 | 87% | P = 0.006 | |||||
| All‐cause admissions, ITT (Fixed) | 4 [‐1, 9] | P = 0.08 | 87% | P = 0.006 | |||||
| All‐cause admissions, PP (Random) | 6 [‐8, 19] | P = 0.38 | 85% | P = 0.010 | |||||
| All‐cause admissions, PP (Fixed) | 6 [0, 11] | P = 0.04 | 85% | P = 0.010 | |||||
| All‐cause mortality | |||||||||
| All‐cause mortality, ITT (Random) | 11 [‐1, 21] | P = 0.08 | 0% | P = 0.98 | |||||
| All‐cause mortality, ITT (Fixed) | 11 [‐1, 21] | P = 0.08 | 0% | P = 0.98 | |||||
| All‐cause mortality, PP (Random) | 14 [0, 26] | P = 0.05 | 0% | P = 0.95 | |||||
| All‐cause mortality, PP (Fixed) | 14 [0, 26] | P = 0.05 | 0% | P = 0.95 | |||||
*Include one study (Black 2000)
Empty cells for particular outcomes in the 2004 review means that data were not available at that time or the results of only one study was available
23. Comparison of results between 2004 Review and 2009 Update (Children < 24 months and/or HIV‐1 negative plus HIV‐1 positive children).
| Outcome | 2004 Results | Effect P‐value | I2 |
Hetero P‐value |
2009 Update |
Effect P‐value |
I2 |
Hetero P‐value |
Difference (%) |
| VE [95% CI] | VE [95% CI] | ||||||||
| Invasive pneumococcal disease (IPD) | |||||||||
| IPD, vaccine serotypes, ITT (Random) | 81 [65, 89] | P < 0.00001 | 2.4% | P =0.39 | 77 [58, 88] | P < 0.00001 | 36% | P = 0.15 | ‐4.94% |
| IPD, all serotypes, ITT (Random) | 67 [36, 84] | P =0.001 | 54.7% | P = 0.07 | 58 [34, 73] | P = 0.0002 |
48% | P = 0.07 |
‐13.43% |
| IPD, non‐vaccine serotypes, ITT (Random) | ‐12 [‐118, 43] | P = 0.75 | 0% | P = 0.96 | ‐6 [104, 45] | P = 0.86 | 0% | P = 0.95 | 50.00% |
| IPD, vaccine‐related serotypes, ITT (Random) | 38 [‐32, 71] | P = 0.22 | 0% | P = 0.56 | 40 [‐25, 71] | P = 0.17 | 0% | P = 0.73 | 5.26% |
| IPD, vaccine serotypes, ITT (Fixed) | 80 [66, 89] | P < 0.00001 | 2.4% | P = 0.39 | 77 [65, 85] | P < 0.00001 | 36% | P = 0.15 | ‐3.75% |
| IPD, all serotypes, ITT (Fixed) | 61 [44, 72] | P < 0.00001 | 54.7% | P =0.07 | 53 [39, 64] | P < 0.00001 | 48% | P = 0.07 | ‐13.11% |
| IPD, non‐vaccine serotypes, ITT (Fixed) | ‐12 [‐118, 43] | P = 0.75 | 0% | P = 0.96 | ‐6 [‐104, 45] | P = 0.86 | 0% | P = 0.95 | 50.00% |
| IPD, vaccine‐related serotypes, ITT (Fixed) | 38 [‐32, 71] | P = 0.22 | 0% | P = 0.56 | 40 [‐25, 71] | P = 0.17 | 0% | P = 0.73 | 5.26% |
| IPD, vaccine serotypes, PP (Random) | 78 [29, 93] | P = 0.01 | 50% | P = 0.11 | |||||
| IPD, all serotypes, PP (Random) | 69 [21, 88] | P = 0.01 | 70% | P = 0.02 | |||||
| IPD, non‐vaccine serotypes, PP (Random) | 32 [‐132, 80] | P = 0.54 | 0% | P = 0.87 | |||||
| IPD, vaccine‐related serotypes, PP (Random) | 40 [‐387, 93] | P = 0.63 | 0% | P = 0.64 | |||||
| IPD, vaccine serotypes, PP (Fixed) | 80 [60, 90] | P < 0.00001 | 50% | P = 0.11 | |||||
| IPD, all serotypes, PP (Fixed) | 59 [40, 73] | P < 0.00001 | 70% | P = 0.02 | |||||
| IPD, non‐vaccine serotypes, PP (Fixed) | 32 [‐132, 80] | P = 0.54 | 0% | P = 0.87 | |||||
| IPD, vaccine‐related serotypes, PP (Fixed) | 40 [‐387, 93] | P = 0.63 | 0% | P = 0.64 | |||||
| X‐ray defined pneumonia | |||||||||
| X‐ray defined pneumonia, ITT (Random) | 19 [10, 28] | P < 0.0001 | 0% | P = 0.53 | 25 [12, 36] | P = 0.0004 | 61% | P = 0.05 | 31.58% |
| X‐ray defined pneumonia, ITT (Fixed) | 19 [10, 28] | P < 0.0001 | 0% | P = 0.53 | 26 [19, 32] | P < 0.00001 | 61% | P = 0.05 | 36.84% |
| X‐ray defined pneumonia, PP (Random) | 35 [26, 42] | P < 0.00001 | 0% | P = 0.40 | |||||
| X‐ray defined pneumonia, PP (Fixed) | 35 [26, 42] | P < 0.00001 | 0% | P = 0.40 | |||||
| Clinical pneumonia | |||||||||
| Clinical pneumonia, ITT (Random) | 6 [3, 9] | P = 0.0006 | 18% | P = 0.30 | |||||
| Clinical pneumonia, ITT (Fixed) | 6 [3, 9] | P < 0.0001 | 18% | P = 0.30 | |||||
| Clinical pneumonia, PP (Random) | 6 [3, 10] | P = 0.001 | 11% | P = 0.34 | |||||
| Clinical pneumonia, PP (Fixed) | 6 [3, 10] | P = 0.0004 | 11% | P = 0.34 | |||||
| All‐cause admissions | |||||||||
| All‐cause admissions, ITT (Random) | 5 [‐10, 17] | P = 0.50 | 87% | P = 0.006 | |||||
| All‐cause admissions, ITT (Fixed) | 4 [‐1, 9] | P = 0.08 | 87% | P = 0.006 | |||||
| All‐cause admissions, PP (Random) | 6 [‐8, 19] | P = 0.38 | 85% | P = 0.010 | |||||
| All‐cause admissions, PP (Fixed) | 6 [0, 11] | P = 0.04 | 85% | P = 0.010 | |||||
| All‐cause mortality | |||||||||
| All‐cause mortality, ITT (Random) | 11 [‐1, 21] | P = 0.08 | 0% | P = 0.98 | |||||
| All‐cause mortality, ITT (Fixed) | 9 [‐1, 19] | P = 0.07 | 0% | P = 0.97 | |||||
| All‐cause mortality, PP (Random) | 14 [0, 26] | P = 0.05 | 0% | P = 0.95 | |||||
| All‐cause mortality, PP (Fixed) | 14 [0, 26] | P = 0.05 | 0% | P = 0.95 | |||||
Empty cells for particular outcomes in the 2004 review means that data were not available at that time or the results of only one study was available
Changes from 2004 and 2009 (only ITT, random‐effects model results for IPD)
VT‐IPD: There was a decrease of VE from 88% (in 2004) to 80% (in 2009) when the results of Cutts 2005; and Lucero 2009; were added. However the pooled VE was still significant in the 2009 update, although heterogeneity appeared.
All serotypes‐IPD: There was a decrease of VE from 68% to 58%, but pooled estimates of efficacy were still significant.
NVT‐IPD and VRT‐IPD: There was an increase in VE but it was not significant.
Changes from 2004 and 2009 (only ITT, random‐effects model results for X‐ray defined and clinical pneumonia)
There was an increase in VE for X‐ray defined pneumonia from 22% (in 2004) to 27% (in 2009) with the addition of Cutts 2005, and Lucero 2009. Although O'Brien 2002 had contributed, this publication was excluded after sensitivity analysis showed that it was an outlier. The results remained significant.
VE for clinical pneumonia decreased by 1% with the addition of Cutts 2005 and Lucero 2009. Nevertheless, the VE attained significance in 2009.
Overall completeness and applicability of evidence
Because phase 3 studies of the efficacy of an intervention are expensive, assessment of the impact of PCV against relevant outcomes at this point in time are limited only to the six trials which have been conducted since the late 1990s starting with the study in the US (Black 2000) up to the publication of the Philippines trial (Lucero 2009). Despite the paucity of studies, the review has provided sufficient evidence to address the IPD and pneumonia outcome objectives of this review but not the objective of studying the outcomes of all‐cause mortality and all‐cause admissions.
How applicable is the evidence of the impact of PCV against the outcomes studied in this review? The trials have been conducted in both high‐income and low‐income country settings where population characteristics are quite dissimilar, particularly in the context of incidence of IPD and pneumonia, socio‐demographic factors like nutritional status, crowding, and environmental pollution that may put children younger than two years of age at greater risk of acquiring lower respiratory tract infections. Accessibility to health care facilities will also differ. Despite these differences, the direction of effect of the vaccine has been consistent. The Grade Profiler (GRADEPro 2008) software incorporated in the Review Manager (RevMan 2008) software has made it possible to present the results not only of the pooled VE but also the absolute effect. Moreover, the software has also calculated the possible absolute effect in areas with low, medium, or high baseline rates for the relevant outcomes given the pooled vaccine efficacy for these endpoints. We believe that the evidence presented in this review can be applied to various settings.
How do the results of this review fit into the context of current immunisation guidelines or practices? The US was the first country to introduce the PCV into their national immunisation programme as a result of the study of Black 2000, and mainly for prevention of IPD. Other high‐income countries have also introduced the PCV and based on the burden of IPD, some countries have instituted their own schedule of vaccination. Some 31 low‐income countries have expressed their interest to Global Alliance for Vaccines and Immunisation (GAVI) about including a PCV into their EPI programmes (Prevent Pneumo 2008). Rwanda is the first GAVI‐eligible country to include into their EPI a PCV, 7PCV being the only PCV available in the market so far (Rwanda 2009). The WHO on the other hand, has recommended that the PCV be introduced into low‐income countries where mortality among children aged younger than five years is > 50/1000 live births, or where > 50,000 children die annually (WER 2007). The results of this review are in line with the WHO position on the use of PCV in low‐income countries. Ultimately, the decision to include the PCV into national programmes depends on the availability of estimates on disease burden, costs incurred and averted by vaccination, country‐specific health care priorities in relation to available resources, and political will.
Quality of the evidence
The evidence that has come out of this review is robust enough to make a conclusion regarding the effect of the PCV in reducing the incidence of VT‐IPD and all serotypes‐IPD in HIV‐1 negative and HIV‐1 positive children. The review included six randomised trials with more than 100,000 children participating. All trials were randomised, controlled, double‐blind trials which were low‐risk for bias in terms of sequence generation, allocation concealment, and blinding ‐ domains which are crucial to avoid selection bias, performance bias, attrition bias, and detection bias. The analysis used a generic inverse method to allow comparability of one cluster‐randomised trial (O'Brien 2002, O'Brien 2003) with the rest of the included trials, all of which were individual randomised. Also, despite the presence of incomplete data reporting for the Finnish trial, and early stopping in the NCKP and American Indian trials making them high risk for bias, these were judged by the authors to have insufficient influence or impact on the calculated pooled effect estimate for IPD. The quality of evidence was rated high based on criteria of study design, no limitation, which affects validity of results, consistent results, and presence of direct evidence, absence of imprecision and, strong association of the effect of PCV against IPD. If the quality of the evidence is high, further research is unlikely to change our confidence in the estimate of effect at this point (GRADEPro 2008).
The quality of evidence on the effect of PCV against X‐ray defined and clinical pneumonia on the other hand was rated as moderate. This means that although the four publications reviewed for the pneumonia outcomes were randomised trials, and therefore of high quality, the NCKP trial from which two publications came out (Black 2002a; Hansen 2006) had serious limitations due to the presence of bias in the form of early stopping due to intervention benefits. In the context of the outcome X‐ray defined pneumonia, the quality could not be upgraded because the magnitude of the effect was not large (RR was 0.73) which is not > 5 or < 0.2 (GRADEPro 2008). For clinical pneumonia, the RR was similarly not large at 0.94 but with a narrow 95% CI of 0.91 to 0.98, estimates which could either become narrower or wider with the upper limit increasing to as high as 1 or > 1 rendering an effect inconclusive of a real reduction of the incidence of clinical pneumonia. When the quality of evidence is assessed as moderate, this means that further research is likely to have an important impact on our confidence in the estimate of effect and may change the estimate (GRADEPro 2008). Despite this reservation of the quality of evidence for the outcomes of X‐ray defined and clinical pneumonia, we have to mention that the effect estimates of individual studies were very similar even if the risk of disease varied in the study sites. Most importantly, the direction of effect was consistent in four out of five trials studied for the pneumonia outcomes.
Other factors must be considered in assessing the validity of results. It must be emphasised that since the pneumonia outcome is not etiology‐specific, only a portion of these pneumonias would be caused by vaccine‐type pneumococcus. The more specific the outcome, that is, outcome as near as possible to making an aetiology of pneumococcal disease, the more robust would be the results. This can be shown by the disparity of point estimates between the more specific X‐ray defined pneumonia, relative to that of non‐specific clinical pneumonia. The disparity is all the more apparent by the difference in point estimates between the most specific outcome of IPD and X‐ray defined or clinical pneumonia (RR = 0.20 versus RR = 0.73, and RR = 0.94, respectively).
Overall, the review authors have judged that the results from the meta‐analysis of these six trials are valid for the outcomes of IPD and pneumonia
Potential biases in the review process
The review authors have made sure that all the relevant publications were identified and that relevant data were obtained. All the methods for searching for studies, selection of studies, data collection and analyses were appropriately conducted so as not to introduce bias. Investigation of heterogeneity was done. It is of course really not possible to determine the extent of bias or even the true risk of bias in a given study. However, we have followed as explicitly as possible, the guidelines regarding identification of risks of bias through the tools available in RevMan 2008. We have judged that there were no potential biases in conducting the review as far as these processes were followed. We have made our own judgments regarding the quality of the trials involved based on other factors but these have also been made according to criteria set by RevMan 2008.
Agreements and disagreements with other studies or reviews
A meta‐analysis (Klugman 2008b) on the effect of PCV against IPD (including individual serotypes) was done but the follow‐up time was longer than in this review, particularly with the South African population which extended to 6.2 years. Moreover, Klugman 2008b included all child participants in his study regardless of age of vaccination. Nevertheless, the findings of Klugman 2008b are in agreement with the findings of this updated review. Madhi (Madhi 2008) has written an excellent review (narrative, not systematic) on the factors relating to the varied PCV efficacy against X‐ray defined pneumonia as a result of different methods of outcome event identification, health care practices, and availability or accessibility of health care in the different sites where the trials have been conducted. There is agreement that the PCV can reduce the incidence of X‐ray defined pneumonia in children younger than two years of age.
After the introduction of the PCV in the US in 2000, many studies have reported on the indirect effects of the PCV in this country, corroborating the results of this review. A reduction in the IPD incidence in adults has been reported (Whitney 2003). A number of studies on the reduction of pneumonia hospitalisations in the US (Grijalva 2007;MMWR 2009) have been reported.
Authors' conclusions
Implications for practice.
The PCV is efficacious in preventing invasive disease due to vaccine serotypes. The evidence so far for the outcomes of X‐ray defined and clinical pneumonia favour the conclusion that PCV reduces the incidence of X‐ray defined pneumonia. The impact is considerably lower for clinical pneumonia relative to that of X‐ray defined pneumonia but is still significant. Policy makers should look into existing data on burden of pneumonia disease or risk of disease in children under two years of age, serotype‐specific disease, drug resistance in the local setting, and the cost of the vaccine to make informed decisions on the inclusion of the vaccine into national immunisation programmes.
Implications for research.
In countries where IPD burden identified by blood culture is thought to be low, more effort should be made to use tools that would improve the identification of pneumococcus so as to clarify the role of this organism in causing high morbidity and mortality. A GSK phase 3 trial on 10 PCV currently underway still aims to determine by blood culture the efficacy of this candidate vaccine against IPD caused by S. pneumoniae or Haemophilus influenzae (H. influenzae), as well as its impact on the occurrence of hospital‐diagnosed pneumonia cases, tympanostomy tube placement and outpatient antimicrobial prescriptions (started 11 May 2009, GSK 2009). Studies are needed to identify outcomes or combination of clinical or laboratory outcomes other than blood cultures that would improve specificity of the diagnosis of pneumococcal infection for future phase 3 studies. But because phase 3 trials are quite expensive such that this GSK trial may very well be the last phase 3 trial on PCV, other correlates of pneumococcal infection may need to be explored. Trials ought to have adequate sample size to investigate an outcome. Where PCV trials are concerned, trialists and/or pharmaceutical companies have to discuss the consequences of decisions to stop clinical trials for apparent intervention benefits as the validity of study results may be compromised by unnecessarily putting the trial at high risk for bias. Replacement IPD has been reported in the US (Hicks 2007; Singleton 2007). There has been an increased identification of NVT‐IPD. Monitoring of this phenomenon should continue to re‐evaluate the current vaccine being used in national immunisation programmes.
What's new
| Date | Event | Description |
|---|---|---|
| 9 March 2009 | New citation required but conclusions have not changed | Two new trials were included ‐ the Gambian trial (Cutts 2005), and the Philippines trial (Lucero 2009). |
| 9 March 2009 | New search has been performed | Searches conducted. |
History
Protocol first published: Issue 1, 2000 Review first published: Issue 4, 2004
| Date | Event | Description |
|---|---|---|
| 4 December 2008 | New search has been performed | Changes in authors. |
| 14 August 2008 | Amended | Converted to new review format. |
| 20 August 2005 | New search has been performed | Searches conducted. |
Notes
The title has changed from Pneumococcal conjugate vaccines for preventing vaccine‐type invasive pneumococcal disease and pneumonia with consolidation on X‐ray in children under two years of age to Pneumococcal conjugate vaccines for preventing vaccine‐type invasive pneumococcal disease and X‐ray defined pneumonia in children under two years of age. The reason for this is the change in terminology for the diagnosis of pneumonia using radiography. It used to be just the presence of consolidation. However, the WHO standardised the definition of X‐ray defined pneumonia which did not only include consolidation. Moreover, all the pneumococcal trialists, including the main author of this review, used the WHO standardised definitions in reading chest radiographs. Thus, the title change reflects the change in terminology.
Acknowledgements
This work was performed under a collaborative arrangement with the PneumoADIP at Johns Hopkins Bloomberg School of Public Health and was funded in full by the GAVI Alliance.
Ms. Elizabeth Dooley, for providing the authors the impetus to complete this update, and for providing solutions to our countless queries.
Ms. Nancy Santesso of the GRADE working team for having given us her time, expertise and patience in answering our queries regarding absolute effect calculations in the GradePro software.
Ms. Sarah Thorning for updating our electronic searches.
Dr Kenneth John Lim, for helping us with the use of EndNote.
All the authors with whom we communicated through email and who gave us their time, talent, and data in the format we required.
Vicky Debold, Kate O’Brien, Robert Ware, and Peter Morris for commenting on the draft of this updated review.
Appendices
Appendix 1. Embase AND Medline Search Strategies
EMBASE (WebSPIRS) #1 explode 'pneumonia‐' / all subheadings #2 (pneumonia in ti) or (pneumonia in ab) #3 explode 'Streptococcus‐infection' / #4 (pneumococc* in ti) or (pneumococc* in ab) #5 #1 or #2 or #3 or #4 #6 explode 'Pneumococcus‐vaccine' / all subheadings #7 (pneumococcal vaccine$ in ti) or (pneumococcal vaccine$ in ab) #8 #6 or #7 #9 explode 'infant‐' / all subheadings #10 explode 'child‐' / all subheadings #11 (infant$ or child$) in ti #12 (infant$ or child$) in ab #13 #9 or #10 or #11 or #12 #14 #5 and #8 and #13
Appendix 2. Books of Abstracts of International Symposia
1. Books of Abstracts of the International Symposium for Pneumococci and Pneumococcal Disease (ISPPD) of the following meetings: a. 13 to 17 June 1998 in Copenhagen, Denmark; b. 19 to 23 March 2000 in Sun City, South Africa; c. 5 to 8 May 2002 in Anchorage, Alaska; d. 9 to13 May 2004 in Helsinki, Finland; e. 2 to 6 April 2006 in Alice Springs, Central Australia; f. 8 to 12 June 2008 in Reykjavik, Iceland.
2. Books of Abstracts of the World Congress of Paediatric Infectious Diseases (WSPID) of the following triennial meetings: a. 19 to 23 November 2002 in Santiago, Chile; b. 1 to 4 September 2005 in Warsaw, Poland; c. 15 to 18 November 2007 in Bangkok, Thailand.
3. Books of Abstracts of the Annual Meeting of the European Society for Paediatric Infectious Diseases (ESPID) of the following meetings: a. 17th Annual Meeting, 19 to 21 May 1999 in Heraklion, Crete, Greece; b. 19th Annual Meeting, 26 to 28 March 2001 in Istanbul, Turkey; c. 21st Annual Meeting, 9 to 11 April 2003 in Giardini Naxos, Taormina, Sicily; d. 22nd Annual Meeting, 26 to 28 May 2004 in Tampere, Finland; e. 23rd Annual Meeting, 18 to 20 May 2005 in Valencia, Spain; f. 24th Annual Meeting, 3 to 5 May 2006 in Basel, Switzerland; g. 25th Annual Meeting, 2 to 4 May 2007 in Porto, Portugal; h. 26th Annual Meeting, 13 to 17 May 2008 in Graz, Austria.
Data and analyses
Comparison 1. Children < 24 months and/or HIV‐1 negative children.
| Outcome or subgroup title | No. of studies | No. of participants | Statistical method | Effect size |
|---|---|---|---|---|
| 1 IPD, vaccine serotypes, ITT (Random) | 7 | 113045 | Risk Ratio (Random, 95% CI) | 0.20 [0.10, 0.42] |
| 2 IPD, all serotypes, ITT (Random) | 7 | 113045 | Risk Ratio (Random, 95% CI) | 0.42 [0.25, 0.71] |
| 3 IPD, non‐vaccine serotypes, ITT (Random) | 6 | 95608 | Risk Ratio (Random, 95% CI) | 0.92 [0.39, 2.17] |
| 4 IPD, vaccine‐related serotypes, ITT (Random) | 4 | 93110 | Risk Ratio (Random, 95% CI) | 0.89 [0.24, 3.36] |
| 5 X‐ray defined pneumonia, ITT (Random) | 5 | 89457 | Risk Ratio (Random, 95% CI) | 0.81 [0.66, 1.00] |
| 6 Clinical pneumonia, ITT (Random) | 4 | 104755 | Risk Ratio (Random, 95% CI) | 0.94 [0.91, 0.98] |
| 7 All‐cause admissions, ITT (Random) | 2 | 29628 | Risk Ratio (Random, 95% CI) | 0.95 [0.83, 1.10] |
| 8 All‐cause mortality, ITT (Random) | 5 | 69385 | Risk Ratio (Random, 95% CI) | 0.89 [0.79, 1.01] |
| 9 IPD, vaccine serotypes, ITT (Fixed) | 7 | 113045 | Risk Ratio (Fixed, 95% CI) | 0.20 [0.12, 0.34] |
| 10 IPD, all serotypes, ITT (Fixed) | 7 | 113045 | Risk Ratio (Fixed, 95% CI) | 0.47 [0.35, 0.64] |
| 11 IPD, non‐vaccine serotypes, ITT (Fixed) | 6 | 95608 | Risk Ratio (Fixed, 95% CI) | 0.92 [0.39, 2.17] |
| 12 IPD, vaccine‐related serotypes, ITT (Fixed) | 4 | 93110 | Risk Ratio (Fixed, 95% CI) | 0.89 [0.24, 3.36] |
| 13 X‐ray defined pneumonia, ITT (Fixed) | 5 | 89457 | Risk Ratio (Fixed, 95% CI) | 0.76 [0.70, 0.83] |
| 14 Clinical pneumonia, ITT (Fixed) | 4 | 104755 | Risk Ratio (Fixed, 95% CI) | 0.94 [0.91, 0.98] |
| 15 All‐cause admissions, ITT (Fixed) | 2 | 29628 | Risk Ratio (Fixed, 95% CI) | 0.96 [0.91, 1.01] |
| 16 All‐cause mortality, ITT (Fixed) | 5 | 69385 | Risk Ratio (Fixed, 95% CI) | 0.89 [0.79, 1.01] |
| 17 IPD, vaccine serotypes, PP (Random) | 5 | 94950 | Risk Ratio (Random, 95% CI) | 0.20 [0.08, 0.49] |
| 18 IPD, all serotypes, PP (Random) | 4 | 60244 | Risk Ratio (Random, 95% CI) | 0.31 [0.12, 0.79] |
| 19 IPD, non‐vaccine serotypes, PP (Random) | 3 | 43904 | Risk Ratio (Random, 95% CI) | 0.68 [0.20, 2.32] |
| 20 IPD, vaccine‐related serotypes, PP (Random) | 2 | 16786 | Risk Ratio (Random, 95% CI) | 0.60 [0.07, 4.87] |
| 21 X‐ray defined pneumonia, PP (Random) | 5 | 79060 | Risk Ratio (Random, 95% CI) | 0.76 [0.61, 0.94] |
| 22 Clinical pneumonia, PP (Random) | 4 | 96843 | Risk Ratio (Random, 95% CI) | 0.94 [0.91, 0.98] |
| 23 All‐cause admissions, PP (Random) | 2 | 28371 | Risk Ratio (Random, 95% CI) | 0.94 [0.81, 1.08] |
| 24 All‐cause mortality, PP (Random) | 2 | 28371 | Risk Ratio (Random, 95% CI) | 0.86 [0.74, 1.00] |
| 25 Invasive Disease, Vaccine Serotype PP (Fixed) | 5 | 94950 | Risk Ratio (Fixed, 95% CI) | 0.19 [0.10, 0.37] |
| 26 IPD, all serotypes, PP (Fixed) | 4 | 60244 | Risk Ratio (Fixed, 95% CI) | 0.41 [0.27, 0.60] |
| 27 IPD, non‐vaccine serotypes, PP (Fixed) | 3 | 43904 | Risk Ratio (Fixed, 95% CI) | 0.68 [0.20, 2.32] |
| 28 IPD, vaccine‐related serotypes, PP (Fixed) | 2 | 16786 | Risk Ratio (Fixed, 95% CI) | 0.60 [0.07, 4.87] |
| 29 X‐ray defined pneumonia, PP (Fixed) | 5 | 79060 | Risk Ratio (Fixed, 95% CI) | 0.73 [0.66, 0.80] |
| 30 Clinical pneumonia, PP (Fixed) | 4 | 96843 | Risk Ratio (Fixed, 95% CI) | 0.94 [0.91, 0.98] |
| 31 All‐cause admissions, PP (Fixed) | 2 | 28371 | Risk Ratio (Fixed, 95% CI) | 0.94 [0.89, 1.00] |
| 32 All‐cause mortality, PP (Fixed) | 2 | 28371 | Risk Ratio (Fixed, 95% CI) | 0.86 [0.74, 1.00] |
1.1. Analysis.
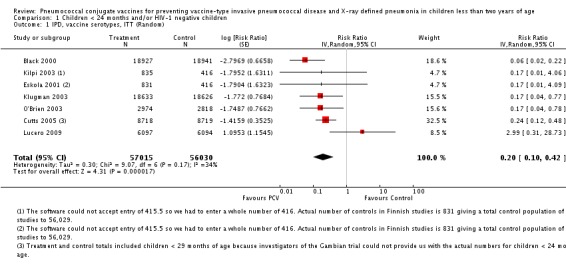
Comparison 1 Children < 24 months and/or HIV‐1 negative children, Outcome 1 IPD, vaccine serotypes, ITT (Random).
1.2. Analysis.
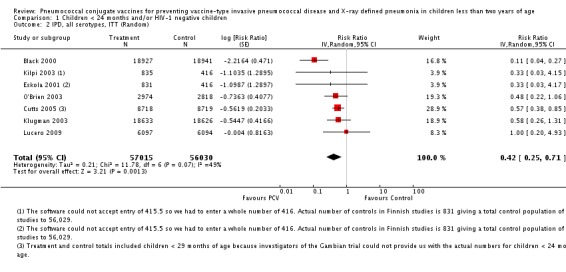
Comparison 1 Children < 24 months and/or HIV‐1 negative children, Outcome 2 IPD, all serotypes, ITT (Random).
1.3. Analysis.
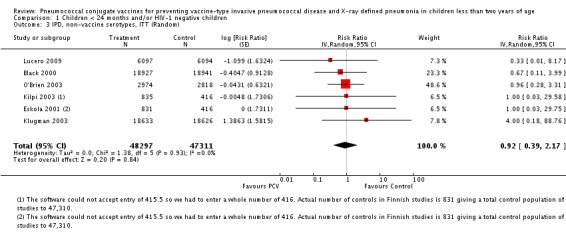
Comparison 1 Children < 24 months and/or HIV‐1 negative children, Outcome 3 IPD, non‐vaccine serotypes, ITT (Random).
1.4. Analysis.

Comparison 1 Children < 24 months and/or HIV‐1 negative children, Outcome 4 IPD, vaccine‐related serotypes, ITT (Random).
1.5. Analysis.
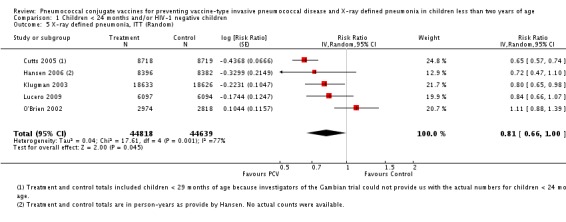
Comparison 1 Children < 24 months and/or HIV‐1 negative children, Outcome 5 X‐ray defined pneumonia, ITT (Random).
1.6. Analysis.
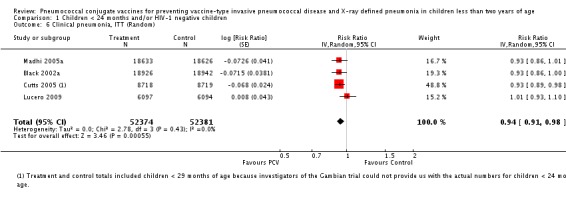
Comparison 1 Children < 24 months and/or HIV‐1 negative children, Outcome 6 Clinical pneumonia, ITT (Random).
1.7. Analysis.

Comparison 1 Children < 24 months and/or HIV‐1 negative children, Outcome 7 All‐cause admissions, ITT (Random).
1.8. Analysis.
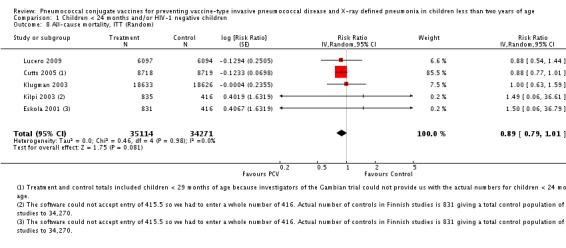
Comparison 1 Children < 24 months and/or HIV‐1 negative children, Outcome 8 All‐cause mortality, ITT (Random).
1.9. Analysis.
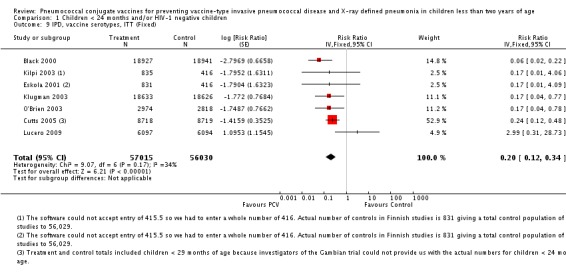
Comparison 1 Children < 24 months and/or HIV‐1 negative children, Outcome 9 IPD, vaccine serotypes, ITT (Fixed).
1.10. Analysis.
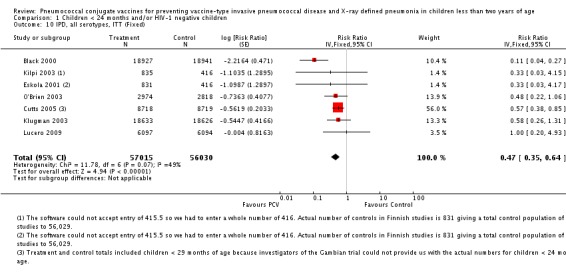
Comparison 1 Children < 24 months and/or HIV‐1 negative children, Outcome 10 IPD, all serotypes, ITT (Fixed).
1.11. Analysis.
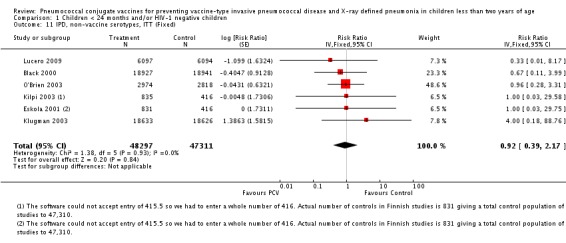
Comparison 1 Children < 24 months and/or HIV‐1 negative children, Outcome 11 IPD, non‐vaccine serotypes, ITT (Fixed).
1.12. Analysis.

Comparison 1 Children < 24 months and/or HIV‐1 negative children, Outcome 12 IPD, vaccine‐related serotypes, ITT (Fixed).
1.13. Analysis.
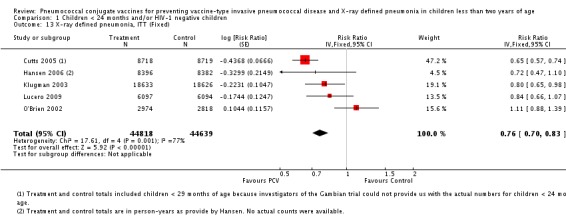
Comparison 1 Children < 24 months and/or HIV‐1 negative children, Outcome 13 X‐ray defined pneumonia, ITT (Fixed).
1.14. Analysis.
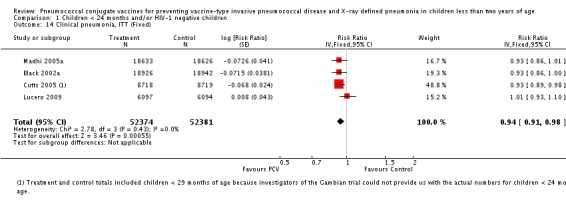
Comparison 1 Children < 24 months and/or HIV‐1 negative children, Outcome 14 Clinical pneumonia, ITT (Fixed).
1.15. Analysis.

Comparison 1 Children < 24 months and/or HIV‐1 negative children, Outcome 15 All‐cause admissions, ITT (Fixed).
1.16. Analysis.
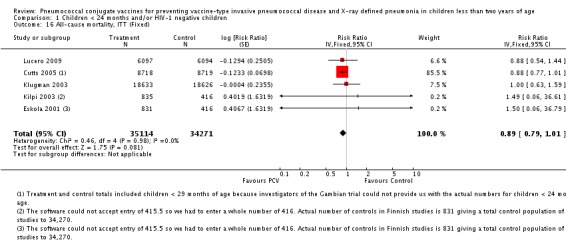
Comparison 1 Children < 24 months and/or HIV‐1 negative children, Outcome 16 All‐cause mortality, ITT (Fixed).
1.17. Analysis.
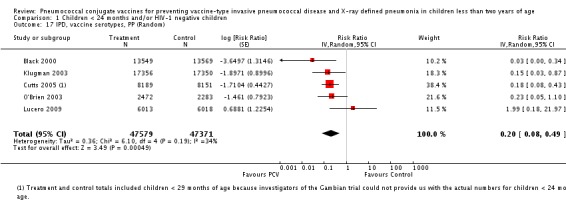
Comparison 1 Children < 24 months and/or HIV‐1 negative children, Outcome 17 IPD, vaccine serotypes, PP (Random).
1.18. Analysis.
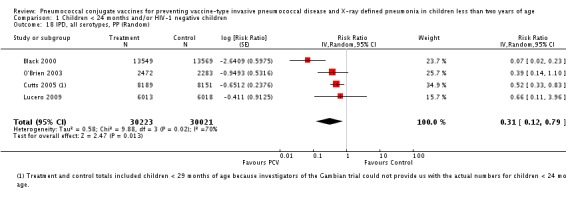
Comparison 1 Children < 24 months and/or HIV‐1 negative children, Outcome 18 IPD, all serotypes, PP (Random).
1.19. Analysis.

Comparison 1 Children < 24 months and/or HIV‐1 negative children, Outcome 19 IPD, non‐vaccine serotypes, PP (Random).
1.20. Analysis.

Comparison 1 Children < 24 months and/or HIV‐1 negative children, Outcome 20 IPD, vaccine‐related serotypes, PP (Random).
1.21. Analysis.
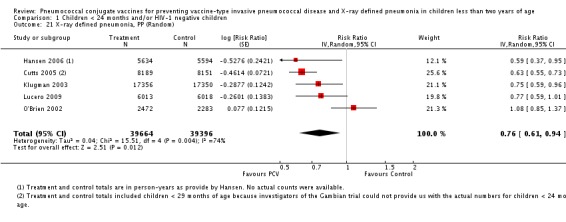
Comparison 1 Children < 24 months and/or HIV‐1 negative children, Outcome 21 X‐ray defined pneumonia, PP (Random).
1.22. Analysis.
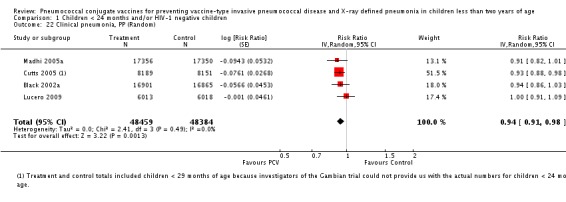
Comparison 1 Children < 24 months and/or HIV‐1 negative children, Outcome 22 Clinical pneumonia, PP (Random).
1.23. Analysis.

Comparison 1 Children < 24 months and/or HIV‐1 negative children, Outcome 23 All‐cause admissions, PP (Random).
1.24. Analysis.

Comparison 1 Children < 24 months and/or HIV‐1 negative children, Outcome 24 All‐cause mortality, PP (Random).
1.25. Analysis.
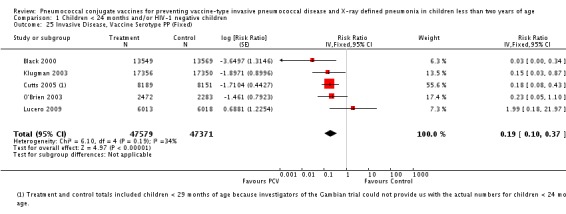
Comparison 1 Children < 24 months and/or HIV‐1 negative children, Outcome 25 Invasive Disease, Vaccine Serotype PP (Fixed).
1.26. Analysis.
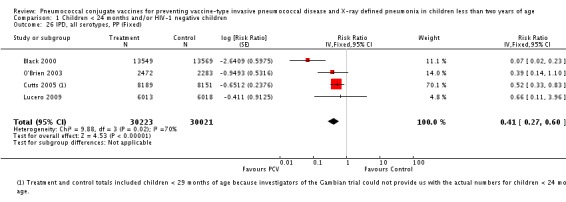
Comparison 1 Children < 24 months and/or HIV‐1 negative children, Outcome 26 IPD, all serotypes, PP (Fixed).
1.27. Analysis.

Comparison 1 Children < 24 months and/or HIV‐1 negative children, Outcome 27 IPD, non‐vaccine serotypes, PP (Fixed).
1.28. Analysis.

Comparison 1 Children < 24 months and/or HIV‐1 negative children, Outcome 28 IPD, vaccine‐related serotypes, PP (Fixed).
1.29. Analysis.
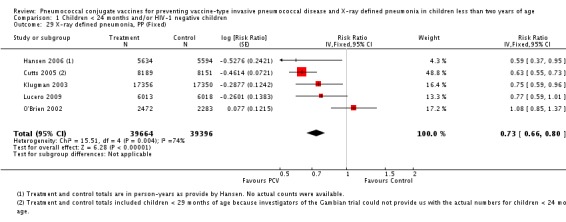
Comparison 1 Children < 24 months and/or HIV‐1 negative children, Outcome 29 X‐ray defined pneumonia, PP (Fixed).
1.30. Analysis.
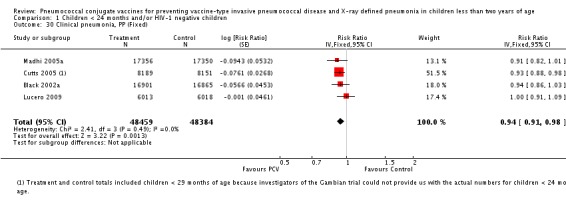
Comparison 1 Children < 24 months and/or HIV‐1 negative children, Outcome 30 Clinical pneumonia, PP (Fixed).
1.31. Analysis.

Comparison 1 Children < 24 months and/or HIV‐1 negative children, Outcome 31 All‐cause admissions, PP (Fixed).
1.32. Analysis.

Comparison 1 Children < 24 months and/or HIV‐1 negative children, Outcome 32 All‐cause mortality, PP (Fixed).
Comparison 2. Children < 24 months and/or HIV‐1 negative and HIV‐1 positive children.
| Outcome or subgroup title | No. of studies | No. of participants | Statistical method | Effect size |
|---|---|---|---|---|
| 1 IPD, vaccine serotypes, ITT (Random) | 7 | 113045 | Risk Ratio (Random, 95% CI) | 0.23 [0.12, 0.42] |
| 2 IPD, all serotypes, ITT (Random) | 7 | 113045 | Risk Ratio (Random, 95% CI) | 0.42 [0.27, 0.66] |
| 3 IPD, non‐vaccine serotypes, ITT (Random) | 6 | 95608 | Risk Ratio (Random, 95% CI) | 1.06 [0.55, 2.04] |
| 4 IPD, vaccine‐related serotypes, ITT (Random) | 4 | 93110 | Risk Ratio (Random, 95% CI) | 0.60 [0.29, 1.25] |
| 5 X‐ray defined pneumonia, ITT (Random) | 5 | 89457 | Risk Ratio (Random, 95% CI) | 0.82 [0.67, 0.99] |
| 6 Clinical pneumonia, ITT (Random) | 4 | 104755 | Risk Ratio (Random, 95% CI) | 0.94 [0.91, 0.97] |
| 7 All‐cause admissions, ITT (Random) | 2 | 29628 | Risk Ratio (Random, 95% CI) | 0.95 [0.83, 1.10] |
| 8 All‐cause mortality, ITT (Random) | 5 | 69385 | Risk Ratio (Random, 95% CI) | 0.91 [0.81, 1.01] |
| 9 IPD, vaccine serotypes, ITT (Fixed) | 7 | 113045 | Risk Ratio (Fixed, 95% CI) | 0.23 [0.15, 0.35] |
| 10 IPD, all serotypes, ITT (Fixed) | 7 | 113045 | Risk Ratio (Fixed, 95% CI) | 0.47 [0.36, 0.61] |
| 11 IPD, non‐vaccine serotypes, ITT (Fixed) | 6 | 95608 | Risk Ratio (Fixed, 95% CI) | 1.06 [0.55, 2.04] |
| 12 IPD, vaccine‐related serotypes, ITT (Fixed) | 4 | 93110 | Risk Ratio (Fixed, 95% CI) | 0.60 [0.29, 1.25] |
| 13 X‐ray defined pneumonia, ITT (Fixed) | 5 | 89457 | Risk Ratio (Fixed, 95% CI) | 0.78 [0.72, 0.84] |
| 14 Clinical pneumonia, ITT (Fixed) | 4 | 104755 | Risk Ratio (Fixed, 95% CI) | 0.94 [0.91, 0.97] |
| 15 All‐cause admissions, ITT (Fixed) | 2 | 29628 | Risk Ratio (Fixed, 95% CI) | 0.96 [0.91, 1.01] |
| 16 All‐cause mortality, ITT (Fixed) | 5 | 69385 | Risk Ratio (Fixed, 95% CI) | 0.91 [0.81, 1.01] |
| 17 IPD, vaccine serotypes, PP (Random) | 4 | 60244 | Risk Ratio (Random, 95% CI) | 0.22 [0.07, 0.71] |
| 18 IPD, all serotypes, PP (Random) | 4 | 60244 | Risk Ratio (Random, 95% CI) | 0.31 [0.12, 0.79] |
| 19 IPD, non‐vaccine serotypes, PP (Random) | 3 | 43904 | Risk Ratio (Random, 95% CI) | 0.68 [0.20, 2.32] |
| 20 IPD, vaccine‐related serotypes, PP (Random) | 2 | 16786 | Risk Ratio (Random, 95% CI) | 0.60 [0.07, 4.87] |
| 21 X‐ray defined pneumonia, PP (Random) | 4 | 44354 | Risk Ratio (Random, 95% CI) | 0.76 [0.57, 1.01] |
| 22 Clinical pneumonia, PP (Random) | 4 | 96843 | Risk Ratio (Random, 95% CI) | 0.94 [0.90, 0.97] |
| 23 All‐cause admissions, PP (Random) | 2 | 28371 | Risk Ratio (Random, 95% CI) | 0.94 [0.81, 1.08] |
| 24 All‐cause mortality, PP (Random) | 2 | 28371 | Risk Ratio (Random, 95% CI) | 0.86 [0.74, 1.00] |
| 25 IPD, vaccine serotypes, PP (Fixed) | 4 | 60244 | Risk Ratio (Fixed, 95% CI) | 0.20 [0.10, 0.40] |
| 26 IPD, all serotypes, PP (Fixed) | 4 | 60244 | Risk Ratio (Fixed, 95% CI) | 0.41 [0.27, 0.60] |
| 27 IPD, non‐vaccine serotypes, PP (Fixed) | 3 | 43904 | Risk Ratio (Fixed, 95% CI) | 0.68 [0.20, 2.32] |
| 28 IPD, vaccine‐related serotypes, PP (Fixed) | 2 | 16786 | Risk Ratio (Fixed, 95% CI) | 0.60 [0.07, 4.87] |
| 29 X‐ray defined pneumonia, PP (Fixed) | 4 | 44354 | Risk Ratio (Fixed, 95% CI) | 0.72 [0.65, 0.81] |
| 30 Clinical pneumonia, PP (Fixed) | 4 | 96843 | Risk Ratio (Fixed, 95% CI) | 0.94 [0.90, 0.97] |
| 31 All‐cause admissions, PP (Fixed) | 2 | 28371 | Risk Ratio (Fixed, 95% CI) | 0.94 [0.89, 1.00] |
| 32 All‐cause mortality, PP (Fixed) | 2 | 28371 | Risk Ratio (Fixed, 95% CI) | 0.86 [0.74, 1.00] |
2.1. Analysis.
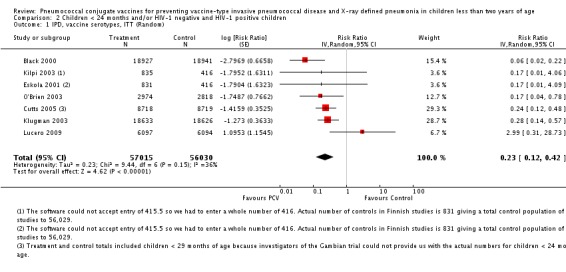
Comparison 2 Children < 24 months and/or HIV‐1 negative and HIV‐1 positive children, Outcome 1 IPD, vaccine serotypes, ITT (Random).
2.2. Analysis.
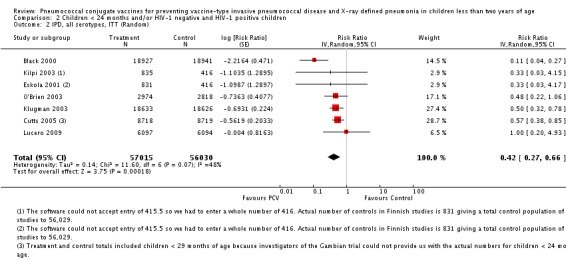
Comparison 2 Children < 24 months and/or HIV‐1 negative and HIV‐1 positive children, Outcome 2 IPD, all serotypes, ITT (Random).
2.3. Analysis.
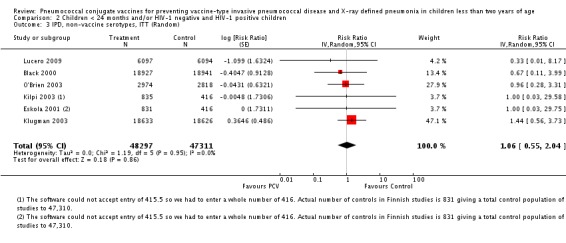
Comparison 2 Children < 24 months and/or HIV‐1 negative and HIV‐1 positive children, Outcome 3 IPD, non‐vaccine serotypes, ITT (Random).
2.4. Analysis.

Comparison 2 Children < 24 months and/or HIV‐1 negative and HIV‐1 positive children, Outcome 4 IPD, vaccine‐related serotypes, ITT (Random).
2.5. Analysis.
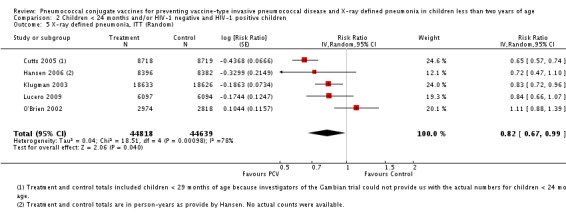
Comparison 2 Children < 24 months and/or HIV‐1 negative and HIV‐1 positive children, Outcome 5 X‐ray defined pneumonia, ITT (Random).
2.6. Analysis.
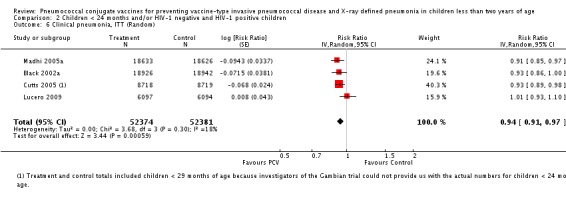
Comparison 2 Children < 24 months and/or HIV‐1 negative and HIV‐1 positive children, Outcome 6 Clinical pneumonia, ITT (Random).
2.7. Analysis.

Comparison 2 Children < 24 months and/or HIV‐1 negative and HIV‐1 positive children, Outcome 7 All‐cause admissions, ITT (Random).
2.8. Analysis.
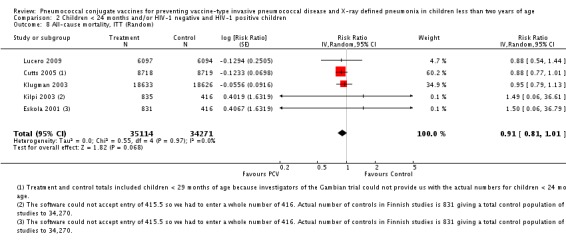
Comparison 2 Children < 24 months and/or HIV‐1 negative and HIV‐1 positive children, Outcome 8 All‐cause mortality, ITT (Random).
2.9. Analysis.
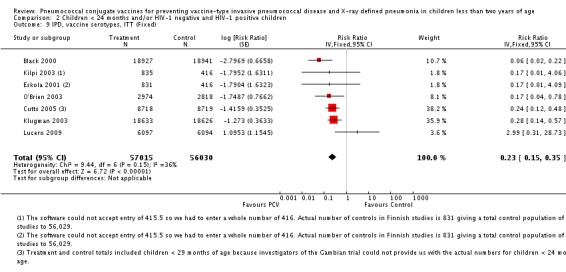
Comparison 2 Children < 24 months and/or HIV‐1 negative and HIV‐1 positive children, Outcome 9 IPD, vaccine serotypes, ITT (Fixed).
2.10. Analysis.
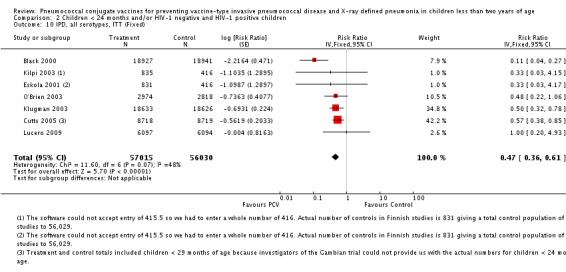
Comparison 2 Children < 24 months and/or HIV‐1 negative and HIV‐1 positive children, Outcome 10 IPD, all serotypes, ITT (Fixed).
2.11. Analysis.
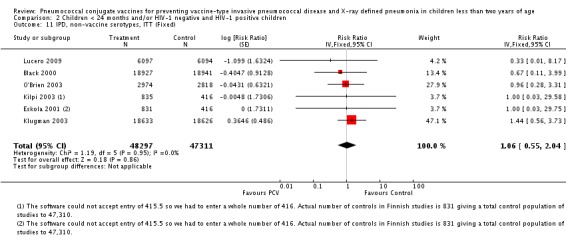
Comparison 2 Children < 24 months and/or HIV‐1 negative and HIV‐1 positive children, Outcome 11 IPD, non‐vaccine serotypes, ITT (Fixed).
2.12. Analysis.

Comparison 2 Children < 24 months and/or HIV‐1 negative and HIV‐1 positive children, Outcome 12 IPD, vaccine‐related serotypes, ITT (Fixed).
2.13. Analysis.
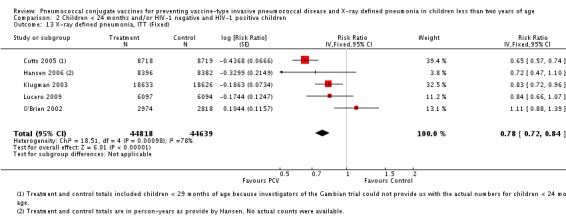
Comparison 2 Children < 24 months and/or HIV‐1 negative and HIV‐1 positive children, Outcome 13 X‐ray defined pneumonia, ITT (Fixed).
2.14. Analysis.
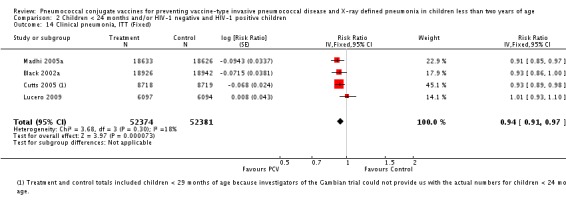
Comparison 2 Children < 24 months and/or HIV‐1 negative and HIV‐1 positive children, Outcome 14 Clinical pneumonia, ITT (Fixed).
2.15. Analysis.

Comparison 2 Children < 24 months and/or HIV‐1 negative and HIV‐1 positive children, Outcome 15 All‐cause admissions, ITT (Fixed).
2.16. Analysis.
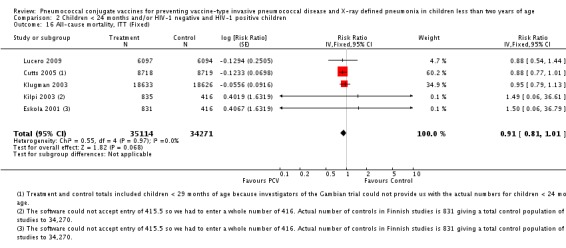
Comparison 2 Children < 24 months and/or HIV‐1 negative and HIV‐1 positive children, Outcome 16 All‐cause mortality, ITT (Fixed).
2.17. Analysis.
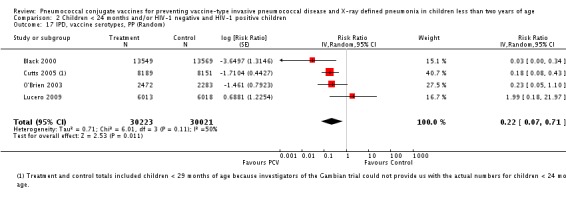
Comparison 2 Children < 24 months and/or HIV‐1 negative and HIV‐1 positive children, Outcome 17 IPD, vaccine serotypes, PP (Random).
2.18. Analysis.
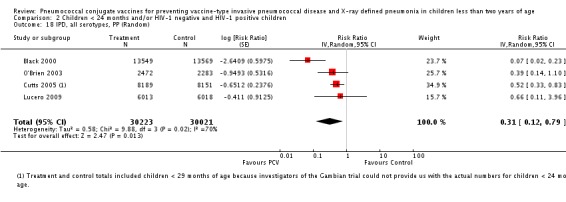
Comparison 2 Children < 24 months and/or HIV‐1 negative and HIV‐1 positive children, Outcome 18 IPD, all serotypes, PP (Random).
2.19. Analysis.

Comparison 2 Children < 24 months and/or HIV‐1 negative and HIV‐1 positive children, Outcome 19 IPD, non‐vaccine serotypes, PP (Random).
2.20. Analysis.

Comparison 2 Children < 24 months and/or HIV‐1 negative and HIV‐1 positive children, Outcome 20 IPD, vaccine‐related serotypes, PP (Random).
2.21. Analysis.
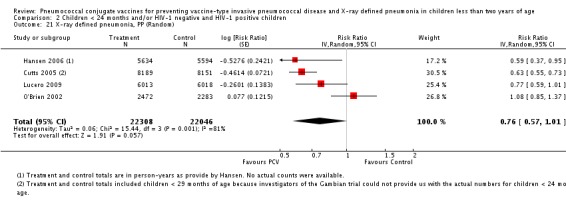
Comparison 2 Children < 24 months and/or HIV‐1 negative and HIV‐1 positive children, Outcome 21 X‐ray defined pneumonia, PP (Random).
2.22. Analysis.
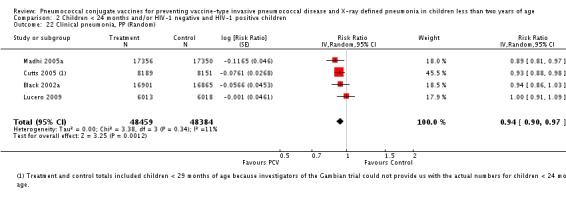
Comparison 2 Children < 24 months and/or HIV‐1 negative and HIV‐1 positive children, Outcome 22 Clinical pneumonia, PP (Random).
2.23. Analysis.

Comparison 2 Children < 24 months and/or HIV‐1 negative and HIV‐1 positive children, Outcome 23 All‐cause admissions, PP (Random).
2.24. Analysis.

Comparison 2 Children < 24 months and/or HIV‐1 negative and HIV‐1 positive children, Outcome 24 All‐cause mortality, PP (Random).
2.25. Analysis.
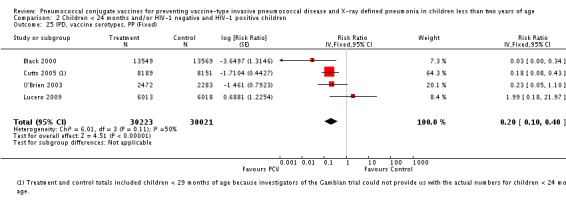
Comparison 2 Children < 24 months and/or HIV‐1 negative and HIV‐1 positive children, Outcome 25 IPD, vaccine serotypes, PP (Fixed).
2.26. Analysis.
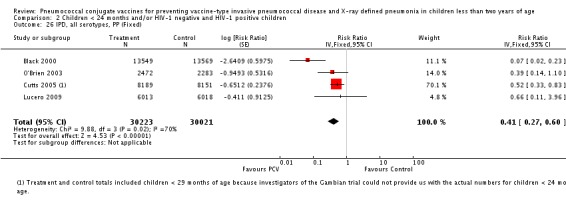
Comparison 2 Children < 24 months and/or HIV‐1 negative and HIV‐1 positive children, Outcome 26 IPD, all serotypes, PP (Fixed).
2.27. Analysis.

Comparison 2 Children < 24 months and/or HIV‐1 negative and HIV‐1 positive children, Outcome 27 IPD, non‐vaccine serotypes, PP (Fixed).
2.28. Analysis.

Comparison 2 Children < 24 months and/or HIV‐1 negative and HIV‐1 positive children, Outcome 28 IPD, vaccine‐related serotypes, PP (Fixed).
2.29. Analysis.
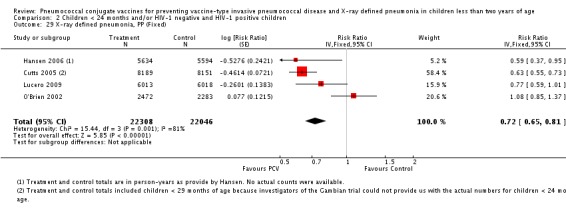
Comparison 2 Children < 24 months and/or HIV‐1 negative and HIV‐1 positive children, Outcome 29 X‐ray defined pneumonia, PP (Fixed).
2.30. Analysis.
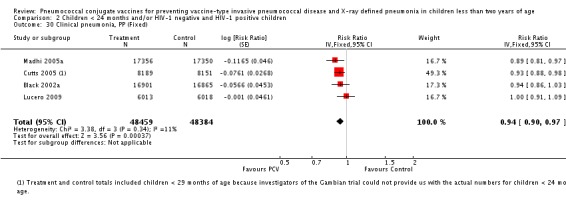
Comparison 2 Children < 24 months and/or HIV‐1 negative and HIV‐1 positive children, Outcome 30 Clinical pneumonia, PP (Fixed).
2.31. Analysis.

Comparison 2 Children < 24 months and/or HIV‐1 negative and HIV‐1 positive children, Outcome 31 All‐cause admissions, PP (Fixed).
2.32. Analysis.

Comparison 2 Children < 24 months and/or HIV‐1 negative and HIV‐1 positive children, Outcome 32 All‐cause mortality, PP (Fixed).
Comparison 3. Pooled with Cutts 2005 children < 29 months and/or HIV‐1 negative children.
| Outcome or subgroup title | No. of studies | No. of participants | Statistical method | Effect size |
|---|---|---|---|---|
| 1 IPD, vaccine serotypes, ITT (Random) | 7 | 113045 | Risk Ratio (Random, 95% CI) | 0.21 [0.10, 0.46] |
| 2 IPD, all serotypes, ITT (Random) | 7 | 113045 | Risk Ratio (Random, 95% CI) | 0.42 [0.25, 0.70] |
| 3 IPD, non‐vaccine serotypes, ITT (Random) | 7 | 113045 | Risk Ratio (Random, 95% CI) | 0.95 [0.59, 1.52] |
| 4 IPD, vaccine‐related serotypes, ITT (Random) | 5 | 110547 | Risk Ratio (Random, 95% CI) | 0.69 [0.33, 1.45] |
| 5 X‐ray defined pneumonia, ITT (Random) | 5 | 89457 | Risk Ratio (Random, 95% CI) | 0.81 [0.66, 0.99] |
| 6 Clinical pneumonia, ITT (Random) | 4 | 104755 | Risk Ratio (Random, 95% CI) | 0.95 [0.91, 0.98] |
| 7 All‐cause admissions, ITT (Random) | 2 | 29628 | Risk Ratio (Random, 95% CI) | 0.94 [0.80, 1.11] |
| 8 All‐cause mortality, ITT (Random) | 5 | 69385 | Risk Ratio (Random, 95% CI) | 0.87 [0.77, 0.98] |
| 9 IPD, vaccine serotypes, ITT (Fixed) | 7 | 113045 | Risk Ratio (Fixed, 95% CI) | 0.22 [0.14, 0.37] |
| 10 IPD, all serotypes, ITT (Fixed) | 7 | 113045 | Risk Ratio (Fixed, 95% CI) | 0.47 [0.35, 0.62] |
| 11 IPD, non‐vaccine serotypes, ITT (Fixed) | 7 | 113045 | Risk Ratio (Fixed, 95% CI) | 0.95 [0.59, 1.52] |
| 12 IPD, vaccine‐related serotypes, ITT (Fixed) | 5 | 110547 | Risk Ratio (Fixed, 95% CI) | 0.69 [0.33, 1.45] |
| 13 X‐ray defined pneumonia, ITT (Fixed) | 5 | 89457 | Risk Ratio (Fixed, 95% CI) | 0.76 [0.70, 0.84] |
| 14 Clinical pneumonia, ITT (Fixed) | 4 | 104755 | Risk Ratio (Fixed, 95% CI) | 0.95 [0.91, 0.98] |
| 15 All‐cause admissions, ITT (Fixed) | 2 | 29628 | Risk Ratio (Fixed, 95% CI) | 0.95 [0.90, 1.00] |
| 16 All‐cause mortality, ITT (Fixed) | 5 | 69385 | Risk Ratio (Fixed, 95% CI) | 0.87 [0.77, 0.98] |
| 17 IPD, vaccine serotypes, PP (Random) | 5 | 94950 | Risk Ratio (Random, 95% CI) | 0.22 [0.09, 0.53] |
| 18 IPD, all serotypes, PP (Random) | 4 | 60244 | Risk Ratio (Random, 95% CI) | 0.31 [0.13, 0.76] |
| 19 IPD, non‐vaccine serotypes, PP (Random) | 4 | 60244 | Risk Ratio (Random, 95% CI) | 1.20 [0.58, 2.50] |
| 20 IPD, vaccine‐related serotypes, PP (Random) | 3 | 33126 | Risk Ratio (Random, 95% CI) | 0.55 [0.20, 1.51] |
| 21 X‐ray defined pneumonia, PP (Random) | 5 | 79060 | Risk Ratio (Random, 95% CI) | 0.76 [0.61, 0.94] |
| 22 Clinical pneumonia, PP (Random) | 4 | 96843 | Risk Ratio (Random, 95% CI) | 0.94 [0.91, 0.98] |
| 23 All‐cause admissions, PP (Random) | 2 | 28371 | Risk Ratio (Random, 95% CI) | 0.93 [0.78, 1.09] |
| 24 All‐cause mortality, PP (Random) | 2 | 28371 | Risk Ratio (Random, 95% CI) | 0.84 [0.73, 0.97] |
| 25 IPD, vaccine serotypes, PP (Fixed) | 5 | 94950 | Risk Ratio (Fixed, 95% CI) | 0.22 [0.12, 0.41] |
| 26 IPD, all serotypes, PP (Fixed) | 4 | 60244 | Risk Ratio (Fixed, 95% CI) | 0.39 [0.27, 0.58] |
| 27 IPD, non‐vaccine serotypes, PP (Fixed) | 4 | 60244 | Risk Ratio (Fixed, 95% CI) | 1.20 [0.58, 2.50] |
| 28 IPD, vaccine‐related serotypes, PP (Fixed) | 3 | 33126 | Risk Ratio (Fixed, 95% CI) | 0.55 [0.20, 1.51] |
| 29 X‐ray defined pneumonia, PP (Fixed) | 5 | 79060 | Risk Ratio (Fixed, 95% CI) | 0.73 [0.66, 0.80] |
| 30 Clinical pneumonia, PP (Fixed) | 4 | 96843 | Risk Ratio (Fixed, 95% CI) | 0.94 [0.91, 0.98] |
| 31 All‐cause admissions, PP (Fixed) | 2 | 28371 | Risk Ratio (Fixed, 95% CI) | 0.93 [0.88, 0.99] |
| 32 All‐cause mortality, PP (Fixed) | 2 | 28371 | Risk Ratio (Fixed, 95% CI) | 0.84 [0.73, 0.97] |
3.1. Analysis.
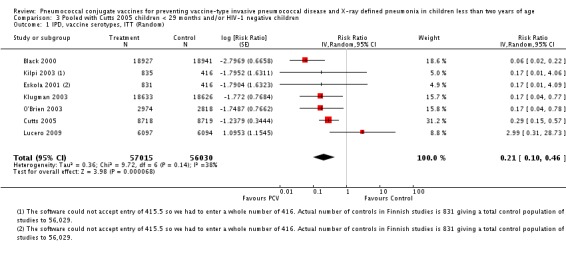
Comparison 3 Pooled with Cutts 2005 children < 29 months and/or HIV‐1 negative children, Outcome 1 IPD, vaccine serotypes, ITT (Random).
3.2. Analysis.
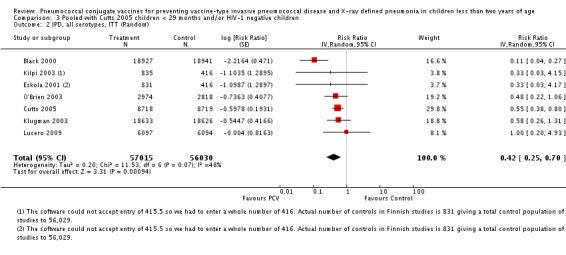
Comparison 3 Pooled with Cutts 2005 children < 29 months and/or HIV‐1 negative children, Outcome 2 IPD, all serotypes, ITT (Random).
3.3. Analysis.
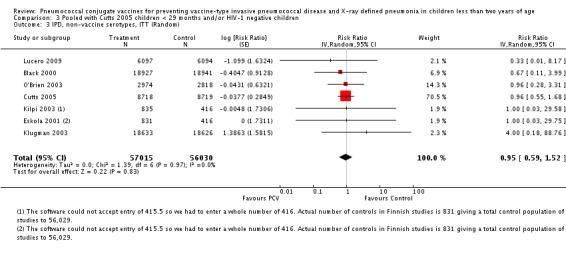
Comparison 3 Pooled with Cutts 2005 children < 29 months and/or HIV‐1 negative children, Outcome 3 IPD, non‐vaccine serotypes, ITT (Random).
3.4. Analysis.
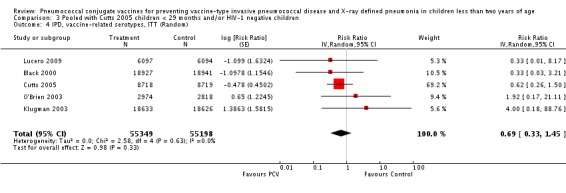
Comparison 3 Pooled with Cutts 2005 children < 29 months and/or HIV‐1 negative children, Outcome 4 IPD, vaccine‐related serotypes, ITT (Random).
3.5. Analysis.
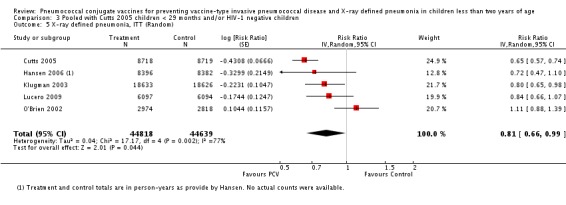
Comparison 3 Pooled with Cutts 2005 children < 29 months and/or HIV‐1 negative children, Outcome 5 X‐ray defined pneumonia, ITT (Random).
3.6. Analysis.

Comparison 3 Pooled with Cutts 2005 children < 29 months and/or HIV‐1 negative children, Outcome 6 Clinical pneumonia, ITT (Random).
3.7. Analysis.

Comparison 3 Pooled with Cutts 2005 children < 29 months and/or HIV‐1 negative children, Outcome 7 All‐cause admissions, ITT (Random).
3.8. Analysis.
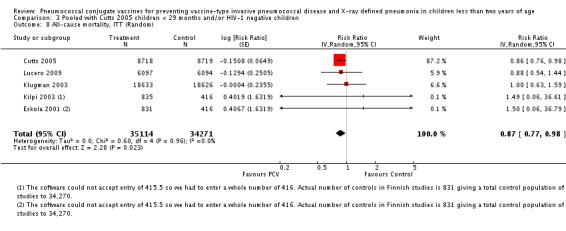
Comparison 3 Pooled with Cutts 2005 children < 29 months and/or HIV‐1 negative children, Outcome 8 All‐cause mortality, ITT (Random).
3.9. Analysis.
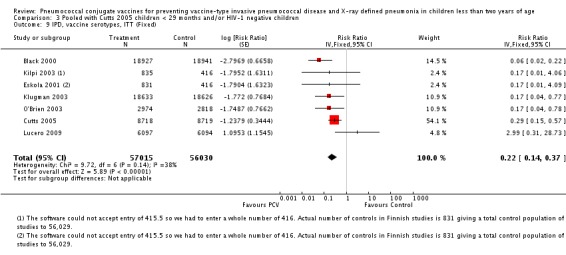
Comparison 3 Pooled with Cutts 2005 children < 29 months and/or HIV‐1 negative children, Outcome 9 IPD, vaccine serotypes, ITT (Fixed).
3.10. Analysis.
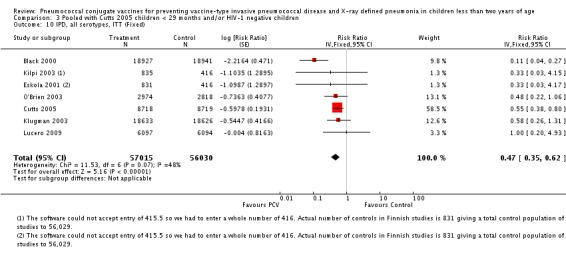
Comparison 3 Pooled with Cutts 2005 children < 29 months and/or HIV‐1 negative children, Outcome 10 IPD, all serotypes, ITT (Fixed).
3.11. Analysis.
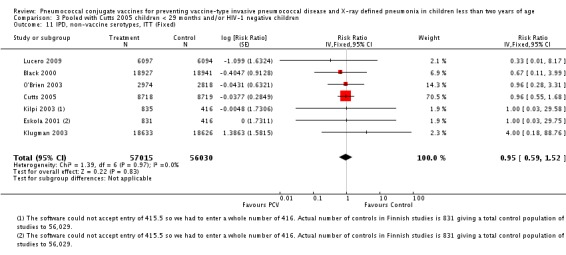
Comparison 3 Pooled with Cutts 2005 children < 29 months and/or HIV‐1 negative children, Outcome 11 IPD, non‐vaccine serotypes, ITT (Fixed).
3.12. Analysis.
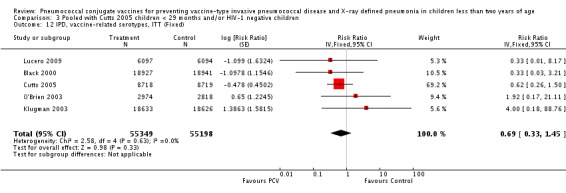
Comparison 3 Pooled with Cutts 2005 children < 29 months and/or HIV‐1 negative children, Outcome 12 IPD, vaccine‐related serotypes, ITT (Fixed).
3.13. Analysis.
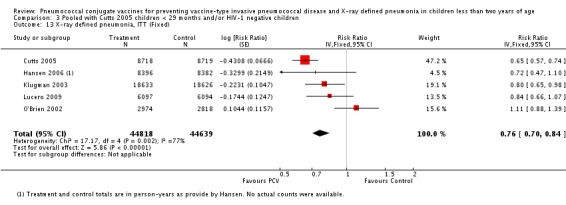
Comparison 3 Pooled with Cutts 2005 children < 29 months and/or HIV‐1 negative children, Outcome 13 X‐ray defined pneumonia, ITT (Fixed).
3.14. Analysis.

Comparison 3 Pooled with Cutts 2005 children < 29 months and/or HIV‐1 negative children, Outcome 14 Clinical pneumonia, ITT (Fixed).
3.15. Analysis.

Comparison 3 Pooled with Cutts 2005 children < 29 months and/or HIV‐1 negative children, Outcome 15 All‐cause admissions, ITT (Fixed).
3.16. Analysis.
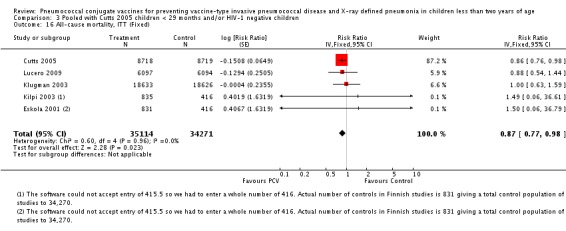
Comparison 3 Pooled with Cutts 2005 children < 29 months and/or HIV‐1 negative children, Outcome 16 All‐cause mortality, ITT (Fixed).
3.17. Analysis.
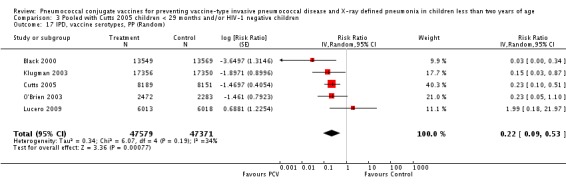
Comparison 3 Pooled with Cutts 2005 children < 29 months and/or HIV‐1 negative children, Outcome 17 IPD, vaccine serotypes, PP (Random).
3.18. Analysis.

Comparison 3 Pooled with Cutts 2005 children < 29 months and/or HIV‐1 negative children, Outcome 18 IPD, all serotypes, PP (Random).
3.19. Analysis.

Comparison 3 Pooled with Cutts 2005 children < 29 months and/or HIV‐1 negative children, Outcome 19 IPD, non‐vaccine serotypes, PP (Random).
3.20. Analysis.

Comparison 3 Pooled with Cutts 2005 children < 29 months and/or HIV‐1 negative children, Outcome 20 IPD, vaccine‐related serotypes, PP (Random).
3.21. Analysis.
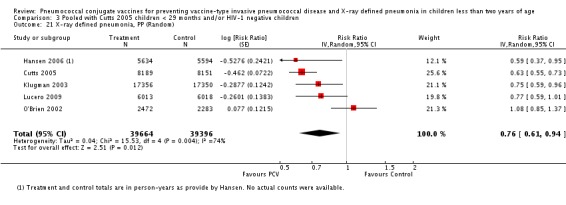
Comparison 3 Pooled with Cutts 2005 children < 29 months and/or HIV‐1 negative children, Outcome 21 X‐ray defined pneumonia, PP (Random).
3.22. Analysis.

Comparison 3 Pooled with Cutts 2005 children < 29 months and/or HIV‐1 negative children, Outcome 22 Clinical pneumonia, PP (Random).
3.23. Analysis.

Comparison 3 Pooled with Cutts 2005 children < 29 months and/or HIV‐1 negative children, Outcome 23 All‐cause admissions, PP (Random).
3.24. Analysis.

Comparison 3 Pooled with Cutts 2005 children < 29 months and/or HIV‐1 negative children, Outcome 24 All‐cause mortality, PP (Random).
3.25. Analysis.
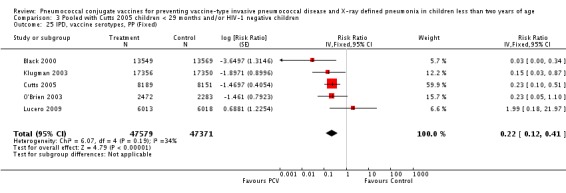
Comparison 3 Pooled with Cutts 2005 children < 29 months and/or HIV‐1 negative children, Outcome 25 IPD, vaccine serotypes, PP (Fixed).
3.26. Analysis.

Comparison 3 Pooled with Cutts 2005 children < 29 months and/or HIV‐1 negative children, Outcome 26 IPD, all serotypes, PP (Fixed).
3.27. Analysis.

Comparison 3 Pooled with Cutts 2005 children < 29 months and/or HIV‐1 negative children, Outcome 27 IPD, non‐vaccine serotypes, PP (Fixed).
3.28. Analysis.

Comparison 3 Pooled with Cutts 2005 children < 29 months and/or HIV‐1 negative children, Outcome 28 IPD, vaccine‐related serotypes, PP (Fixed).
3.29. Analysis.
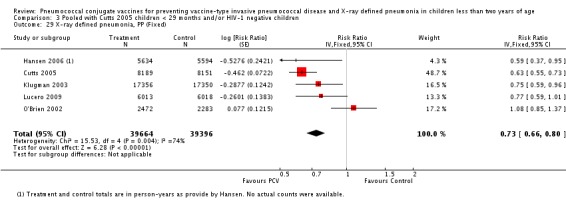
Comparison 3 Pooled with Cutts 2005 children < 29 months and/or HIV‐1 negative children, Outcome 29 X‐ray defined pneumonia, PP (Fixed).
3.30. Analysis.

Comparison 3 Pooled with Cutts 2005 children < 29 months and/or HIV‐1 negative children, Outcome 30 Clinical pneumonia, PP (Fixed).
3.31. Analysis.

Comparison 3 Pooled with Cutts 2005 children < 29 months and/or HIV‐1 negative children, Outcome 31 All‐cause admissions, PP (Fixed).
3.32. Analysis.

Comparison 3 Pooled with Cutts 2005 children < 29 months and/or HIV‐1 negative children, Outcome 32 All‐cause mortality, PP (Fixed).
Comparison 4. Pooled with Cutts 2005 children < 29 months and/or HIV‐1 negative and HIV‐1 positive children.
| Outcome or subgroup title | No. of studies | No. of participants | Statistical method | Effect size |
|---|---|---|---|---|
| 1 IPD, vaccine serotypes, ITT (Random) | 7 | 113045 | Risk Ratio (Random, 95% CI) | 0.24 [0.12, 0.45] |
| 2 IPD, all serotypes, ITT (Random) | 7 | 113045 | Risk Ratio (Random, 95% CI) | 0.42 [0.27, 0.65] |
| 3 IPD, non‐vaccine serotypes, ITT (Random) | 7 | 113045 | Risk Ratio (Random, 95% CI) | 1.00 [0.66, 1.53] |
| 4 IPD, vaccine‐related serotypes, ITT (Random) | 5 | 110547 | Risk Ratio (Random, 95% CI) | 0.61 [0.35, 1.07] |
| 5 X‐ray defined pneumonia, ITT (Random) | 5 | 89457 | Risk Ratio (Random, 95% CI) | 0.82 [0.67, 0.99] |
| 6 Clinical pneumonia, ITT (Random) | 4 | 104755 | Risk Ratio (Random, 95% CI) | 0.94 [0.91, 0.98] |
| 7 All‐cause admissions, ITT (Random) | 2 | 29628 | Risk Ratio (Random, 95% CI) | 0.94 [0.80, 1.11] |
| 8 All‐cause mortality, ITT (Random) | 5 | 69385 | Risk Ratio (Random, 95% CI) | 0.89 [0.80, 0.98] |
| 9 IPD, vaccine serotypes, ITT (Fixed) | 7 | 113045 | Risk Ratio (Fixed, 95% CI) | 0.25 [0.16, 0.38] |
| 10 IPD, all serotypes, ITT (Fixed) | 7 | 113045 | Risk Ratio (Fixed, 95% CI) | 0.47 [0.36, 0.60] |
| 11 IPD, non‐vaccine serotypes, ITT (Fixed) | 7 | 113045 | Risk Ratio (Fixed, 95% CI) | 1.00 [0.66, 1.53] |
| 12 IPD, vaccine‐related serotypes, ITT (Fixed) | 5 | 110547 | Risk Ratio (Fixed, 95% CI) | 0.61 [0.35, 1.07] |
| 13 X‐ray defined pneumonia, ITT (Fixed) | 5 | 89457 | Risk Ratio (Fixed, 95% CI) | 0.78 [0.72, 0.85] |
| 14 Clinical pneumonia, ITT (Fixed) | 4 | 104755 | Risk Ratio (Fixed, 95% CI) | 0.94 [0.91, 0.97] |
| 15 All‐cause admissions, ITT (Fixed) | 2 | 29628 | Risk Ratio (Fixed, 95% CI) | 0.95 [0.90, 1.00] |
| 16 All‐cause mortality, ITT (Fixed) | 5 | 69385 | Risk Ratio (Fixed, 95% CI) | 0.89 [0.80, 0.98] |
| 17 IPD, vaccine serotypes, PP (Random) | 4 | 60244 | Risk Ratio (Random, 95% CI) | 0.24 [0.08, 0.75] |
| 18 IPD, all serotypes, PP (Random) | 4 | 60244 | Risk Ratio (Random, 95% CI) | 0.31 [0.13, 0.76] |
| 19 IPD, non‐vaccine serotypes, PP (Random) | 4 | 60244 | Risk Ratio (Random, 95% CI) | 1.20 [0.58, 2.50] |
| 20 IPD, vaccine‐related serotypes, PP (Random) | 3 | 33126 | Risk Ratio (Random, 95% CI) | 0.55 [0.20, 1.51] |
| 21 X‐ray defined pneumonia, PP (Random) | 3 | 39599 | Risk Ratio (Random, 95% CI) | 0.65 [0.58, 0.74] |
| 22 Clinical pneumonia, PP (Random) | 4 | 96843 | Risk Ratio (Random, 95% CI) | 0.94 [0.90, 0.98] |
| 23 All‐cause admissions, PP (Random) | 2 | 28371 | Risk Ratio (Random, 95% CI) | 0.93 [0.78, 1.09] |
| 24 All‐cause mortality, PP (Random) | 2 | 28371 | Risk Ratio (Random, 95% CI) | 0.84 [0.73, 0.97] |
| 25 IPD, vaccine serotypes, PP (Fixed) | 4 | 60244 | Risk Ratio (Fixed, 95% CI) | 0.23 [0.12, 0.45] |
| 26 IPD, all serotypes, PP (Fixed) | 4 | 60244 | Risk Ratio (Fixed, 95% CI) | 0.39 [0.27, 0.58] |
| 27 IPD, non‐vaccine serotypes, PP (Fixed) | 4 | 60244 | Risk Ratio (Fixed, 95% CI) | 1.20 [0.58, 2.50] |
| 28 IPD, vaccine‐related serotypes, PP (Fixed) | 3 | 33126 | Risk Ratio (Fixed, 95% CI) | 0.55 [0.20, 1.51] |
| 29 X‐ray defined pneumonia, PP (Fixed) | 3 | 39599 | Risk Ratio (Fixed, 95% CI) | 0.65 [0.58, 0.74] |
| 30 Clinical pneumonia, PP (Fixed) | 4 | 96843 | Risk Ratio (Fixed, 95% CI) | 0.94 [0.90, 0.97] |
| 31 All‐cause admissions, PP (Fixed) | 2 | 28371 | Risk Ratio (Fixed, 95% CI) | 0.93 [0.88, 0.99] |
| 32 All‐cause mortality, PP (Fixed) | 2 | 28371 | Risk Ratio (Fixed, 95% CI) | 0.84 [0.73, 0.97] |
4.1. Analysis.
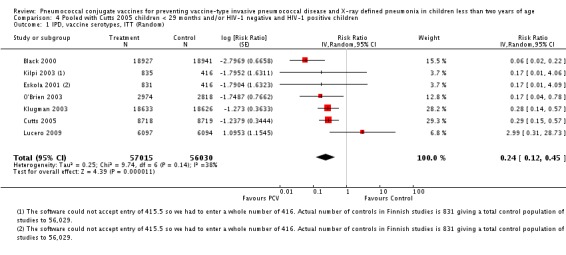
Comparison 4 Pooled with Cutts 2005 children < 29 months and/or HIV‐1 negative and HIV‐1 positive children, Outcome 1 IPD, vaccine serotypes, ITT (Random).
4.2. Analysis.
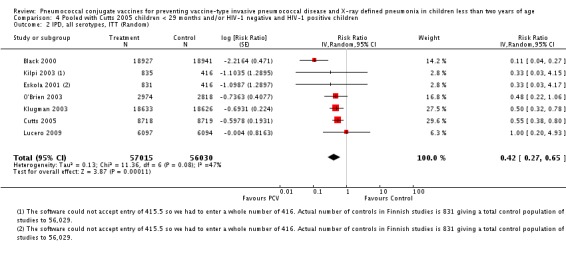
Comparison 4 Pooled with Cutts 2005 children < 29 months and/or HIV‐1 negative and HIV‐1 positive children, Outcome 2 IPD, all serotypes, ITT (Random).
4.3. Analysis.
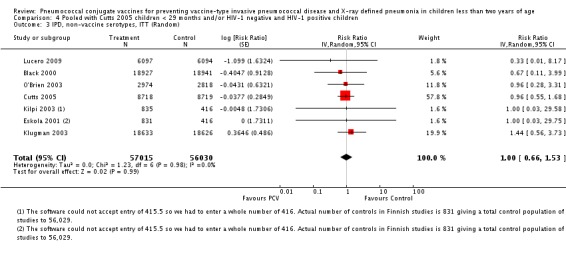
Comparison 4 Pooled with Cutts 2005 children < 29 months and/or HIV‐1 negative and HIV‐1 positive children, Outcome 3 IPD, non‐vaccine serotypes, ITT (Random).
4.4. Analysis.
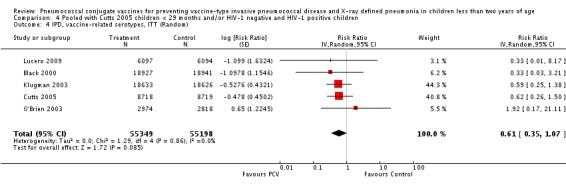
Comparison 4 Pooled with Cutts 2005 children < 29 months and/or HIV‐1 negative and HIV‐1 positive children, Outcome 4 IPD, vaccine‐related serotypes, ITT (Random).
4.5. Analysis.
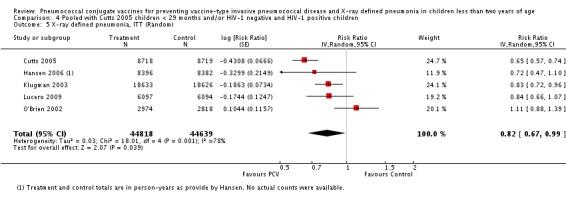
Comparison 4 Pooled with Cutts 2005 children < 29 months and/or HIV‐1 negative and HIV‐1 positive children, Outcome 5 X‐ray defined pneumonia, ITT (Random).
4.6. Analysis.

Comparison 4 Pooled with Cutts 2005 children < 29 months and/or HIV‐1 negative and HIV‐1 positive children, Outcome 6 Clinical pneumonia, ITT (Random).
4.7. Analysis.

Comparison 4 Pooled with Cutts 2005 children < 29 months and/or HIV‐1 negative and HIV‐1 positive children, Outcome 7 All‐cause admissions, ITT (Random).
4.8. Analysis.
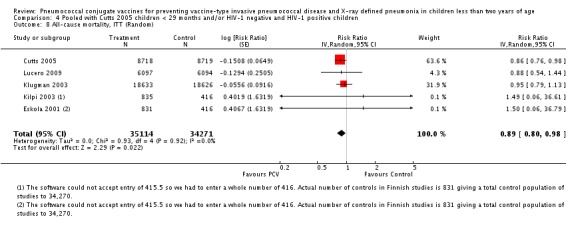
Comparison 4 Pooled with Cutts 2005 children < 29 months and/or HIV‐1 negative and HIV‐1 positive children, Outcome 8 All‐cause mortality, ITT (Random).
4.9. Analysis.
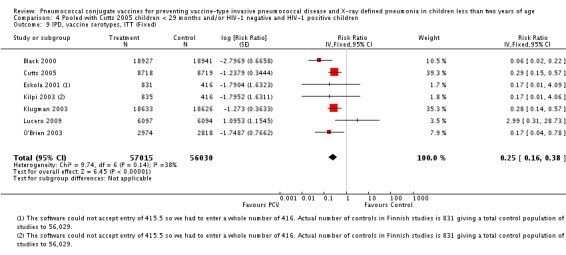
Comparison 4 Pooled with Cutts 2005 children < 29 months and/or HIV‐1 negative and HIV‐1 positive children, Outcome 9 IPD, vaccine serotypes, ITT (Fixed).
4.10. Analysis.
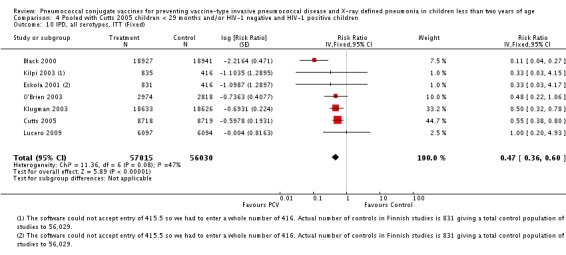
Comparison 4 Pooled with Cutts 2005 children < 29 months and/or HIV‐1 negative and HIV‐1 positive children, Outcome 10 IPD, all serotypes, ITT (Fixed).
4.11. Analysis.
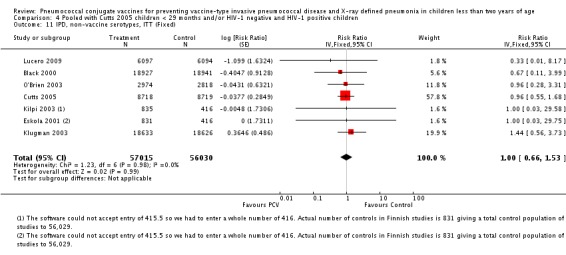
Comparison 4 Pooled with Cutts 2005 children < 29 months and/or HIV‐1 negative and HIV‐1 positive children, Outcome 11 IPD, non‐vaccine serotypes, ITT (Fixed).
4.12. Analysis.
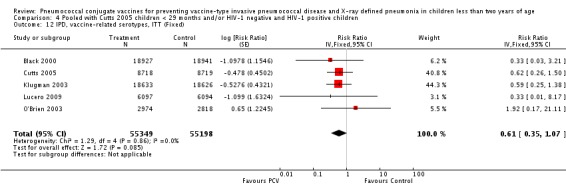
Comparison 4 Pooled with Cutts 2005 children < 29 months and/or HIV‐1 negative and HIV‐1 positive children, Outcome 12 IPD, vaccine‐related serotypes, ITT (Fixed).
4.13. Analysis.
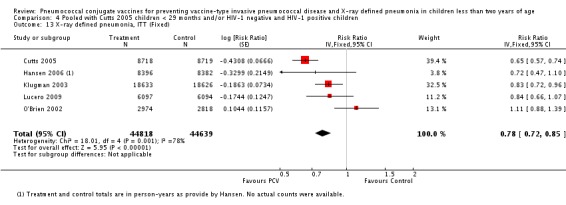
Comparison 4 Pooled with Cutts 2005 children < 29 months and/or HIV‐1 negative and HIV‐1 positive children, Outcome 13 X‐ray defined pneumonia, ITT (Fixed).
4.14. Analysis.

Comparison 4 Pooled with Cutts 2005 children < 29 months and/or HIV‐1 negative and HIV‐1 positive children, Outcome 14 Clinical pneumonia, ITT (Fixed).
4.15. Analysis.

Comparison 4 Pooled with Cutts 2005 children < 29 months and/or HIV‐1 negative and HIV‐1 positive children, Outcome 15 All‐cause admissions, ITT (Fixed).
4.16. Analysis.
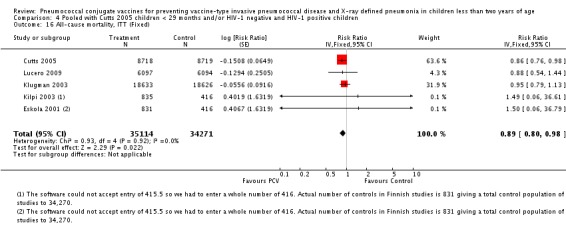
Comparison 4 Pooled with Cutts 2005 children < 29 months and/or HIV‐1 negative and HIV‐1 positive children, Outcome 16 All‐cause mortality, ITT (Fixed).
4.17. Analysis.

Comparison 4 Pooled with Cutts 2005 children < 29 months and/or HIV‐1 negative and HIV‐1 positive children, Outcome 17 IPD, vaccine serotypes, PP (Random).
4.18. Analysis.

Comparison 4 Pooled with Cutts 2005 children < 29 months and/or HIV‐1 negative and HIV‐1 positive children, Outcome 18 IPD, all serotypes, PP (Random).
4.19. Analysis.

Comparison 4 Pooled with Cutts 2005 children < 29 months and/or HIV‐1 negative and HIV‐1 positive children, Outcome 19 IPD, non‐vaccine serotypes, PP (Random).
4.20. Analysis.

Comparison 4 Pooled with Cutts 2005 children < 29 months and/or HIV‐1 negative and HIV‐1 positive children, Outcome 20 IPD, vaccine‐related serotypes, PP (Random).
4.21. Analysis.

Comparison 4 Pooled with Cutts 2005 children < 29 months and/or HIV‐1 negative and HIV‐1 positive children, Outcome 21 X‐ray defined pneumonia, PP (Random).
4.22. Analysis.

Comparison 4 Pooled with Cutts 2005 children < 29 months and/or HIV‐1 negative and HIV‐1 positive children, Outcome 22 Clinical pneumonia, PP (Random).
4.23. Analysis.

Comparison 4 Pooled with Cutts 2005 children < 29 months and/or HIV‐1 negative and HIV‐1 positive children, Outcome 23 All‐cause admissions, PP (Random).
4.24. Analysis.

Comparison 4 Pooled with Cutts 2005 children < 29 months and/or HIV‐1 negative and HIV‐1 positive children, Outcome 24 All‐cause mortality, PP (Random).
4.25. Analysis.

Comparison 4 Pooled with Cutts 2005 children < 29 months and/or HIV‐1 negative and HIV‐1 positive children, Outcome 25 IPD, vaccine serotypes, PP (Fixed).
4.26. Analysis.

Comparison 4 Pooled with Cutts 2005 children < 29 months and/or HIV‐1 negative and HIV‐1 positive children, Outcome 26 IPD, all serotypes, PP (Fixed).
4.27. Analysis.

Comparison 4 Pooled with Cutts 2005 children < 29 months and/or HIV‐1 negative and HIV‐1 positive children, Outcome 27 IPD, non‐vaccine serotypes, PP (Fixed).
4.28. Analysis.

Comparison 4 Pooled with Cutts 2005 children < 29 months and/or HIV‐1 negative and HIV‐1 positive children, Outcome 28 IPD, vaccine‐related serotypes, PP (Fixed).
4.29. Analysis.

Comparison 4 Pooled with Cutts 2005 children < 29 months and/or HIV‐1 negative and HIV‐1 positive children, Outcome 29 X‐ray defined pneumonia, PP (Fixed).
4.30. Analysis.

Comparison 4 Pooled with Cutts 2005 children < 29 months and/or HIV‐1 negative and HIV‐1 positive children, Outcome 30 Clinical pneumonia, PP (Fixed).
4.31. Analysis.

Comparison 4 Pooled with Cutts 2005 children < 29 months and/or HIV‐1 negative and HIV‐1 positive children, Outcome 31 All‐cause admissions, PP (Fixed).
4.32. Analysis.

Comparison 4 Pooled with Cutts 2005 children < 29 months and/or HIV‐1 negative and HIV‐1 positive children, Outcome 32 All‐cause mortality, PP (Fixed).
Characteristics of studies
Characteristics of included studies [ordered by study ID]
Black 2000.
| Methods |
Design: Randomised controlled, double‐blind Duration of the study: October 1995 ‐ April 1999 |
|
| Participants |
Setting: 23 medical centres within Northern California Kaiser Permanente (NCKP) Participants: 37,868 healthy infants were randomised 1:1 to receive either the heptavalent pneumococcal (7PCV) conjugate or the meningococcus type C CRM197 conjugate (MnCC) vaccine at 2, 4, 6 and 12 to 15 months of age; 18,927 children were allocated to the 7PCV while 18,941 to MnCC. Country: Northern California, USA |
|
| Interventions |
Treatment: 7‐valent pneumococcal conjugate vaccine containing 2 μg each of saccharides of serotypes 4, 9V, 14, 18C, 19F and 23F and 4 μg of 6B coupled to the protein carrier CRM197 (a noncatalytic cross‐reacting mutant of diphtheria toxin) Control: Meningococcus type C CRM197 conjugate vaccine |
|
| Outcomes | Pneumococcal invasive disease, acute otitis media (AOM), safety, immunogenicity | |
| Funding | Wyeth Lederle vaccines and Pediatrics | |
| Conflict of Interest | This is an industry‐initiated study (Wyeth) Black 2000 | |
| Notes | A preliminary report of this study was published earlier and is listed in the 'Additional References' section as Black 1999 | |
| Risk of bias | ||
| Bias | Authors' judgement | Support for judgement |
| Adequate sequence generation? | Low risk |
Quote: “Healthy infants were randomised 1:1 to receive either the heptavalent pneumococcal conjugate vaccine . . . ” (Black 2000, page 188, paragraph 5, left column). “The two vaccines were identical in appearance. Multiple lots of both the pneumococcal and meningococcal conjugate vaccines were used in this study” (Black 2000, page 188, paragraph 6, left column). A statistician (a staff member at Northern California Kaiser Permanente's division of research) generated a randomisation list that contained sequential subject identification numbers and a group A, B, C or D. Two of these groups were pneumococcal vaccine and two were meningococcal vaccine ‐ which codes were which was only known to the statistician who prepared the randomisation and the individuals at the manufacturer who were responsible for the labelling of the product. (Hansen 2008b) Comment: Done |
| Allocation concealment? | Low risk |
Quote: “The two vaccines were identical in appearance” (Black 2000, page 188, paragraph 6, left column). Patients were randomised in blocks of ten using enrolment sheets which had random allocations in blocks of ten. The sheets were rub‐off sheets so that the next allocation could not be seen until the patient consented and then the next spot on the allocation sheet was rubbed off to reveal their assignment. (Black 2008) A statistician (a staff member at Northern California Kaiser Permanente's division of research) generated a randomisation list that contained sequential subject identification numbers and a group A, B, C or D. Two of these groups were pneumococcal vaccine and two were meningococcal vaccine ‐ which codes were which was only known to the statistician who prepared the randomisation and the individuals at the manufacturer who were responsible for the labelling of the product. Once a child was enrolled and consented the study nurse at the site would take the next subject identification number on the list, assign it to the patient, and would then remove a label that obscured the treatment assignment. The assignment was kept in a casebook at the site so that further dosing could be done properly (i.e. if they were assigned a B at randomisation they would continue to get B for doses 2‐4). The assignment was not known to other study staff, paediatricians, investigator, parents, etc. After the study was over, subject assignments were unblinded (although a study advisory committee had the authority to unblind an individual subject or the entire study at any time if safety issues warranted it). (Hansen 2008b) Comment: Done |
| Blinding? All outcomes | Low risk |
Quote: “This study was a . . . double‐blind trial. . .” (Black 2000, page 188, paragraph 4, left column). “blinded follow‐up and per protocol vaccination of the two groups were continued until April 20, 1999” (Black 2000, page 190, paragraph 4, left column). The investigator and the study personnel were blinded in that they did not know which letter codes A, B, C, or D went with placebo and which colours went with pneumococcal conjugate vaccine (Black 2008) Comment: Done. Mention of blinded follow‐up until the end of the trial also implies blinding of outcome assessors |
| Incomplete outcome data addressed? All outcomes | Low risk |
Quote: “. . .an intent‐to‐treat analysis included all invasive disease caused by any pneumococcal serotype occurring after randomisation regardless of whether the child completed the three‐dose primary series . . . ” (Black 2000, page 189, paragraph 2, left column) Patients were excluded from follow up only if they left the health plan or died. (Black 2008) Comment: Done |
| Free of selective reporting? | Low risk | All the pre‐specified outcomes that are of interest in the review were reported in the pre‐specified way. (Black 2008) |
| Free of other bias? | High risk | Trial stopped early “because of the high level of efficacy demonstrated at an interim evaluation” (Black 2000, page 190, paragraph 4, left column) |
Black 2002a.
| Methods |
Design: Randomised controlled, double‐blind Duration of the study: October 1995 ‐ April 1999 |
|
| Participants |
Setting: 23 medical centres within Northern California Kaiser Permanente (NCKP) Participants: 37,868 healthy infants were randomised 1:1 to receive either the heptavalent pneumococcal (7PCV) conjugate or the meningococcus type C CRM197 (MnCC) conjugate vaccine at 2, 4, 6 and 12 to 15 months of age; 18,927 children were allocated to the 7PCV while 18,941 to MnCC. Country: Northern California, USA |
|
| Interventions |
Treatment: 7‐valent pneumococcal conjugate vaccine containing 2 μg each of saccharides of serotypes 4, 9V, 14, 18C, 19F and 23F and 4 μg of 6B coupled to the protein carrier CRM197 (a nontoxic mutant of diphtheria toxin) Control: Meningococcus Type C CRM197 conjugate vaccine |
|
| Outcomes | Clinical pneumonia, radiograph‐confirmed pneumonia | |
| Funding | Wyeth Lederle vaccines and Pediatrics | |
| Conflict of Interest | This is an industry‐initiated study (Wyeth) Black 2000 | |
| Notes | This study was presented earlier at the May 2002 ISPPD in Anchorage, Alaska, and the abstract is listed in the 'Additional References' section as Black 2002b, and later in November at the WSPID 2002, the abstract of which, is listed in the 'Additional References' section as Black 2002c | |
| Risk of bias | ||
| Bias | Authors' judgement | Support for judgement |
| Adequate sequence generation? | Low risk |
Quote: “Healthy infants were randomised 1:1 to receive either the heptavalent pneumococcal conjugate vaccine . . . ” (Black 2000, page 188, paragraph 5, left column). “The two vaccines were identical in appearance. Multiple lots of both the pneumococcal and meningococcal conjugate vaccines were used in this study” (Black 2000, page 188, paragraph 6, left column). A statistician (a staff member at Northern California Kaiser Permanente's division of research) generated a randomisation list that contained sequential subject identification numbers and a group A, B, C or D. Two of these groups were pneumococcal vaccine and two were meningococcal vaccine ‐ which codes were which was only known to the statistician who prepared the randomisation and the individuals at the manufacturer who were responsible for the labelling of the product. (Hansen 2008b) Comment: Done |
| Allocation concealment? | Low risk |
Quote: “The two vaccines were identical in appearance” (Black 2000, page 188, paragraph 6, left column). Patients were randomised in blocks of ten using enrolment sheets which had random allocations in blocks of ten. The sheets were rub‐off sheets so that the next allocation could not be seen until the patient consented and then the next spot on the allocation sheet was rubbed off to reveal their assignment. (Black 2008) A statistician (a staff member at Northern California Kaiser Permanente's division of research) generated a randomisation list that contained sequential subject identification numbers and a group A, B, C or D. Two of these groups were pneumococcal vaccine and two were meningococcal vaccine ‐ which codes were which was only known to the statistician who prepared the randomisation and the individuals at the manufacturer who were responsible for the labelling of the product. Once a child was enrolled and consented the study nurse at the site would take the next subject identification number on the list, assign it to the patient, and would then remove a label that obscured the treatment assignment. The assignment was kept in a casebook at the site so that further dosing could be done properly (i.e. if they were assigned a B at randomisation they would continue to get B for doses 2‐4). The assignment was not known to other study staff, paediatricians, investigator, parents, etc. After the study was over, subject assignments were unblinded (although a study advisory committee had the authority to unblind an individual subject or the entire study at any time if safety issues warranted it). (Hansen 2008b) Comment: Done |
| Blinding? All outcomes | Low risk |
Quote: “This study was a . . . double‐blind trial. . . ” (Black 2000, page 188, paragraph 4, left column). “. . . blinded follow‐up and per protocol vaccination of the two groups were continued until April 20, 1999” (Black 2000, page 190, paragraph 4, left column). The investigator and the study personnel were blinded in that they did not know which letter codes A, B, C, or D went with placebo and which colours went with pneumococcal conjugate vaccine (Black 2008) Comment: Done. Mention of blinded follow‐up until the end of the trial also implies blinding of outcome assessors. |
| Incomplete outcome data addressed? All outcomes | Low risk |
Quote: “. . .an intent‐to‐treat analysis included all invasive disease caused by any pneumococcal serotype occurring after randomisation regardless of whether the child completed the three‐dose primary series . . . ” (Black 2000, page 189, paragraph 2, left column) Patients were excluded from follow up only if they left the health plan or died. (Black 2008) Comment: Done |
| Free of selective reporting? | Low risk | All the pre‐specified outcomes that are of interest in the review were reported in the pre‐specified way. (Black 2008) |
| Free of other bias? | High risk | Trial stopped early “because of the high level of efficacy demonstrated at an interim evaluation” (Black 2000, page 190, paragraph 4, left column) |
Cutts 2005.
| Methods |
Design: Randomised, placebo‐controlled, double‐blind Duration of the study: August 2000 ‐ April 2004 |
|
| Participants |
Setting: Mother‐child‐health clinics at 15 fixed facilities including Bansang Hospital in Central River Division and Basses health centre in Upper River Division and at about 110 outreach sites Participants: 17, 437 children age 6‐51 weeks randomly allocated three doses of either pneumococcal conjugate vaccine or placebo, with intervals of at least 25 days between doses; 8718 were allocated to 9PCV while 8719 to placebo. Country: The Gambia |
|
| Interventions |
Treatment: 9‐valent pneumococcal conjugate vaccine containing 2 μg of type 1, 4, 5, 9V, 14, 19F, and 23F polysaccharides, 4 μg of type 6B polysaccharide, and 2 μg of type 18C oligosaccharide linked to the diphtheria toxoid protein CRM197 Control: placebo Mode of administration: Intramuscular injection into the child's right thigh |
|
| Outcomes | Radiological pneumonia, clinical pneumonia, invasive pneumococcal disease, all‐cause admissions, all‐cause mortality | |
| Funding | National Institute of Allergy and Infectious Diseases at the USA National Institutes of Health; WHO; Children’s Vaccine Program at Program for Appropriate Technology in Health (PATH); US Agency for International Development (USAID); Wyeth Vaccines for donating the study vaccines and Prevenar for placebo recipients | |
| Conflict of Interest | S K Obaro has received honoraria from Wyeth Vaccines for consultancies in the past three years. Since her involvement in the trial, A Leach has become an employee of Glaxo‐SmithKline Biologicals, who are developing a pneumococcal conjugate vaccine, and own shares in Glaxo SmithKline Cutts 2005. | |
| Notes | ||
| Risk of bias | ||
| Bias | Authors' judgement | Support for judgement |
| Adequate sequence generation? | Low risk |
Quote: An independent statistician randomly assigned vial codes 0‐9 to vaccine or placebo in a 1/1 ratio and study numbers to codes 0‐9, using a blocked design with block sizes of 10, with a Proc Plan procedure in SAS (Cutts 2005, page 1140, paragraph 3, left column) Comment: Done |
| Allocation concealment? | Low risk |
Quote: Independent contractors labelled vaccine and placebo vials, prepared study stickers detailing the unique study identity number with window stickers showing vial code and dose number (1, 2, 3), and sealed these in opaque envelopes. Only the DSMB and the safety monitor had access to the code before data were locked; After a child was enrolled, staff opened the next envelope, attached the study sticker to the health card, and at every vaccination peeled off the window sticker to put it on the case report form. After the third dose of vaccine or placebo, no record was present of the randomisation assignment on the health card (Cutts 2005, page 1140, paragraph 3 and 4, left column). Comment: Done |
| Blinding? All outcomes | Low risk |
Quote: “We undertook a randomised, double‐blind, placebo‐controlled trial (Cutts 2005, page 1139, paragraph 2, left column). “Pneumococcal vaccine and placebo lyophilised powders were identical in appearance (Cutts 2005, page 1140, paragraph 4, left column) “. . .and data were audited before locking and unmasking” (Cutts 2005, page 1141, paragraph 3, right column). Comment: No explicit mention of who was blinded, but most probably done |
| Incomplete outcome data addressed? All outcomes | Low risk |
Quote: We did per protocol and intention‐to‐treat analyses (Cutts 2005, page 1141, paragraph 6, left column). Comment: Probably done. The trial profile gave the number of subjects excluded and the reasons why they were excluded. The 917 deaths and 115 withdrawals “were not shown as losses to follow‐up because they contributed person‐time to the estimation of rates of every endpoint.” (Cutts 2005, page 1141, right column) |
| Free of selective reporting? | Low risk |
Quote: The pre‐specified primary outcome was originally all‐cause child mortality, but because of practical constraints on the sample size, we changed it to radiologically‐confirmed pneumonia in February 2002 (Cutts 2005, page 1141, paragraph 3, right column) although this was still reported as part of the tertiary endpoints. Comment: The change in the level of the original pre‐specified outcome (from primary to tertiary) does not introduce bias in that this was still reported adequately in the published paper. All other pre‐specified outcomes of interest as stated in the protocol were reported (ISRCTN46147225). |
| Free of other bias? | Low risk | No other topic‐specific, design specific, or other potential threats to validity were noted |
Eskola 2001.
| Methods |
Design: a three‐arm, randomised, double‐blind Duration of the study: December 1995 ‐ March 1999 |
|
| Participants |
Setting: Eight study clinics, each with a specially trained study nurse and a study physician, established in the communities of Tampere, Kangasala, and Nokia, Finland Participants: 2,497 children receiving either the 7PCV‐CRM197, 7PCV‐OMP, or hepatitis B vaccine as a control at 2, 4, 6, and 12 months of age; 831 were allocated to 7PCV‐CRM197, 835 to 7PCV‐OMP, while 831 to Hep B vaccine as control. Country: Finland |
|
| Interventions |
Treatment: 7‐valent containing 2 μg each of capsular polysaccharides of pneumococcal serotypes 4, 9V, 14, 19F, and 23F, 4 μg of serotype 6B polysaccharide, and 2 μg of serotype 18C oligosaccharide, each conjugated individually to the CRM197 protein Control: Hepatitis B vaccine containing 5 μg of recombinant hepatitis B surface protein Mode of administration: Intramuscular Frequency: Age of approximately 2 months (6 to 13 weeks), 4 months (14 to 21 weeks), 6 months (22 to 29 weeks), and 12 months (11 to 14 months). An interval of 6 to 11 weeks was required between the first and second vaccinations and between the second and third vaccinations |
|
| Outcomes | Acute otitis media (AOM) and pneumococcal invasive disease | |
| Funding | Merck, Pasteur Merrieux‐Connaught, and Wyeth Lederle Vaccines and Pediatrics | |
| Conflict of Interest | Dr Eskola has served as Consultant to Wyeth Lederle Vaccines (Eskola 2001) | |
| Notes | ||
| Risk of bias | ||
| Bias | Authors' judgement | Support for judgement |
| Adequate sequence generation? | Low risk |
Quote: Six letters corresponding to the three treatment options were randomly allocated to consecutive subject identification numbers using an allocation ratio of 1:1:1 and a block size of 12 (Kilpi 2003, page 1157, paragraph 2, right col) Comment: Done. Used a computer random number generator |
| Allocation concealment? | Low risk |
Quote: Randomisation envelopes containing four smaller envelopes (for each vaccination) with a letter A to F (two letters for S. pneumoniae CRM, S. pneumoniae OMPC, and the control) were assigned to each child at enrolment. The envelopes were prepared by an external consultant. The envelopes were distributed to the study clinics and assigned in a given order within the original blocks of 12. The vaccinator (not involved in any other study activities) checked one small envelope before each vaccination from the envelope assigned to each specific child, took the vaccine from the corresponding box, destroyed the letter code, and vaccinated the child. The vaccine was drawn into the syringe out of sight of anyone else (Palmu 2003a) Comment: Probably done |
| Blinding? All outcomes | Low risk |
Quote: the patients, care providers, and outcome assessors were all blinded (Palmu 2003b) Blinding was ensured by destruction of the letter code and by use of vaccinators who were not otherwise involved in the trial follow‐up (Kilpi 2003, page 1158, paragraph 1, left column) |
| Incomplete outcome data addressed? All outcomes | High risk | 45/831 missing in the S. pneumoniae CRM group, and 37/831 missing in the Hep B control group (Kilpi 2003, page 1157, Figure 1). These exclusions, including the reasons they were excluded were not addressed in the discussion |
| Free of selective reporting? | Low risk | All the pre‐specified outcomes that are of interest in the review were reported in the pre‐specified way |
| Free of other bias? | Low risk | No other potential sources of bias noted |
Hansen 2006.
| Methods |
Design: Randomised controlled, double‐blind Duration of the study: October 1995 ‐ April 1999 |
|
| Participants |
Setting: 23 medical centres within Northern California Kaiser Permanente (NCKP) Participants: 37,868 healthy infants were randomised 1:1 to receive either the heptavalent pneumococcal (7PCV) conjugate or the meningococcus type C CRM197 (MnCC) conjugate vaccine at 2, 4, 6 and 12 to 15 months of age; 18,927 children were allocated to the 7PCV while 18,941 to MnCC. Country: Northern California, USA |
|
| Interventions |
Treatment: 7‐valent pneumococcal conjugate vaccine containing 2 μg each of saccharides of serotypes 4, 9V, 14, 18C, 19F and 23F and 4 μg of 6B coupled to the protein carrier CRM197 (a nontoxic mutant of diphtheria toxin) Control: Meningococcus Type C CRM197 conjugate vaccine |
|
| Outcomes | Radiograph‐confirmed pneumonia | |
| Funding | Wyeth Lederle vaccines and Pediatrics | |
| Conflict of Interest | This is an industry‐initiated study (Wyeth) (Hansen 2006) | |
| Notes | An earlier report (Black 2002a) of this study was published earlier but did not use the WHO standardised criteria for reading chest radiographs | |
| Risk of bias | ||
| Bias | Authors' judgement | Support for judgement |
| Adequate sequence generation? | Low risk |
Quote: “Healthy infants were randomised 1:1 to receive either the heptavalent pneumococcal conjugate vaccine . . . ” (Black 2000, page 188, paragraph 5, left column). “The two vaccines were identical in appearance. Multiple lots of both the pneumococcal and meningococcal conjugate vaccines were used in this study” (Black 2000, page 188, paragraph 6, left column). A statistician (a staff member at Northern California Kaiser Permanente's division of research) generated a randomisation list that contained sequential subject identification numbers and a group A, B, C or D. Two of these groups were pneumococcal vaccine and two were meningococcal vaccine ‐ which codes were which was only known to the statistician who prepared the randomisation and the individuals at the manufacturer who were responsible for the labelling of the product. (Hansen 2008b) Comment: Done |
| Allocation concealment? | Low risk |
Quote: “The two vaccines were identical in appearance” (Black 2000, page 188, paragraph 6, left column). Patients were randomised in blocks of ten using enrolment sheets which had random allocations in blocks of ten. The sheets were rub‐off sheets so that the next allocation could not be seen until the patient consented and then the next spot on the allocation sheet was rubbed off to reveal their assignment. (Black 2008) A statistician (a staff member at Northern California Kaiser Permanente's division of research) generated a randomisation list that contained sequential subject identification numbers and a group A, B, C or D. Two of these groups were pneumococcal vaccine and two were meningococcal vaccine ‐ which codes were which was only known to the statistician who prepared the randomisation and the individuals at the manufacturer who were responsible for the labelling of the product. Once a child was enrolled and consented the study nurse at the site would take the next subject identification number on the list, assign it to the patient, and would then remove a label that obscured the treatment assignment. The assignment was kept in a casebook at the site so that further dosing could be done properly (i.e. if they were assigned a B at randomisation they would continue to get B for doses 2‐4). The assignment was not known to other study staff, paediatricians, investigator, parents, etc. After the study was over, subject assignments were unblinded (although a study advisory committee had the authority to unblind an individual subject or the entire study at any time if safety issues warranted it). (Hansen 2008b) Comment: Done |
| Blinding? All outcomes | Low risk |
Quote: “This study was a . . . double‐blind trial. . . ”(Hansen 2006, page 188, paragraph 4, left column) “. . . blinded follow‐up and per protocol vaccination of the two groups were continued until April 20, 1999” (Black 2000, page 190, paragraph 4, left column) The investigator and the study personnel were blinded in that they did not know which letter codes A, B, C, or D went with placebo and which colours went with pneumococcal conjugate vaccine (Black 2008) Comment: Done. Mention of blinded follow‐up until the end of the trial also implies blinding of outcome assessors |
| Incomplete outcome data addressed? All outcomes | Low risk |
Quote: “. . .an intent‐to‐treat analysis included all invasive disease caused by any pneumococcal serotype occurring after randomisation regardless of whether the child completed the three‐dose primary series . . . ” (Hansen 2006, page 189, paragraph 2, left column) Patients were excluded from follow up only if they left the health plan or died (Black 2008) Comment: Done |
| Free of selective reporting? | Low risk | All the pre‐specified outcomes that are of interest in the review were reported in the pre‐specified way (Black 2008) |
| Free of other bias? | High risk | Trial stopped early “because of the high level of efficacy demonstrated at an interim evaluation” (Black 2000, page 190, paragraph 4, left column); no mention of sample size calculation |
Kilpi 2003.
| Methods |
Design: Randomised, double‐blind Duration of the study: December 1995 ‐ March 1999 |
|
| Participants |
Setting: Eight study clinics, each with a specially trained study nurse and a study physician, established in the communities of Tampere, Kangasala, and Nokia, Finland Participants: 2,497 children receiving either the 7PCV‐CRM197, 7PCV‐OMPC, or hepatitis B vaccine as a control at 2, 4, 6, and 12 months of age; 831 were allocated to 7PCV‐CRM197, 835 to 7PCV‐OMPC, while 831 to Hep B vaccine as control. Country: Finland |
|
| Interventions |
Treatment: 7‐valent containing 1 μg of capsular polysaccharides of pneumococcal serotypes 4 and 14, 1.5 μg of type 9V, 2 μg of types 18C and 19F, 3 μg of type 23F, and 5 μg of type 6B, each individually conjugated to the outer membrane protein complex (OMPC) of Neisseria meningitidis serogroup B Control: Hepatitis B vaccine containing 5 μg of recombinant hepatitis B surface protein Mode of administration: Intramuscular Frequency: Age of approximately 2 months (6 to 13 weeks), 4 months (14 to 21 weeks), 6 months (22 to 29 weeks), and 12 months (11 to 14 months). An interval of 6 to 11 weeks was required between the first and second vaccinations and between the second and third vaccinations |
|
| Outcomes | Acute otitis media (AOM) and pneumococcal invasive disease | |
| Funding | Aventis Pasteur, Merck, and Wyeth‐Lederle Vaccines | |
| Conflict of Interest | Dr Kilpi has served as Consultant to Wyeth Lederle Vaccines (Kilpi 2003) | |
| Notes | ||
| Risk of bias | ||
| Bias | Authors' judgement | Support for judgement |
| Adequate sequence generation? | Low risk |
Quote: Six letters corresponding to the three treatment options were randomly allocated to consecutive subject identification numbers using an allocation ratio of 1:1:1 and a block size of 12 (Kilpi 2003, page 1157, paragraph 2, right column) Comment: Done. Used a computer random number generator |
| Allocation concealment? | Low risk |
Quote: Randomisation envelopes containing four smaller envelopes (for each vaccination) with a letter A to F (two letters for S. pneumoniae CRM, S. pneumoniae OMPC, and the control) were assigned to each child at enrolment. The envelopes were prepared by an external consultant. The envelopes were distributed to the study clinics and assigned in a given order within the original blocks of 12. The vaccinator (not involved in any other study activities) checked one small envelope before each vaccination from the envelope assigned to each specific child, took the vaccine from the corresponding box, destroyed the letter code, and vaccinated the child. The vaccine was drawn into the syringe out of sight of anyone else (Palmu 2003a) Comment: Probably done |
| Blinding? All outcomes | Low risk | Quote: Blinding was ensured by destruction of the letter code and by use of vaccinators who were not otherwise involved in the trial follow‐up (Kilpi 2003, page 1158, paragraph 1, left column) |
| Incomplete outcome data addressed? All outcomes | High risk |
Quote: Because compliance was excellent, the difference between the per protocol and intent to treat data sets is negligible, and we therefore only report the efficacy and the immunogenicity results of the per protocol analysis (Kilpi 2003, page 1158, paragraph 4, left column) Comment: 30/835 missing in the S. pneumoniae OMPC group and 37/831 missing in the Hep B control group (Kilpi 2003, page 1157, Figure 1). These exclusions, including the reasons they were excluded were not addressed in the discussion |
| Free of selective reporting? | Low risk | All the pre‐specified outcomes that are of interest in the review were reported in the pre‐specified way |
| Free of other bias? | Low risk | No other potential sources of bias noted |
Klugman 2003.
| Methods |
Design: Randomised, double‐blind Duration of the study: March 2, 1998 ‐ November 15, 2001 |
|
| Participants |
Setting: 21 vaccination centres in Soweto Participants: 39,836 children receiving either the 9PCV or placebo as a control at 6, 10 and 14 weeks of age; 19,922 were allocated to 9PCV while 19,914 to placebo. Excluding the HIV‐1 positive children, only 18, 633 children were allocated to the 9PCV, and 18,626 to the placebo, for a combined total of 37,259 HIV‐1 negative children considered in this review. Country: South Africa |
|
| Interventions |
Treatment: 9‐valent containing 2 μg of capsular polysaccharide (serotypes 1, 4, 5, 9V, 14, 19F, and 23F), 4 μg of serotype 6B, and 2 μg of oligosaccharide 18C Control: Placebo |
|
| Outcomes | Invasive pneumococcal disease, radiologically confirmed pneumonia, antibiotic‐resistant first episodes of invasive pneumococcal disease, safety | |
| Funding | Wyeth Lederle Vaccines and Pediatrics; WHO | |
| Conflict of Interest | S A Madhi was the recipient of research grant awards and salary support from Wyeth Vaccines and Pediatrics during the conduct of the study. C Cutland received salary support from Wyeth Vaccines and Pediatrics during the conduct of the study. K P Klugman has received research grant awards from Wyeth vaccines and Pediatrics, is a member of the Wyeth’s Speakers Bureau, and is a Consultant for Wyeth Vaccines and Pediatrics (Klugman 2003) | |
| Notes | ||
| Risk of bias | ||
| Bias | Authors' judgement | Support for judgement |
| Adequate sequence generation? | Low risk |
Quote: We evaluated the efficacy of a 9‐valent pneumococcal conjugate vaccine in randomised blocks of 10 (Klugman 2003, page 1341, par 1) Comment: probably done (computer generated random sequence) although procedure was not expounded any further |
| Allocation concealment? | Low risk |
Quote: Doses of vaccine and placebo were made up in a blinded fashion, appeared identical, and were colour‐coded with the use of 10 colours at 21 vaccination centres in Soweto, in randomised blocks of 10 (Klugman 2003, page 1342, paragraph 3, left column) There was a colour code using ten colours which was kept by the pharmacist in the US who did the coding. Even the safety committee were kept blinded to the colour code. The colour codes were kept from the doctors and nurses and anyone who had access to the children who were evaluated for disease. Unblinding was done by a separate statistical contractor who got the code from the US pharmacist after the study was completed. The patients in the primary analysis were identified to the Chair of the safety committee prior to the final analysis and the investigators remain blinded to the colour codes to this day (Klugman 2008a) Comment: Instead of serially numbering the identical‐looking vaccine and placebo containers, the study colour coded them. The correspondence of the colour codes with the vaccine or placebo was kept confidential from the staff, parents participants and investigators |
| Blinding? All outcomes | Low risk |
Quote: double‐blind randomised trial and assigned to receive the 9‐valent pneumococcal vaccine or a placebo made up in a blinded fashion, appeared identical (Klugman 2003, page 1342); vaccine and placebo containers appeared identical Comment: Probably done |
| Incomplete outcome data addressed? All outcomes | Low risk |
Quote: The results presented are for analyses conducted according to the intention to treat principle and include all cases of invasive pneumococcal disease and pneumonia (Klugman 2003, page 1343, paragraph 3, left column) Comment: Done |
| Free of selective reporting? | Low risk | All the pre‐specified outcomes that are of interest in the review were reported in the pre‐specified way (Klugman 2008a) |
| Free of other bias? | Low risk | No other potential sources of bias noted |
Lucero 2009.
| Methods |
Design: Randomised, double‐blind, placebo‐controlled Duration of the study: July 5, 2000 ‐ December 31, 2004 |
|
| Participants |
Setting: Six municipalities (Tagbilaran City, Dauis, Panglao, Baclayon, Cortes, and Balilihan) in Bohol Province Participants: 12,191 children six weeks to younger than six months of age randomly allocated to receive three doses of either an 11‐valent pneumococcal conjugate vaccine (11PCV) or a saline placebo, with a minimum interval of four weeks between doses; 6,097 were allocated to 11PCV while 6,094 to placebo. Country: Philippines |
|
| Interventions |
Treatment:11‐valent pneumococcal conjugate vaccine containing one μg of Streptococcus pneumoniae capsular polysaccharide conjugated to tetanus toxoid for types 1, 4, 5, 7F, 9V, 19F and 23F, and 3 μg of polysaccharide of types 3, 14 and 18C conjugated to diphtheria toxoid, and 10 μg of polysaccharide of type 6B conjugated to diphtheria toxoid Control: Placebo Mode of administration: Intramuscularly into the antero‐lateral aspect of the right thigh Frequency: Three doses of the study vaccines and DTwP//PRP‐T, HepB, and OPV vaccines were given following the Philippines' Expanded Programme on Immunisation schedule (i.e. officially 6, 10, and 14 weeks of age) starting at six weeks to younger than six months of age |
|
| Outcomes | Radiologically defined pneumonia, clinical pneumonia, invasive pneumococcal disease, all‐cause admissions, all‐cause mortality, safety, immunogenicity | |
| Funding | European Commission DG Research INCO programme, Academy of Finland, Finnish Ministry of Foreign Affairs, Finnish Physicians for Social Responsibility, GAVI ADIP Pneumo, Sanofi Pasteur for the study vaccines, Research Institute for Tropical Medicine of the Philippines, National Public Health Institute Finland, University of Queensland, University of Colorado, National Health and Medical Research Council of Australia and PATH | |
| Conflict of Interest | None | |
| Notes | ||
| Risk of bias | ||
| Bias | Authors' judgement | Support for judgement |
| Adequate sequence generation? | Low risk |
Quote: A list containing random permutations of the letters A‐F was generated by sanofi pasteur using the SAS software; three of the letters were allocated to the 11‐PCV and three to the placebo (Lucero 2009) Comment: Done |
| Allocation concealment? | Low risk |
Quote: Both the 11‐PCV and placebo were contained in pre‐filled, ready‐to‐use glass syringes labelled serially with vaccine letter codes and looked identical. The correspondence between the letters and the vaccine/placebo was unknown to researchers and subjects (Lucero 2009) Comment: Done |
| Blinding? All outcomes | Low risk |
Quote: Both the 11‐PCV and placebo were contained in pre‐filled, ready‐to‐use glass syringes and looked identical. The correspondence between the letters and the vaccine / placebo was unknown to researchers and subjects (Lucero 2009) Comment: Done |
| Incomplete outcome data addressed? All outcomes | Low risk | Although the primary analysis performed was per protocol, intention‐to‐treat analysis was also performed on all outcomes |
| Free of selective reporting? | Low risk | All the pre‐specified outcomes that are of interest in the review were reported in the pre‐specified way (ISRCTN62323832) |
| Free of other bias? | Low risk | No other topic‐specific, design‐specific threats to validity were identified |
Madhi 2005a.
| Methods |
Design: Randomised, double‐blind Duration of the study: March 2, 1998 ‐ November 15, 2001 |
|
| Participants |
Setting: 21 vaccination centres in Soweto Participants: 39,836 children receiving either the 9PCV or placebo as a control at 6, 10 and 14 weeks of age; 19,922 were allocated to 9PCV while 19,914 to placebo. Excluding the HIV‐1 positive children, only 18, 633 children were allocated to the 9PCV, and 18, 626 to the placebo, for a combined total of 37,259 HIV‐1 negative children considered in this review. Country: South Africa |
|
| Interventions |
Treatment: 9‐valent containing 2 μg of capsular polysaccharide (serotypes 1, 4, 5, 9V, 14, 19F, and 23F), 4 μg of serotype 6B, and 2 μg of oligosaccharide 18C Control: Placebo |
|
| Outcomes | Clinical pneumonia | |
| Funding | Wyeth Lederle Vaccines and Pediatrics; WHO | |
| Conflict of Interest | S A Madhi was the recipient of research grant awards and salary support from Wyeth vaccines and Pediatrics during the conduct of the study. C Cutland received salary support from Wyeth Vaccines and Pediatrics during the conduct of the study. K P Klugman has received research grant awards from Wyeth vaccines and Pediatrics, is a member of the Wyeth’s speakers bureau, and is a Consultant for Wyeth Vaccines and Pediatrics (Madhi 2005a) | |
| Notes | ||
| Risk of bias | ||
| Bias | Authors' judgement | Support for judgement |
| Adequate sequence generation? | Low risk |
Quote: We evaluated the efficacy of a 9‐valent pneumococcal conjugate vaccine in randomised blocks of 10 (Klugman 2003, page 1,341, paragraph 1) Comment: probably done (computer generated random sequence) although procedure was not expounded any further. |
| Allocation concealment? | Low risk |
Quote: Doses of vaccine and placebo were made up in a blinded fashion, appeared identical, and were colour‐coded with the use of 10 colours at 21 vaccination centres in Soweto, in randomised blocks of 10 (Klugman 2003, page 1342, paragraph 3, left column) There was a colour code using ten colours which was kept by the pharmacist in the US who did the coding. Even the safety committee were kept blinded to the colour code. The colour codes were kept from the doctors and nurses and anyone who had access to the children who were evaluated for disease. Unblinding was done by a separate statistical contractor who got the code from the US pharmacist after the study was completed. The patients in the primary analysis were identified to the Chair of the safety committee prior to the final analysis and the investigators remain blinded to the colour codes to this day (Klugman 2008a) Comment: Instead of serially numbering the identical‐looking vaccine and placebo containers, the study colour coded them. The correspondence of the colour codes with the vaccine or placebo was kept confidential from the staff, parents participants and investigators |
| Blinding? All outcomes | Low risk |
Quote: double‐blind randomised trial and assigned to receive the 9‐valent pneumococcal vaccine or a placebo made up in a blinded fashion, appeared identical (Klugman 2003, page 1342); vaccine and placebo containers appeared identical Comment: Probably done |
| Incomplete outcome data addressed? All outcomes | Low risk |
Quote: The results presented are for analyses conducted according to the intention to treat principle and include all cases of invasive pneumococcal disease and pneumonia (Klugman 2003, page 1343, paragraph 3, left column) Comment: Done |
| Free of selective reporting? | Low risk | All the pre‐specified outcomes that are of interest in the review were reported in the pre‐specified way (Klugman 2008a) |
| Free of other bias? | Low risk | No other potential sources of bias noted |
O'Brien 2002.
| Methods |
Design: Cluster randomised Duration of the study: April 30, 1997 ‐ May 31, 2000 |
|
| Participants |
Setting: Navajo or White Mountain Apache Indian Reservation Participants: 8091 children aged between six weeks and 24 months from the Navajo and White Mountain Apache tribes, who resided on or adjacent to the Navajo or White Mountain Apache Indian reservations; 4165 were allocated to the PnCRM7 while 3926 to MnCC. Excluding the catch‐up groups of 7 to 11 months and 12 to 23 months, however, the primary efficacy group considered in this review involved only 2974 children allocated to PnCRM7, and 2818 allocated to MnCC control vaccine for a combined total of 5792 Country: USA |
|
| Interventions |
Treatment: 7‐valent pneumococcal conjugate vaccine containing 2 μg each of serotypes 4, 9V, 14, 19F, and 23F polysaccharides; 2 μg of serotype 18C oligosaccharide; 4 μg of serotype 6B polysaccharide, all independently conjugated to the protein carrier CRM197 protein; and 0·5 mg of aluminium phosphate as an adjuvant (PnCRM7) Control:Neisseria meningitidis group‐C protein conjugate vaccine containing 10 μg of group‐C oligosaccharides coupled to CRM197 by reductive amination, and 0·5 mg of aluminium phosphate as an adjuvant (MnCC) Frequency: Three doses at 2, 4, 6 months and a booster dose at 12‐15 months |
|
| Outcomes | Invasive pneumococcal disease, safety | |
| Funding | USA National Institutes of Health, Wyeth Lederle Vaccines, USAID, WHO, CDC | |
| Conflict of Interest | A J Parkinson, J G Hackell, I Chang, G R Siber own stocks in Wyeth Vaccines or its parent company. J Hackell, I Chang, R Kohberger and G Siber are employed by Wyeth vaccines. M Santosham and K L O'Brien have received consultations, honoraria, or travel grants from Wyeth Vaccines (O'Brien 2003) | |
| Notes | This is an abstract presented orally in the ISPPD‐3 in Anchorage, Alaska in May 2002. The results for the outcomes on X‐ray pneumonia and clinical pneumonia were presented orally but not printed in the abstract. The outcome on X‐ray pneumonia has been cited erroneously in Madhi 2008 and corrected in O'Brien 2009c. According to O'Brien 2009a, the pneumonia outcomes will be formally published soon | |
| Risk of bias | ||
| Bias | Authors' judgement | Support for judgement |
| Adequate sequence generation? | Low risk |
Quote: A blocking scheme with three blocks of four units and 13 blocks of two units was used to ensure that randomisation units covered roughly the same geographical area and included about the same number of children (O'Brien 2003, page 356, paragraph 1, right column) We decided to assign six labels to the vaccine (B, F, H, M, T, U), with the three labels for the 7PCV and three for the MnCC. The grouping of these codes is known only to a statistician (Chang I.) employed by the manufacturer who has no other responsibilities with respect to the trial other than handling treatment allocation and randomisation issues (Moulton 2001, page 445, paragraph 6) Comment: The random sequence containing the six letter codes were computer generated by a statistician |
| Allocation concealment? | Low risk |
Quote: Vaccine was provided in single‐use vials, which were labelled with one of six lettered codes; three letters encoded the intervention vaccine, and three the control vaccine (O'Brien 2003, page 356, paragraph 2, right column) Comment: Done |
| Blinding? All outcomes | Low risk |
Quote: “Vaccine codes and randomisation units were concealed from study staff and participants” (O'Brien 2003, page 356, paragraph 2, right column) “Field staff were blinded as to serotype of the invasive disease cases, and thus did not know which ones would be likely to be prevented by an effective vaccine” (Moulton 2001, page 446, paragraph 1) Comment: Blinding of the care providers, participants and outcome assessors were explicitly mentioned |
| Incomplete outcome data addressed? All outcomes | Low risk | Per protocol and intention‐to‐treat analyses were done for all of the three enrolment groups and for the three enrolment groups together |
| Free of selective reporting? | Low risk |
Quote: "The efficacy of S. pneumoniae CRM7 to prevent primary endpoint consolidation will be presented [orally]. The efficacy of S. pneumoniae CRM7 to prevent clinically diagnosed otitis media episodes and culture‐confirmed spontaneously draining otitis media episodes will be presented [orally]" (O'Brien 2002, page 111, paragraph 1, left column) Comment: The actual results were supposedly presented orally during the ISPPD‐3 but were not actually printed in the abstract. The efficacy of S. pneumoniae CRM7 on AOM was published in O'Brien 2008 but the efficacy of S. pneumoniae CRM7 on pneumonia remain unpublished. The VE for X‐ray pneumonia was cited in a table in a section of a book (Madhi 2008) on pneumococcal vaccines. In an email, nevertheless, the author admits to having every intention of formally publishing the pneumonia outcomes very soon (O'Brien 2009a). Thus, the review authors judge this to be only a time‐lag bias |
| Free of other bias? | High risk |
Quote: "The end of the study was determined by advice from the data safety and monitoring board on the basis of their unblinded assessment of the cases accrued, at the time PnCRM7 became licensed and recommended for use in the USA." (O'Brien 2003, page 357, left column, paragraph 2) Mixing of the intervention and control groups was certain to have occurred to some degree in the trial. (O'Brien 2009b) Comment: Early stopping for apparent benefit ‐ resulted in failure to attain pre‐specified sample size |
O'Brien 2003.
| Methods |
Design: Cluster randomised Duration of the study: April 30, 1997 ‐ May 31, 2000 |
|
| Participants |
Setting: Navajo or White Mountain Apache Indian Reservation Participants: 8091 children aged between six weeks and 24 months from the Navajo and White Mountain Apache tribes, who resided on or adjacent to the Navajo or White Mountain Apache Indian reservations; 4165 were allocated to the PnCRM7 while 3926 to MnCC. Excluding the catch‐up groups of 7 to 11 months and 12 to 23 months, however, the primary efficacy group considered in this review involved only 2974 children allocated to PnCRM7, and 2818 allocated to MnCC control vaccine for a combined total of 5792 Country: USA |
|
| Interventions |
Treatment: 7‐valent pneumococcal conjugate vaccine containing 2 μg each of serotypes 4, 9V, 14, 19F, and 23F polysaccharides; 2 μg of serotype 18C oligosaccharide; 4 μg of serotype 6B polysaccharide, all independently conjugated to the protein carrier CRM197 protein; and 0·5 mg of aluminium phosphate as an adjuvant (PnCRM7) Control:Neisseria meningitidis group‐C protein conjugate vaccine containing 10 μg of group‐C oligosaccharides coupled to CRM197 by reductive amination, and 0·5 mg of aluminium phosphate as an adjuvant (MnCC) Frequency: Three doses at 2, 4, 6 months and a booster dose at 12‐15 months |
|
| Outcomes | Invasive pneumococcal disease, safety | |
| Funding | USA National Institutes of Health, Wyeth Lederle Vaccines, USAID, WHO, CDC | |
| Conflict of Interest | A J Parkinson, J G Hackell, I Chang, G R Siber own stocks in Wyeth Vaccines or its parent company. J Hackell, I Chang, R Kohberger and G Siber are employed by Wyeth vaccines. M Santosham and K L O’Brien have received consultations, honoraria, or travel grants from Wyeth Vaccines (O'Brien 2003) | |
| Notes | A hand searched source of this same study is listed in the 'Additional References' section as O'Brien 2001. The study was first presented in ESPID 2001 | |
| Risk of bias | ||
| Bias | Authors' judgement | Support for judgement |
| Adequate sequence generation? | Low risk |
Quote: A blocking scheme with three blocks of four units and 13 blocks of two units was used to ensure that randomisation units covered roughly the same geographical area and included about the same number of children (O'Brien 2003, page 356, paragraph 1, right column) We decided to assign six labels to the vaccine (B, F, H, M, T, U), with the three labels for the 7PCV and three for the MnCC. The grouping of these codes is known only to a statistician (Chang I.) employed by the manufacturer who has no other responsibilities with respect to the trial other than handling treatment allocation and randomisation issues (Moulton 2001, page 445, paragraph 6) Comment: The random sequence containing the six letter codes were computer generated by a statistician |
| Allocation concealment? | Low risk |
Quote: Vaccine was provided in single‐use vials, which were labelled with one of six lettered codes; three letters encoded the intervention vaccine, and three the control vaccine (O'Brien 2003, page 356, paragraph 2, right column) Comment: Done |
| Blinding? All outcomes | Low risk |
Quote: “Vaccine codes and randomisation units were concealed from study staff and participants” (O'Brien 2003, page 356, paragraph 2, right column) “Field staff were blinded as to serotype of the invasive disease cases, and thus did not know which ones would be likely to be prevented by an effective vaccine” (Moulton 2001, page 446, paragraph 1) Comment: Blinding of the care providers, participants and outcome assessors were explicitly mentioned |
| Incomplete outcome data addressed? All outcomes | Low risk | Per protocol and intention‐to‐treat analyses were done for all of the three enrolment groups and for the three enrolment groups together |
| Free of selective reporting? | Low risk |
Quote: "The efficacy of S. pneumoniae CRM7 to prevent primary endpoint consolidation will be presented [orally]. The efficacy of S. pneumoniae CRM7 to prevent clinically diagnosed otitis media episodes and culture‐confirmed spontaneously draining otitis media episodes will be presented [orally]" (O'Brien 2002, page 111, paragraph 1, left column) Comment: The actual results were supposedly presented orally during the ISPPD‐3 but were not actually printed in the abstract. The efficacy of S. pneumoniae CRM7 on AOM was published in O'Brien 2008 but the efficacy of S. pneumoniae CRM7 on pneumonia remain unpublished. The VE for X‐ray pneumonia was cited in a table in a section of a book (Madhi 2008) on pneumococcal vaccines. In an email, nevertheless, the author admits to having every intention of formally publishing the pneumonia outcomes very soon (O'Brien 2009a). Thus, the review authors judge this to be only a time‐lag bias |
| Free of other bias? | High risk |
Quote: "The end of the study was determined by advice from the data safety and monitoring board on the basis of their unblinded assessment of the cases accrued, at the time PnCRM7 became licensed and recommended for use in the USA." (O'Brien 2003, page 357, left column, paragraph 2) Mixing of the intervention and control groups was certain to have occurred to some degree in the trial. (O'Brien 2009b) Comment: Early stopping for apparent benefit ‐ resulted in failure to attain pre‐specified sample size |
AOM: acute otitis media CRM197: Cross‐Reacting Mutant of diphtheria toxin DSMB: Data and Safety Monitoring Board DTwP//PRP‐T: Haemophilus Influenzae type b (Hib) vaccine reconstituted with diphtheria‐tetanus‐whole cell pertussis (DTwP) vaccine ESPID: European Society for Pediatric Infectious Diseases ISPPD: International Symposium on Pneumococci and Pneumococcal Diseases MnCC: Meningococcus type C CRM197 conjugate vaccine OMP or OMPC: outer membrane protein complex OPV: Oral Polio Vaccine PATH: Program for Appropriate Technology in Health PnCRM7: seven‐valent polysaccharide protein conjugate pneumococcal vaccine PCV: pneumococcal conjugate vaccine USAID: United States Agency for International Development
Characteristics of excluded studies [ordered by study ID]
| Study | Reason for exclusion |
|---|---|
| Adam 2001 | Article in German |
| Black 2004a | Post‐licensure surveillance study; no IPD case reported |
| Black 2004b | Article in French |
| Blum 2000 | Subjects are toddlers |
| Bogaert 2005 | Prospective study; no IPD case reported |
| Brouwer 2005 | Outcomes are QOL and FHS; no IPD case reported |
| Choo 2000 | Outcomes are immunogenicity and reactogenicity |
| Dagan 2001 | Subjects comprised of 12 to 35 months old |
| Dagan 2002 | Subjects comprised of toddlers |
| Dagan 2003 | Subjects comprised of 12 to 35 months old |
| Dagan 2005 | Subjects comprised of 12 to 35 months old |
| De Aristegui Fernan 2005 | Outcomes are safety and immunogenicity |
| Einarsdottir 2005 | Population based study of recurrent IPD |
| Ekstrom 2005 | Outcomes are antibody kinetics and avidity |
| Esposito 2005 | Outcomes are immunogenicity, safety and tolerability |
| Finn 2002 | Subjects comprised of children two to four years old |
| Fireman 2003 | Outcome is efficacy against acute otitis media (AOM) |
| Frazao 2005 | Outcome is nasopharyngeal carriage; no IPD case reported |
| Ghaffar 2005 | Review |
| Givon‐Lavi 2003 | Outcome is herd immunity |
| Goldblatt 2006 | Outcome is immunogenicity |
| Hanna 2006 | Non‐RCT |
| Jokinen 2004 | Outcome is anti‐pneumococcal antibodies; no IPD case reported |
| Kayhty 2005 | Outcomes are immunogenicity and tolerability |
| Madhi 2004 | Outcome is the role of the pneumococcus in viral pneumonias |
| Madhi 2005b | Outcome is antibody response |
| Moulton 2006 | Outcome is indirect effects of PCV |
| Palmu 2002 | Outcome is efficacy against AOM |
| Palmu 2004 | Outcome is tympanostomy tube placement |
| Plotkin 2000 | Article in French |
| Prymula 2006 | Outcome is AOM; no IPD case reported |
| Reinert 2003 | Outcomes are safety and immunogenicity |
| Rosenfeld 2005 | Outcome is otitis media |
| Scheifele 2006 | Outcome is compatibility of PCV with co‐administered vaccines |
| Schmitt 2003 | Outcomes are safety, reactogenicity and immunogenicity |
| Shinefield 1999 | Outcome was immunogenicity |
| Shinefield 2002a | Outcomes are efficacy, immunogenicity, and safety in low birth weight and preterm infants |
| Straetemans 2003 | Outcome is effectiveness against AOM |
| Tichmann‐Schumann 2005 | Outcomes are immunogenicity and reactogenicity |
| Van Kempen 2006 | Outcome is recurrent AOM on one to seven year old children |
| Veenhoven 2002a | Outcome is efficacy against AOM |
| Veenhoven 2003a | Outcome was AOM |
| Veenhoven 2003b | Outcome is effectiveness of PCV plus PPV against AOM in children one to six years old |
| Veenhoven 2004 | Outcome is nasopharyngeal carriage |
| Yeh 2003 | Outcome is nasopharyngeal carriage |
| Zangwill 2003 | Outcomes are immunogenicity and safety |
AOM: acute otitis media ESPID: European Society of Paediatric Infectious Diseases PCV: pneumococcal conjugate vaccine PPV: pneumococcal polysaccharide vaccine OM: otitis media RCT: randomised, controlled trial
Differences between protocol and review
The major difference between the protocol and this updated review is the use of the latest version of RevMan which is RevMan 5.01. As such, the method by which the presence of risk of bias and quality of the evidence provided by the studies included in the review is vastly different than what was stated in the protocol or even in the 2004 version of this review (Lucero 2004).
Contributions of authors
Marilla G. Lucero (MGL), MD, MSc, PhD, guarantor of the review; conceived, designed and coordinated the review; primarily responsible for writing of review, data management, analysis and interpretation of data;
Vernoni E. Dulalia (VED), MD, conducted the electronic and manual search of journal articles, screening search results with the main author, screening retrieved papers against eligibility criteria, reviewed materials together with a co‐author and encoded/exported relevant materials into the review, performed data extraction, appraised the methodological quality of included studies using Cochrane's new 'risk of bias' tool, wrote to authors of included studies for additional information, entered data into RevMan, assisted in writing the review, incorporated recommendations and revisions made by peer reviewers; proofread and copy edited the final review;
Leilani T. Nillos (LTN), conducted the statistical analysis of data, entered data into RevMan, reviewed materials together with a co‐author and encoded relevant materials into the review, appraised the quality of evaluated studies and performed data extraction of these studies; incorporated recommendations and revisions made by peer reviewers, proofread and copy edited the final review;
Gail Williams (GW), PhD, provided comments on the proposal and review in its preliminary stages of development; helped extensively in statistical analysis particularly in the clarification of the calculation of standard errors to be entered in Revman;
Rhea Angela N. Parreño (RAP), provided assistance in statistical analysis in the first publication in 2004: reviewed materials together with the main author and encoded relevant materials into the review; appraised the quality of evaluated studies and performed data extraction of these studies; incorporation of recommendations and revisions made by peer reviewers; proofread and copy edited the final document;
Hanna Nohynek (HN), MD, PhD, provided comments on the proposal and review; also provided majority of reference materials, helped contact authors of major articles included in this review;
Ian Riley (IR), provided general advice on the proposal and gave comments to the review;
Helena Makela (HM), MD, PhD, provided general advice on the proposal and gave comments to the review.
Sources of support
Internal sources
Manpower and physical resources from the Research Institute for Tropical Medicine and the ARIVAC Project under New Tropical Medicine Foundation, Inc., Philippines.
External sources
PneumoAdip, USA.
Declarations of interest
The Pneumococcal vaccines Accelerated Development and Introduction Plan (PneumoADIP) provided funding for the update of this review.
The authors collaborated with the ARIVAC consortium composed of scientists from the National Public Health Institute of Finland, the University of Queensland, University of Colorado, and sanofi‐pasteur, the pharmaceutical company which developed the 11‐valent PCV used in the phase three RCT in the Philippines. The primary author of this review was the principal investigator of the trial (Lucero 2009) included in this review.
Unchanged
References
References to studies included in this review
Black 2000 {published data only}
- Black S, Shinefield H, Fireman B, Lewis E, Ray P, Hansen J, et al. Efficacy, safety and immunogenicity of heptavalent pneumococcal conjugate vaccine in children. Pediatric Infectious Disease Journal 2000;19(3):187‐95. [DOI] [PubMed] [Google Scholar]
Black 2002a {published data only}
- Black S, Shinefield H, Ling S, Hansen J, Fireman B, Spring D, et al. Effectiveness of heptavalent pneumococcal conjugate vaccine in children younger than five years of age for prevention of pneumonia. Pediatric Infectious Disease Journal 2002;21(9):810‐5. [DOI] [PubMed] [Google Scholar]
Cutts 2005 {published data only}
- Cutts FT, Zaman SMA, Enwere G, Jaffar S, Levine OS, Okoko JB, et al. Efficacy of nine‐valent pneumococcal conjugate vaccine against pneumonia and invasive pneumococcal disease in The Gambia: randomised, double‐blind, placebo‐controlled trial. Lancet 2005;365(9465):1139–46. [DOI] [PubMed] [Google Scholar]
Eskola 2001 {published data only}
- Eskola J, Kilpi T, Palmu A, Jokinen J, Haapakoski J, Herva E, et al. Efficacy of a pneumococcal conjugate vaccine against acute otitis media. New England Journal of Medicine 2001;344(6):403‐9. [DOI] [PubMed] [Google Scholar]
Hansen 2006 {published data only}
- Hansen J, Black S, Shinefield H, Cherian T, Benson J, Fireman B, et al. Effectiveness of heptavalent pneumococcal conjugate vaccine in children younger than 5 years of age for prevention of pneumonia: updated analysis using World Health Organization standardized interpretation of chest radiographs. Pediatric Infectious Disease Journal 2006;25(9):779‐81. [DOI] [PubMed] [Google Scholar]
Kilpi 2003 {published data only}
- Kilpi T, Ahman H, Jokinen J, Lankinen KS, Palmu A, Savolainen H, et al. Protective efficacy of a second pneumococcal conjugate vaccine against pneumococcal acute otitis media in infants and children: randomized, controlled trial of a 7‐valent pneumococcal polysaccharide‐meningococcal outer membrane protein complex conjugate vaccine in 1666 children. Clinical Infectious Diseases 2003;37(9):1155‐64. [DOI] [PubMed] [Google Scholar]
Klugman 2003 {published data only}
- Klugman K, Madhi S, Huebner R, Kohberger R, Mbelle N, Pierce N for the Vaccine Trialists Group. A trial of a 9‐valent pneumococcal conjugate vaccine in children with and those without HIV infection. New England Journal of Medicine 2003;349(14):1341‐8. [DOI] [PubMed] [Google Scholar]
Lucero 2009 {published data only}
- Lucero M, Nohynek H, Williams G, Tallo V, Simoes E, Lupisan S, et al. Efficacy of an 11‐valent pneumococcal conjugate vaccine against radiologically confirmed pneumonia among children less than two years of age in the Philippines: a randomized, double‐blind, placebo‐controlled trial. Pediatric Infectious Disease Journal June 2009;28(6):455‐62. [DOI] [PubMed] [Google Scholar]
Madhi 2005a {published data only}
- Madhi SA, Kuwanda L, Cutland C, Klugman KP. The impact of a 9‐valent pneumococcal conjugate vaccine on the public health burden of pneumonia in HIV‐infected and ‐uninfected children. Clinical Infectious Diseases 2005;40(10):1511‐8. [DOI] [PubMed] [Google Scholar]
O'Brien 2002 {published data only}
- OBrien KL, David A, Benson J, Moenne K, Reid R, Moulton L, et al. The effect of conjugate pneumococcal vaccine on pneumonia and otitis media among Navajo and White Mountain Apache children. 3rd International Symposium on Pneumococci and Pneumococcal Diseases (ISPPD) Book of Abstracts. Anchorage Alaska, USA, 2002:110‐11.
O'Brien 2003 {published data only}
- O'Brien K, Moulton L, Reid R, Weatherholtz R, Oski J, Brown L, et al. Efficacy and safety of seven‐valent conjugate pneumococcal vaccine in American Indian children: group randomised trial. Lancet 2003;362(9381):355‐61. [MEDLINE: ] [DOI] [PubMed] [Google Scholar]
References to studies excluded from this review
Adam 2001 {published data only}
- Adam D, Scholz H. Value of pneumococcal vaccination in infants and young children. Klinische Padiatrie 2001;213(3):109‐13. [DOI] [PubMed] [Google Scholar]
Black 2004a {published data only}
- Black S, Shinefield H, Baxter R, Austrian R, Bracken L, Hansen J, et al. Postlicensure surveillance for pneumococcal invasive disease after use of heptavalent pneumococcal conjugate vaccine in Northern California Kaiser Permanente. Pediatric Infectious Disease Journal 2004;23(6):485‐9. [DOI] [PubMed] [Google Scholar]
Black 2004b {published data only}
- Black S, Shinefield H, Cohen R, Floret D, Gaudelus J, Olivier C, et al. Clinical effectiveness of seven‐valent pneumococcal conjugate vaccine (Prevenar) against invasive pneumococcal diseases: prospects for children in France. Archives de Pediatrie 2004;11(7):843‐53. [DOI] [PubMed] [Google Scholar]
Blum 2000 {published data only}
- Blum MD, Dagan R, Mendelman PM, Pinsk V, Giordani M, Li S, et al. A comparison of multiple regimens of pneumococcal polysaccharide‐meningococcal outer membrane protein complex conjugate vaccine and pneumococcal polysaccharide vaccine in toddlers. Vaccine 2000;18(22):2359‐67. [DOI] [PubMed] [Google Scholar]
Bogaert 2005 {published data only}
- Bogaert D, Veenhoven RH, Ramdin R, Luijendijk IH, Rijkers GT, Sanders EA, et al. Pneumococcal conjugate vaccination does not induce a persisting mucosal IgA response in children with recurrent acute otitis media. Vaccine 2005;23(20):2607‐13. [DOI] [PubMed] [Google Scholar]
Brouwer 2005 {published data only}
- Brouwer CN, Maille AR, Rovers MM, Veenhoven RH, Grobbee DE, Sanders EA, et al. Effect of pneumococcal vaccination on quality of life in children with recurrent acute otitis media: a randomized, controlled trial. Pediatrics 2005;115(2):273‐9. [DOI] [PubMed] [Google Scholar]
Choo 2000 {published data only}
- Choo S, Seymour L, Morris R, Quataert S, Lockhart S, Cartwright K, et al. Immunogenicity and reactogenicity of a pneumococcal conjugate vaccine administered combined with a hemophilus influenzae type b conjugate vaccine in United Kingdom infants. Pediatric Infectious Disease Journal 2000;19(9):854‐62. [DOI] [PubMed] [Google Scholar]
Dagan 2001 {published data only}
- Dagan R, Sikuler‐Cohen M, Zamir O, Janco J, Givon‐Lavi N, Fraser D. Effect of a conjugate pneumococcal vaccine on the occurrence of respiratory infections and antibiotic use in day‐care center attendees. Pediatric Infectious Disease Journal 2001;20(10):951‐8. [DOI] [PubMed] [Google Scholar]
Dagan 2002 {published data only}
- Dagan R, Givon‐Lavi N, Zamir O, Sikuler‐Cohen M, Guy L, Janco J, et al. Reduction of nasopharyngeal carriage of Streptococcus pneumoniae after administration of a 9‐valent pneumococcal conjugate vaccine to toddlers attending day care centers. Journal of Infectious Diseases 2002;185(7):927‐36. [DOI] [PubMed] [Google Scholar]
Dagan 2003 {published data only}
- Dagan R, Givon‐Lavi N, Zamir O, Fraser D. Effect of a nonavalent conjugate vaccine on carriage of antibiotic‐resistant Streptococcus pneumoniae in day‐care centers. Pediatric Infectious Disease Journal 2003;22(6):532‐40. [MEDLINE: ] [DOI] [PubMed] [Google Scholar]
Dagan 2005 {published data only}
- Dagan R, Givon‐Lavi N, Fraser D, Lipsitch M, Sibe GR, Kohberger R. Serum serotype‐specific pneumococcal anticapsular immunoglobulin G concentrations after immunization with a 9‐valent conjugate pneumococcal vaccine correlate with nasopharyngeal acquisition of pneumococcus. Journal of Infectious Diseases 2005;192(3):367‐76. [DOI] [PubMed] [Google Scholar]
De Aristegui Fernan 2005 {published data only}
- Aristegui Fernandez J, Cos Arregui B, Zurimendi Carril A, Alday Esteban MV, Alzua Ruiz J, Fuente Jausoro E, et al. Evaluation of the safety and immunogenicity of pneumococcal seven‐valent conjugate vaccine (Prevenar) administered in previously unvaccinated Spanish children aged 24 to 36 months. Vaccine 2005;23(16):1917‐22. [DOI] [PubMed] [Google Scholar]
Einarsdottir 2005 {published data only}
- Einarsdottir HM, Erlendsdottir H, Kristinsson KG, Gottfredsson M. Nationwide study of recurrent invasive pneumococcal infections in a population with a low prevalence of human immunodeficiency virus infection. Clinical Microbiology and Infection 2005;11(9):744‐9. [DOI] [PubMed] [Google Scholar]
Ekstrom 2005 {published data only}
- Ekstrom N, Ahman H, Verho J, Jokinen J, Vakevainen M, Kilpi T, et al. Kinetics and avidity of antibodies evoked by heptavalent pneumococcal conjugate vaccines PncCRM and PncOMPC in the Finnish Otitis Media Vaccine Trial. Infection and Immunity 2005;73(1):369‐77. [DOI] [PMC free article] [PubMed] [Google Scholar]
Esposito 2005 {published data only}
- Esposito S, Pugni L, Bosis S, Proto A, Cesati L, Bianchi C, et al. Immunogenicity, safety and tolerability of heptavalent pneumococcal conjugate vaccine administered at 3, 5 and 11 months post‐natally to pre‐ and full‐term infants. Vaccine 2005;23(14):1703‐8. [DOI] [PubMed] [Google Scholar]
Finn 2002 {published data only}
- Finn A, Arnaoutakis K, Race G, Burkinshaw R, Shaw L, Zhang Q. Mucosal anticapsular polysaccharide responses at 3 years of age after pneumococcal immunization in infancy and their relation to pneumococcal carriage. 3rd International Symposium on Pneumococci and Pneumococcal Diseases (ISPPD) (May 5‐8). Anchorage Alaska, USA, 2002.
Fireman 2003 {published data only}
- Fireman B, Black SB, Shinefield HR, Lee J, Lewis E, Ray P. Impact of the pneumococcal conjugate vaccine on otitis media. Erratum appears in Pediatric Infectious Disease Journal 2003;22(2):163. Pediatric Infectious Disease Journal 2003;22(1):10‐6. [DOI] [PubMed] [Google Scholar]
Frazao 2005 {published data only}
- Frazao N, Brito‐Avo A, Simas C, Saldanha J, Mato R, Nunes S, et al. Effect of the seven‐valent conjugate pneumococcal vaccine on carriage and drug resistance of Streptococcus pneumoniae in healthy children attending day‐care centers in Lisbon. Pediatric Infectious Disease Journal 2005;24(3):243‐52. [DOI] [PubMed] [Google Scholar]
Ghaffar 2005 {published data only}
- Ghaffar F. The safety of 7‐valent pneumococcal conjugate vaccine. Expert Opinion on Drug Safety 2005;4(4):631‐6. [DOI] [PubMed] [Google Scholar]
Givon‐Lavi 2003 {published data only}
- Givon‐Lavi N, Fraser D, Dagan R. Vaccination of day‐care center attendees reduces carriage of Streptococcus pneumoniae among their younger siblings. Pediatric Infectious Disease Journal 2003;22(6):524‐32. [DOI] [PubMed] [Google Scholar]
Goldblatt 2006 {published data only}
- Goldblatt D, Southern J, Ashton L, Richmond P, Burbidge P, Tasevska J, et al. Immunogenicity and boosting after a reduced number of doses of a pneumococcal conjugate vaccine in infants and toddlers. Pediatric Infectious Disease Journal 2006;25(4):312‐9. [DOI] [PubMed] [Google Scholar]
Hanna 2006 {published data only}
- Hanna JN, Humphreys JL, Murphy DM. Invasive pneumococcal disease in Indigenous people in north Queensland, 1999‐2004. Medical Journal of Australia 2006;184(1):118‐21. [DOI] [PubMed] [Google Scholar]
Jokinen 2004 {published data only}
- Jokinen JT, Ahman H, Kilpi TM, Makela PH, Kayhty MH. Concentration of anti‐pneumococcal antibodies as a serological correlate of protection: an application to acute otitis media. Journal of Infectious Diseases 2004;190(3):545‐50. [DOI] [PubMed] [Google Scholar]
Kayhty 2005 {published data only}
- Kayhty H, Ahman H, Eriksson K, Sorberg M, Nilsson L. Immunogenicity and tolerability of a heptavalent pneumococcal conjugate vaccine administered at 3, 5 and 12 months of age. Pediatric Infectious Disease Journal 2005;24(2):108‐14. [DOI] [PubMed] [Google Scholar]
Madhi 2004 {published data only}
- Madhi SA, Klugman KP, Group VT. A role for Streptococcus pneumoniae in virus‐associated pneumonia. Nature‐Medicine 2004;10(8):811‐3. [DOI] [PMC free article] [PubMed] [Google Scholar]
Madhi 2005b {published data only}
- Madhi SA, Heera JR, Kuwanda L, Klugman KP. Use of procalcitonin and C‐reactive protein to evaluate vaccine efficacy against pneumonia. PLoS Medicine 2005;2(2):e38. [DOI] [PMC free article] [PubMed] [Google Scholar]
Moulton 2006 {published data only}
- Moulton LH, O'Brien KL, Reid R, Weatherholtz R, Santosham M, Siber GR. Evaluation of the indirect effects of a pneumococcal vaccine in a community‐randomized study. Journal of Biopharmaceutical Statistics 2006;16(4):453‐62. [DOI] [PubMed] [Google Scholar]
Palmu 2002 {published data only}
- Palmu A, Verho J, Makela PH, Kilpi TM. Long‐term efficacy of the seven‐valent PncCRM vaccine on otitis media. 3rd International Symposium on Pneumococci and Pneumococcal Diseases (ISPPD) (May 5‐8). Anchorage Alaska, USA, 2002.
Palmu 2004 {published data only}
- Palmu AA, Verho J, Jokinen J, Karma P, Kilpi TM. The seven‐valent pneumococcal conjugate vaccine reduces tympanostomy tube placement in children. Pediatric Infectious Disease Journal 2004;23(8):732‐8. [DOI] [PubMed] [Google Scholar]
Plotkin 2000 {published data only}
- Plotkin SA. Development of a nonavalent pneumococcal conjugate vaccine. Medecine Therapeutique Pediatrie 2000;3(Spec. Iss. 2):17‐8. [Google Scholar]
Prymula 2006 {published data only}
- Prymula R, Peeters P, Chrobok V, Kriz P, Novakova E, Kaliskova E, et al. Pneumococcal capsular polysaccharides conjugated to protein D for prevention of acute otitis media caused by both Streptococcus pneumoniae and non‐typable Haemophilus influenzae: a randomised double‐blind efficacy study. Lancet 2006;367(9512):740‐8. [DOI] [PubMed] [Google Scholar]
Reinert 2003 {published data only}
- Reinert P, Guy M, Girier B, Szelechowski B, Baudoin B, Deberdt P, et al. The safety and immunogenicity of an heptavalent pneumococcal polysaccharide conjugate vaccine (Prevenar) administered in association with a whole‐cell pertussis‐based pediatric combination vaccine (DTP‐IPV/PRP‐T) to French infants with a two‐, three‐, and four‐month schedule. Archives de Pediatrie 2003;10(12):1048‐55. [DOI] [PubMed] [Google Scholar]
Rosenfeld 2005 {published data only}
- Rosenfeld RM, Lous J, Bluestone CD, Marchisio P, Casselbrant ML, Paradise JL, et al. Recent advances in otitis media. Annals of Otology, Rhinology, & Laryngology 2005;194:114‐39. [PubMed] [Google Scholar]
Scheifele 2006 {published data only}
- Scheifele DW, Halperin SA, Smith B, Ochnio J, Meloff K, Duarte‐Monteiro D. Assessment of the compatibility of co‐administered 7‐valent pneumococcal conjugate, DTaP.IPV/PRP‐T Hib and hepatitis B vaccines in infants 2‐7 months of age. Vaccine 2006;24(12):2057‐64. [DOI] [PubMed] [Google Scholar]
Schmitt 2003 {published data only}
- Schmitt HJ, Faber J, Lorenz I, Schmole‐Thoma B, Ahlers N. The safety, reactogenicity and immunogenicity of a 7‐valent pneumococcal conjugate vaccine (7VPnC) concurrently administered with a combination DTaP‐IPV‐Hib vaccine. Vaccine 2003;21(25‐6):3653‐62. [DOI] [PubMed] [Google Scholar]
Shinefield 1999 {published data only}
- Shinefield HR, Black S, Ray P, Chang I, Lewis N, Fireman B, et al. Safety and immunogenicity of heptavalent pneumococcal CRM197 conjugate vaccine in infants and toddlers. Pediatric Infectious Disease Journal 1999;18(9):757‐63. [DOI] [PubMed] [Google Scholar]
Shinefield 2002a {published data only}
- Shinefield H, Black S, Ray P, Fireman B, Schwalbe J, Lewis E. Efficacy, immunogenicity and safety of heptavalent pneumococcal conjugate vaccine in low birth weight and preterm infants. Pediatric Infectious Disease Journal 2002;21(3):182‐6. [DOI] [PubMed] [Google Scholar]
Straetemans 2003 {published data only}
- Straetemans M, Palmu A, Auranen K, Zielhuis GA, Kilpi T. The effect of a pneumococcal conjugate vaccine on the risk of otitis media with effusion at 7 and 24 months of age. International Journal of Pediatric Otorhinolaryngology 2003;67(11):1235‐42. [DOI] [PubMed] [Google Scholar]
Tichmann‐Schumann 2005 {published data only}
- Tichmann‐Schumann I, Soemantri P, Behre U, Disselhoff J, Mahler H, Maechler G, et al. Immunogenicity and reactogenicity of four doses of diphtheria‐tetanus‐three‐component acellular pertussis‐hepatitis B‐inactivated polio virus‐Haemophilus influenzae type b vaccine coadministered with 7‐valent pneumococcal conjugate vaccine. Pediatric Infectious Disease Journal 2005;24(1):70‐7. [DOI] [PubMed] [Google Scholar]
Van Kempen 2006 {published data only}
- Kempen MJ, Vermeiren JS, Vaneechoutte M, Claeys G, Veenhoven RH, Rijkers GT, et al. Pneumococcal conjugate vaccination in children with recurrent acute otitis media: a therapeutic alternative?. International Journal of Pediatric Otorhinolaryngology 2006;70(2):275‐85. [DOI] [PubMed] [Google Scholar]
Veenhoven 2002a {published data only}
- Veenhoven RH, Schilder AGM, Bogaert D, Brouwer CNM, Kiezebrink HH, Uiterwaal CSPM, et al. Prevention of acute otitis media by pneumococcal conjugate vaccine combined with 23‐valent polysaccharide vaccine in children with recurrent acute otitis media (Dutch OMAVAX‐ study). 3rd International Symposium on Pneumococci and Pneumococcal Diseases (ISPPD) (May 5‐8). Anchorage Alaska, USA, 2002.
Veenhoven 2003a {published data only}
- Veenhoven R, Bogaert D, Uiterwaal C, Brouwer C, Kiezebrink H, Bruin J, et al. Effect of conjugate pneumococcal vaccine followed by polysaccharide pneumococcal vaccine on recurrent acute otitis media: a randomised study. Lancet 2003;361(9376):2189‐95. [MEDLINE: ] [DOI] [PubMed] [Google Scholar]
Veenhoven 2003b {published data only}
- Veenhoven RH, Bogaert D, Schilder AGM, Uiterwaal CSPM, Rijkers GT, Hermans PWM, et al. Clinical ineffectiveness of combined vaccination with 7‐valent pneumococcal conjugate vaccine and 23‐valent pneumococcal polysaccharide vaccine in children with recurrent acute otitis media: a randomised double‐blind study. Nederlands Tijdschrift voor Geneeskunde 2003;147(45):2220‐6. [Google Scholar]
Veenhoven 2004 {published data only}
- Veenhoven RH, Bogaert D, Schilder AG, Rijkers GT, Uiterwaal CS, Kiezebrink HH, et al. Nasopharyngeal pneumococcal carriage after combined pneumococcal conjugate and polysaccharide vaccination in children with a history of recurrent acute otitis media. Clinical Infectious Diseases 2004;39(7):911‐9. [DOI] [PubMed] [Google Scholar]
Yeh 2003 {published data only}
- Yeh SH, Zangwill KM, Lee H, Chang SJ, Wong VI, Greenberg DP, et al. Heptavalent pneumococcal vaccine conjugated to outer membrane protein of Neisseria meningitidis serogroup b and nasopharyngeal carriage of Streptococcus pneumoniae in infants. Vaccine 2003;21(19‐20):2627‐31. [DOI] [PubMed] [Google Scholar]
Zangwill 2003 {published data only}
- Zangwill KM, Greenberg DP, Chiu CY, Mendelman P, Wong VK, Chang SJ, et al. Safety and immunogenicity of a heptavalent pneumococcal conjugate vaccine in infants. Vaccine 2003;21(17‐18):1894‐900. [MEDLINE: ] [DOI] [PubMed] [Google Scholar]
Additional references
Berman 1985
- Berman S, McIntosh K. Selective primary health care: strategies for control of disease in the developing world. XXI. Acute respiratory infections [review]. Review of Infectious Diseases 1985;7(5):674‐91. [DOI] [PubMed] [Google Scholar]
Black 1999
- Black S. The clinical impact of pneumococcal conjugate vaccines. American Journal of Managed Care 1999;Suppl 5(17):1010‐7. [MEDLINE: ] [Google Scholar]
Black 2002b
- Black SB, Shinefield H, Fireman B, Hansen J, Ling S, Kaiser Permanente Vaccine Study Group, et al. Efficacy against pneumonia of heptavalent conjugate pneumococcal vaccine (Wyeth Lederle) in 37,868 infants and children: expanded data analysis including duration of protection. 3rd International Symposium on Pneumococci and Pneumococcal Diseases (ISPPD) (May 5‐8). Anchorage Alaska, USA, 2002.
Black 2002c
- Black S, Shinefield H, Ling S, Fireman B, Hansen J, Lee J, et al. Efficacy against pneumonia of heptavalent conjugate pneumococcal vaccine (PCV) in 37,868 infants and children. 3rd World Congress of Pediatric Infectious Diseases (WSPID) (November 19‐23). Santiago, Chile, 2002.
Black 2003
- Black S. Personnal communication 20 November 2003.
Black 2004
- Black S. Personnal communication 9 July 2004.
Black 2008
- Black S. Personal communication 10 September 2008.
Crewe‐Brown 1997
- Crewe‐Brown HH, Karstaedt AS, Saunders GL, Khoosal M, Jones N, Wasas A, et al. Streptococcus pneumoniae blood culture isolates from patients with and without human immunodefieciency virus infection: alterations in penicillin susceptibilities and in serogroups of serotypes. Clinical Infectious Diseases 1997;25(5):1165‐72. [DOI] [PubMed] [Google Scholar]
Cutts 2007
- Cutts F. Personal communication 28 Feb 2007.
Cutts 2008
- Cutts F. Personal communication 24 November 2008.
Deeks 2008
- Deeks JJ, Higgins JPT, Altman DG (editors). Chapter 9: Analysing data and undertaking meta‐analyses. Higgins JPT, Green S (editors). Cochrane Handbook for Systematic Reviews of Interventions Version 5.0.1 (Updated September 2008) (Available from www.cochrane‐handbook.org). Chichester, UK: Wiley‐Blackwell, 2008. [Google Scholar]
GAVI 2004
- Global Alliance on Vaccine, Immunization. Annual deaths in 2002 from vaccine‐preventable diseases. WHO Estimates (Jan 2004). http://www.vaccinealliance.org/home/General_Informatio/Immunization_informa/Diseases_Vaccines/vaccine_preventable_deaths.php (Accessed 16 July 2004) 2004.
Giebink 2001
- Giebink GS. The prevention of pneumococcal disease in children. New England Journal of Medicine 18;345(16):1177‐83. [DOI] [PubMed] [Google Scholar]
GRADEPro 2008 [Computer program]
- GRADE Working Group 2004‐2007. GRADEProfiler. Version 3.2. www.gradeworkinggroup.org, June 2008.
Grijalva 2007
- Grijalva CG, Nuorti JP, Arbogast PG, Martin SW, Edwards KM, Griffin MR. Decline in pneumonia admissions after routine childhood immunisation with pneumococcal conjugate vaccine in the USA: a time series analysis. Lancet 2007;369(9568):1179‐86. [DOI] [PubMed] [Google Scholar]
GSK 2009
- Glaxo Smith Kline. Evaluation of Effectiveness of GSK Biologicals' Pneumococcal Conjugate Vaccine 1024850A Against Invasive Disease. (FinIP). http://clinicaltrials.gov/ct2/show/NCT00861380?term=pneumococcal+finland&rank=8 (Accessed 18 May 2009) 2009.
Hansen 2007
- Hansen J. Personal communication 21 April 2007.
Hansen 2008a
- Hansen J. Personal communication 5 November 2008.
Hansen 2008b
- Hansen J. Personal communication 20 November 2008.
Hicks 2007
- Hicks LA, Harrison LH, Flannery B, Hadler JL, Schaffner W, Craig AS, et al. Incidence of pneumococcal disease due to non‐pneumococcal conjugate vaccine (PCV7) serotypes in the United States during the era of widespread PCV7 vaccination, 1998‐2004. Journal of Infectious Diseases 2007;196(9):1346‐54. [DOI] [PubMed] [Google Scholar]
Higgins 2008a
- Higgins JPT, Altman DG (editors). Chapter 8: Assessing risk of bias in included studies. In: Higgins JPT, Green S editor(s). Cochrane Handbook for Systematic Reviews of Interventions Version 5.0.1 (Updated September 2008) (Available from www.cochrane‐handbook.org). Chichester, UK: Wiley‐Blackwell, 2008. [Google Scholar]
Higgins 2008b
- Higgins JPT, Deeks JJ (editors). Chapter 7: Selecting studies and collecting data. In: Higgins JPT, Green S editor(s). Higgins JPT, Green S (editors), Cochrane Handbook for Systematic Reviews of Interventions Version 5.0.0 (updated February 2008). (Available from www.cochrane‐handbook.org). Chichester, UK: Wiley‐Blackwell, 2008. [Google Scholar]
ISRCTN46147225
- ISRCTN46147225. Phase III, double‐blind, randomised, placebo‐controlled trial to evaluate efficacy against radiological pneumonia and invasive pneumococcal disease in Gambian infants. controlled‐trials.com/ISRCTN46147225 (Accessed 5 November 2008) 2008.
ISRCTN62323832
- ISRCTN62323832. Effectiveness of an 11‐valent (types 1, 3, 4, 5, 6B, 7F, 9V, 14, 18C, 19F, AND 23F) conjugate vaccine against pneumonia in Philippine children: a double‐blind, placebo‐controlled, randomised, multicentre, effectiveness study. controlled‐trials.com/ISRCTN62323832 (Accessed 5 November 2008) 2008.
Jaffar 2007
- Jaffar S. Personal communication 14 January 2007.
Klugman 2004
- Klugman K. Personnal communication 18 March 2004.
Klugman 2008a
- Klugman K. Personal communication 22 November 2008.
Klugman 2008b
- Klugman KP, Cutts F, Adegbola RA, Black S, Madhi SA, O'Brien KL, et al. Meta‐analysis of the efficacy of conjugate vaccines against invasive pneumococcal disease. Pneumococcal Vaccines: the impact of conjugate vaccine. Washington, DC: American Society for Microbiology, 2008:317‐26. [Google Scholar]
Lefebvre 2008
- Lefebvre C, Manheimer E, Glanville J. Chapter 6: Searching for studies. Higgins JPT, Green S (editors). Cochrane Handbook for Systematic Reviews ofInterventions. Version 5.0.1 (Updated September 2008) (Available from www.cochrane‐handbook.org). Chichester, UK: Wiley‐Blackwell, 2008. [Google Scholar]
Lewis 1993
- Lewis JA, Machin D. Intention to treat‐‐who should use ITT?. British Journal of Cancer 1993;68(4):647‐50. [DOI] [PMC free article] [PubMed] [Google Scholar]
Madhi 2008
- Madhi S, Klugman KP. Efficacy and safety of conjugate pneumococcal vaccine in the prevention of pneumonia. In: Siber GR, Klugman KP, Makela PH editor(s). Pneumococcal Vaccines: The impact of conjugate vaccines. Washington, D.C.: ASM Press, 2008:327‐37. [Google Scholar]
MMWR 2009
- Centers for Disease Control and Prevention. Pneumonia Hospitalizations Among Young Children Before and After Introduction of Pneumococcal Conjugate Vaccine ‐ United States, 1997‐2006. www.cdc.gov/mmwr/PDF/wk/mm5801.pdf (Accessed 22 January 2009) 2009. [PubMed]
Montori 2005
- Montori VM, Devereaux PJ, Adhikari NK, Burns KE, Eggert CH, Briel M, et al. Randomized trials stopped early for benefit: a systematic review. JAMA 2005;294(17):2203‐9. [DOI] [PubMed] [Google Scholar]
Moulton 2001
- Moulton LH, O'Brien KL, Kohberger R, Chang I, Reid R, Weatherholtz R, et al. Design of a group‐randomized Streptococcus pneumoniae vaccine trial. Controlled Clinical Trials 2001;22(4):438‐52. [DOI] [PubMed] [Google Scholar]
Newell 1992
- Newell DJ. Intention‐to‐treat analysis: implications for quantitative and qualitative research. International Journal of Epidemiology 1992;21(5):837‐41. [DOI] [PubMed] [Google Scholar]
O'Brien 2001
- O'Brien KL, Moulton L, Reid R, Weatherholtz R, Hackell J, Kohberger R, et al. Invasive disease efficacy of a 7‐valent pneumococcal conjugate vaccine among Navajo and White Mountain Apache (N/WMA) children. 19th Annual Meeting of the European Society for Pediatric Infectious Diseases (ESPID) (March 26‐8). Istanbul, Turkey, 2001.
O'Brien 2008
- O'Brien KL, David AB, Chandran A, Moulton LH, Reid R, Weatherholtz R, et al. Randomized controlled trial efficacy of pneumococcal conjugate vaccine against otitis media among Navajo and White Mountain Apache infants. Pediatric Infectious Disease Journal 2008;27(1):71‐3. [DOI] [PubMed] [Google Scholar]
O'Brien 2009a
- O'Brien KL. Personal communication 6 January 2009.
O'Brien 2009b
- O'Brien KL. Pre‐publication Peer Reviewer Commentary 12 May 2009.
O'Brien 2009c
- O'Brien KL. Personal Communication 29 May 2009.
Palmu 2003a
- Palmu A. Personnal communication 7 November 2003.
Palmu 2003b
- Palmu A. Personnal communication 10 November 2003.
PneumoVac 2008
- Siber GR, Klugman KP, Makela PH, editors. Pneumococcal Vaccines: the impact of conjugate vaccine. Washington, DC: American Society for Microbiology, 2008. [Google Scholar]
Prevent Pneumo 2008
- PneumoAdip. Vaccine Introduction: Countries Continue to Express Interest in Introducing Pneumococcal Vaccines. www.preventpneumo.org/vaccine (Accessed 15 October 2008) 2008.
RevMan 2008 [Computer program]
- The Nordic Cochrane Centre. Review Manager (RevMan). Version 5.0. Copenhagen: The Cochrane Collaboration, 2008.
Rwanda 2009
- PneumoAdip. Rwanda Becomes First Developing Nation to Introduce Vaccine for World’s Leading Infectious Child Killer. www.preventpneumo.org/news/releases/upload/Press‐Release_Rwanda_Introduces_PCV.pdf (Accessed 15 May 2009) 2009.
Sazawal 1992
- Sazawal S, Black RE. Meta‐analysis of intervention trials on case‐management of pneumonia in community settings. Lancet 1992;340(8818):528‐33. [DOI] [PubMed] [Google Scholar]
Shann 1986
- Shann F. Etiology of severe pneumonia in children in developing countries. Pediatric Infectious Diseases 1986;5(2):247‐52. [DOI] [PubMed] [Google Scholar]
Singleton 2007
- Singleton RJ, Hennessy TW, Vulkow LR, Hammitt LL, Zulz T, Hurlburt DA, et al. Invasive pneumococcal disease caused by non‐vaccine serotypes among Alaskan native children with high levels of 7‐valent pneumococcal vaccine coverage. Journal of the American Medical Association 2007;297(16):1784‐92. [DOI] [PubMed] [Google Scholar]
Sweeting 2004
- Sweeting MJ, Sutton AJ, Lambert PC. What to add to nothing? Use and avoidance of continuity corrections in meta‐analysis of sparse data. Statistics in Medicine 2004;23(9):1351‐75. [DOI] [PubMed] [Google Scholar]
Tupasi 1990
- Tupasi TE, Lucero MG, Magdangal DM, Mangubat NV, Sunico ME, Torres CU, et al. Etiology of acute lower respiratory tract in children from Alabang, Metro Manila. Review of Infectious Diseases 1990;Suppl 12(8):929‐39. [DOI] [PubMed] [Google Scholar]
UNGA 2000
- United Nations General Assembly. United Nations Millenium Declaration. http://www.un.org/millennium/declaration/ares552e.htm (Accessed September 18, 2000) 2000:1‐9. [A/RES/55/2]
WER 2007
- World Health Organization. WHO position paper on vaccines. Weekly Epidemiological Report March 2007.
Whitney 2003
- Whitney CG, Farley MM, Hadler J, Harrison LH, Bennett MM, Lynfield R, et al. Decline in Invasive Pneumococcal Disease after the introduction of Protein‐polysachharide Conjugate Vaccine. New England Journal of Medicine 2003;348(18):1737‐46. [DOI] [PubMed] [Google Scholar]
WHO 2003
- World Health Organization. Pneumococcal Vaccines. Weekly Epidemiological Record 2003;14:110‐9. [Google Scholar]
References to other published versions of this review
Lucero 2004
- Lucero MG, Dulalia VE, Parreño RAN, Lim‐Quianzon DM, Nohynek H, Makela H, Williams G. Pneumococcal conjugate vaccines for preventing vaccine‐type invasive pneumococcal disease and pneumonia with consolidation on x‐ray in children under two years of age. Cochrane Database of Systematic Reviews 2004, Issue 4. [DOI: 10.1002/14651858.CD004977] [DOI] [PubMed] [Google Scholar]


