

Abstract
Background
Abnormal blood flow patterns in fetal circulation detected by Doppler ultrasound may indicate poor fetal prognosis. It is also possible false positive Doppler ultrasound findings could encourage inappropriate early delivery.
Objectives
The objective of this review was to assess the effects of Doppler ultrasound used to assess fetal well‐being in high‐risk pregnancies on obstetric care and fetal outcomes.
Search methods
We updated the search of the Cochrane Pregnancy and Childbirth Group's Trials Register on 30 September 2013.
Selection criteria
Randomised and quasi‐randomised controlled trials of Doppler ultrasound for the investigation of umbilical and fetal vessels waveforms in high‐risk pregnancies compared with no Doppler ultrasound.
Data collection and analysis
Two review authors independently assessed the studies for inclusion, assessed risk of bias and carried out data extraction. Data entry was checked.
Main results
Eighteen completed studies involving just over 10,000 women were included. The trials were generally of unclear quality with some evidence of possible publication bias. The use of Doppler ultrasound in high‐risk pregnancy was associated with a reduction in perinatal deaths (risk ratio (RR) 0.71, 95% confidence interval (CI) 0.52 to 0.98, 16 studies, 10,225 babies, 1.2% versus 1.7 %, number needed to treat (NNT) = 203; 95% CI 103 to 4352). There were also fewer inductions of labour (average RR 0.89, 95% CI 0.80 to 0.99, 10 studies, 5633 women, random‐effects) and fewer caesarean sections (RR 0.90, 95% CI 0.84 to 0.97, 14 studies, 7918 women). No difference was found in operative vaginal births (RR 0.95, 95% CI 0.80 to 1.14, four studies, 2813 women), nor in Apgar scores less than seven at five minutes (RR 0.92, 95% CI 0.69 to 1.24, seven studies, 6321 babies).
Authors' conclusions
Current evidence suggests that the use of Doppler ultrasound in high‐risk pregnancies reduced the risk of perinatal deaths and resulted in less obstetric interventions. The quality of the current evidence was not of high quality, therefore, the results should be interpreted with some caution. Studies of high quality with follow‐up studies on neurological development are needed.
Keywords: Female; Humans; Pregnancy; Pregnancy, High‐Risk; Ultrasonography, Prenatal; Cesarean Section; Cesarean Section/utilization; Fetal Monitoring; Fetal Monitoring/methods; Labor, Induced; Labor, Induced/utilization; Perinatal Mortality; Randomized Controlled Trials as Topic; Umbilical Cord; Umbilical Cord/blood supply; Umbilical Cord/diagnostic imaging
Doppler ultrasound of fetal vessels in pregnancies at increased risk of complications
Whilst in high‐income countries most babies grow well in the womb, sometimes the mother might have a medical problem, such as diabetes, high blood pressure, heart or kidney problems, that impacts on the growth of the baby. Also, sometimes babies just do not grow well for reasons we do not fully understand. These babies with poor growth can be at increased risk of complications which can result in increased mortality or morbidity. Doppler ultrasound detects changes in the pattern of blood flow through the baby's circulation. It may be that problems for the baby could be identified through these changes. Interventions, like early delivery, might then be able to reduce the mortality and morbidity. However, it may also be that the use of Doppler ultrasound could increase the use of caesarean section.
The review of trials identified 18 studies involving just over 10,000 women. These studies compared the use of Doppler ultrasound of the babies vessels in utero with no Doppler or with cardiotocography (CTG sometimes known as electronic fetal monitoring). There was a reduction in the number of babies who died, fewer caesarean sections and operative deliveries, but the quality of the studies was not high and there remains some uncertainty here. Further studies of high quality would, therefore, be helpful.
Summary of findings
Summary of findings for the main comparison.
Fetal and umbilical Doppler ultrasound compared with no Doppler ultrasound for pregnant women at increased risk of fetal complications
| Fetal and umbilical Doppler ultrasound compared to no Doppler ultrasound for pregnant women at increased risk of fetal complications | ||||||
| Patient or population: pregnant women at increased risk of fetal complications Settings: antenatal clinics or inpatient wards Intervention: Fetal and umbilical Doppler ultrasound Comparison: no Doppler ultrasound | ||||||
| Outcomes | Illustrative comparative risks* (95% CI) | Relative effect (95% CI) | No of Participants (studies) | Quality of the evidence (GRADE) | Comments | |
| Assumed risk | Corresponding risk | |||||
| no Doppler ultrasound | Fetal and umbilical Doppler ultrasound | |||||
| Any perinatal death after randomisation | Study population | RR 0.71 (0.52 to 0.98) | 10225 (16 studies) | ⊕⊝⊝⊝ very low1,2,3 | ||
| 17 per 1000 | 12 per 1000 (9 to 17) | |||||
| Medium‐risk population | ||||||
| 15 per 1000 | 11 per 1000 (8 to 15) | |||||
| Serious neonatal morbidity ‐ singleton pregnancy | Study population | RR 0.12 (0.02 to 0.99) | 500 (1 study) | ⊕⊝⊝⊝ very low1,4 | ||
| 12 per 1000 | 1 per 1000 (0 to 12) | |||||
| Medium‐risk population | ||||||
| 32 per 1000 | 4 per 1000 (1 to 32) | |||||
| Serious neonatal morbidity ‐ multiple pregnancy | See comment | See comment | Not estimable | 0 (0) | See comment | No studies have looked at serious neonatal morbidity in multiple pregnancies when comparing fetal and umbilical Doppler ultrasound with no Doppler ultrasound. |
| Caesarean section (elective and emergency) | Study population | RR 0.9 (0.84 to 0.97) | 7918 (14 studies) | ⊕⊕⊝⊝ low1,5 | ||
| 0 per 1000 | 0 per 1000 (0 to 0) | |||||
| Medium‐risk population | ||||||
| 280 per 1000 | 252 per 1000 (235 to 272) | |||||
| Induction of labour | Study population | RR 0.89 (0.8 to 0.99) | 5633 (10 studies) | ⊕⊕⊝⊝ low1,6,7 | ||
| 334 per 1000 | 297 per 1000 (267 to 331) | |||||
| Medium risk population | ||||||
| 341 per 1000 | 303 per 1000 (273 to 338) | |||||
| Apgar < 7 at 5 minutes | Study population | RR 0.92 (0.69 to 1.24) | 6321 (7 studies) | ⊕⊕⊝⊝ low1,8,9 | ||
| 29 per 1000 | 27 per 1000 (20 to 36) | |||||
| Medium‐risk population | ||||||
| 24 per 1000 | 22 per 1000 (17 to 30) | |||||
| Long‐term infant neurodevelopmental outcome | See comment | See comment | Not estimable | 0 (0) | See comment | There has been no comparative long term follow‐up of babies exposed to Doppler ultrasound in pregnancy in women at increased risk of complications. |
| *The basis for the assumed risk (e.g. the median control group risk across studies) is provided in footnotes. The corresponding risk (and its 95% confidence interval) is based on the assumed risk in the comparison group and the relative effect of the intervention (and its 95% CI). CI: Confidence interval; RR: Risk ratio; | ||||||
| GRADE Working Group grades of evidence High quality: Further research is very unlikely to change our confidence in the estimate of effect. Moderate quality: Further research is likely to have an important impact on our confidence in the estimate of effect and may change the estimate. Low quality: Further research is very likely to have an important impact on our confidence in the estimate of effect and is likely to change the estimate. Very low quality: We are very uncertain about the estimate. | ||||||
1 Too much missing information. 2 The 153 events are below the recommended level of 300 needed for precision. 3 Funnel plot asymmetry test gives P = 0.057, suggesting significant asymmetry thus indicating publication bias. 4 The nine events are very seriously below the recommended 300 needed for precision. 5 Funnel plot asymmetry test is just non‐significant (P = 0.12), but guidance from a statistician suggests visually there appears to be small studies missing indicating some publication bias. 6 There was evidence of heterogeneity with T‐squ = 0.01; Chi2 P = 0.08; I2 = 41%. 7 Funnel plot asymmetry test gives P = 0.35 ‐ so not significant. 8 The 174 events is below the recommended level of 300 needed for precision. 9 Funnel plot symmetry test is P = 0.76, so not significant.
Background
The previous version of this review (Neilson 1996) was split into two separate reviews, for which new protocols were prepared. This present review covers Doppler ultrasound of fetal vessels including umbilical arteries in women at high risk of fetal compromise. The other review covers Doppler ultrasound of utero‐placental circulation (Utero‐placental Doppler ultrasound for improving pregnancy outcome;Stampalija 2010). In addition, we will update the review of 'routine' use of Doppler ultrasound in low‐risk pregnant women (Fetal and umbilical Doppler ultrasound in normal pregnancy;Alfirevic 2010b).
Description of the condition
When it comes to the provision of antenatal care or research, pregnant women tend to be divided into low‐ and high‐risk populations; however, the boundaries between the groups are often blurred. For most researchers, ‘high‐risk status’ includes maternal conditions associated with increased perinatal mortality and morbidity such as diabetes, hypertensive disorders (chronic hypertension and pre‐eclampsia), cardiac, renal and autoimmune disorders (Fisk 2001; Graves 2007; Westergaard 2001). More recently, thrombophilias (congenital and acquired) have been added to this list (Alfirevic 2002; Greer 1999).
Of the conditions specific to pregnancy, fetal growth restriction, antepartum haemorrhage, multiple pregnancy and prolonged pregnancy tend to be regarded as ‘high risk’ (Bernstein 2000; Westergaard 2001).
It is important to stress that the fetal growth restriction is often confused with the concept of being small‐for‐gestational age. Some fetuses are constitutionally small and they do not have increased perinatal morbidity and mortality. Our inability to distinguish easily between small, but healthy fetuses and those who are failing to reach their growth potential has hampered attempts to find appropriate treatment for growth restriction. Growth restricted fetuses, who may or may not be small for dates are at increased risk of mortality and serious morbidity (intraventricular haemorrhage, bronchopulmonary dysplasia, necrotising enterocolitis, infection, pulmonary haemorrhage, hypothermia and hypoglycaemia) (Fisk 2001). Early antenatal detection, treatment where appropriate, and timely delivery could minimise the risks significantly.
In multiple pregnancies, most of the excess morbidity and mortality can be attributed to preterm birth and to pathology associated with twin‐to‐twin transfusion syndrome (TTTS) in monochorionic pregnancies. However, growth discordance or selective intrauterine growth restriction (IUGR) are more common that TTTS (Ortibus 2009). The pathophysiological nature of the TTTS differs from other placental pathology with specific impact on the fetal haemodynamics. Different monitoring and treatment strategies are needed for this condition and for this reason we planned to exclude this subgroup of multiple pregnancies from this review if such information is available.
The most commonly used methods for the assessment of fetal well‐being in high‐risk pregnancies include fetal cardiotocography (CTG) (Pattison 1999), biophysical profile (Lalor 2008) and Doppler studies of the fetal circulation. This review focuses on the role of fetal and umbilical Doppler ultrasound as a test of fetal well‐being in high‐risk pregnancies.
Description of the intervention
The use of Doppler ultrasound to investigate the pattern of waveforms in the umbilical artery during pregnancy was first reported in 1977 from Dublin (Fitzgerald 1977). The waveforms were derived from the changes in the ultrasound frequency of the Doppler signal, which targeted circulating fetal blood within the umbilical artery. Such flow velocity waveforms (FVW) from the feto‐placental circulation are dependent on the fetal cardiac contraction force, density of the blood, the vessel wall elasticity and peripheral or downstream resistance (Giles 1985; Owen 2001). It was suggested that the FVWs should be obtained with the mother in a semi–recumbent position during a period of fetal inactivity, as the impedance indices are moderated by fetal breathing and elevated fetal heart rates (Mires 2000).
Different types of measurements have been described in an attempt to quantify the Doppler signals accurately and reproducibly (Chen 1996; Mari 2009; Owen 2001). The indices are calculated as ratios between peak systolic velocity (A), end‐diastolic peak velocity (B) and mean velocity (mean). The most common in clinical practice are pulsatility index (PI = (A ‐ B)/mean)) and resistant index (RI = (A ‐ B)/A) (Burns 1993). Ideally, the measurements have to be done on several consecutive identical wave forms with the angle of the insonation as close to zero as possible (Burns 1993).
Observational studies have demonstrated that in the presence of normal placental function the umbilical artery waveform has a pattern compatible with a low‐resistance system, displaying forward blood flow throughout the cardiac cycle (Neilson 1987).
Initial studies have focused on umbilical arteries and veins, but better equipment has allowed studies of carotid and intracranial arteries, aorta, coronary circulation (Baschat 2002), mesenteric artery and the venous circulation (ductus venosus, inferior vena cava and vena Galena) (Cheema 2004; Owen 2001). The assessment of utero‐placental arteries has also been investigated (Trudinger 1985a; Trudinger 1985b) and has been reviewed in a separate Cochrane review (Utero‐placental Doppler ultrasound for improving pregnancy outcome;Stampalija 2010).
When inadequate vascularisation of the placenta occurs (placental insufficiency), the haemodynamic changes in the feto‐placental circulation develop, often in a progressive fashion. Doppler indices from the umbilical artery start to increase when approximately 60% to 70% of the placental vascular tree is not functioning (Thompson 1990). This tends to be followed by a decrease in the impedance to blood flow in the middle cerebral artery as a consequence of “brain sparing effect” (Hecher 2001), while the resistance increases in aortic blood flow (Ferrazzi 2002; Hecher 2001). This redistribution of the blood flow allows preferential oxygenation of fetal vital organs such as brain and heart. Late Doppler changes include absent or reverse end diastolic flow in the umbilical artery (Al‐Ghazali 1990; Nicholaides 1988) and increase in the resistance of venous blood flow (ductus venosus and inferior vena cava) (Baschat 2001; Ferrazzi 2002). Higher resistance in venous circulation reflects the elevation of right heart afterload and increase of the intraventricular pressure caused by hypoxaemia of the myocardium. Those changes correlate well with fetal acidosis (Bilardo 1990; Weiner 1990).
How the intervention might work
The time scale over which placental insufficiency and fetal compensatory changes develop varies and depends on underlying maternal and fetal pathology and gestational age. It is, therefore, difficult to apply the same management protocol to all women with abnormal Doppler findings. Normal Doppler findings do provide some reassurance and may, in some circumstances, reduce the need for hospitalisation and additional fetal monitoring, but this is not always the case. There is also some suggestion that normal umbilical artery Doppler ultrasound cannot be assumed to mean low risk where the fetus is small (Figueras 2008). An abnormal Doppler finding tends to trigger management protocols that vary significantly, not only between low‐ and high‐income countries, but also from unit to unit in the same country. The most important factors that determine subsequent management are gestation, availability of additional monitoring methods (computerised CTG, biophysical profile, colour Doppler) and neonatal intensive care availability.
The GRIT study showed that although the delay in delivery (around four days) may lead to more stillbirths, overall number of perinatal deaths is not reduced by an immediate delivery (GRIT 2003). Importantly, the study showed that at the two years follow‐up, the immediate delivery group showed a trend towards more neurological disability (GRIT 2004).
Recently, considerable interest has been generated by observations that ductus venous flow may be a good predictor of perinatal outcome (Baschat 2001; Bilardo 2004; Ferrazzi 2002). The ongoing TRUFFLE study has been designed to compare reduced short‐term variation on CTG, early ductus venosus changes or late ductus venosus changes as a trigger for delivery of the growth restricted babies (Lees 2005).
Ultimately, the goal of any Doppler‐triggered management protocol is to improve perinatal mortality and morbidity. An unnecessary early intervention may result in excess morbidity from prematurity, whilst a delay may result in a stillbirth or severely compromised newborn (GRIT 2003).
Why it is important to do this review
The first meta‐analysis of umbilical artery Doppler in high‐risk pregnancies was published in 1995 (Alfirevic 1995; Neilson 1995), demonstrating improvement with Doppler in a number of clinical outcomes and possible reduction in perinatal deaths (Neilson 1995). Since then, ultrasound technology has moved on and much more complex assessment of fetal circulation has become standard clinical practice in fetal medicine units worldwide. However, the potential for benefit from the new methods has to be balanced with the potential for harm (inappropriate interventions, or lack of them).
Another Cochrane review has analysed the role of Doppler ultrasound in routine practice (Bricker 2007), and doubts have been expressed about its benefit as a screening tool in all pregnancies. The use of utero‐placental Doppler ultrasound is the subject of another Cochrane review (Utero‐placental Doppler ultrasound for improving pregnancy outcome;Stampalija 2010). However, when both fetal and utero‐placental Doppler assessments are used in high‐risk pregnancies, the study will be included here because clinical judgements tends to rest on the fetal assessment.
Objectives
To assess whether the use of fetal and umbilical Doppler ultrasound in high‐risk pregnancies improves subsequent obstetric care and fetal outcome.
Methods
Criteria for considering studies for this review
Types of studies
All randomised trials and quasi‐randomised studies comparing Doppler ultrasound (fetal and umbilical circulations) in pregnancies considered to be at high risk of fetal compromise.
Types of participants
Women with pregnancies considered to be at 'high risk' for fetal compromise, e.g. intrauterine growth restriction, post‐term pregnancies, previous pregnancy loss, women with hypertension, women with diabetes or other maternal pathology (e.g. thrombophilia). We planned to include twin pregnancies, separating monochorionic and dichorionic pregnancies where possible.
Types of interventions
Doppler ultrasound of the fetal and umbilical vessels for fetal assessment in pregnancies in high‐risk populations. We have excluded utero‐placental Doppler studies (as these are assessed in a separate review). However, where umbilical artery or fetal Doppler was combined with utero‐placental Doppler, the study has been included in this review.
Comparisons
Doppler ultrasound of fetal vessels versus no Doppler ultrasound of fetal vessels (including comparisons of Doppler ultrasound of fetal vessels revealed versus Doppler ultrasound of fetal vessels concealed).
Doppler ultrasound of fetal vessels versus other forms of monitoring, e.g. cardiotocography, biophysical profile.
Comparison of different forms of Doppler ultrasound of fetal vessels versus other types of Doppler ultrasound of fetal vessels.
Combination of umbilical artery or fetal Doppler with utero‐placental Doppler (uterine artery Doppler) versus either no other monitoring or additional monitoring.
Types of outcome measures
We have selected outcome measures with the help of a proposed core data set of outcome measures (Devane 2007).
Primary outcomes
Any perinatal death after randomisation.
Serious neonatal morbidity ‐ composite outcome including hypoxic ischaemic encephalopathy, intraventricular haemorrhage (IVH), bronchopulmonary dysplasia (BPD), necrotising enterocolitis (NEC).
Secondary outcomes
Stillbirth.
Neonatal death.
Any potentially preventable perinatal death*.
Fetal acidosis.
Apgar score less than seven at five minutes.
Caesarean section (both elective and emergency).
Spontaneous vaginal birth.
Operative vaginal birth.
Induction of labour.
Oxytocin augmentation.
Neonatal resuscitation required.
Infant requiring intubation/ventilation.
Neonatal fitting/seizures.
Preterm labour (onset of labour before 37 completed weeks of pregnancy).
Gestational age at birth.
Infant respiratory distress syndrome.
Meconium aspiration.
Neonatal admission to special care or intensive care unit, or both.
Hypoxic ischaemic encephalopathy (a condition of injury to the brain).
IVH.
BPD.
NEC.
Infant birthweight.
Length of infant hospital stay.
Long‐term infant/child neurodevelopmental outcome.
Women's views of their care.
* Perinatal death excluding chromosomal abnormalities, termination of pregnancies, birth before fetal viability (as defined by trialists) and fetal death before use of the intervention.
Non‐prespecified outcomes are also reported if we consider them to be important.
Search methods for identification of studies
Electronic searches
We contacted the Trials Search Co‐ordinator to update the update the search of the Cochrane Pregnancy and Childbirth Group's Trials Register (30 September 2013)
The Cochrane Pregnancy and Childbirth Group’s Trials Register is maintained by the Trials Search Co‐ordinator and contains trials identified from:
monthly searches of the Cochrane Central Register of Controlled Trials (CENTRAL);
weekly searches of MEDLINE;
weekly searches of Embase;
handsearches of 30 journals and the proceedings of major conferences;
weekly current awareness alerts for a further 44 journals plus monthly BioMed Central email alerts.
Details of the search strategies for CENTRAL, MEDLINE and Embase, the list of handsearched journals and conference proceedings, and the list of journals reviewed via the current awareness service can be found in the ‘Specialized Register’ section within the editorial information about the Cochrane Pregnancy and Childbirth Group.
Trials identified through the searching activities described above are each assigned to a review topic (or topics). The Trials Search Co‐ordinator searches the register for each review using the topic list rather than keywords.
Searching other resources
We also planned to look for additional studies in the reference lists of the studies identified.
We did not apply any language restrictions.
Data collection and analysis
For methods used in the previous version of this review (Alfirevic 2010), seeAppendix 1.
In this 2013 update, no new trial reports were identified. In future updates, if trials are identified for inclusion, we will use the methods outlined in Appendix 2.
Results
Description of studies
Results of the search
The search identified 29 studies of which 18 have been included involving 10,156 women, 10 have been excluded and one study is ongoing (Lees 2005). For further details of trial characteristics, please refer to the tables of Characteristics of included studies, Characteristics of excluded studies and Ongoing studies. The updated search in September 2013 retrieved no new studies.
Included studies
Most studies included Doppler assessments in both experimental and control groups, with the Doppler results being revealed to clinicians only in the 'Doppler group' (Burke 1992; Biljan 1992; de Rochambeau 1992; Giles 2003; Johnstone 1993; Neales 1994; Newnham 1991; Nienhuis 1997; Nimrod 1992; Norman 1992; Ott 1998; Pattinson 1994; Trudinger 1987; Tyrrell 1990). Doppler ultrasound was used as an addition to the standard fetal monitoring (e.g. cardiotocography (CTG), biophysical profile, fetal biometry).
Seven of these studies involved singleton pregnancies only (de Rochambeau 1992; Biljan 1992; Neales 1994; Nienhuis 1997; Ott 1998; Trudinger 1987; Tyrrell 1990) and one study of 539 women involved twin pregnancies only (Giles 2003). Two studies assessed a mixture of singleton and multiple pregnancies with 40/2289 (1.7%) being twin pregnancies in Johnstone 1993 and 40/505 (7.9%) being twin pregnancies in Newnham 1991. Four studies did not state whether they included just singleton pregnancies or not (Burke 1992; Nimrod 1992; Norman 1992; Pattinson 1994).
Four studies compared Doppler ultrasound alone versus CTG alone in women whose pregnancies were considered at increased risk of problems (Almstrom 1992; Haley 1997; Hofmeyr 1991; Williams 2003). Of these, three involved singleton pregnancies only (Almstrom 1992; Haley 1997; Williams 2003) and one study did not specify (Hofmeyr 1991).
Gestational age for inclusion in studies was not reported on in six studies, and the remainder of the studies varied in the gestational ages they included from 24 weeks' gestation to those studies looking at the value of Doppler ultrasound when women have gone beyond 40 weeks (Characteristics of included studies).
Excluded studies
Ten of the 29 potentially eligible studies were excluded. In five studies, the participants were described as 'unselected populations' (Davies 1992; Newnham 1993; Omtzigt 1994; Schneider 1992; Whittle 1994); in one study the participants were women considered at low risk of complications (Mason 1993); one study was not a randomised study (McCowan 1996); in one study the full report was not available and there were no data in the conference abstract (Gonsoulin 1991) and in two studies the information was considered unreliable (McParland 1988; Pearce 1992).
Risk of bias in included studies
The quality of the 18 completed included studies was difficult to assess due to lack of information, particularly in terms of randomisation and concealment of allocation (Figure 1).
Figure 1.
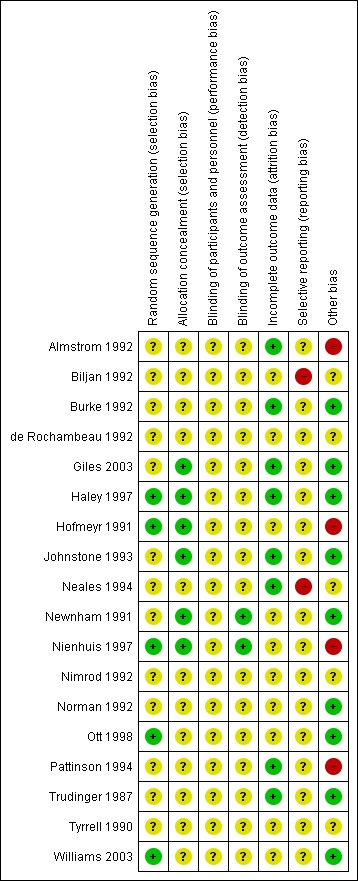
Methodological quality summary: review authors' judgements about each methodological quality item for each included study.
Allocation
Only three studies had adequate sequence generation and concealment allocation (Haley 1997; Hofmeyr 1991; Nienhuis 1997). Two studies had adequate sequence generation but allocation concealment was unclear (Ott 1998; Williams 2003). In three studies, concealment allocation was judged as adequate, but sequence generation was unclear (Giles 2003; Johnstone 1993; Newnham 1991). The remaining nine studies had both unclear sequence generation and unclear concealment allocation (Almstrom 1992; Biljan 1992; Burke 1992; de Rochambeau 1992; Neales 1994; Nimrod 1992; Norman 1992; Pattinson 1994; Trudinger 1987; Tyrrell 1990).
Blinding
Blinding women and/or staff in these trials was not generally feasible. Even in the studies where Doppler ultrasound was either revealed or concealed, some outcomes, such as induction of labour and caesarean section are clearly going to be influenced by the knowledge of Doppler results, but it may not be possible to avoid bias in neonatal assessment. Unfortunately, the information on the attempts to protect against biased assessment was often not available. In two studies (Newnham 1991; Nienhuis 1997), assessors of neonatal outcomes were indeed blind to Doppler results.
Incomplete outcome data
Incomplete outcome data were addressed adequately in eight studies (Almstrom 1992; Burke 1992; Giles 2003; Haley 1997; Johnstone 1993; Neales 1994; Pattinson 1994; Trudinger 1987) and unclear in 10 studies (Biljan 1992; de Rochambeau 1992; Hofmeyr 1991; Newnham 1991; Nienhuis 1997; Nimrod 1992; Norman 1992; Ott 1998; Tyrrell 1990; Williams 2003). Only a few studies provided full information on the number of women approached to take part in the studies, the numbers eligible for inclusion, and the overall refusal rate. While not sources of bias as such, high exclusion and refusal rates may affect the generalisability of the findings and the interpretation of the results.
Selective reporting
Almost all the studies, except two, were assessed as unclear because we did not assess the trial protocols. Two studies were considered to have some degree of selective reporting bias (Biljan 1992; Neales 1994).
Other potential sources of bias
Nine studies were judged to be free of other sources of bias (Burke 1992; Giles 2003; Haley 1997; Johnstone 1993; Newnham 1991; Norman 1992; Ott 1998; Trudinger 1987; Williams 2003); five studies were unclear (Biljan 1992; de Rochambeau 1992; Neales 1994; Nimrod 1992; Tyrrell 1990); and four studies were considered to have some other source of bias (Almstrom 1992; Hofmeyr 1991; Nienhuis 1997; Pattinson 1994).
Sensitivity analyses
For sensitivity analyses by quality of studies, we have used both adequate labelled sequence generation and adequate allocation concealment as essential criteria for high quality. Only three of the 18 studies met these criteria (Haley 1997; Hofmeyr 1991; Nienhuis 1997), see Figure 1.
Effects of interventions
See: Table 1
This review includes 18 studies involving 10,156 women and has 58 meta‐analyses.
1) Doppler ultrasound versus no Doppler ultrasound (18 studies, 10,156 women)
We have included here all 18 completed studies, including those that compared Doppler ultrasound alone versus CTG alone, as we wished to get an overall assessment of whether using Doppler ultrasound was beneficial. A separate comparison of studies where Doppler was used as an alternative to CTG was also undertaken, and these findings are reported below under 2) 'Doppler ultrasound alone versus CTG alone'.
As mentioned above, the quality of the studies included in this comparison was often unclear, particularly in terms of randomisation and concealment allocation.
Primary outcomes
It is important to emphasise that this review still remains underpowered to detect clinically important differences in serious neonatal morbidity.
Any perinatal mortality after randomisation (16 studies, 10,225 babies)
The difference in perinatal mortality between the two groups was statistically significant (risk ratio (RR) 0.71, 95% confidence interval (CI) 0.52 to 0.98, 16 studies, 10,225 babies, 1.2% versus 1.7%, number needed to treat to treat (NNT) 203, 95% CI 103 to 4352, Analysis 1.1). A sensitivity analysis including only the three studies of high quality (low risk of bias for sequence generation and concealment allocation) (Haley 1997; Hofmeyr 1991; Nienhuis 1997) showed no statistically significant difference, though, clearly, the numbers are small and it lacks the power of the overall analysis (RR 0.61, 95% CI 0.24 to 1.53, three studies, 1197 babies).
Analysis 1.1.

Comparison 1 Doppler ultrasound versus no Doppler ultrasound, Outcome 1 Any perinatal death after randomisation.
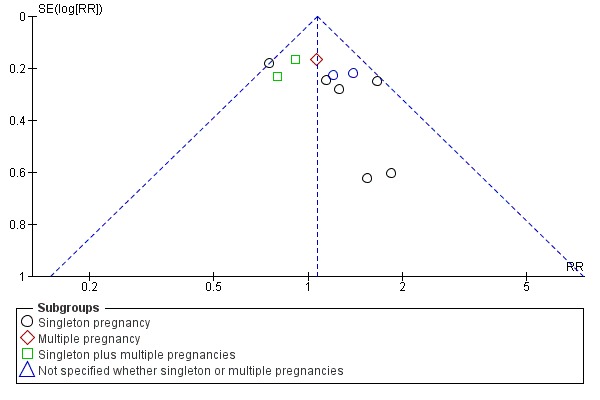
There is no evidence that the treatment effect varies between subgroups as CIs overlap (Analysis 1.1) although the risk ratio for the singleton subgroup was somewhat lower compared with the others (RR = 0.59 compared with 0.88, 0.86 and 0.68). There is significant evidence of funnel plot asymmetry ('small‐study effects' P = 0.057 using Harbord 2006) indicating publication bias (Figure 2). This is of concern given the borderline significance of the pooled meta‐analysis result.
Figure 2.
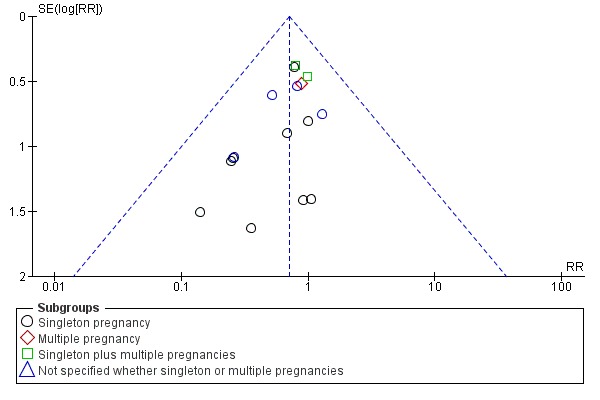
Funnel plot of comparison: 1 Doppler ultrasound versus no Doppler ultrasound, outcome: 1.1 Any perinatal death after randomisation.
It is also important to note that we did not adjust for the non‐independence of twins because of the lack of reported inter‐correlation coefficients (ICC).
Serious neonatal morbidity (three studies, 1098 babies)
Only three studies reported relevant neonatal morbidity data (Newnham 1991; Norman 1992; Tyrrell 1990) showing no significant differences in serious perinatal morbidity between women having Doppler ultrasound and those monitored by standard methods (Analysis 1.2). The heterogeneity was high (Tau2 = 3.84, Chi2 P = 0.04, I2 = 76%) and the numbers of babies with serious morbidity too small to be able to say anything with any degree of certainty. We have therefore, on the advice from our statistician, decided not to pool the data for this outcome.
Analysis 1.2.
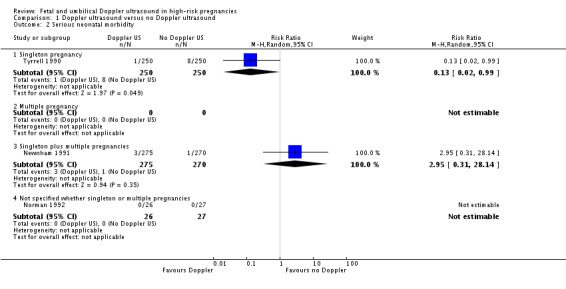
Comparison 1 Doppler ultrasound versus no Doppler ultrasound, Outcome 2 Serious neonatal morbidity.
Secondary outcomes
The difference in perinatal deaths remained significant when the analysis focused just on potentially preventable perinatal deaths (RR 0.67, 95% CI 0.46 to 0.98, 16 studies, 10,225 babies, Analysis 1.5).
Analysis 1.5.
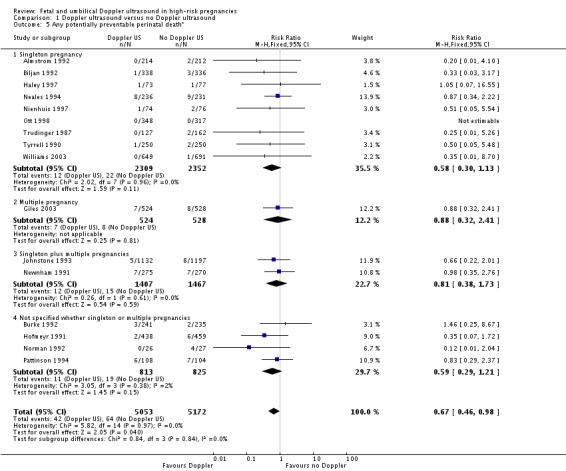
Comparison 1 Doppler ultrasound versus no Doppler ultrasound, Outcome 5 Any potentially preventable perinatal death*.
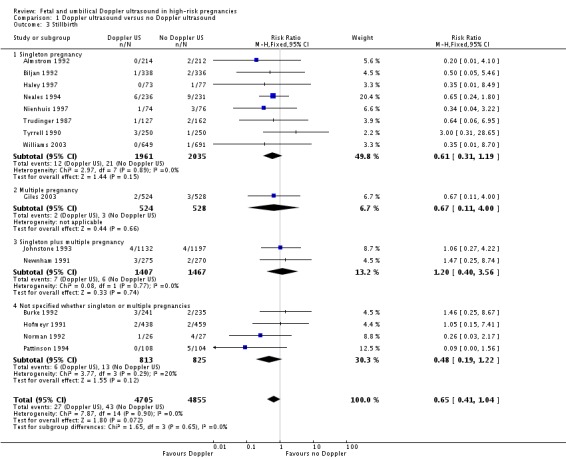
The data for stillbirths (Analysis 1.3), neonatal deaths (Analysis 1.4) and low Apgar score (Analysis 1.7) are consistent with the overall picture showing fewer adverse outcomes in the Doppler group, but these did not reach statistical significance.
Analysis 1.3.
Comparison 1 Doppler ultrasound versus no Doppler ultrasound, Outcome 3 Stillbirth.
Analysis 1.4.

Comparison 1 Doppler ultrasound versus no Doppler ultrasound, Outcome 4 Neonatal death.
Analysis 1.7.
Comparison 1 Doppler ultrasound versus no Doppler ultrasound, Outcome 7 Apgar < 7 at 5 minutes.
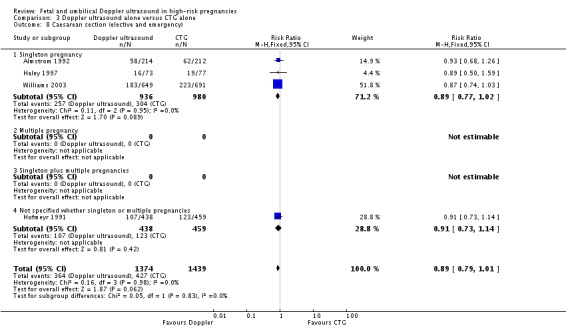
The reduction in caesarean sections with the use of Doppler ultrasound (Analysis 1.8; Analysis 1.9; Analysis 1.10) was statistically significant (RR 0.90, 95% CI 0.84 to 0.97, 14 studies, 7918 women, Analysis 1.8), though the upper limit of the confidence interval was close to one. When caesarean sections were reported as either elective and emergency, the reduction in caesareans appeared to be confined to the emergency procedures. This is something that will be explored in a meta‐regression in future updates if more data become available.
Analysis 1.8.

Comparison 1 Doppler ultrasound versus no Doppler ultrasound, Outcome 8 Caesarean section (elective and emergency).
Analysis 1.9.

Comparison 1 Doppler ultrasound versus no Doppler ultrasound, Outcome 9 Caesarean section ‐ elective.
Analysis 1.10.
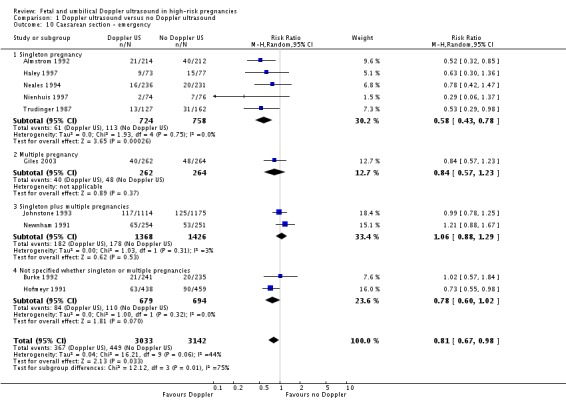
Comparison 1 Doppler ultrasound versus no Doppler ultrasound, Outcome 10 Caesarean section ‐ emergency.
There was also some evidence of publication bias in the funnel plots (Figure 3; Figure 4; Figure 5). The Harbord test (Harbord 2006) for all caesarean sections was non‐significant (P = 0.12) but visually there does appear to be asymmetry indicating there may be some small studies missing. This is of concern because the pooled meta‐analysis result is only borderline significant. With elective caesarean sections, there was evidence of asymmetry (P = 0.1) and the visual assessment indicating the 'missing' studies are those below a relative risk of one, so the pooled result is likely to be even closer to the null. For emergency caesarean sections, there was significant evidence of asymmetry (P = 0.09), again this being a small‐study effect. There is also heterogeneity which can contribute to funnel plot asymmetry, so overall we should be cautious about the significance of the pooled result.
Figure 3.
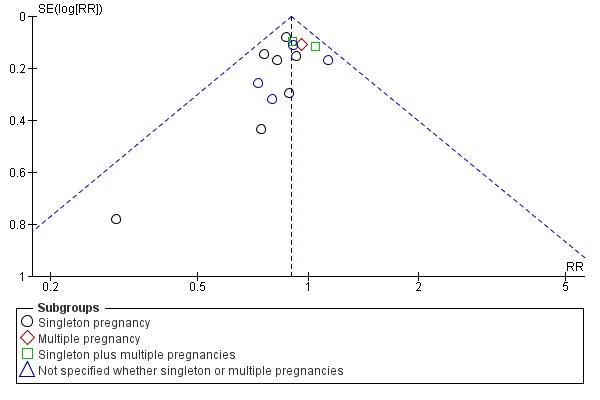
Funnel plot of comparison: 1 Doppler ultrasound versus no Doppler ultrasound, outcome: 1.8 Cesarean section (elective and emergency).
Figure 4.
Funnel plot of comparison: 1 Doppler ultrasound versus no Doppler ultrasound, outcome: 1.9 Cesarean section ‐ elective.
Figure 5.

Funnel plot of comparison: 1 Doppler ultrasound versus no Doppler ultrasound, outcome: 1.10 Cesarean section ‐ emergency.
Caesearen section results for subgroups based on the populations (singletons, multiples, not specified) were consistent with overall effect in terms of the direction and size. However, the heterogeneity in the subgroup of emergency caesarean section was high and, therefore, random‐effects were used for pooling (average RR 0.81, 95% CI 0.67 to 0.98) (Analysis 1.10). This analysis provides evidence that the average relative risk across studies is significantly less than one, indicating a reduction in emergency caesarean section. However, we also calculated the 95% prediction interval for the underlying effect in any future studies (PI = 0.49 to 1.35); this indicates that the underlying risk ratio may be greater than one in an individual study due to the between‐study heterogeneity.
Overall, there were no significant differences identified in spontaneous vaginal births and operative vaginal births for women having the Doppler ultrasound compared with women not having the Doppler ultrasound (Analysis 1.11; Analysis 1.12).
Analysis 1.11.

Comparison 1 Doppler ultrasound versus no Doppler ultrasound, Outcome 11 Spontaneous vaginal birth.
Analysis 1.12.
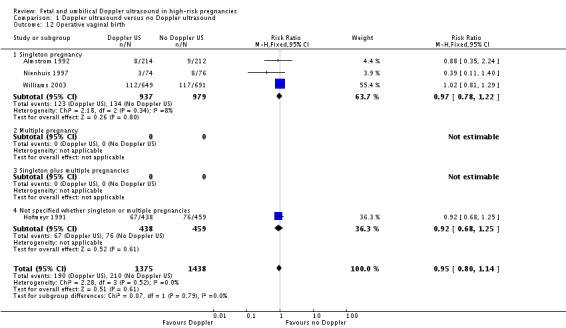
Comparison 1 Doppler ultrasound versus no Doppler ultrasound, Outcome 12 Operative vaginal birth.
There was, however, a significant average reduction in induction of labour for women with the Doppler intervention (average RR 0.89, 95% CI 0.80 to 0.99, 10 studies, 5633 women, random‐effects [T2 = 0.01, Chi2 P = 0.08, I2 = 41%], prediction interval 0.68 to 1.16, Analysis 1.13). Although the average effect across studies is statistically significant, the prediction interval suggests that, due to the between‐study heterogeneity, we cannot rule out that the underlying effect in a future study may actually increase induction of labour. There may be some clinical heterogeneity around the assessment of induction of labour due to the varying methods and timings of this intervention.
Analysis 1.13.
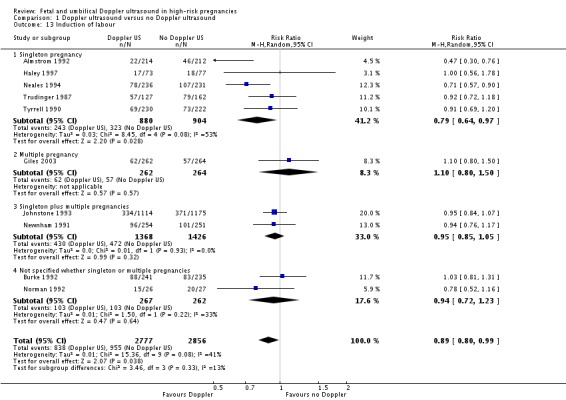
Comparison 1 Doppler ultrasound versus no Doppler ultrasound, Outcome 13 Induction of labour.
There was no difference identified overall in intubation or ventilation (average RR 1.42, 95% CI 0.87 to 2.30, six studies, 3136 babies, Analysis 1.16). Again, random‐effects were used because of high heterogeneity (T2 = 0.14, Chi2 P = 0.09, I2 = 47%) and a wide prediction interval was estimated due to the large heterogeneity and small number of studies in the meta‐analysis (PI 0.41 to 4.94, Analysis 1.16).
Analysis 1.16.
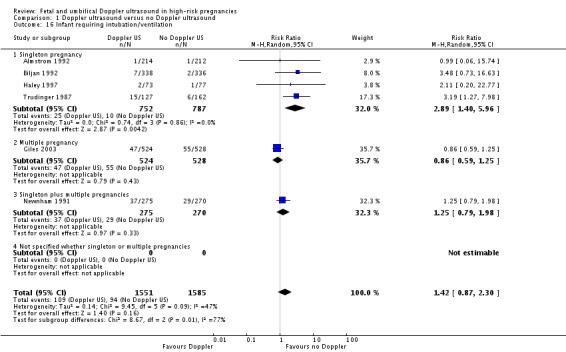
Comparison 1 Doppler ultrasound versus no Doppler ultrasound, Outcome 16 Infant requiring intubation/ventilation.
There was evidence of a difference between subgroups (interaction test for inverse variance analysis gives Chi² = 8.67, df = 2 (P = 0.01)) suggesting that there may be an effect in singletons but not in multiple pregnancies. The data are limited because there is only one trial in multiples and one with singleton and multiples combined. Further studies are needed to confirm if there is a difference here or not.
Overall, there was a small but significant increase in gestational age for babies exposed to Doppler ultrasound (average mean difference (MD) 0.21, 95% CI ‐0.02 to 0.43, eight studies, 4066 babies, random‐effects [T2=0.04, Chi2 P = 0.11, I2 = 40%], Analysis 1.28). However, the prediction interval suggests that, due to between study heterogeneity, we cannot rule out that a future study may show a decrease in gestational age. This finding may, therefore, have little clinical significance.
Analysis 1.28.
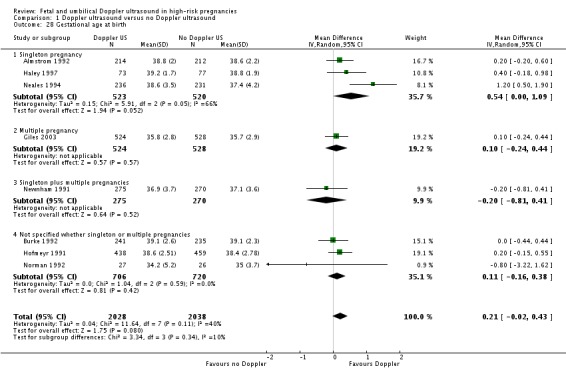
Comparison 1 Doppler ultrasound versus no Doppler ultrasound, Outcome 28 Gestational age at birth.
There was a significant reduction in the length of infant hospital stay in singleton pregnancies that had Doppler intervention (standardised MD (SMD) ‐0.28, 95% CI ‐0.40 to ‐0.16, three studies, 1076 babies, Analysis 1.30).
Analysis 1.30.
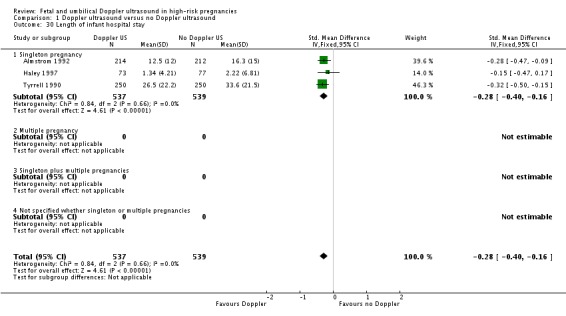
Comparison 1 Doppler ultrasound versus no Doppler ultrasound, Outcome 30 Length of infant hospital stay.
We have also included reported data for all other pre‐specified secondary outcomes when available, none of which conclusively showed clinically important differences between groups.
Non‐prespecified outcomes
For completeness, we have also included the graphs for eight clinically relevant outcomes that were not pre‐specified in our protocol (Analysis 1.31; Analysis 1.32; Analysis 1.33; Analysis 1.34; Analysis 1.35; Analysis 1.36; Analysis 1.37; Analysis 1.38).
Analysis 1.31.

Comparison 1 Doppler ultrasound versus no Doppler ultrasound, Outcome 31 Birth < 34 weeks (not prespecified).
Analysis 1.32.
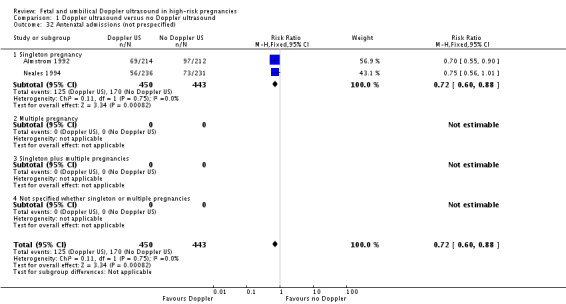
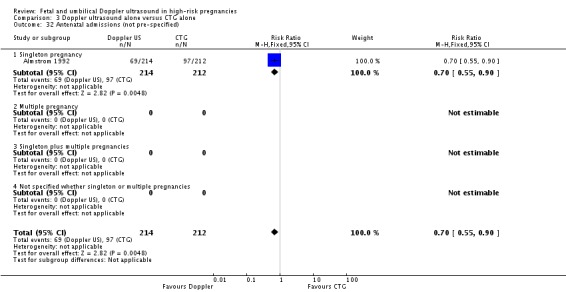
Comparison 1 Doppler ultrasound versus no Doppler ultrasound, Outcome 32 Antenatal admissions (not prespecified).
Analysis 1.33.
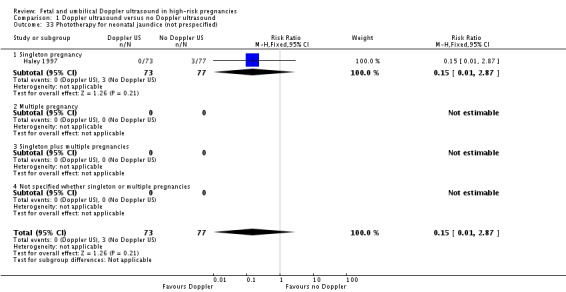
Comparison 1 Doppler ultrasound versus no Doppler ultrasound, Outcome 33 Phototherapy for neonatal jaundice (not prespecified).
Analysis 1.34.
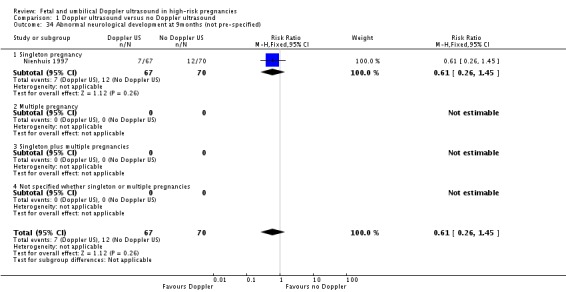
Comparison 1 Doppler ultrasound versus no Doppler ultrasound, Outcome 34 Abnormal neurological development at 9months (not pre‐specified).
Analysis 1.35.
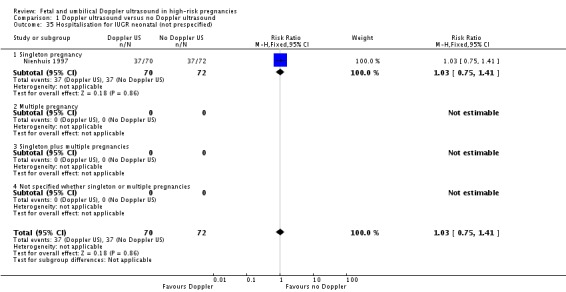
Comparison 1 Doppler ultrasound versus no Doppler ultrasound, Outcome 35 Hospitalisation for IUGR neonatal (not prespecified).
Analysis 1.36.
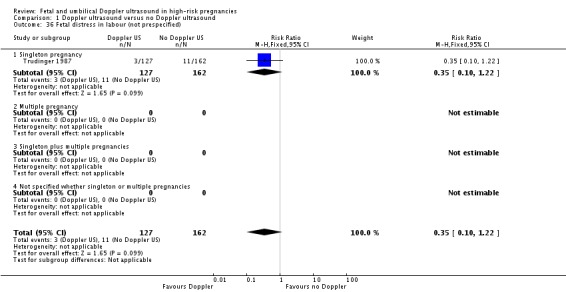
Comparison 1 Doppler ultrasound versus no Doppler ultrasound, Outcome 36 Fetal distress in labour (not prespecified).
Analysis 1.37.

Comparison 1 Doppler ultrasound versus no Doppler ultrasound, Outcome 37 Birth weight < 5 percentile (not prespecified).
Analysis 1.38.
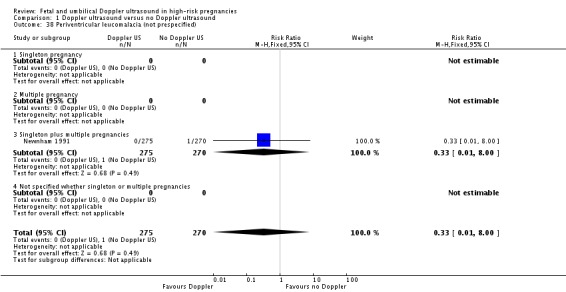
Comparison 1 Doppler ultrasound versus no Doppler ultrasound, Outcome 38 Periventricular leucomalacia (not prespecified).
2) Doppler ultrasound versus no Doppler ultrasound (all subgroups)
Six studies reported primary outcomes by subgroups. Five studies assessed women with suspected SGA/IUGR (Almstrom 1992; Haley 1997; Neales 1994; Nienhuis 1997; Pattinson 1994), one study assessed women with hypertension/pre‐eclampsia (Pattinson 1994) and one study assessed women with a previous pregnancy loss (Norman 1992). Studies only assessed perinatal mortality and none assessed serious neonatal morbidity. Findings are reported in Analysis 2.1.
Analysis 2.1.
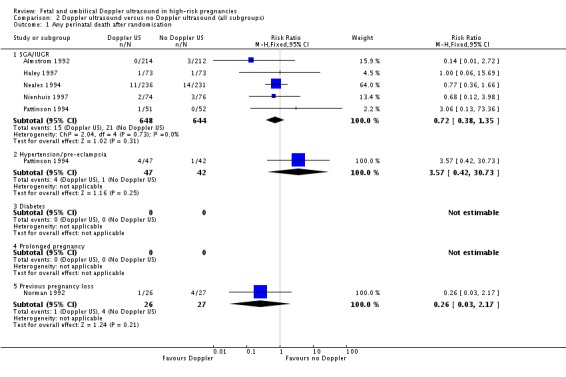
Comparison 2 Doppler ultrasound versus no Doppler ultrasound (all subgroups), Outcome 1 Any perinatal death after randomisation.
3) Doppler ultrasound as an alternative to CTG monitoring (four studies, 2834 women)
Four trials have been included in this comparison (Almstrom 1992; Haley 1997; Hofmeyr 1991; Williams 2003). Unfortunately, this analysis has much less power for assessing main clinical outcomes than the main comparison which included also 12 studies where additional methods of fetal monitoring were used in both groups.
In terms of quality, two of the four studies were judged to be of good quality (Haley 1997; Hofmeyr 1991) whilst the rest were classified as 'unclear' because of the lack of information on randomisation and the allocation process.
Primary outcomes
Overall, there was no significant difference identified in perinatal mortality (RR 0.45, 95% CI 0.17 to 1.15, four studies, 2813 babies, Analysis 3.1). Only two studies were judged to have adequate sequence generation and allocation concealment (Haley 1997; Hofmeyr 1991) and using only these in a sensitivity analysis similarly showed no significant difference identified in perinatal mortality (RR 0.58, 95% CI 0.20 to 1.73, two studies, 1047 babies).
Analysis 3.1.
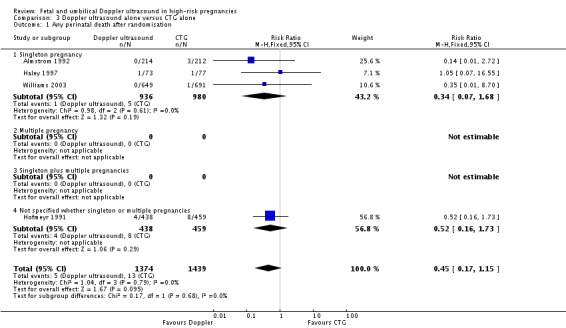
Comparison 3 Doppler ultrasound alone versus CTG alone, Outcome 1 Any perinatal death after randomisation.
There is no evidence that the treatment effect varies between subgroups as confidence intervals overlap.
Unfortunately, none of the studies provided the data on serious perinatal morbidity.
Secondary outcomes
Although, as above, there were fewer deaths in the Doppler groups, those differences did not reach statistical significance for stillbirths (RR 0.48, 95% CI 0.14 to 1.71, four studies, 2813 babies, Analysis 3.3), neonatal death (RR 0.52, 95% CI 0.16 to 1.72, three studies, 1473 babies, Analysis 3.4) and potentially preventable deaths (RR 0.38, 95% CI 0.12 to 1.18, four studies, 2813 babies, Analysis 3.5). The same is true for all other secondary outcomes with the exception of caesarean section rate and length of hospital stay for neonates.
Analysis 3.3.
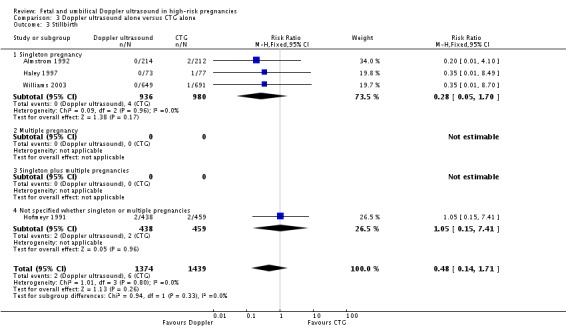
Comparison 3 Doppler ultrasound alone versus CTG alone, Outcome 3 Stillbirth.
Analysis 3.4.
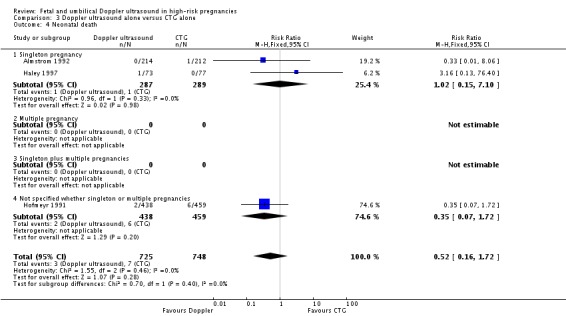
Comparison 3 Doppler ultrasound alone versus CTG alone, Outcome 4 Neonatal death.
Analysis 3.5.

Comparison 3 Doppler ultrasound alone versus CTG alone, Outcome 5 Any potentially preventable perinatal death*.
Overall rates of caesarean section, when both elective and emergency caesareans were combined, showed a trend towards fewer caesareans in the Doppler group that did not reach statistical significance (RR 0.89, 95% CI 0.79 to 1.01, four studies, 2813 babies, Analysis 3.8). Interestingly, the results from three studies that reported emergency and elective caesareans separately showed significantly fewer emergency caesareans (RR 0.66, 95% CI 0.52 to 0.84, three studies, 1473 women, Analysis 3.10) and more elective caesareans (RR 1.53, 95% CI 1.12 to 2.09, three studies, 1473 women, Analysis 3.9) in the Doppler group. There are too few studies to explore this differential effect in a formal meta‐regression, but lack of heterogeneity between these subgroups suggest that the effect of the Doppler studies on the type of caesareans is real.
Analysis 3.8.
Comparison 3 Doppler ultrasound alone versus CTG alone, Outcome 8 Caesarean section (elective and emergency).
Analysis 3.10.
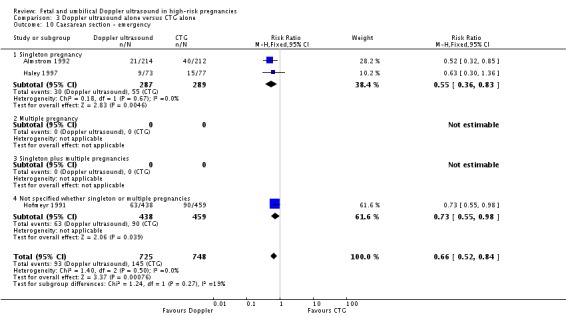
Comparison 3 Doppler ultrasound alone versus CTG alone, Outcome 10 Caesarean section ‐ emergency.
Analysis 3.9.
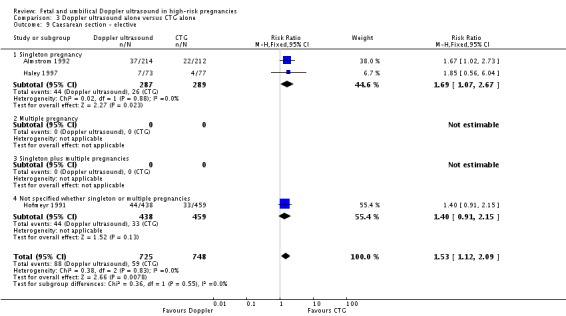
Comparison 3 Doppler ultrasound alone versus CTG alone, Outcome 9 Caesarean section ‐ elective.
There was a significant reduction in the length of infant hospital stay with Doppler ultrasound compared with CTG (SMD ‐0.25, 95% CI ‐0.41 to ‐0.08, two studies, 576 babies, Analysis 3.30). The two studies that reported this outcome included just singleton pregnancies. However, the number of babies involved was too small to be able to say anything with any degree of certainty.
Analysis 3.30.
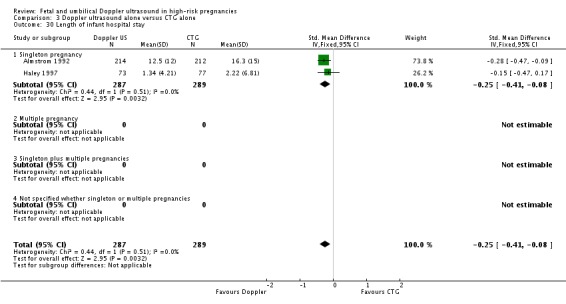
Comparison 3 Doppler ultrasound alone versus CTG alone, Outcome 30 Length of infant hospital stay.
Non‐prespecified outcomes
For completeness, we have also included the graphs for eight clinically relevant outcomes that were not pre‐specified in our protocol (Analysis 3.31; Analysis 3.32; Analysis 3.33; Analysis 3.34; Analysis 3.35; Analysis 3.36; Analysis 3.37; Analysis 3.38).
Analysis 3.32.
Comparison 3 Doppler ultrasound alone versus CTG alone, Outcome 32 Antenatal admissions (not pre‐specified).
Analysis 3.33.

Comparison 3 Doppler ultrasound alone versus CTG alone, Outcome 33 Phototherapy for neonatal jaundice (not pre‐specified).
4) Doppler ultrasound as an alternative to CTG monitoring (all subgroups)
Three studies reported primary outcomes by subgroups. Two studies assessed women with suspected SGA/IUGR (Almstrom 1992; Haley 1997) and one study assessed women with hypertension/pre‐eclampsia (Pattinson 1994). Studies only assessed perinatal mortality and none assessed serious neonatal morbidity. Findings are reported in Analysis 4.1; Analysis 4.2.
Analysis 4.1.

Comparison 4 Doppler ultrasound alone versus CTG alone (all subgroups), Outcome 1 Any perinatal death after randomisation.
Subgroup analysis
There are insufficient data in the subgroup analyses to say whether Doppler ultrasound has differential effect depending on the indication, e.g. IUGR, hypertension or previous pregnancy loss. There were no data at all for diabetes and prolonged pregnancies (see Analysis 5.1 through to Analysis 14.2).
Analysis 5.1.

Comparison 5 Doppler ultrasound versus no Doppler ultrasound ‐ SGA/IUGR, Outcome 1 Any perinatal death after randomisation (SGA/IUGR).
Discussion
The first meta‐analysis showing that Doppler studies of the umbilical artery, when used in singleton high‐risk pregnancies, results in the reduction in perinatal deaths without increase in obstetric interventions was published in 1995 (Alfirevic 1995). This Cochrane review update confirms these results, although formal quality assessment of the included studies revealed very few studies of high quality by today's standards. An international agreement on how best to report clinical trials is relatively recent (CONSORT 2001) and most studies simply did not report information on random sequence generation and allocation blinding that is nowadays considered essential for quality assessment. This makes formal quality assessment of older studies very imprecise resulting in most them being labelled as 'quality unclear'.
The other criticism of the current evidence is lack of a hitherto agreed intervention(s) that should follow an abnormal Doppler finding. Doppler ultrasound is a screening test and of itself cannot influence clinically important outcomes. It is the clinical decisions influenced by Doppler findings that may or may not change the outcome. The evidence from this review suggests that better timing of caesarean sections may be the 'cause' of reduced perinatal mortality. Overall decrease in caesarean sections appears to be confined to emergency procedures which lead us to believe that clinicians with no access to Doppler studies are more often faced with a seriously compromised baby in labour.
It is difficult to say to what extent this review constitutes the 'definitive' evidence of benefit (and absence of harm) for Doppler ultrasound. Some may argue that this meta‐analysis is an ideal example of the epidemiological evidence that should trigger a definitive, high‐quality large multi‐centre clinical trial with an agreed treatment protocol that follows an abnormal Doppler finding in the umbilical artery. Most clinicians feel that a window of opportunity for such a trial is long gone, at least in singleton pregnancies with suspected 'placental insufficiency'. However, it is quite possible that for some 'high‐risk' groups, Doppler of the umbilical artery does not offer any protection (e.g. post‐term pregnancy, uncomplicated dichorionic pregnancy). Large enough clinical trials of umbilical artery Doppler in these groups of women are unlikely to be funded as clinical attention focuses on more sophisticated use of Doppler ultrasound. It is hoped that clinical trials evaluating such techniques (e.g. Doppler studies of the fetal ductus venosus) will be of high quality with adequate power to detect important differences in neonatal morbidity.
Authors' conclusions
Doppler studies of the umbilical artery should be incorporated in the protocols for fetal monitoring in high‐risk pregnancies thought to be at risk of placental insufficiency. The clear definition of suspected placental insufficiency, frequency of Doppler studies and timing of delivery in the presence of abnormal Doppler studies remains elusive. Women with hypertensive disorders and small‐for‐date fetuses are obvious candidates whilst the role of umbilical artery Doppler in other risk groups like post‐term, diabetes and uncomplicated dichorionic twin pregnancy is still debatable.
Use of more sophisticated Doppler tests such as assessment of blood flow in the middle cerebral artery and ductus venosus have not been subjected to the rigorous evaluation in clinical trials so far and, therefore, cannot be recommended in routine clinical practice.
As discussed, a case could be made for a larger trial of Doppler ultrasound than has been mounted hitherto, particularly in risk groups where the risk of fetal growth restriction caused by impaired placental blood flow is relatively low. Observational studies suggest that fetal vessels other than the umbilical artery may be better markers of fetal well‐being, fetal ductus venosus in particular. It is hoped that future clinical studies evaluating possible added benefit of these tests will comply with the most recent CONSORT statement (www.consort‐statement.org) and use clinical outcomes from this Cochrane review as the minimum data set.
Acknowledgements
The National Institute for Health Research (NIHR) is the largest single funder of the Cochrane Pregnancy and Childbirth Group. The views and opinions expressed therein are those of the authors and do not necessarily reflect those of the NIHR, NHS or the Department of Health.
In the previous version of this review, Alfirevic 2010, Gill Gyte was supported by the NIHR NHS Cochrane Collaboration Programme grant scheme award for NHS‐prioritised centrally‐managed, pregnancy and childbirth systematic reviews: CPGS02.
Appendices
Appendix 1. Methods used in previous version of the review
Data collection and analysis
The methodology for data collection and analysis was based on the Cochrane Handbook of Systematic Reviews of Interventions (Higgins 2008).
Selection of studies
Two review authors (G Gyte and T Stampalija) independently assessed for inclusion all the potential studies identified as a result of the search strategy. We resolved any disagreement through discussion, or if required we consulted a third author.
Data extraction and management
We designed a form to extract data. Two review authors extracted the data using the agreed form. We resolved discrepancies through discussion, or if required we consulted a third author. Data were entered into Review Manager software (RevMan 2008), and checked for accuracy.
When information regarding any of the above was unclear, we attempted to contact authors of the original reports to provide further details.
Assessment of risk of bias in included studies
Two review authors independently assessed risk of bias for each study using the criteria outlined in the Cochrane Handbook for Systematic Reviews of Interventions (Higgins 2008). We resolved any disagreement through discussion, or by involving a third review author.
1) Sequence generation (checking for possible selection bias)
We have described, for each included study, the methods used to generate the allocation sequence in sufficient detail to allow an assessment of whether it should produce comparable groups.
We have assessed the methods as:
adequate (any truly random process, e.g. random number table; computer random‐number generator);
inadequate (any non‐random process, e.g. odd or even date of birth; hospital or clinic record number); or
unclear.
2) Allocation concealment (checking for possible selection bias)
We have described, for each included study, the method used to conceal the allocation sequence in sufficient detail and determine whether intervention allocation could have been foreseen in advance of, or during, recruitment.
We have assessed the methods as:
adequate (e.g. telephone or central randomisation; consecutively numbered sealed opaque envelopes);
inadequate (open random allocation; unsealed or non‐opaque envelopes; alternation; date of birth);
unclear.
3) Blinding (checking for possible performance bias)
We have described, for each included study, all the methods used, if any, to blind study participants and personnel from knowledge of which intervention a participant received. We have also provided any information relating to whether the intended blinding was effective. Where blinding was not possible, we have assessed whether the lack of blinding was likely to have introduced bias. We have assessed blinding separately for different outcomes or classes of outcomes.
We have assessed the methods as:
adequate, inadequate or unclear for participants;
adequate, inadequate or unclear for personnel;
adequate, inadequate or unclear for outcome assessors.
4) Incomplete outcome data (checking for possible attrition bias through withdrawals, dropouts, protocol deviations)
We have described, for each included study, the completeness of outcome data for each main outcome, including attrition and exclusions from the analysis. We have stated whether attrition and exclusions were reported, the numbers (compared with the total randomised participants), reasons for attrition/exclusion where reported, and any re‐inclusions in analyses which we undertook.
We have discussed whether missing data greater than 20% might impact on outcomes acknowledging that with long‐term follow‐up complete data are difficult to attain.
5) Selective reporting bias
We have described, for each included study, how the possibility of selective outcome reporting bias was examined by us and what we found.
We have assessed the methods as:
adequate (where it was clear that all of the study’s pre‐specified outcomes and all expected outcomes of interest to the review have been reported);
inadequate (where not all the study’s pre‐specified outcomes have been reported; one or more reported primary outcomes were not pre‐specified; outcomes of interest are reported incompletely and so cannot be used; study fails to include results of a key outcome that would have been expected to have been reported);
unclear.
6) Other sources of bias
We have described, for each included study, any important concerns we have about other possible sources of bias.
We have assessed whether each study was free of other problems that could put it at risk of bias:
yes;
no;
unclear.
7) Overall risk of bias
We have made explicit judgements about whether studies are at high risk of bias, according to the criteria given in the Cochrane Handbook of Systematic Reviews of Interventions (Higgins 2008). With reference to (1) to (6) above, we assessed the likely magnitude and direction of the bias and whether we considered it was likely to impact on the findings.
Measures of treatment effect
Where there were multiple pregnancies, we have used the number of women who were randomised as the denominator for maternal outcomes, and the number of babies of women who were randomised as the denominator for neonatal outcomes.
We have also used as the denominator, the number of babies of women who were randomised even though some babies could not have attained the outcome, for example, if there was a stillbirth then this baby would not have been able to attain the outcome of 'admission to special care baby unit'.
There was insufficient information about multiple pregnancies to enable us to deal with the non‐independence of these data and so these data have been analysed as individual data.
Dichotomous data
For dichotomous data, we have presented the results as summary risk ratio (RR) with 95% confidence intervals.
Continuous data
For continuous data, we have used the mean difference (MD) if outcomes were measured in the same way between trials. We have used the standardised mean difference (SMD) to combine trials that measure the same outcome, but use different methods.
Unit of analysis issues
If there had been several time points for assessment of an outcome, we would have performed separate analyses. In studies specifically of multiple pregnancies there were issues of non‐independence, but we were unable to use the cluster‐trial methods because the necessary information was not available in the studies.
Dealing with missing data
For included studies, we have noted levels of attrition. We considered that there was insufficient information and data for us to undertake sensitivity analyses for missing data.
For all outcomes, we have carried out analyses, as far as possible, on an intention‐to‐treat basis: i.e. we have attempted to include all participants randomised to each group in the analyses. The denominator for each outcome in each trial was the number randomised, minus any participants whose outcomes were known to be missing (available case analysis). For competing outcomes, for example. where there is a stillbirth the baby would not be eligible for 'admission to neonatal intensive care unit', we have kept as the denominator for the primary analyses, the number randomised (rather than the number eligible for the outcome).
Assessment of heterogeneity
We have assessed statistical heterogeneity in each meta‐analysis using the Tau², I² and Chi² statistics. We have regarded heterogeneity as substantial if TauI² was greater than zero and either I² was greater than 30% or there was a low P value (less than 0.10) in the Chi² test for heterogeneity. If we identified substantial heterogeneity, we explored the causes of it by pre‐specified subgroup analysis. Where random‐effects were used because of heterogeneity, we have reported the average relative risk, average mean difference or average standard mean difference. Our interpretations take into account that for outcomes with less than 10 studies it is difficult to assess subgroup effects with adequate power.
Assessment of reporting biases
If there were 10 or more studies in a meta‐analysis we have investigated reporting biases (such as publication bias) using funnel plots. We have assessed funnel plot asymmetry visually, and used formal tests for funnel plot asymmetry. For continuous outcomes we have used the test proposed by Egger 1997, and for dichotomous outcomes we have used the tests proposed by Harbord 2006. If asymmetry was detected by any of these tests or was suggested by a visual assessment, we have tried to explain this.
Where we suspected reporting bias (see 'Selective reporting bias' above), we attempted to contact study authors asking them to provide missing outcome data. We did not find any missing data of sufficient magnitude to impact on outcomes. Had we done so, we would have explored this by a Sensitivity analysis.
Data synthesis
We carried out statistical analysis using the Review Manager software (RevMan 2008). We used fixed‐effect meta‐analysis for combining data where it was reasonable to assume that studies were estimating the same underlying treatment effect: i.e. where trials were examining the same intervention, and the trials' populations and methods were judged sufficiently similar. If there was clinical heterogeneity sufficient to expect that the underlying treatment effects differed between trials, or if substantial statistical heterogeneity was detected, we used random‐effects analysis to produce an overall summary, if this was considered clinically meaningful. If an average treatment effect across trials was not clinically meaningful we did not combine heterogeneous trials.
If we used random‐effects analyses, the results were presented as the average treatment effect and its 95% confidence interval, the 95% prediction interval, and the estimates of Tau², Chi², P value and I². The 95% prediction interval provides a 95% interval for the predicted underlying treatment effect in a future study (Higgins 2009).
We sought to perform meta‐analysis for each occasion where multiple trials were identified that examined the same intervention, and the trials' populations and methods were judged sufficiently similar to make meta‐analysis clinically meaningful.
Subgroup analysis and investigation of heterogeneity
We planned to carry out the following a priori subgroup analyses on all outcomes rather than undertaking separate reviews on singleton and multiple pregnancies:
singleton pregnancies versus multiple pregnancies;
monochorionic twins versus dichorionic twins.
We planned to carry out the following additional a priori subgroup analyses on the primary outcomes only and have only done this where we have sufficient data available:
where the fetus was suspected small‐for‐gestational age;
where the woman had hypertension or pre‐eclampsia;
where the women had diabetes;
prolonged pregnancy;
where there had been previous pregnancy loss.
For fixed‐effect meta‐analyses, we conducted planned subgroup analyses classifying whole trials by interaction tests as described by Deeks 2001. For random‐effects meta‐analyses, we assessed differences between subgroups by inspection of the subgroups’ confidence intervals; non‐overlapping confidence intervals indicate a statistically significant difference in treatment effect between the subgroups.
Sensitivity analysis
We have undertaken sensitivity analysis to explore the effect of trial quality for important outcomes in the review where there were sufficient high‐quality data.
Appendix 2. Methods to be used in future updates
Selection of studies
Two review authors will independently assess for inclusion all potential studies identified as a result of the search strategy. We will resolve any disagreement through discussion or, if required, we will consult a third author.
Data extraction and management
We will design a form to extract data. For eligible studies, two review authors will extract the data using the agreed form. We will resolve discrepancies through discussion or, if required, we will consult a third review author. We will enter data into Review Manager software (RevMan 2012) and check data entry for accuracy.
When information regarding any of the above is unclear, we will attempt to contact authors of the original reports to provide further details.
Assessment of risk of bias in included studies
Two review authors will independently assess risk of bias for each study using the criteria outlined in the Cochrane Handbook for Systematic Reviews of Interventions (Higgins 2011). We will resolve any disagreement through discussion or by involving a third assessor.
(1) Random sequence generation (checking for possible selection bias)
We will describe for each included study the method used to generate the allocation sequence in sufficient detail to allow an assessment of whether it should produce comparable groups.
We will assess the method as:
low risk of bias (any truly random process, e.g. random number table; computer random number generator);
high risk of bias (any non‐random process, e.g. odd or even date of birth; hospital or clinic record number);
unclear risk of bias.
(2) Allocation concealment (checking for possible selection bias)
We will describe for each included study the method used to conceal allocation to interventions prior to assignment and will assess whether intervention allocation could have been foreseen in advance of or during recruitment, or changed after assignment.
We will assess the methods as:
low risk of bias (e.g. telephone or central randomisation; consecutively numbered sealed opaque envelopes);
high risk of bias (open random allocation; unsealed or non‐opaque envelopes, alternation; date of birth);
unclear risk of bias.
(3.1) Blinding of participants and personnel (checking for possible performance bias)
We will describe for each included study the methods used, if any, to blind study participants and personnel from knowledge of which intervention a participant received. We will consider that studies are at low risk of bias if they were blinded, or if we judge that the lack of blinding would be unlikely to affect results. We will assess blinding separately for different outcomes or classes of outcomes.
We will assess the methods as:
low, high or unclear risk of bias for participants;
low, high or unclear risk of bias for personnel.
(3.2) Blinding of outcome assessment (checking for possible detection bias)
We will describe for each included study the methods used, if any, to blind outcome assessors from knowledge of which intervention a participant received. We will assess blinding separately for different outcomes or classes of outcomes.
We will assess methods used to blind outcome assessment as:
low, high or unclear risk of bias.
(4) Incomplete outcome data (checking for possible attrition bias due to the amount, nature and handling of incomplete outcome data)
We will describe for each included study, and for each outcome or class of outcomes, the completeness of data including attrition and exclusions from the analysis. We will state whether attrition and exclusions were reported and the numbers included in the analysis at each stage (compared with the total randomised participants), reasons for attrition or exclusion where reported, and whether missing data were balanced across groups or were related to outcomes. Where sufficient information is reported, or can be supplied by the trial authors, we will re‐include missing data in the analyses which we undertake.
We will assess methods as:
low risk of bias (e.g. no missing outcome data; missing outcome data balanced across groups);
high risk of bias (e.g. numbers or reasons for missing data imbalanced across groups; ‘as treated’ analysis done with substantial departure of intervention received from that assigned at randomisation);
unclear risk of bias.
(5) Selective reporting (checking for reporting bias)
We will describe for each included study how we investigated the possibility of selective outcome reporting bias and what we found.
We will assess the methods as:
low risk of bias (where it is clear that all of the study’s pre‐specified outcomes and all expected outcomes of interest to the review have been reported);
high risk of bias (where not all the study’s pre‐specified outcomes have been reported; one or more reported primary outcomes were not pre‐specified; outcomes of interest are reported incompletely and so cannot be used; study fails to include results of a key outcome that would have been expected to have been reported);
unclear risk of bias.
(6) Other bias (checking for bias due to problems not covered by (1) to (5) above)
We will describe for each included study any important concerns we have about other possible sources of bias.
We will assess whether each study was free of other problems that could put it at risk of bias:
low risk of other bias;
high risk of other bias;
unclear whether there is risk of other bias.
(7) Overall risk of bias
We will make explicit judgements about whether studies are at high risk of bias, according to the criteria given in the Cochrane Handbook (Higgins 2011). With reference to (1) to (6) above, we will assess the likely magnitude and direction of the bias and whether we consider it is likely to impact on the findings. We will explore the impact of the level of bias through undertaking sensitivity analyses — see Sensitivity analysis.
Measures of treatment effect
Dichotomous data
For dichotomous data, we will present results as a summary risk ratio with 95% confidence intervals.
Continuous data
For continuous data, we will use the mean difference if outcomes are measured in the same way between trials. We will use the standardised mean difference to combine trials that measure the same outcome, but use different methods.
Unit of analysis issues
Cluster‐randomised trials
We will include cluster‐randomised trials in the analyses along with individually‐randomised trials. We will adjust their sample sizes using the methods described in the Cochrane Handbook using an estimate of the intracluster correlation co‐efficient (ICC) derived from the trial (if possible), from a similar trial or from a study of a similar population. If we use ICCs from other sources, we will report this and conduct sensitivity analyses to investigate the effect of variation in the ICC. If we identify both cluster‐randomised trials and individually‐randomised trials, we plan to synthesise the relevant information. We will consider it reasonable to combine the results from both if there is little heterogeneity between the study designs and the interaction between the effect of intervention and the choice of randomisation unit is considered to be unlikely.
We will also acknowledge heterogeneity in the randomisation unit and perform a sensitivity analysis to investigate the effects of the randomisation unit.
Cross‐over trials
Cross‐over trials will not be considered eligible for inclusion.
Multiple pregnancies
Trials of multiple pregnancies are eligible for inclusion. Wherever possible, analyses will be adjusted for clustering to take into account the non‐independence of babies from the same pregnancy (Gates 2004). Treating babies from multiple pregnancies as if they are independent, when they are more likely to have similar outcomes than babies from different pregnancies, will overestimate the sample size and give confidence intervals that are too narrow. Each woman can be considered a cluster in multiple pregnancy, with the number of individuals in the cluster being equal to the number of fetuses in her pregnancy. Analysis using cluster trial methods allows calculation of relative risk and adjustment of confidence intervals. Usually this will mean that the confidence intervals get wider. Although this may make little difference to the conclusion of a trial, it avoids misleading results in those trials where the difference may be substantial.
We plan to adjust for clustering in the analyses, wherever possible, and to use the inverse variance method for adjusted analyses, as described in the Cochrane Handbook for Systematic Reviews of Interventions (Higgins 2011).
Dealing with missing data
For included studies, we will note levels of attrition. We will explore the impact of including studies with high levels of missing data in the overall assessment of treatment effect by using sensitivity analysis.
For all outcomes, we will carry out analyses, as far as possible, on an intention‐to‐treat basis, i.e. we will attempt to include all participants randomised to each group in the analyses, and all participants will be analysed in the group to which they were allocated, regardless of whether or not they received the allocated intervention. The denominator for each outcome in each trial will be the number randomised minus any participants whose outcomes are known to be missing.
Assessment of heterogeneity
We will assess statistical heterogeneity in each meta‐analysis using the Tau², I² and Chi² statistics. We will regard heterogeneity as substantial if an I² is greater than 30% and either the Tau² is greater than zero, or there is a low P‐value (< 0.10) in the Chi² test for heterogeneity.
Assessment of reporting biases
If there are 10 or more studies in the meta‐analysis, we will investigate reporting biases (such as publication bias) using funnel plots. We will assess funnel plot asymmetry visually. If asymmetry is suggested by a visual assessment, we will perform exploratory analyses to investigate it.
Data synthesis
We will carry out statistical analysis using the Review Manager software (RevMan 2012). We will use fixed‐effect meta‐analysis for combining data where it is reasonable to assume that studies are estimating the same underlying treatment effect: i.e. where trials are examining the same intervention, and the trials’ populations and methods are judged sufficiently similar. If there is clinical heterogeneity sufficient to expect that the underlying treatment effects differ between trials, or if substantial statistical heterogeneity is detected, we will use random‐effects meta‐analysis to produce an overall summary, if an average treatment effect across trials is considered clinically meaningful. The random‐effects summary will be treated as the average range of possible treatment effects and we will discuss the clinical implications of treatment effects differing between trials. If the average treatment effect is not clinically meaningful, we will not combine trials.
If we use random‐effects analyses, the results will be presented as the average treatment effect with 95% confidence intervals, and the estimates of Tau² and I².
Subgroup analysis and investigation of heterogeneity
If we identify substantial heterogeneity, we will investigate it using subgroup analyses and sensitivity analyses. We will consider whether an overall summary is meaningful, and if it is, use random‐effects analysis to produce it.
We will carry out the following a priori subgroup analyses on all outcomes rather than undertaking separate reviews on singleton and multiple pregnancies:
singleton pregnancies versus multiple pregnancies;
monochorionic twins versus dichorionic twins.
We plan to carry out the following additional a priori subgroup analyses on the primary outcomes:
where the fetus was suspected small‐for‐gestational age;
where the woman had hypertension or pre‐eclampsia;
where the women had diabetes;
prolonged pregnancy;
where there had been previous pregnancy loss.
We will assess subgroup differences by interaction tests available within RevMan (RevMan 2012). We will report the results of subgroup analyses quoting the ChiI² statistic and P value, and the interaction test I² value.
Sensitivity analysis
We plan to carry out sensitivity analyses to explore the effect of trial quality assessed by adequate labelled sequence generation and adequate allocation concealment, with poor‐quality studies (unclear or high risk of bias) being excluded from the analyses in order to assess whether this makes any difference to the overall result.
Data and analyses
Comparison 1.
Doppler ultrasound versus no Doppler ultrasound
| Outcome or subgroup title | No. of studies | No. of participants | Statistical method | Effect size |
|---|---|---|---|---|
| 1 Any perinatal death after randomisation | 16 | 10225 | Risk Ratio (M‐H, Fixed, 95% CI) | 0.71 [0.52, 0.98] |
| 1.1 Singleton pregnancy | 9 | 4661 | Risk Ratio (M‐H, Fixed, 95% CI) | 0.59 [0.35, 1.01] |
| 1.2 Multiple pregnancy | 1 | 1052 | Risk Ratio (M‐H, Fixed, 95% CI) | 0.88 [0.32, 2.41] |
| 1.3 Singleton plus multiple pregnancies | 2 | 2874 | Risk Ratio (M‐H, Fixed, 95% CI) | 0.86 [0.49, 1.53] |
| 1.4 Not specified whether singleton or multiple pregnancies | 4 | 1638 | Risk Ratio (M‐H, Fixed, 95% CI) | 0.68 [0.36, 1.30] |
| 2 Serious neonatal morbidity | 3 | Risk Ratio (M‐H, Random, 95% CI) | Subtotals only | |
| 2.1 Singleton pregnancy | 1 | 500 | Risk Ratio (M‐H, Random, 95% CI) | 0.13 [0.02, 0.99] |
| 2.2 Multiple pregnancy | 0 | 0 | Risk Ratio (M‐H, Random, 95% CI) | 0.0 [0.0, 0.0] |
| 2.3 Singleton plus multiple pregnancies | 1 | 545 | Risk Ratio (M‐H, Random, 95% CI) | 2.95 [0.31, 28.14] |
| 2.4 Not specified whether singleton or multiple pregnancies | 1 | 53 | Risk Ratio (M‐H, Random, 95% CI) | 0.0 [0.0, 0.0] |
| 3 Stillbirth | 15 | 9560 | Risk Ratio (M‐H, Fixed, 95% CI) | 0.65 [0.41, 1.04] |
| 3.1 Singleton pregnancy | 8 | 3996 | Risk Ratio (M‐H, Fixed, 95% CI) | 0.61 [0.31, 1.19] |
| 3.2 Multiple pregnancy | 1 | 1052 | Risk Ratio (M‐H, Fixed, 95% CI) | 0.67 [0.11, 4.00] |
| 3.3 Singleton plus multiple pregnancy | 2 | 2874 | Risk Ratio (M‐H, Fixed, 95% CI) | 1.20 [0.40, 3.56] |
| 3.4 Not specified whether singleton or multiple pregnancies | 4 | 1638 | Risk Ratio (M‐H, Fixed, 95% CI) | 0.48 [0.19, 1.22] |
| 4 Neonatal death | 13 | 8167 | Risk Ratio (M‐H, Fixed, 95% CI) | 0.81 [0.53, 1.24] |
| 4.1 Singleton pregnancy | 7 | 2656 | Risk Ratio (M‐H, Fixed, 95% CI) | 0.69 [0.31, 1.53] |
| 4.2 Multiple pregnancy | 1 | 1052 | Risk Ratio (M‐H, Fixed, 95% CI) | 1.01 [0.29, 3.46] |
| 4.3 Singleton plus multiple pregnancies | 2 | 2874 | Risk Ratio (M‐H, Fixed, 95% CI) | 0.76 [0.38, 1.50] |
| 4.4 Not specified whether singleton or multiple pregnancies | 3 | 1585 | Risk Ratio (M‐H, Fixed, 95% CI) | 1.00 [0.40, 2.53] |
| 5 Any potentially preventable perinatal death* | 16 | 10225 | Risk Ratio (M‐H, Fixed, 95% CI) | 0.67 [0.46, 0.98] |
| 5.1 Singleton pregnancy | 9 | 4661 | Risk Ratio (M‐H, Fixed, 95% CI) | 0.58 [0.30, 1.13] |
| 5.2 Multiple pregnancy | 1 | 1052 | Risk Ratio (M‐H, Fixed, 95% CI) | 0.88 [0.32, 2.41] |
| 5.3 Singleton plus multiple pregnancies | 2 | 2874 | Risk Ratio (M‐H, Fixed, 95% CI) | 0.81 [0.38, 1.73] |
| 5.4 Not specified whether singleton or multiple pregnancies | 4 | 1638 | Risk Ratio (M‐H, Fixed, 95% CI) | 0.59 [0.29, 1.21] |
| 6 Fetal acidosis | 0 | 0 | Risk Ratio (M‐H, Fixed, 95% CI) | 0.0 [0.0, 0.0] |
| 6.1 Singleton pregnancy | 0 | 0 | Risk Ratio (M‐H, Fixed, 95% CI) | 0.0 [0.0, 0.0] |
| 6.2 Multiple pregnancy | 0 | 0 | Risk Ratio (M‐H, Fixed, 95% CI) | 0.0 [0.0, 0.0] |
| 6.3 Singleton plus multiple pregnancies | 0 | 0 | Risk Ratio (M‐H, Fixed, 95% CI) | 0.0 [0.0, 0.0] |
| 6.4 Not specified whether singleton or multiple pregnancies | 0 | 0 | Risk Ratio (M‐H, Fixed, 95% CI) | 0.0 [0.0, 0.0] |
| 7 Apgar < 7 at 5 minutes | 7 | 6321 | Risk Ratio (M‐H, Fixed, 95% CI) | 0.92 [0.69, 1.24] |
| 7.1 Singleton pregnancy | 4 | 2555 | Risk Ratio (M‐H, Fixed, 95% CI) | 0.70 [0.45, 1.09] |
| 7.2 Multiple pregnancy | 0 | 0 | Risk Ratio (M‐H, Fixed, 95% CI) | 0.0 [0.0, 0.0] |
| 7.3 Singleton plus multiple pregnancies | 2 | 2869 | Risk Ratio (M‐H, Fixed, 95% CI) | 1.22 [0.78, 1.90] |
| 7.4 Not specified whether singleton or multiple pregnancies | 1 | 897 | Risk Ratio (M‐H, Fixed, 95% CI) | 0.93 [0.36, 2.39] |
| 8 Caesarean section (elective and emergency) | 14 | 7918 | Risk Ratio (M‐H, Fixed, 95% CI) | 0.90 [0.84, 0.97] |
| 8.1 Singleton pregnancy | 7 | 2929 | Risk Ratio (M‐H, Fixed, 95% CI) | 0.84 [0.75, 0.95] |
| 8.2 Multiple pregnancy | 1 | 526 | Risk Ratio (M‐H, Fixed, 95% CI) | 0.96 [0.77, 1.19] |
| 8.3 Singleton plus multiple pregnancies | 2 | 2794 | Risk Ratio (M‐H, Fixed, 95% CI) | 0.95 [0.82, 1.10] |
| 8.4 Not specified whether singleton or multiple pregnancies | 4 | 1669 | Risk Ratio (M‐H, Fixed, 95% CI) | 0.93 [0.79, 1.10] |
| 9 Caesarean section ‐ elective | 11 | 6627 | Risk Ratio (M‐H, Fixed, 95% CI) | 1.07 [0.93, 1.22] |
| 9.1 Singleton pregnancy | 6 | 1934 | Risk Ratio (M‐H, Fixed, 95% CI) | 1.11 [0.90, 1.38] |
| 9.2 Multiple pregnancy | 1 | 526 | Risk Ratio (M‐H, Fixed, 95% CI) | 1.06 [0.77, 1.47] |
| 9.3 Singleton plus multiple pregnancies | 2 | 2794 | Risk Ratio (M‐H, Fixed, 95% CI) | 0.87 [0.67, 1.14] |
| 9.4 Not specified whether singleton or multiple pregnancies | 2 | 1373 | Risk Ratio (M‐H, Fixed, 95% CI) | 1.30 [0.96, 1.78] |
| 10 Caesarean section ‐ emergency | 10 | 6175 | Risk Ratio (M‐H, Random, 95% CI) | 0.81 [0.67, 0.98] |
| 10.1 Singleton pregnancy | 5 | 1482 | Risk Ratio (M‐H, Random, 95% CI) | 0.58 [0.43, 0.78] |
| 10.2 Multiple pregnancy | 1 | 526 | Risk Ratio (M‐H, Random, 95% CI) | 0.84 [0.57, 1.23] |
| 10.3 Singleton plus multiple pregnancies | 2 | 2794 | Risk Ratio (M‐H, Random, 95% CI) | 1.06 [0.88, 1.29] |
| 10.4 Not specified whether singleton or multiple pregnancies | 2 | 1373 | Risk Ratio (M‐H, Random, 95% CI) | 0.78 [0.60, 1.02] |
| 11 Spontaneous vaginal birth | 5 | 2504 | Risk Ratio (M‐H, Fixed, 95% CI) | 1.04 [0.98, 1.10] |
| 11.1 Singleton pregnancy | 2 | 576 | Risk Ratio (M‐H, Fixed, 95% CI) | 1.07 [0.96, 1.18] |
| 11.2 Multiple pregnancy | 1 | 526 | Risk Ratio (M‐H, Fixed, 95% CI) | 1.03 [0.90, 1.19] |
| 11.3 Singleton plus multiple pregnancies | 1 | 505 | Risk Ratio (M‐H, Fixed, 95% CI) | 0.98 [0.86, 1.11] |
| 11.4 Not specified whether singleton or multiple pregnancies | 1 | 897 | Risk Ratio (M‐H, Fixed, 95% CI) | 1.06 [0.95, 1.19] |
| 12 Operative vaginal birth | 4 | 2813 | Risk Ratio (M‐H, Fixed, 95% CI) | 0.95 [0.80, 1.14] |
| 12.1 Singleton pregnancy | 3 | 1916 | Risk Ratio (M‐H, Fixed, 95% CI) | 0.97 [0.78, 1.22] |
| 12.2 Multiple pregnancy | 0 | 0 | Risk Ratio (M‐H, Fixed, 95% CI) | 0.0 [0.0, 0.0] |
| 12.3 Singleton plus multiple pregnancies | 0 | 0 | Risk Ratio (M‐H, Fixed, 95% CI) | 0.0 [0.0, 0.0] |
| 12.4 Not specified whether singleton or multiple pregnancies | 1 | 897 | Risk Ratio (M‐H, Fixed, 95% CI) | 0.92 [0.68, 1.25] |
| 13 Induction of labour | 10 | 5633 | Risk Ratio (M‐H, Random, 95% CI) | 0.89 [0.80, 0.99] |
| 13.1 Singleton pregnancy | 5 | 1784 | Risk Ratio (M‐H, Random, 95% CI) | 0.79 [0.64, 0.97] |
| 13.2 Multiple pregnancy | 1 | 526 | Risk Ratio (M‐H, Random, 95% CI) | 1.10 [0.80, 1.50] |
| 13.3 Singleton plus multiple pregnancies | 2 | 2794 | Risk Ratio (M‐H, Random, 95% CI) | 0.95 [0.85, 1.05] |
| 13.4 Not specified whether singleton or multiple pregnancies | 2 | 529 | Risk Ratio (M‐H, Random, 95% CI) | 0.94 [0.72, 1.23] |
| 14 Oxytocin augmentation | 0 | 0 | Risk Ratio (M‐H, Fixed, 95% CI) | 0.0 [0.0, 0.0] |
| 14.1 Singleton pregnancy | 0 | 0 | Risk Ratio (M‐H, Fixed, 95% CI) | 0.0 [0.0, 0.0] |
| 14.2 Multiple pregnancy | 0 | 0 | Risk Ratio (M‐H, Fixed, 95% CI) | 0.0 [0.0, 0.0] |
| 14.3 Singleton plus multiple pregnancies | 0 | 0 | Risk Ratio (M‐H, Fixed, 95% CI) | 0.0 [0.0, 0.0] |
| 14.4 Not specified whether singleton or multiple pregnancies | 0 | 0 | Risk Ratio (M‐H, Fixed, 95% CI) | 0.0 [0.0, 0.0] |
| 15 Neonatal resuscitation required | 0 | 0 | Risk Ratio (M‐H, Fixed, 95% CI) | 0.0 [0.0, 0.0] |
| 15.1 Singleton pregnancy | 0 | 0 | Risk Ratio (M‐H, Fixed, 95% CI) | 0.0 [0.0, 0.0] |
| 15.2 Multiple pregnancy | 0 | 0 | Risk Ratio (M‐H, Fixed, 95% CI) | 0.0 [0.0, 0.0] |
| 15.3 Singleton plus multiple pregnancies | 0 | 0 | Risk Ratio (M‐H, Fixed, 95% CI) | 0.0 [0.0, 0.0] |
| 15.4 Not specified whether singleton or multiple pregnancies | 0 | 0 | Risk Ratio (M‐H, Fixed, 95% CI) | 0.0 [0.0, 0.0] |
| 16 Infant requiring intubation/ventilation | 6 | 3136 | Risk Ratio (M‐H, Random, 95% CI) | 1.42 [0.87, 2.30] |
| 16.1 Singleton pregnancy | 4 | 1539 | Risk Ratio (M‐H, Random, 95% CI) | 2.89 [1.40, 5.96] |
| 16.2 Multiple pregnancy | 1 | 1052 | Risk Ratio (M‐H, Random, 95% CI) | 0.86 [0.59, 1.25] |
| 16.3 Singleton plus multiple pregnancies | 1 | 545 | Risk Ratio (M‐H, Random, 95% CI) | 1.25 [0.79, 1.98] |
| 16.4 Not specified whether singleton or multiple pregnancies | 0 | 0 | Risk Ratio (M‐H, Random, 95% CI) | 0.0 [0.0, 0.0] |
| 17 Neonatal fitting/seizures | 1 | 150 | Risk Ratio (M‐H, Fixed, 95% CI) | 0.35 [0.01, 8.49] |
| 17.1 Singleton pregnancy | 1 | 150 | Risk Ratio (M‐H, Fixed, 95% CI) | 0.35 [0.01, 8.49] |
| 17.2 Multiple pregnancy | 0 | 0 | Risk Ratio (M‐H, Fixed, 95% CI) | 0.0 [0.0, 0.0] |
| 17.3 Singleton plus multiple pregnancies | 0 | 0 | Risk Ratio (M‐H, Fixed, 95% CI) | 0.0 [0.0, 0.0] |
| 17.4 Not specified whether singleton or multiple pregnancies | 0 | 0 | Risk Ratio (M‐H, Fixed, 95% CI) | 0.0 [0.0, 0.0] |
| 18 Preterm labour | 2 | 626 | Risk Ratio (M‐H, Fixed, 95% CI) | 1.12 [0.72, 1.75] |
| 18.1 Singleton pregnancy | 1 | 150 | Risk Ratio (M‐H, Fixed, 95% CI) | 1.03 [0.51, 2.07] |
| 18.2 Multiple pregnancy | 0 | 0 | Risk Ratio (M‐H, Fixed, 95% CI) | 0.0 [0.0, 0.0] |
| 18.3 Singleton plus multiple pregnancy | 0 | 0 | Risk Ratio (M‐H, Fixed, 95% CI) | 0.0 [0.0, 0.0] |
| 18.4 Not specified whether singleton or multiple pregnancies | 1 | 476 | Risk Ratio (M‐H, Fixed, 95% CI) | 1.18 [0.66, 2.11] |
| 19 Infant respiratory distress syndrome (RDS) | 1 | 107 | Risk Ratio (M‐H, Fixed, 95% CI) | 1.06 [0.07, 16.48] |
| 19.1 Singleton pregnancy | 1 | 107 | Risk Ratio (M‐H, Fixed, 95% CI) | 1.06 [0.07, 16.48] |
| 19.2 Multiple pregnancy | 0 | 0 | Risk Ratio (M‐H, Fixed, 95% CI) | 0.0 [0.0, 0.0] |
| 19.3 Singleton plus multiple pregnancies | 0 | 0 | Risk Ratio (M‐H, Fixed, 95% CI) | 0.0 [0.0, 0.0] |
| 19.4 Not specified whether singleton or multiple pregnancies | 0 | 0 | Risk Ratio (M‐H, Fixed, 95% CI) | 0.0 [0.0, 0.0] |
| 20 Meconium aspiration | 0 | 0 | Risk Ratio (M‐H, Fixed, 95% CI) | 0.0 [0.0, 0.0] |
| 20.1 Singleton pregnancy | 0 | 0 | Risk Ratio (M‐H, Fixed, 95% CI) | 0.0 [0.0, 0.0] |
| 20.2 Multiple pregnancy | 0 | 0 | Risk Ratio (M‐H, Fixed, 95% CI) | 0.0 [0.0, 0.0] |
| 20.3 Singleton plus multiple pregnancies | 0 | 0 | Risk Ratio (M‐H, Fixed, 95% CI) | 0.0 [0.0, 0.0] |
| 20.4 Not specified whether singleton or multiple pregnancies | 0 | 0 | Risk Ratio (M‐H, Fixed, 95% CI) | 0.0 [0.0, 0.0] |
| 21 Neonatal admission to SCBU and/or NICU | 12 | 9334 | Risk Ratio (M‐H, Fixed, 95% CI) | 0.95 [0.89, 1.03] |
| 21.1 Singleton pregnancy | 8 | 4511 | Risk Ratio (M‐H, Fixed, 95% CI) | 0.92 [0.80, 1.06] |
| 21.2 Multiple pregnancy | 1 | 1052 | Risk Ratio (M‐H, Fixed, 95% CI) | 0.96 [0.88, 1.05] |
| 21.3 Singleton plus multiple pregnancies | 2 | 2874 | Risk Ratio (M‐H, Fixed, 95% CI) | 0.98 [0.83, 1.16] |
| 21.4 Not specified whether singleton or multiple pregnancies | 1 | 897 | Risk Ratio (M‐H, Fixed, 95% CI) | 1.00 [0.73, 1.37] |
| 22 Hypoxic ischaemic encephalopathy | 2 | 1045 | Risk Ratio (M‐H, Random, 95% CI) | 0.65 [0.01, 33.07] |
| 22.1 Singleton pregnancy | 1 | 500 | Risk Ratio (M‐H, Random, 95% CI) | 0.09 [0.01, 1.64] |
| 22.2 Multiple pregnancy | 0 | 0 | Risk Ratio (M‐H, Random, 95% CI) | 0.0 [0.0, 0.0] |
| 22.3 Singleton plus multiple pregnancies | 1 | 545 | Risk Ratio (M‐H, Random, 95% CI) | 4.91 [0.24, 101.79] |
| 22.4 Not specified whether singleton or multiple pregnancies | 0 | 0 | Risk Ratio (M‐H, Random, 95% CI) | 0.0 [0.0, 0.0] |
| 23 Intraventricular haemorrhage | 4 | 2008 | Risk Ratio (M‐H, Fixed, 95% CI) | 1.42 [0.47, 4.30] |
| 23.1 Singleton pregnancy | 3 | 1463 | Risk Ratio (M‐H, Fixed, 95% CI) | 1.26 [0.38, 4.16] |
| 23.2 Multiple pregnancy | 0 | 0 | Risk Ratio (M‐H, Fixed, 95% CI) | 0.0 [0.0, 0.0] |
| 23.3 Singleton plus multiple pregnancies | 1 | 545 | Risk Ratio (M‐H, Fixed, 95% CI) | 2.95 [0.12, 71.99] |
| 23.4 Not specified whether singleton or multiple pregnancies | 0 | 0 | Risk Ratio (M‐H, Fixed, 95% CI) | 0.0 [0.0, 0.0] |
| 24 Bronchopulmonary dysplasia | 0 | 0 | Risk Ratio (M‐H, Fixed, 95% CI) | 0.0 [0.0, 0.0] |
| 24.1 Singleton pregnancy | 0 | 0 | Risk Ratio (M‐H, Fixed, 95% CI) | 0.0 [0.0, 0.0] |
| 24.2 Multiple pregnancy | 0 | 0 | Risk Ratio (M‐H, Fixed, 95% CI) | 0.0 [0.0, 0.0] |
| 24.3 Singleton plus multiple pregnancies | 0 | 0 | Risk Ratio (M‐H, Fixed, 95% CI) | 0.0 [0.0, 0.0] |
| 24.4 Not specified whether singleton or multiple pregnancies | 0 | 0 | Risk Ratio (M‐H, Fixed, 95% CI) | 0.0 [0.0, 0.0] |
| 25 Necrotising enterocolitis | 0 | 0 | Risk Ratio (M‐H, Fixed, 95% CI) | 0.0 [0.0, 0.0] |
| 25.1 Singleton pregnancy | 0 | 0 | Risk Ratio (M‐H, Fixed, 95% CI) | 0.0 [0.0, 0.0] |
| 25.2 Multiple pregnancy | 0 | 0 | Risk Ratio (M‐H, Fixed, 95% CI) | 0.0 [0.0, 0.0] |
| 25.3 Single plus multiple pregnancies | 0 | 0 | Risk Ratio (M‐H, Fixed, 95% CI) | 0.0 [0.0, 0.0] |
| 25.4 Not specified whether singleton or multiple pregnancies | 0 | 0 | Risk Ratio (M‐H, Fixed, 95% CI) | 0.0 [0.0, 0.0] |
| 26 Long‐term infant neurodevelopmental outcome | 0 | 0 | Risk Ratio (M‐H, Fixed, 95% CI) | 0.0 [0.0, 0.0] |
| 26.1 Singleton pregnancy | 0 | 0 | Risk Ratio (M‐H, Fixed, 95% CI) | 0.0 [0.0, 0.0] |
| 26.2 Multiple pregnancy | 0 | 0 | Risk Ratio (M‐H, Fixed, 95% CI) | 0.0 [0.0, 0.0] |
| 26.3 Singleton plus multiple pregnancy | 0 | 0 | Risk Ratio (M‐H, Fixed, 95% CI) | 0.0 [0.0, 0.0] |
| 26.4 Not specified whether singleton or multiple pregnancies | 0 | 0 | Risk Ratio (M‐H, Fixed, 95% CI) | 0.0 [0.0, 0.0] |
| 27 Women's views of their care | 0 | 0 | Risk Ratio (M‐H, Fixed, 95% CI) | 0.0 [0.0, 0.0] |
| 27.1 Singleton pregnancy | 0 | 0 | Risk Ratio (M‐H, Fixed, 95% CI) | 0.0 [0.0, 0.0] |
| 27.2 Not specified whether singleton or multiple pregnancies | 0 | 0 | Risk Ratio (M‐H, Fixed, 95% CI) | 0.0 [0.0, 0.0] |
| 27.3 Multiple pregnancy | 0 | 0 | Risk Ratio (M‐H, Fixed, 95% CI) | 0.0 [0.0, 0.0] |
| 27.4 Singleton plus multiple pregnancies | 0 | 0 | Risk Ratio (M‐H, Fixed, 95% CI) | 0.0 [0.0, 0.0] |
| 28 Gestational age at birth | 8 | 4066 | Mean Difference (IV, Random, 95% CI) | 0.21 [‐0.02, 0.43] |
| 28.1 Singleton pregnancy | 3 | 1043 | Mean Difference (IV, Random, 95% CI) | 0.54 [‐0.00, 1.09] |
| 28.2 Multiple pregnancy | 1 | 1052 | Mean Difference (IV, Random, 95% CI) | 0.10 [‐0.24, 0.44] |
| 28.3 Singleton plus multiple pregnancies | 1 | 545 | Mean Difference (IV, Random, 95% CI) | ‐0.20 [‐0.81, 0.41] |
| 28.4 Not specified whether singleton or multiple pregnancies | 3 | 1426 | Mean Difference (IV, Random, 95% CI) | 0.11 [‐0.16, 0.38] |
| 29 Birth weight | 7 | 3887 | Mean Difference (IV, Fixed, 95% CI) | 31.33 [‐8.70, 71.37] |
| 29.1 Singleton pregnancy | 3 | 1916 | Mean Difference (IV, Fixed, 95% CI) | 49.34 [‐0.62, 99.31] |
| 29.2 Multiple pregnancy | 0 | 0 | Mean Difference (IV, Fixed, 95% CI) | 0.0 [0.0, 0.0] |
| 29.3 Singleton plus multiple pregnancies | 1 | 545 | Mean Difference (IV, Fixed, 95% CI) | ‐48.0 [‐192.49, 96.49] |
| 29.4 Not specified whether singleton or multiple pregnancies | 3 | 1426 | Mean Difference (IV, Fixed, 95% CI) | 11.89 [‐63.58, 87.36] |
| 30 Length of infant hospital stay | 3 | 1076 | Std. Mean Difference (IV, Fixed, 95% CI) | ‐0.28 [‐0.40, ‐0.16] |
| 30.1 Singleton pregnancy | 3 | 1076 | Std. Mean Difference (IV, Fixed, 95% CI) | ‐0.28 [‐0.40, ‐0.16] |
| 30.2 Multiple pregnancy | 0 | 0 | Std. Mean Difference (IV, Fixed, 95% CI) | 0.0 [0.0, 0.0] |
| 30.3 Singleton plus multiple pregnancies | 0 | 0 | Std. Mean Difference (IV, Fixed, 95% CI) | 0.0 [0.0, 0.0] |
| 30.4 Not specified whether singleton or multiple pregnancies | 0 | 0 | Std. Mean Difference (IV, Fixed, 95% CI) | 0.0 [0.0, 0.0] |
| 31 Birth < 34 weeks (not prespecified) | 2 | 976 | Risk Ratio (M‐H, Random, 95% CI) | 2.04 [0.62, 6.69] |
| 31.1 Singleton pregnancy | 1 | 500 | Risk Ratio (M‐H, Random, 95% CI) | 1.17 [0.40, 3.42] |
| 31.2 Multiple pregnancy | 0 | 0 | Risk Ratio (M‐H, Random, 95% CI) | 0.0 [0.0, 0.0] |
| 31.3 Singleton plus multiple pregnancies | 0 | 0 | Risk Ratio (M‐H, Random, 95% CI) | 0.0 [0.0, 0.0] |
| 31.4 Not specified whether singleton or multiple pregnancies | 1 | 476 | Risk Ratio (M‐H, Random, 95% CI) | 3.90 [1.11, 13.65] |
| 32 Antenatal admissions (not prespecified) | 2 | 893 | Risk Ratio (M‐H, Fixed, 95% CI) | 0.72 [0.60, 0.88] |
| 32.1 Singleton pregnancy | 2 | 893 | Risk Ratio (M‐H, Fixed, 95% CI) | 0.72 [0.60, 0.88] |
| 32.2 Multiple pregnancy | 0 | 0 | Risk Ratio (M‐H, Fixed, 95% CI) | 0.0 [0.0, 0.0] |
| 32.3 Singleton plus multiple pregnancies | 0 | 0 | Risk Ratio (M‐H, Fixed, 95% CI) | 0.0 [0.0, 0.0] |
| 32.4 Not specified whether singleton or multiple pregnancies | 0 | 0 | Risk Ratio (M‐H, Fixed, 95% CI) | 0.0 [0.0, 0.0] |
| 33 Phototherapy for neonatal jaundice (not prespecified) | 1 | 150 | Risk Ratio (M‐H, Fixed, 95% CI) | 0.15 [0.01, 2.87] |
| 33.1 Singleton pregnancy | 1 | 150 | Risk Ratio (M‐H, Fixed, 95% CI) | 0.15 [0.01, 2.87] |
| 33.2 Multiple pregnancy | 0 | 0 | Risk Ratio (M‐H, Fixed, 95% CI) | 0.0 [0.0, 0.0] |
| 33.3 Singleton plus multiple pregnancies | 0 | 0 | Risk Ratio (M‐H, Fixed, 95% CI) | 0.0 [0.0, 0.0] |
| 33.4 Not specified whether singleton or multiple pregnancies | 0 | 0 | Risk Ratio (M‐H, Fixed, 95% CI) | 0.0 [0.0, 0.0] |
| 34 Abnormal neurological development at 9months (not pre‐specified) | 1 | 137 | Risk Ratio (M‐H, Fixed, 95% CI) | 0.61 [0.26, 1.45] |
| 34.1 Singleton pregnancy | 1 | 137 | Risk Ratio (M‐H, Fixed, 95% CI) | 0.61 [0.26, 1.45] |
| 34.2 Multiple pregnancy | 0 | 0 | Risk Ratio (M‐H, Fixed, 95% CI) | 0.0 [0.0, 0.0] |
| 34.3 Singleton plus multiple pregnancies | 0 | 0 | Risk Ratio (M‐H, Fixed, 95% CI) | 0.0 [0.0, 0.0] |
| 34.4 Not specified whether singleton or multiple pregnancies | 0 | 0 | Risk Ratio (M‐H, Fixed, 95% CI) | 0.0 [0.0, 0.0] |
| 35 Hospitalisation for IUGR neonatal (not prespecified) | 1 | 142 | Risk Ratio (M‐H, Fixed, 95% CI) | 1.03 [0.75, 1.41] |
| 35.1 Singleton pregnancy | 1 | 142 | Risk Ratio (M‐H, Fixed, 95% CI) | 1.03 [0.75, 1.41] |
| 35.2 Multiple pregnancy | 0 | 0 | Risk Ratio (M‐H, Fixed, 95% CI) | 0.0 [0.0, 0.0] |
| 35.3 Singleton plus multiple pregnancies | 0 | 0 | Risk Ratio (M‐H, Fixed, 95% CI) | 0.0 [0.0, 0.0] |
| 35.4 Not specified whether singleton or multiple pregnancies | 0 | 0 | Risk Ratio (M‐H, Fixed, 95% CI) | 0.0 [0.0, 0.0] |
| 36 Fetal distress in labour (not prespecified) | 1 | 289 | Risk Ratio (M‐H, Fixed, 95% CI) | 0.35 [0.10, 1.22] |
| 36.1 Singleton pregnancy | 1 | 289 | Risk Ratio (M‐H, Fixed, 95% CI) | 0.35 [0.10, 1.22] |
| 36.2 Multiple pregnancy | 0 | 0 | Risk Ratio (M‐H, Fixed, 95% CI) | 0.0 [0.0, 0.0] |
| 36.3 Singleton plus multiple pregnancies | 0 | 0 | Risk Ratio (M‐H, Fixed, 95% CI) | 0.0 [0.0, 0.0] |
| 36.4 Not specified whether singleton or multiple pregnancies | 0 | 0 | Risk Ratio (M‐H, Fixed, 95% CI) | 0.0 [0.0, 0.0] |
| 37 Birth weight < 5 percentile (not prespecified) | 1 | 289 | Risk Ratio (M‐H, Fixed, 95% CI) | 1.16 [0.51, 2.64] |
| 37.1 Singleton pregnancy | 1 | 289 | Risk Ratio (M‐H, Fixed, 95% CI) | 1.16 [0.51, 2.64] |
| 37.2 Multiple pregnancy | 0 | 0 | Risk Ratio (M‐H, Fixed, 95% CI) | 0.0 [0.0, 0.0] |
| 37.3 Singleton plus multiple pregnancies | 0 | 0 | Risk Ratio (M‐H, Fixed, 95% CI) | 0.0 [0.0, 0.0] |
| 37.4 Not specified whether singleton or multiple pregnancies | 0 | 0 | Risk Ratio (M‐H, Fixed, 95% CI) | 0.0 [0.0, 0.0] |
| 38 Periventricular leucomalacia (not prespecified) | 1 | 545 | Risk Ratio (M‐H, Fixed, 95% CI) | 0.33 [0.01, 8.00] |
| 38.1 Singleton pregnancy | 0 | 0 | Risk Ratio (M‐H, Fixed, 95% CI) | 0.0 [0.0, 0.0] |
| 38.2 Multiple pregnancy | 0 | 0 | Risk Ratio (M‐H, Fixed, 95% CI) | 0.0 [0.0, 0.0] |
| 38.3 Singleton plus multiple pregnancies | 1 | 545 | Risk Ratio (M‐H, Fixed, 95% CI) | 0.33 [0.01, 8.00] |
| 38.4 Not specified whether singleton or multiple pregnancies | 0 | 0 | Risk Ratio (M‐H, Fixed, 95% CI) | 0.0 [0.0, 0.0] |
| 39 Antenatal hospital stay | 1 | 426 | Mean Difference (IV, Fixed, 95% CI) | ‐0.60 [‐2.39, 1.19] |
| 39.1 Singleton pregnancy | 1 | 426 | Mean Difference (IV, Fixed, 95% CI) | ‐0.60 [‐2.39, 1.19] |
| 39.2 Multiple pregnancy | 0 | 0 | Mean Difference (IV, Fixed, 95% CI) | 0.0 [0.0, 0.0] |
| 39.3 Singleton plus multiple pregnancies | 0 | 0 | Mean Difference (IV, Fixed, 95% CI) | 0.0 [0.0, 0.0] |
| 39.4 Not specified whether singleton or multiple pregnancies | 0 | 0 | Mean Difference (IV, Fixed, 95% CI) | 0.0 [0.0, 0.0] |
Analysis 1.17.
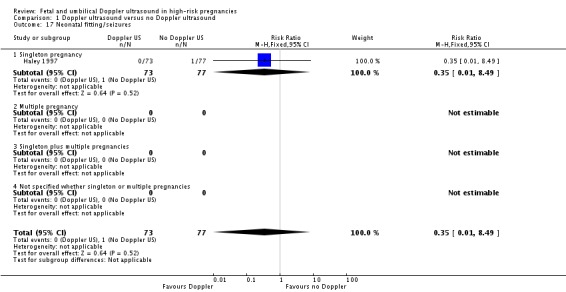
Comparison 1 Doppler ultrasound versus no Doppler ultrasound, Outcome 17 Neonatal fitting/seizures.
Analysis 1.18.
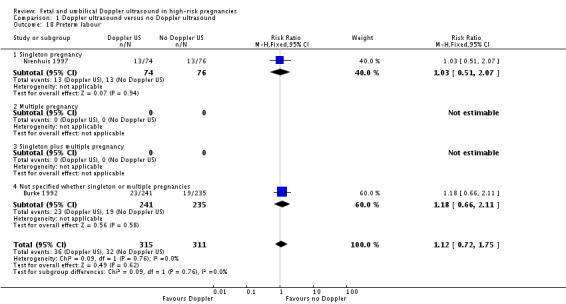
Comparison 1 Doppler ultrasound versus no Doppler ultrasound, Outcome 18 Preterm labour.
Analysis 1.19.

Comparison 1 Doppler ultrasound versus no Doppler ultrasound, Outcome 19 Infant respiratory distress syndrome (RDS).
Analysis 1.21.
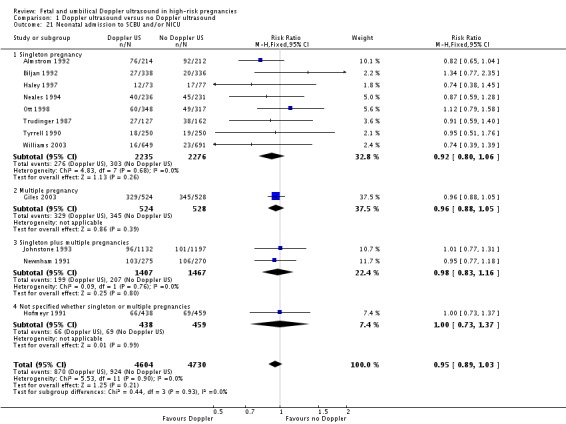
Comparison 1 Doppler ultrasound versus no Doppler ultrasound, Outcome 21 Neonatal admission to SCBU and/or NICU.
Analysis 1.22.
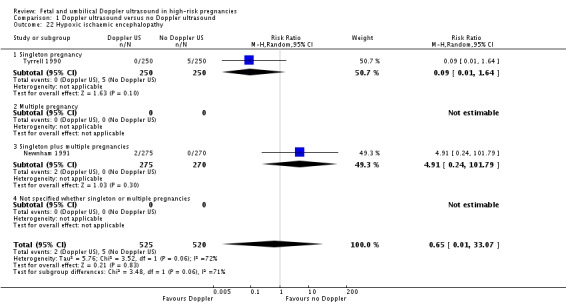
Comparison 1 Doppler ultrasound versus no Doppler ultrasound, Outcome 22 Hypoxic ischaemic encephalopathy.
Analysis 1.23.
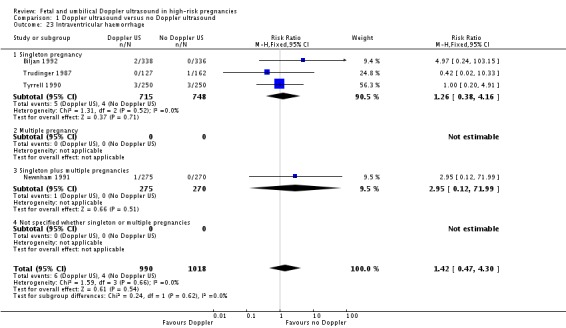
Comparison 1 Doppler ultrasound versus no Doppler ultrasound, Outcome 23 Intraventricular haemorrhage.
Analysis 1.29.

Comparison 1 Doppler ultrasound versus no Doppler ultrasound, Outcome 29 Birth weight.
Analysis 1.39.

Comparison 1 Doppler ultrasound versus no Doppler ultrasound, Outcome 39 Antenatal hospital stay.
Comparison 2.
Doppler ultrasound versus no Doppler ultrasound (all subgroups)
| Outcome or subgroup title | No. of studies | No. of participants | Statistical method | Effect size |
|---|---|---|---|---|
| 1 Any perinatal death after randomisation | 6 | Risk Ratio (M‐H, Fixed, 95% CI) | Subtotals only | |
| 1.1 SGA/IUGR | 5 | 1292 | Risk Ratio (M‐H, Fixed, 95% CI) | 0.72 [0.38, 1.35] |
| 1.2 Hypertension/pre‐eclampsia | 1 | 89 | Risk Ratio (M‐H, Fixed, 95% CI) | 3.57 [0.42, 30.73] |
| 1.3 Diabetes | 0 | 0 | Risk Ratio (M‐H, Fixed, 95% CI) | 0.0 [0.0, 0.0] |
| 1.4 Prolonged pregnancy | 0 | 0 | Risk Ratio (M‐H, Fixed, 95% CI) | 0.0 [0.0, 0.0] |
| 1.5 Previous pregnancy loss | 1 | 53 | Risk Ratio (M‐H, Fixed, 95% CI) | 0.26 [0.03, 2.17] |
| 2 Serious neonatal morbidity | 1 | 53 | Risk Ratio (M‐H, Random, 95% CI) | 0.0 [0.0, 0.0] |
| 2.1 SGA/IUGR | 0 | 0 | Risk Ratio (M‐H, Random, 95% CI) | 0.0 [0.0, 0.0] |
| 2.2 Hypertension/pre‐eclampsia | 0 | 0 | Risk Ratio (M‐H, Random, 95% CI) | 0.0 [0.0, 0.0] |
| 2.3 Diabetes | 0 | 0 | Risk Ratio (M‐H, Random, 95% CI) | 0.0 [0.0, 0.0] |
| 2.4 Prolonged pregnancy | 0 | 0 | Risk Ratio (M‐H, Random, 95% CI) | 0.0 [0.0, 0.0] |
| 2.5 Previous pregnancy loss | 1 | 53 | Risk Ratio (M‐H, Random, 95% CI) | 0.0 [0.0, 0.0] |
Analysis 2.2.

Comparison 2 Doppler ultrasound versus no Doppler ultrasound (all subgroups), Outcome 2 Serious neonatal morbidity.
Comparison 3.
Doppler ultrasound alone versus CTG alone
| Outcome or subgroup title | No. of studies | No. of participants | Statistical method | Effect size |
|---|---|---|---|---|
| 1 Any perinatal death after randomisation | 4 | 2813 | Risk Ratio (M‐H, Fixed, 95% CI) | 0.45 [0.17, 1.15] |
| 1.1 Singleton pregnancy | 3 | 1916 | Risk Ratio (M‐H, Fixed, 95% CI) | 0.34 [0.07, 1.68] |
| 1.2 Multiple pregnancy | 0 | 0 | Risk Ratio (M‐H, Fixed, 95% CI) | 0.0 [0.0, 0.0] |
| 1.3 Singleton plus multiple pregnancies | 0 | 0 | Risk Ratio (M‐H, Fixed, 95% CI) | 0.0 [0.0, 0.0] |
| 1.4 Not specified whether singleton or multiple pregnancies | 1 | 897 | Risk Ratio (M‐H, Fixed, 95% CI) | 0.52 [0.16, 1.73] |
| 2 Serious neonatal morbidity | 0 | 0 | Risk Ratio (M‐H, Fixed, 95% CI) | 0.0 [0.0, 0.0] |
| 2.1 Singleton pregnancy | 0 | 0 | Risk Ratio (M‐H, Fixed, 95% CI) | 0.0 [0.0, 0.0] |
| 2.2 Multiple pregnancy | 0 | 0 | Risk Ratio (M‐H, Fixed, 95% CI) | 0.0 [0.0, 0.0] |
| 2.3 Singleton plus multiple pregnancies | 0 | 0 | Risk Ratio (M‐H, Fixed, 95% CI) | 0.0 [0.0, 0.0] |
| 2.4 Not specified whether singleton or multiple pregnancies | 0 | 0 | Risk Ratio (M‐H, Fixed, 95% CI) | 0.0 [0.0, 0.0] |
| 3 Stillbirth | 4 | 2813 | Risk Ratio (M‐H, Fixed, 95% CI) | 0.48 [0.14, 1.71] |
| 3.1 Singleton pregnancy | 3 | 1916 | Risk Ratio (M‐H, Fixed, 95% CI) | 0.28 [0.05, 1.70] |
| 3.2 Multiple pregnancy | 0 | 0 | Risk Ratio (M‐H, Fixed, 95% CI) | 0.0 [0.0, 0.0] |
| 3.3 Singleton plus multiple pregnancies | 0 | 0 | Risk Ratio (M‐H, Fixed, 95% CI) | 0.0 [0.0, 0.0] |
| 3.4 Not specified whether singleton or multiple pregnancies | 1 | 897 | Risk Ratio (M‐H, Fixed, 95% CI) | 1.05 [0.15, 7.41] |
| 4 Neonatal death | 3 | 1473 | Risk Ratio (M‐H, Fixed, 95% CI) | 0.52 [0.16, 1.72] |
| 4.1 Singleton pregnancy | 2 | 576 | Risk Ratio (M‐H, Fixed, 95% CI) | 1.02 [0.15, 7.10] |
| 4.2 Multiple pregnancy | 0 | 0 | Risk Ratio (M‐H, Fixed, 95% CI) | 0.0 [0.0, 0.0] |
| 4.3 Singleton plus multiple pregnancies | 0 | 0 | Risk Ratio (M‐H, Fixed, 95% CI) | 0.0 [0.0, 0.0] |
| 4.4 Not specified whether singleton or multiple pregnancies | 1 | 897 | Risk Ratio (M‐H, Fixed, 95% CI) | 0.35 [0.07, 1.72] |
| 5 Any potentially preventable perinatal death* | 4 | 2813 | Risk Ratio (M‐H, Fixed, 95% CI) | 0.38 [0.12, 1.18] |
| 5.1 Singleton pregnancy | 3 | 1916 | Risk Ratio (M‐H, Fixed, 95% CI) | 0.41 [0.08, 2.11] |
| 5.2 Multiple pregnancy | 0 | 0 | Risk Ratio (M‐H, Fixed, 95% CI) | 0.0 [0.0, 0.0] |
| 5.3 Singleton plus multiple pregnancies | 0 | 0 | Risk Ratio (M‐H, Fixed, 95% CI) | 0.0 [0.0, 0.0] |
| 5.4 Not specified whether singleton or multiple pregnancies | 1 | 897 | Risk Ratio (M‐H, Fixed, 95% CI) | 0.35 [0.07, 1.72] |
| 6 Fetal acidosis | 0 | 0 | Risk Ratio (M‐H, Fixed, 95% CI) | 0.0 [0.0, 0.0] |
| 6.1 Singleton pregnancy | 0 | 0 | Risk Ratio (M‐H, Fixed, 95% CI) | 0.0 [0.0, 0.0] |
| 6.2 Multiple pregnancy | 0 | 0 | Risk Ratio (M‐H, Fixed, 95% CI) | 0.0 [0.0, 0.0] |
| 6.3 Singleton plus multiple pregnancies | 0 | 0 | Risk Ratio (M‐H, Fixed, 95% CI) | 0.0 [0.0, 0.0] |
| 6.4 Not specified whether singleton or multiple pregnancies | 0 | 0 | Risk Ratio (M‐H, Fixed, 95% CI) | 0.0 [0.0, 0.0] |
| 7 Apgar < 7 at 5 minutes | 3 | 2663 | Risk Ratio (M‐H, Fixed, 95% CI) | 0.86 [0.54, 1.37] |
| 7.1 Singleton pregnancy | 2 | 1766 | Risk Ratio (M‐H, Fixed, 95% CI) | 0.83 [0.49, 1.43] |
| 7.2 Multiple pregnancy | 0 | 0 | Risk Ratio (M‐H, Fixed, 95% CI) | 0.0 [0.0, 0.0] |
| 7.3 Singleton plus multiple pregnancies | 0 | 0 | Risk Ratio (M‐H, Fixed, 95% CI) | 0.0 [0.0, 0.0] |
| 7.4 Not specified whether singleton or multiple pregnancies | 1 | 897 | Risk Ratio (M‐H, Fixed, 95% CI) | 0.93 [0.36, 2.39] |
| 8 Caesarean section (elective and emergency) | 4 | 2813 | Risk Ratio (M‐H, Fixed, 95% CI) | 0.89 [0.79, 1.01] |
| 8.1 Singleton pregnancy | 3 | 1916 | Risk Ratio (M‐H, Fixed, 95% CI) | 0.89 [0.77, 1.02] |
| 8.2 Multiple pregnancy | 0 | 0 | Risk Ratio (M‐H, Fixed, 95% CI) | 0.0 [0.0, 0.0] |
| 8.3 Singleton plus multiple pregnancies | 0 | 0 | Risk Ratio (M‐H, Fixed, 95% CI) | 0.0 [0.0, 0.0] |
| 8.4 Not specified whether singleton or multiple pregnancies | 1 | 897 | Risk Ratio (M‐H, Fixed, 95% CI) | 0.91 [0.73, 1.14] |
| 9 Caesarean section ‐ elective | 3 | 1473 | Risk Ratio (M‐H, Fixed, 95% CI) | 1.53 [1.12, 2.09] |
| 9.1 Singleton pregnancy | 2 | 576 | Risk Ratio (M‐H, Fixed, 95% CI) | 1.69 [1.07, 2.67] |
| 9.2 Multiple pregnancy | 0 | 0 | Risk Ratio (M‐H, Fixed, 95% CI) | 0.0 [0.0, 0.0] |
| 9.3 Singleton plus multiple pregnancies | 0 | 0 | Risk Ratio (M‐H, Fixed, 95% CI) | 0.0 [0.0, 0.0] |
| 9.4 Not specified whether singleton or multiple pregnancies | 1 | 897 | Risk Ratio (M‐H, Fixed, 95% CI) | 1.40 [0.91, 2.15] |
| 10 Caesarean section ‐ emergency | 3 | 1473 | Risk Ratio (M‐H, Fixed, 95% CI) | 0.66 [0.52, 0.84] |
| 10.1 Singleton pregnancy | 2 | 576 | Risk Ratio (M‐H, Fixed, 95% CI) | 0.55 [0.36, 0.83] |
| 10.2 Multiple pregnancy | 0 | 0 | Risk Ratio (M‐H, Fixed, 95% CI) | 0.0 [0.0, 0.0] |
| 10.3 Singleton plus multiple pregnancies | 0 | 0 | Risk Ratio (M‐H, Fixed, 95% CI) | 0.0 [0.0, 0.0] |
| 10.4 Not specified whether singleton or multiple pregnancies | 1 | 897 | Risk Ratio (M‐H, Fixed, 95% CI) | 0.73 [0.55, 0.98] |
| 11 Spontaneous vaginal birth | 2 | 1323 | Risk Ratio (M‐H, Fixed, 95% CI) | 1.06 [0.97, 1.15] |
| 11.1 Singleton pregnancy | 1 | 426 | Risk Ratio (M‐H, Fixed, 95% CI) | 1.04 [0.91, 1.19] |
| 11.2 Multiple pregnancy | 0 | 0 | Risk Ratio (M‐H, Fixed, 95% CI) | 0.0 [0.0, 0.0] |
| 11.3 Singleton plus multiple pregnancies | 0 | 0 | Risk Ratio (M‐H, Fixed, 95% CI) | 0.0 [0.0, 0.0] |
| 11.4 Not specified whether singleton or multiple pregnancies | 1 | 897 | Risk Ratio (M‐H, Fixed, 95% CI) | 1.06 [0.95, 1.19] |
| 12 Operative vaginal birth | 3 | 2663 | Risk Ratio (M‐H, Fixed, 95% CI) | 0.98 [0.81, 1.17] |
| 12.1 Singleton pregnancy | 2 | 1766 | Risk Ratio (M‐H, Fixed, 95% CI) | 1.01 [0.80, 1.27] |
| 12.2 Multiple pregnancy | 0 | 0 | Risk Ratio (M‐H, Fixed, 95% CI) | 0.0 [0.0, 0.0] |
| 12.3 Singleton plus multiple pregnancies | 0 | 0 | Risk Ratio (M‐H, Fixed, 95% CI) | 0.0 [0.0, 0.0] |
| 12.4 Not specified whether singleton or multiple pregnancies | 1 | 897 | Risk Ratio (M‐H, Fixed, 95% CI) | 0.92 [0.68, 1.25] |
| 13 Induction of labour | 2 | 576 | Risk Ratio (M‐H, Random, 95% CI) | 0.67 [0.32, 1.40] |
| 13.1 Singleton pregnancy | 2 | 576 | Risk Ratio (M‐H, Random, 95% CI) | 0.67 [0.32, 1.40] |
| 13.2 Multiple pregnancy | 0 | 0 | Risk Ratio (M‐H, Random, 95% CI) | 0.0 [0.0, 0.0] |
| 13.3 Singleton plus multiple pregnancies | 0 | 0 | Risk Ratio (M‐H, Random, 95% CI) | 0.0 [0.0, 0.0] |
| 13.4 Not specified whether singleton or multiple pregnancies | 0 | 0 | Risk Ratio (M‐H, Random, 95% CI) | 0.0 [0.0, 0.0] |
| 14 Oxytocin augmentation | 0 | 0 | Risk Ratio (M‐H, Fixed, 95% CI) | 0.0 [0.0, 0.0] |
| 14.1 Singleton pregnancy | 0 | 0 | Risk Ratio (M‐H, Fixed, 95% CI) | 0.0 [0.0, 0.0] |
| 14.2 Multiple pregnancy | 0 | 0 | Risk Ratio (M‐H, Fixed, 95% CI) | 0.0 [0.0, 0.0] |
| 14.3 Singleton plus multiple pregnancies | 0 | 0 | Risk Ratio (M‐H, Fixed, 95% CI) | 0.0 [0.0, 0.0] |
| 14.4 Not specified whether singleton or multiple pregnancies | 0 | 0 | Risk Ratio (M‐H, Fixed, 95% CI) | 0.0 [0.0, 0.0] |
| 15 Neonatal resuscitation required | 0 | 0 | Risk Ratio (M‐H, Fixed, 95% CI) | 0.0 [0.0, 0.0] |
| 15.1 Singleton pregnancy | 0 | 0 | Risk Ratio (M‐H, Fixed, 95% CI) | 0.0 [0.0, 0.0] |
| 15.2 Multiple pregnancy | 0 | 0 | Risk Ratio (M‐H, Fixed, 95% CI) | 0.0 [0.0, 0.0] |
| 15.3 Singleton plus multiple pregnancies | 0 | 0 | Risk Ratio (M‐H, Fixed, 95% CI) | 0.0 [0.0, 0.0] |
| 15.4 Not specified whether singleton or multiple pregnancies | 0 | 0 | Risk Ratio (M‐H, Fixed, 95% CI) | 0.0 [0.0, 0.0] |
| 16 Infant requiring intubation/ventilation | 2 | 576 | Risk Ratio (M‐H, Fixed, 95% CI) | 1.54 [0.26, 9.08] |
| 16.1 Singleton pregnancy | 2 | 576 | Risk Ratio (M‐H, Fixed, 95% CI) | 1.54 [0.26, 9.08] |
| 16.2 Multiple pregnancy | 0 | 0 | Risk Ratio (M‐H, Fixed, 95% CI) | 0.0 [0.0, 0.0] |
| 16.3 Singleton plus multiple pregnancies | 0 | 0 | Risk Ratio (M‐H, Fixed, 95% CI) | 0.0 [0.0, 0.0] |
| 16.4 Not specified whether singleton or multiple pregnancies | 0 | 0 | Risk Ratio (M‐H, Fixed, 95% CI) | 0.0 [0.0, 0.0] |
| 17 Neonatal fitting/seizures | 1 | 150 | Risk Ratio (M‐H, Fixed, 95% CI) | 0.35 [0.01, 8.49] |
| 17.1 Singleton pregnancy | 1 | 150 | Risk Ratio (M‐H, Fixed, 95% CI) | 0.35 [0.01, 8.49] |
| 17.2 Multiple pregnancy | 0 | 0 | Risk Ratio (M‐H, Fixed, 95% CI) | 0.0 [0.0, 0.0] |
| 17.3 Singleton plus multiple pregnancies | 0 | 0 | Risk Ratio (M‐H, Fixed, 95% CI) | 0.0 [0.0, 0.0] |
| 17.4 Not specified whether singleton or multiple pregnancies | 0 | 0 | Risk Ratio (M‐H, Fixed, 95% CI) | 0.0 [0.0, 0.0] |
| 18 Preterm labour | 0 | 0 | Risk Ratio (M‐H, Fixed, 95% CI) | 0.0 [0.0, 0.0] |
| 18.1 Singleton pregnancy | 0 | 0 | Risk Ratio (M‐H, Fixed, 95% CI) | 0.0 [0.0, 0.0] |
| 18.2 Multiple pregnancy | 0 | 0 | Risk Ratio (M‐H, Fixed, 95% CI) | 0.0 [0.0, 0.0] |
| 18.3 Singleton plus multiple pregnancies | 0 | 0 | Risk Ratio (M‐H, Fixed, 95% CI) | 0.0 [0.0, 0.0] |
| 18.4 Not specified whether singleton or multiple pregnancies | 0 | 0 | Risk Ratio (M‐H, Fixed, 95% CI) | 0.0 [0.0, 0.0] |
| 19 Infant respiratory distress syndrome | 0 | 0 | Risk Ratio (M‐H, Fixed, 95% CI) | 0.0 [0.0, 0.0] |
| 19.1 Singleton pregnancy | 0 | 0 | Risk Ratio (M‐H, Fixed, 95% CI) | 0.0 [0.0, 0.0] |
| 19.2 Multiple pregnancy | 0 | 0 | Risk Ratio (M‐H, Fixed, 95% CI) | 0.0 [0.0, 0.0] |
| 19.3 Singleton plus multiple pregnancies | 0 | 0 | Risk Ratio (M‐H, Fixed, 95% CI) | 0.0 [0.0, 0.0] |
| 19.4 Not specified whether singleton or multiple pregnancies | 0 | 0 | Risk Ratio (M‐H, Fixed, 95% CI) | 0.0 [0.0, 0.0] |
| 20 Meconium aspiration | 0 | 0 | Risk Ratio (M‐H, Fixed, 95% CI) | 0.0 [0.0, 0.0] |
| 20.1 Singleton pregnancy | 0 | 0 | Risk Ratio (M‐H, Fixed, 95% CI) | 0.0 [0.0, 0.0] |
| 20.2 Multiple pregnancy | 0 | 0 | Risk Ratio (M‐H, Fixed, 95% CI) | 0.0 [0.0, 0.0] |
| 20.3 Singleton plus multiple pregnancies | 0 | 0 | Risk Ratio (M‐H, Fixed, 95% CI) | 0.0 [0.0, 0.0] |
| 20.4 Not specified whether singleton or multiple pregnancies | 0 | 0 | Risk Ratio (M‐H, Fixed, 95% CI) | 0.0 [0.0, 0.0] |
| 21 Neonatal admission to SCBU and/or NICU | 4 | 2813 | Risk Ratio (M‐H, Fixed, 95% CI) | 0.87 [0.73, 1.03] |
| 21.1 Singleton pregnancy | 3 | 1916 | Risk Ratio (M‐H, Fixed, 95% CI) | 0.80 [0.64, 0.99] |
| 21.2 Multiple pregnancy | 0 | 0 | Risk Ratio (M‐H, Fixed, 95% CI) | 0.0 [0.0, 0.0] |
| 21.3 Singleton plus multiple pregnancies | 0 | 0 | Risk Ratio (M‐H, Fixed, 95% CI) | 0.0 [0.0, 0.0] |
| 21.4 Not specified whether singleton or multiple pregnancies | 1 | 897 | Risk Ratio (M‐H, Fixed, 95% CI) | 1.00 [0.73, 1.37] |
| 22 Hypoxic ischaemic encephalopathy | 0 | 0 | Risk Ratio (M‐H, Fixed, 95% CI) | 0.0 [0.0, 0.0] |
| 22.1 Singleton pregnancy | 0 | 0 | Risk Ratio (M‐H, Fixed, 95% CI) | 0.0 [0.0, 0.0] |
| 22.2 Multiple pregnancy | 0 | 0 | Risk Ratio (M‐H, Fixed, 95% CI) | 0.0 [0.0, 0.0] |
| 22.3 Singleton plus multiple pregnancies | 0 | 0 | Risk Ratio (M‐H, Fixed, 95% CI) | 0.0 [0.0, 0.0] |
| 22.4 Not specified whether singleton or multiple pregnancies | 0 | 0 | Risk Ratio (M‐H, Fixed, 95% CI) | 0.0 [0.0, 0.0] |
| 23 Intraventricular haemorrhage | 0 | 0 | Risk Ratio (M‐H, Fixed, 95% CI) | 0.0 [0.0, 0.0] |
| 23.1 Singleton pregnancy | 0 | 0 | Risk Ratio (M‐H, Fixed, 95% CI) | 0.0 [0.0, 0.0] |
| 23.2 Multiple pregnancy | 0 | 0 | Risk Ratio (M‐H, Fixed, 95% CI) | 0.0 [0.0, 0.0] |
| 23.3 Singleton plus multiple pregnancies | 0 | 0 | Risk Ratio (M‐H, Fixed, 95% CI) | 0.0 [0.0, 0.0] |
| 23.4 Not specified whether singleton or multiple pregnancies | 0 | 0 | Risk Ratio (M‐H, Fixed, 95% CI) | 0.0 [0.0, 0.0] |
| 24 Bronchopulmonary dysplasia | 0 | 0 | Risk Ratio (M‐H, Fixed, 95% CI) | 0.0 [0.0, 0.0] |
| 24.1 Singleton pregnancy | 0 | 0 | Risk Ratio (M‐H, Fixed, 95% CI) | 0.0 [0.0, 0.0] |
| 24.2 Multiple pregnancy | 0 | 0 | Risk Ratio (M‐H, Fixed, 95% CI) | 0.0 [0.0, 0.0] |
| 24.3 Singleton plus multiple pregnancies | 0 | 0 | Risk Ratio (M‐H, Fixed, 95% CI) | 0.0 [0.0, 0.0] |
| 24.4 Not specified whether singleton or multiple pregnancies | 0 | 0 | Risk Ratio (M‐H, Fixed, 95% CI) | 0.0 [0.0, 0.0] |
| 25 Necrotising enterocolitis | 0 | 0 | Risk Ratio (M‐H, Fixed, 95% CI) | 0.0 [0.0, 0.0] |
| 25.1 Singleton pregnancy | 0 | 0 | Risk Ratio (M‐H, Fixed, 95% CI) | 0.0 [0.0, 0.0] |
| 25.2 Multiple pregnancy | 0 | 0 | Risk Ratio (M‐H, Fixed, 95% CI) | 0.0 [0.0, 0.0] |
| 25.3 Singleton plus multiple pregnancies | 0 | 0 | Risk Ratio (M‐H, Fixed, 95% CI) | 0.0 [0.0, 0.0] |
| 25.4 Not specified whether singleton or multiple pregnancies | 0 | 0 | Risk Ratio (M‐H, Fixed, 95% CI) | 0.0 [0.0, 0.0] |
| 26 Long term infant neurodevelopmental outcome | 0 | 0 | Risk Ratio (M‐H, Fixed, 95% CI) | 0.0 [0.0, 0.0] |
| 26.1 Singleton pregnancy | 0 | 0 | Risk Ratio (M‐H, Fixed, 95% CI) | 0.0 [0.0, 0.0] |
| 26.2 Multiple pregnancy | 0 | 0 | Risk Ratio (M‐H, Fixed, 95% CI) | 0.0 [0.0, 0.0] |
| 26.3 Singleton plus multiple pregnancies | 0 | 0 | Risk Ratio (M‐H, Fixed, 95% CI) | 0.0 [0.0, 0.0] |
| 26.4 Not specified whether singleton or multiple pregnancies | 0 | 0 | Risk Ratio (M‐H, Fixed, 95% CI) | 0.0 [0.0, 0.0] |
| 27 Women's views of their care | 0 | 0 | Risk Ratio (M‐H, Fixed, 95% CI) | 0.0 [0.0, 0.0] |
| 27.1 Singleton pregnancy | 0 | 0 | Risk Ratio (M‐H, Fixed, 95% CI) | 0.0 [0.0, 0.0] |
| 27.2 Multiple pregnancy | 0 | 0 | Risk Ratio (M‐H, Fixed, 95% CI) | 0.0 [0.0, 0.0] |
| 27.3 Singleton plus multiple pregnancies | 0 | 0 | Risk Ratio (M‐H, Fixed, 95% CI) | 0.0 [0.0, 0.0] |
| 27.4 Not specified whether singleton or multiple pregnancies | 0 | 0 | Risk Ratio (M‐H, Fixed, 95% CI) | 0.0 [0.0, 0.0] |
| 28 Gestational age at birth | 3 | 1473 | Mean Difference (IV, Fixed, 95% CI) | 0.23 [‐0.00, 0.47] |
| 28.1 Singleton pregnancy | 2 | 576 | Mean Difference (IV, Fixed, 95% CI) | 0.26 [‐0.06, 0.59] |
| 28.2 Multiple pregnancy | 0 | 0 | Mean Difference (IV, Fixed, 95% CI) | 0.0 [0.0, 0.0] |
| 28.3 Singleton plus multiple pregnancies | 0 | 0 | Mean Difference (IV, Fixed, 95% CI) | 0.0 [0.0, 0.0] |
| 28.4 Not specified whether singleton or multiple pregnancies | 1 | 897 | Mean Difference (IV, Fixed, 95% CI) | 0.20 [‐0.15, 0.55] |
| 29 Birth weight | 4 | 2813 | Mean Difference (IV, Fixed, 95% CI) | 38.41 [‐6.14, 82.97] |
| 29.1 Singleton pregnancy | 3 | 1916 | Mean Difference (IV, Fixed, 95% CI) | 49.34 [‐0.62, 99.31] |
| 29.2 Multiple pregnancy | 0 | 0 | Mean Difference (IV, Fixed, 95% CI) | 0.0 [0.0, 0.0] |
| 29.3 Singleton plus multiple pregnancies | 0 | 0 | Mean Difference (IV, Fixed, 95% CI) | 0.0 [0.0, 0.0] |
| 29.4 Not specified whether singleton or multiple pregnancies | 1 | 897 | Mean Difference (IV, Fixed, 95% CI) | ‐4.0 [‐102.42, 94.42] |
| 30 Length of infant hospital stay | 2 | 576 | Std. Mean Difference (IV, Fixed, 95% CI) | ‐0.25 [‐0.41, ‐0.08] |
| 30.1 Singleton pregnancy | 2 | 576 | Std. Mean Difference (IV, Fixed, 95% CI) | ‐0.25 [‐0.41, ‐0.08] |
| 30.2 Multiple pregnancy | 0 | 0 | Std. Mean Difference (IV, Fixed, 95% CI) | 0.0 [0.0, 0.0] |
| 30.3 Singleton plus multiple pregnancies | 0 | 0 | Std. Mean Difference (IV, Fixed, 95% CI) | 0.0 [0.0, 0.0] |
| 30.4 Not specified whether singleton or multiple pregnancies | 0 | 0 | Std. Mean Difference (IV, Fixed, 95% CI) | 0.0 [0.0, 0.0] |
| 31 Birth < 34 weeks (not pre‐specified) | 0 | 0 | Risk Ratio (M‐H, Fixed, 95% CI) | 0.0 [0.0, 0.0] |
| 31.1 Singleton pregnancy | 0 | 0 | Risk Ratio (M‐H, Fixed, 95% CI) | 0.0 [0.0, 0.0] |
| 31.2 Multiple pregnancy | 0 | 0 | Risk Ratio (M‐H, Fixed, 95% CI) | 0.0 [0.0, 0.0] |
| 31.3 Singleton plus multiple pregnancies | 0 | 0 | Risk Ratio (M‐H, Fixed, 95% CI) | 0.0 [0.0, 0.0] |
| 31.4 Not specified whether singleton or multiple pregnancies | 0 | 0 | Risk Ratio (M‐H, Fixed, 95% CI) | 0.0 [0.0, 0.0] |
| 32 Antenatal admissions (not pre‐specified) | 1 | 426 | Risk Ratio (M‐H, Fixed, 95% CI) | 0.70 [0.55, 0.90] |
| 32.1 Singleton pregnancy | 1 | 426 | Risk Ratio (M‐H, Fixed, 95% CI) | 0.70 [0.55, 0.90] |
| 32.2 Multiple pregnancy | 0 | 0 | Risk Ratio (M‐H, Fixed, 95% CI) | 0.0 [0.0, 0.0] |
| 32.3 Singleton plus multiple pregnancies | 0 | 0 | Risk Ratio (M‐H, Fixed, 95% CI) | 0.0 [0.0, 0.0] |
| 32.4 Not specified whether singleton or multiple pregnancies | 0 | 0 | Risk Ratio (M‐H, Fixed, 95% CI) | 0.0 [0.0, 0.0] |
| 33 Phototherapy for neonatal jaundice (not pre‐specified) | 1 | 150 | Risk Ratio (M‐H, Fixed, 95% CI) | 0.15 [0.01, 2.87] |
| 33.1 Singleton pregnancy | 1 | 150 | Risk Ratio (M‐H, Fixed, 95% CI) | 0.15 [0.01, 2.87] |
| 33.2 Multiple pregnancy | 0 | 0 | Risk Ratio (M‐H, Fixed, 95% CI) | 0.0 [0.0, 0.0] |
| 33.3 Singleton plus multiple pregnancies | 0 | 0 | Risk Ratio (M‐H, Fixed, 95% CI) | 0.0 [0.0, 0.0] |
| 33.4 Not specified whether singleton or multiple pregnancies | 0 | 0 | Risk Ratio (M‐H, Fixed, 95% CI) | 0.0 [0.0, 0.0] |
| 34 Abnormal neurological development at 9months (not pre‐specified) | 0 | 0 | Risk Ratio (M‐H, Fixed, 95% CI) | 0.0 [0.0, 0.0] |
| 34.1 Singleton pregnancy | 0 | 0 | Risk Ratio (M‐H, Fixed, 95% CI) | 0.0 [0.0, 0.0] |
| 34.2 Multiple pregnancy | 0 | 0 | Risk Ratio (M‐H, Fixed, 95% CI) | 0.0 [0.0, 0.0] |
| 34.3 Singleton plus multiple pregnancies | 0 | 0 | Risk Ratio (M‐H, Fixed, 95% CI) | 0.0 [0.0, 0.0] |
| 34.4 Not specified whether singleton or multiple pregnancies | 0 | 0 | Risk Ratio (M‐H, Fixed, 95% CI) | 0.0 [0.0, 0.0] |
| 35 Hospitalisation for IUGR neonatal (not pre‐specified) | 0 | 0 | Risk Ratio (M‐H, Fixed, 95% CI) | 0.0 [0.0, 0.0] |
| 35.1 Singleton pregnancy | 0 | 0 | Risk Ratio (M‐H, Fixed, 95% CI) | 0.0 [0.0, 0.0] |
| 35.2 Multiple pregnancy | 0 | 0 | Risk Ratio (M‐H, Fixed, 95% CI) | 0.0 [0.0, 0.0] |
| 35.3 Singleton plus multiple pregnancies | 0 | 0 | Risk Ratio (M‐H, Fixed, 95% CI) | 0.0 [0.0, 0.0] |
| 35.4 Not specified whether singleton or multiple pregnancies | 0 | 0 | Risk Ratio (M‐H, Fixed, 95% CI) | 0.0 [0.0, 0.0] |
| 36 Fetal distress in labour (not pre‐specified) | 0 | 0 | Risk Ratio (M‐H, Fixed, 95% CI) | 0.0 [0.0, 0.0] |
| 36.1 Singleton pregnancy | 0 | 0 | Risk Ratio (M‐H, Fixed, 95% CI) | 0.0 [0.0, 0.0] |
| 36.2 Multiple pregnancy | 0 | 0 | Risk Ratio (M‐H, Fixed, 95% CI) | 0.0 [0.0, 0.0] |
| 36.3 Singleton plus multiple pregnancies | 0 | 0 | Risk Ratio (M‐H, Fixed, 95% CI) | 0.0 [0.0, 0.0] |
| 36.4 Not specified whether singleton or multiple pregnancies | 0 | 0 | Risk Ratio (M‐H, Fixed, 95% CI) | 0.0 [0.0, 0.0] |
| 37 Birth weight < 5 percentile (not pre‐specified) | 0 | 0 | Risk Ratio (M‐H, Fixed, 95% CI) | 0.0 [0.0, 0.0] |
| 37.1 Singleton pregnancy | 0 | 0 | Risk Ratio (M‐H, Fixed, 95% CI) | 0.0 [0.0, 0.0] |
| 37.2 Multiple pregnancy | 0 | 0 | Risk Ratio (M‐H, Fixed, 95% CI) | 0.0 [0.0, 0.0] |
| 37.3 Singleton plus multiple pregnancies | 0 | 0 | Risk Ratio (M‐H, Fixed, 95% CI) | 0.0 [0.0, 0.0] |
| 37.4 Not specified whether singleton or multiple pregnancies | 0 | 0 | Risk Ratio (M‐H, Fixed, 95% CI) | 0.0 [0.0, 0.0] |
| 38 Periventricular leucomalacia (not pre‐specified) | 0 | 0 | Risk Ratio (M‐H, Fixed, 95% CI) | 0.0 [0.0, 0.0] |
| 38.1 Singleton pregnancy | 0 | 0 | Risk Ratio (M‐H, Fixed, 95% CI) | 0.0 [0.0, 0.0] |
| 38.2 Multiple pregnancy | 0 | 0 | Risk Ratio (M‐H, Fixed, 95% CI) | 0.0 [0.0, 0.0] |
| 38.3 Singleton plus multiple pregnancies | 0 | 0 | Risk Ratio (M‐H, Fixed, 95% CI) | 0.0 [0.0, 0.0] |
| 38.4 Not specified whether singleton or multiple pregnancies | 0 | 0 | Risk Ratio (M‐H, Fixed, 95% CI) | 0.0 [0.0, 0.0] |
| 39 Antenatal hospital stay | 1 | 426 | Mean Difference (IV, Fixed, 95% CI) | ‐0.60 [‐2.39, 1.19] |
| 39.1 Singleton pregnancy | 1 | 426 | Mean Difference (IV, Fixed, 95% CI) | ‐0.60 [‐2.39, 1.19] |
| 39.2 Multiple pregnancy | 0 | 0 | Mean Difference (IV, Fixed, 95% CI) | 0.0 [0.0, 0.0] |
| 39.3 Singleton plus multiple pregnancies | 0 | 0 | Mean Difference (IV, Fixed, 95% CI) | 0.0 [0.0, 0.0] |
| 39.4 Not specified whether singleton or multiple pregnancies | 0 | 0 | Mean Difference (IV, Fixed, 95% CI) | 0.0 [0.0, 0.0] |
Analysis 3.7.
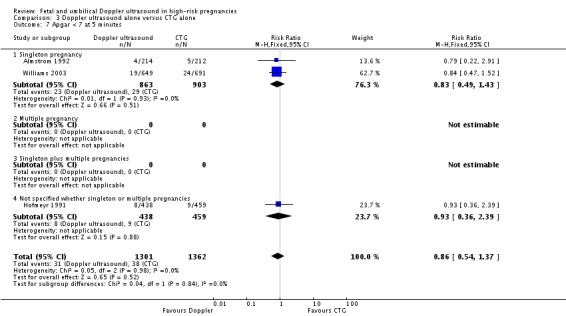
Comparison 3 Doppler ultrasound alone versus CTG alone, Outcome 7 Apgar < 7 at 5 minutes.
Analysis 3.11.
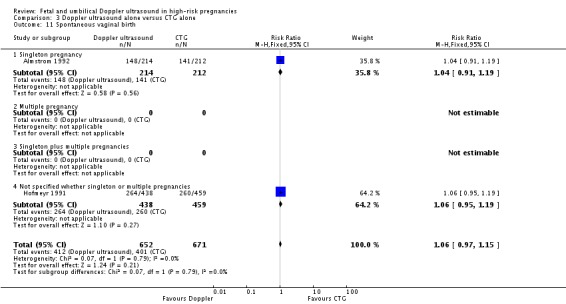
Comparison 3 Doppler ultrasound alone versus CTG alone, Outcome 11 Spontaneous vaginal birth.
Analysis 3.12.

Comparison 3 Doppler ultrasound alone versus CTG alone, Outcome 12 Operative vaginal birth.
Analysis 3.13.
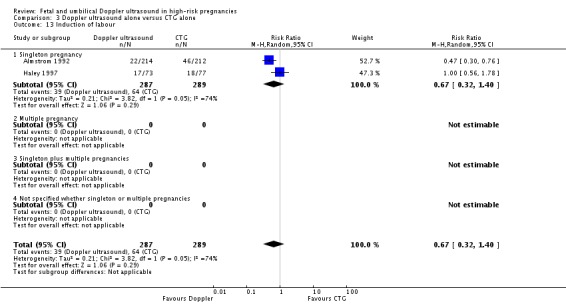
Comparison 3 Doppler ultrasound alone versus CTG alone, Outcome 13 Induction of labour.
Analysis 3.16.

Comparison 3 Doppler ultrasound alone versus CTG alone, Outcome 16 Infant requiring intubation/ventilation.
Analysis 3.17.

Comparison 3 Doppler ultrasound alone versus CTG alone, Outcome 17 Neonatal fitting/seizures.
Analysis 3.21.

Comparison 3 Doppler ultrasound alone versus CTG alone, Outcome 21 Neonatal admission to SCBU and/or NICU.
Analysis 3.28.

Comparison 3 Doppler ultrasound alone versus CTG alone, Outcome 28 Gestational age at birth.
Analysis 3.29.
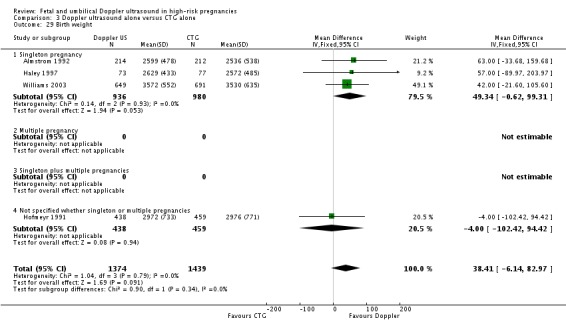
Comparison 3 Doppler ultrasound alone versus CTG alone, Outcome 29 Birth weight.
Analysis 3.39.
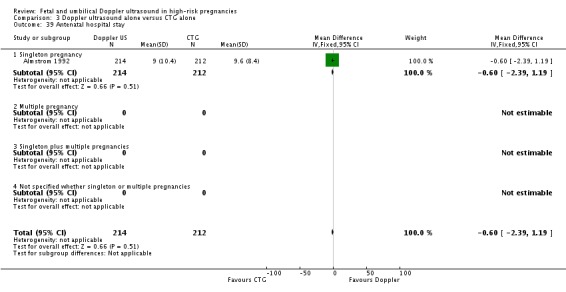
Comparison 3 Doppler ultrasound alone versus CTG alone, Outcome 39 Antenatal hospital stay.
Comparison 4.
Doppler ultrasound alone versus CTG alone (all subgroups)
| Outcome or subgroup title | No. of studies | No. of participants | Statistical method | Effect size |
|---|---|---|---|---|
| 1 Any perinatal death after randomisation | 3 | Risk Ratio (M‐H, Fixed, 95% CI) | Subtotals only | |
| 1.1 SGA/IUGR | 2 | 572 | Risk Ratio (M‐H, Fixed, 95% CI) | 0.33 [0.05, 2.09] |
| 1.2 Hypertension/pre‐eclampsia | 1 | 89 | Risk Ratio (M‐H, Fixed, 95% CI) | 3.57 [0.42, 30.73] |
| 1.3 Diabetes | 0 | 0 | Risk Ratio (M‐H, Fixed, 95% CI) | 0.0 [0.0, 0.0] |
| 1.4 Prolonged pregnancy | 0 | 0 | Risk Ratio (M‐H, Fixed, 95% CI) | 0.0 [0.0, 0.0] |
| 1.5 Previous pregnancy loss | 0 | 0 | Risk Ratio (M‐H, Fixed, 95% CI) | 0.0 [0.0, 0.0] |
| 2 Serious neonatal morbidity | 0 | 0 | Risk Ratio (M‐H, Random, 95% CI) | 0.0 [0.0, 0.0] |
| 2.1 SGA/IUGR | 0 | 0 | Risk Ratio (M‐H, Random, 95% CI) | 0.0 [0.0, 0.0] |
| 2.2 Hypertension/pre‐eclampsia | 0 | 0 | Risk Ratio (M‐H, Random, 95% CI) | 0.0 [0.0, 0.0] |
| 2.3 Diabetes | 0 | 0 | Risk Ratio (M‐H, Random, 95% CI) | 0.0 [0.0, 0.0] |
| 2.4 Prolonged pregnancy | 0 | 0 | Risk Ratio (M‐H, Random, 95% CI) | 0.0 [0.0, 0.0] |
| 2.5 Previous pregnancy loss | 0 | 0 | Risk Ratio (M‐H, Random, 95% CI) | 0.0 [0.0, 0.0] |
Comparison 5.
Doppler ultrasound versus no Doppler ultrasound ‐ SGA/IUGR
| Outcome or subgroup title | No. of studies | No. of participants | Statistical method | Effect size |
|---|---|---|---|---|
| 1 Any perinatal death after randomisation (SGA/IUGR) | 5 | 1292 | Risk Ratio (M‐H, Fixed, 95% CI) | 0.72 [0.38, 1.35] |
| 1.1 Singleton pregnancy | 4 | 1189 | Risk Ratio (M‐H, Fixed, 95% CI) | 0.67 [0.35, 1.28] |
| 1.2 Multiple pregnancy | 0 | 0 | Risk Ratio (M‐H, Fixed, 95% CI) | 0.0 [0.0, 0.0] |
| 1.3 Singleton plus multiple pregnancies | 0 | 0 | Risk Ratio (M‐H, Fixed, 95% CI) | 0.0 [0.0, 0.0] |
| 1.4 Not specified whether singleton or multiple pregnancies | 1 | 103 | Risk Ratio (M‐H, Fixed, 95% CI) | 3.06 [0.13, 73.36] |
| 2 Serious neonatal morbidity (SGA/IUGR) | 0 | 0 | Risk Ratio (M‐H, Fixed, 95% CI) | 0.0 [0.0, 0.0] |
| 2.1 Singleton pregnancy | 0 | 0 | Risk Ratio (M‐H, Fixed, 95% CI) | 0.0 [0.0, 0.0] |
| 2.2 Multiple pregnancy | 0 | 0 | Risk Ratio (M‐H, Fixed, 95% CI) | 0.0 [0.0, 0.0] |
| 2.3 Singleton plus multiple pregnancies | 0 | 0 | Risk Ratio (M‐H, Fixed, 95% CI) | 0.0 [0.0, 0.0] |
| 2.4 Not specified whether singleton or multiple pregnancies | 0 | 0 | Risk Ratio (M‐H, Fixed, 95% CI) | 0.0 [0.0, 0.0] |
Comparison 6.
Doppler ultrasound alone versus CTG ‐ SGA/IUGR
| Outcome or subgroup title | No. of studies | No. of participants | Statistical method | Effect size |
|---|---|---|---|---|
| 1 Any perinatal death after randomisation (SGA/IUGR) | 2 | 572 | Risk Ratio (M‐H, Fixed, 95% CI) | 0.33 [0.05, 2.09] |
| 1.1 Singleton pregnancy | 2 | 572 | Risk Ratio (M‐H, Fixed, 95% CI) | 0.33 [0.05, 2.09] |
| 1.2 Multiple pregnancy | 0 | 0 | Risk Ratio (M‐H, Fixed, 95% CI) | 0.0 [0.0, 0.0] |
| 1.3 Singleton plus multiple pregnancies | 0 | 0 | Risk Ratio (M‐H, Fixed, 95% CI) | 0.0 [0.0, 0.0] |
| 1.4 Not specified whether singleton or multiple pregnancies | 0 | 0 | Risk Ratio (M‐H, Fixed, 95% CI) | 0.0 [0.0, 0.0] |
| 2 Serious neonatal morbidity (SGA/IUGR) | 0 | 0 | Risk Ratio (M‐H, Fixed, 95% CI) | 0.0 [0.0, 0.0] |
| 2.1 Singleton pregnancy | 0 | 0 | Risk Ratio (M‐H, Fixed, 95% CI) | 0.0 [0.0, 0.0] |
| 2.2 Multiple pregnancy | 0 | 0 | Risk Ratio (M‐H, Fixed, 95% CI) | 0.0 [0.0, 0.0] |
| 2.3 Singleton plus multiple pregnancies | 0 | 0 | Risk Ratio (M‐H, Fixed, 95% CI) | 0.0 [0.0, 0.0] |
| 2.4 Not specified whether singleton or multiple pregnancies | 0 | 0 | Risk Ratio (M‐H, Fixed, 95% CI) | 0.0 [0.0, 0.0] |
Analysis 6.1.

Comparison 6 Doppler ultrasound alone versus CTG ‐ SGA/IUGR, Outcome 1 Any perinatal death after randomisation (SGA/IUGR).
Comparison 7.
Doppler ultrasound versus no Doppler ultrasound ‐ in hypertension/pre‐eclampsia
| Outcome or subgroup title | No. of studies | No. of participants | Statistical method | Effect size |
|---|---|---|---|---|
| 1 Any perinatal death after randomisation (hypertension/pre‐eclampsia) | 1 | 89 | Risk Ratio (M‐H, Fixed, 95% CI) | 3.57 [0.42, 30.73] |
| 1.1 Singleton pregnancy | 0 | 0 | Risk Ratio (M‐H, Fixed, 95% CI) | 0.0 [0.0, 0.0] |
| 1.2 Multiple pregnancy | 0 | 0 | Risk Ratio (M‐H, Fixed, 95% CI) | 0.0 [0.0, 0.0] |
| 1.3 Singleton plus multiple pregnancies | 0 | 0 | Risk Ratio (M‐H, Fixed, 95% CI) | 0.0 [0.0, 0.0] |
| 1.4 Not specified whether singleton or multiple pregnancies | 1 | 89 | Risk Ratio (M‐H, Fixed, 95% CI) | 3.57 [0.42, 30.73] |
| 2 Serious neonatal morbidity (hypertension/pre‐eclampsia) | 0 | 0 | Risk Ratio (M‐H, Fixed, 95% CI) | 0.0 [0.0, 0.0] |
| 2.1 Singleton pregnancy | 0 | 0 | Risk Ratio (M‐H, Fixed, 95% CI) | 0.0 [0.0, 0.0] |
| 2.2 Multiple pregnancy | 0 | 0 | Risk Ratio (M‐H, Fixed, 95% CI) | 0.0 [0.0, 0.0] |
| 2.3 Singleton plus multiple pregnancies | 0 | 0 | Risk Ratio (M‐H, Fixed, 95% CI) | 0.0 [0.0, 0.0] |
| 2.4 Not specified whether singleton or multiple pregnancies | 0 | 0 | Risk Ratio (M‐H, Fixed, 95% CI) | 0.0 [0.0, 0.0] |
Analysis 7.1.

Comparison 7 Doppler ultrasound versus no Doppler ultrasound ‐ in hypertension/pre‐eclampsia, Outcome 1 Any perinatal death after randomisation (hypertension/pre‐eclampsia).
Comparison 8.
Doppler ultrasound versus CTG ‐ in hypertension/pre‐eclampsia
| Outcome or subgroup title | No. of studies | No. of participants | Statistical method | Effect size |
|---|---|---|---|---|
| 1 Any perinatal death after randomisation (hypertension/pre‐eclampsia) | 1 | 89 | Risk Ratio (M‐H, Fixed, 95% CI) | 3.57 [0.42, 30.73] |
| 1.1 Singleton pregnancy | 0 | 0 | Risk Ratio (M‐H, Fixed, 95% CI) | 0.0 [0.0, 0.0] |
| 1.2 Multiple pregnancy | 0 | 0 | Risk Ratio (M‐H, Fixed, 95% CI) | 0.0 [0.0, 0.0] |
| 1.3 Singleton plus multiple pregnancies | 0 | 0 | Risk Ratio (M‐H, Fixed, 95% CI) | 0.0 [0.0, 0.0] |
| 1.4 Not specified whether singleton or multiple pregnancies | 1 | 89 | Risk Ratio (M‐H, Fixed, 95% CI) | 3.57 [0.42, 30.73] |
| 2 Serious neonatal morbidity (hypertension/pre‐eclampsia) | 0 | 0 | Risk Ratio (M‐H, Fixed, 95% CI) | 0.0 [0.0, 0.0] |
| 2.1 Singleton pregnancy | 0 | 0 | Risk Ratio (M‐H, Fixed, 95% CI) | 0.0 [0.0, 0.0] |
| 2.2 Multiple pregnancy | 0 | 0 | Risk Ratio (M‐H, Fixed, 95% CI) | 0.0 [0.0, 0.0] |
| 2.3 Singleton plus multiple pregnancies | 0 | 0 | Risk Ratio (M‐H, Fixed, 95% CI) | 0.0 [0.0, 0.0] |
| 2.4 Not specified whether singleton or multiple pregnancies | 0 | 0 | Risk Ratio (M‐H, Fixed, 95% CI) | 0.0 [0.0, 0.0] |
Analysis 8.1.
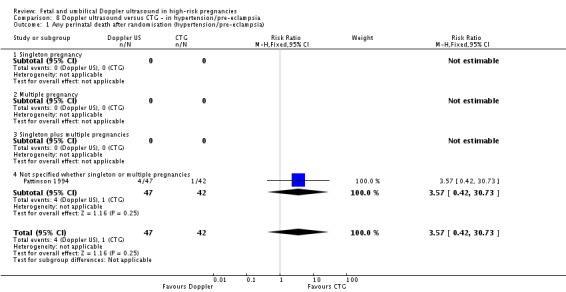
Comparison 8 Doppler ultrasound versus CTG ‐ in hypertension/pre‐eclampsia, Outcome 1 Any perinatal death after randomisation (hypertension/pre‐eclampsia).
Comparison 9.
Doppler ultrasound versus no Doppler ultrasound ‐ in diabetes
| Outcome or subgroup title | No. of studies | No. of participants | Statistical method | Effect size |
|---|---|---|---|---|
| 1 Any perinatal death after randomisation (in diabetes) | 0 | 0 | Risk Ratio (M‐H, Fixed, 95% CI) | 0.0 [0.0, 0.0] |
| 1.1 Singleton pregnancy | 0 | 0 | Risk Ratio (M‐H, Fixed, 95% CI) | 0.0 [0.0, 0.0] |
| 1.2 Multiple pregnancy | 0 | 0 | Risk Ratio (M‐H, Fixed, 95% CI) | 0.0 [0.0, 0.0] |
| 1.3 Singleton plus multiple pregnancies | 0 | 0 | Risk Ratio (M‐H, Fixed, 95% CI) | 0.0 [0.0, 0.0] |
| 1.4 Not specified whether singleton or multiple pregnancies | 0 | 0 | Risk Ratio (M‐H, Fixed, 95% CI) | 0.0 [0.0, 0.0] |
| 2 Serious neonatal morbidity (in diabetes) | 0 | 0 | Risk Ratio (M‐H, Fixed, 95% CI) | 0.0 [0.0, 0.0] |
| 2.1 Singleton pregnancy | 0 | 0 | Risk Ratio (M‐H, Fixed, 95% CI) | 0.0 [0.0, 0.0] |
| 2.2 Multiple pregnancy | 0 | 0 | Risk Ratio (M‐H, Fixed, 95% CI) | 0.0 [0.0, 0.0] |
| 2.3 Singleton plus multiple pregnancies | 0 | 0 | Risk Ratio (M‐H, Fixed, 95% CI) | 0.0 [0.0, 0.0] |
| 2.4 Not specified whether singleton or multiple pregnancies | 0 | 0 | Risk Ratio (M‐H, Fixed, 95% CI) | 0.0 [0.0, 0.0] |
Comparison 10.
Doppler ultrasound versus CTG ‐ in diabetes
| Outcome or subgroup title | No. of studies | No. of participants | Statistical method | Effect size |
|---|---|---|---|---|
| 1 Any perinatal death after randomisation (in diabetes) | 0 | 0 | Risk Ratio (M‐H, Fixed, 95% CI) | 0.0 [0.0, 0.0] |
| 1.1 Singleton pregnancy | 0 | 0 | Risk Ratio (M‐H, Fixed, 95% CI) | 0.0 [0.0, 0.0] |
| 1.2 Multiple pregnancy | 0 | 0 | Risk Ratio (M‐H, Fixed, 95% CI) | 0.0 [0.0, 0.0] |
| 1.3 Singleton plus multiple pregnancies | 0 | 0 | Risk Ratio (M‐H, Fixed, 95% CI) | 0.0 [0.0, 0.0] |
| 1.4 Not specified whether singleton or multiple pregnancies | 0 | 0 | Risk Ratio (M‐H, Fixed, 95% CI) | 0.0 [0.0, 0.0] |
| 2 Serious neonatal morbidity (in diabetes) | 0 | 0 | Risk Ratio (M‐H, Fixed, 95% CI) | 0.0 [0.0, 0.0] |
| 2.1 Singleton pregnancy | 0 | 0 | Risk Ratio (M‐H, Fixed, 95% CI) | 0.0 [0.0, 0.0] |
| 2.2 Multiple pregnancy | 0 | 0 | Risk Ratio (M‐H, Fixed, 95% CI) | 0.0 [0.0, 0.0] |
| 2.3 Singleton plus multiple pregnancies | 0 | 0 | Risk Ratio (M‐H, Fixed, 95% CI) | 0.0 [0.0, 0.0] |
| 2.4 Not specified whether singleton or multiple pregnancies | 0 | 0 | Risk Ratio (M‐H, Fixed, 95% CI) | 0.0 [0.0, 0.0] |
Comparison 11.
Doppler ultrasound versus no Doppler ultrasound ‐ in prolonged pregnancies
| Outcome or subgroup title | No. of studies | No. of participants | Statistical method | Effect size |
|---|---|---|---|---|
| 1 Any perinatal death after randomisation (in prolonged pregnancy) | 0 | 0 | Risk Ratio (M‐H, Fixed, 95% CI) | 0.0 [0.0, 0.0] |
| 1.1 Singleton pregnancy | 0 | 0 | Risk Ratio (M‐H, Fixed, 95% CI) | 0.0 [0.0, 0.0] |
| 1.2 Multiple pregnancy | 0 | 0 | Risk Ratio (M‐H, Fixed, 95% CI) | 0.0 [0.0, 0.0] |
| 1.3 Singleton plus multiple pregnancies | 0 | 0 | Risk Ratio (M‐H, Fixed, 95% CI) | 0.0 [0.0, 0.0] |
| 1.4 Not specified whether singleton or multiple pregnancies | 0 | 0 | Risk Ratio (M‐H, Fixed, 95% CI) | 0.0 [0.0, 0.0] |
| 2 Serious neonatal morbidity (in prolonged pregnancy) | 0 | 0 | Risk Ratio (M‐H, Fixed, 95% CI) | 0.0 [0.0, 0.0] |
| 2.1 Singleton pregnancy | 0 | 0 | Risk Ratio (M‐H, Fixed, 95% CI) | 0.0 [0.0, 0.0] |
| 2.2 Multiple pregnancy | 0 | 0 | Risk Ratio (M‐H, Fixed, 95% CI) | 0.0 [0.0, 0.0] |
| 2.3 Singleton plus multiple pregnancies | 0 | 0 | Risk Ratio (M‐H, Fixed, 95% CI) | 0.0 [0.0, 0.0] |
| 2.4 Not specified whether singleton or multiple pregnancies | 0 | 0 | Risk Ratio (M‐H, Fixed, 95% CI) | 0.0 [0.0, 0.0] |
Comparison 12.
Doppler ultrasound versus CTG ‐ in prolonged pregnancies
| Outcome or subgroup title | No. of studies | No. of participants | Statistical method | Effect size |
|---|---|---|---|---|
| 1 Any perinatal death after randomisation (in prolonged pregnancy) | 0 | 0 | Risk Ratio (M‐H, Fixed, 95% CI) | 0.0 [0.0, 0.0] |
| 1.1 Singleton pregnancy | 0 | 0 | Risk Ratio (M‐H, Fixed, 95% CI) | 0.0 [0.0, 0.0] |
| 1.2 Multiple pregnancy | 0 | 0 | Risk Ratio (M‐H, Fixed, 95% CI) | 0.0 [0.0, 0.0] |
| 1.3 Singleton plus multiple pregnancies | 0 | 0 | Risk Ratio (M‐H, Fixed, 95% CI) | 0.0 [0.0, 0.0] |
| 1.4 Not specified whether singleton or multiple pregnancies | 0 | 0 | Risk Ratio (M‐H, Fixed, 95% CI) | 0.0 [0.0, 0.0] |
| 2 Serious neonatal morbidity (in prolonged pregnancy) | 0 | 0 | Risk Ratio (M‐H, Fixed, 95% CI) | 0.0 [0.0, 0.0] |
| 2.1 Singleton pregnancy | 0 | 0 | Risk Ratio (M‐H, Fixed, 95% CI) | 0.0 [0.0, 0.0] |
| 2.2 Multiple pregnancy | 0 | 0 | Risk Ratio (M‐H, Fixed, 95% CI) | 0.0 [0.0, 0.0] |
| 2.3 Singleton plus multiple pregnancies | 0 | 0 | Risk Ratio (M‐H, Fixed, 95% CI) | 0.0 [0.0, 0.0] |
| 2.4 Not specified whether singleton or multiple pregnancies | 0 | 0 | Risk Ratio (M‐H, Fixed, 95% CI) | 0.0 [0.0, 0.0] |
Comparison 13.
Doppler ultrasound versus no Doppler ultrasound ‐ previous pregnancy loss
| Outcome or subgroup title | No. of studies | No. of participants | Statistical method | Effect size |
|---|---|---|---|---|
| 1 Any perinatal death after randomisation (previous pregnancy loss) | 1 | 53 | Risk Ratio (M‐H, Fixed, 95% CI) | 0.26 [0.03, 2.17] |
| 1.1 Singleton pregnancy | 0 | 0 | Risk Ratio (M‐H, Fixed, 95% CI) | 0.0 [0.0, 0.0] |
| 1.2 Multiple pregnancy | 0 | 0 | Risk Ratio (M‐H, Fixed, 95% CI) | 0.0 [0.0, 0.0] |
| 1.3 Singleton plus multiple pregnancies | 0 | 0 | Risk Ratio (M‐H, Fixed, 95% CI) | 0.0 [0.0, 0.0] |
| 1.4 Not specified whether singleton or multiple pregnancies | 1 | 53 | Risk Ratio (M‐H, Fixed, 95% CI) | 0.26 [0.03, 2.17] |
| 2 Serious neonatal morbidity (previous pregnancy loss) | 1 | 53 | Risk Ratio (M‐H, Fixed, 95% CI) | 0.0 [0.0, 0.0] |
| 2.1 Singleton pregnancy | 0 | 0 | Risk Ratio (M‐H, Fixed, 95% CI) | 0.0 [0.0, 0.0] |
| 2.2 Multiple pregnancy | 0 | 0 | Risk Ratio (M‐H, Fixed, 95% CI) | 0.0 [0.0, 0.0] |
| 2.3 Singleton plus multiple pregnancies | 0 | 0 | Risk Ratio (M‐H, Fixed, 95% CI) | 0.0 [0.0, 0.0] |
| 2.4 Not specified whether singleton or multiple pregnancies | 1 | 53 | Risk Ratio (M‐H, Fixed, 95% CI) | 0.0 [0.0, 0.0] |
Analysis 13.1.
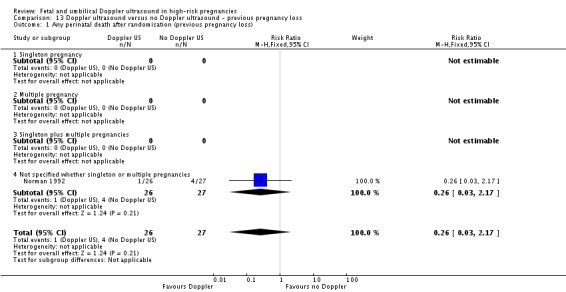
Comparison 13 Doppler ultrasound versus no Doppler ultrasound ‐ previous pregnancy loss, Outcome 1 Any perinatal death after randomisation (previous pregnancy loss).
Analysis 13.2.
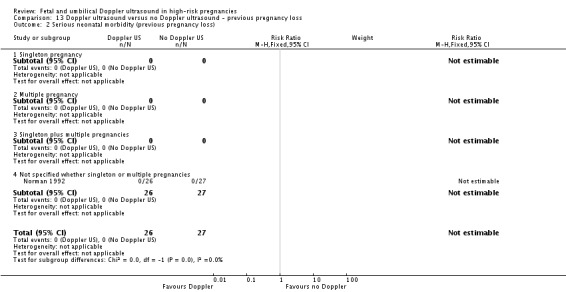
Comparison 13 Doppler ultrasound versus no Doppler ultrasound ‐ previous pregnancy loss, Outcome 2 Serious neonatal morbidity (previous pregnancy loss).
Comparison 14.
Doppler ultrasound versus CTG ‐ previous pregnancy loss
| Outcome or subgroup title | No. of studies | No. of participants | Statistical method | Effect size |
|---|---|---|---|---|
| 1 Any perinatal death after randomisation (previous pregnancy loss) | 0 | 0 | Risk Ratio (M‐H, Fixed, 95% CI) | 0.0 [0.0, 0.0] |
| 1.1 Singleton pregnancy | 0 | 0 | Risk Ratio (M‐H, Fixed, 95% CI) | 0.0 [0.0, 0.0] |
| 1.2 Multiple pregnancy | 0 | 0 | Risk Ratio (M‐H, Fixed, 95% CI) | 0.0 [0.0, 0.0] |
| 1.3 Singleton plus multiple pregnancies | 0 | 0 | Risk Ratio (M‐H, Fixed, 95% CI) | 0.0 [0.0, 0.0] |
| 1.4 Not specified whether singleton or multiple pregnancies | 0 | 0 | Risk Ratio (M‐H, Fixed, 95% CI) | 0.0 [0.0, 0.0] |
| 2 Serious neonatal morbidity (previous pregnancy loss) | 0 | 0 | Risk Ratio (M‐H, Fixed, 95% CI) | 0.0 [0.0, 0.0] |
| 2.1 Singleton pregnancy | 0 | 0 | Risk Ratio (M‐H, Fixed, 95% CI) | 0.0 [0.0, 0.0] |
| 2.2 Multiple pregnancy | 0 | 0 | Risk Ratio (M‐H, Fixed, 95% CI) | 0.0 [0.0, 0.0] |
| 2.3 Singleton plus multiple pregnancies | 0 | 0 | Risk Ratio (M‐H, Fixed, 95% CI) | 0.0 [0.0, 0.0] |
| 2.4 Not specified whether singleton or multiple pregnancies | 0 | 0 | Risk Ratio (M‐H, Fixed, 95% CI) | 0.0 [0.0, 0.0] |
What's new
Last assessed as up‐to‐date: 30 September 2013.
| Date | Event | Description |
|---|---|---|
| 30 September 2013 | New search has been performed | Search updated. Methods updated. |
| 30 September 2013 | New citation required but conclusions have not changed | No new trials identified. |
Differences between protocol and review
The secondary outcome of 'any perinatal death after randomisation excluding malformations' was changed to 'any potentially preventable perinatal death', which was defined as 'perinatal death excluding chromosomal abnormalities, termination of pregnancies, birth before fetal viability (less than 500 g) and fetal death before use of the intervention'.
The methods have been updated to the current Cochrane Pregnancy and Childbirth Group standard text, see Appendix 2.
Characteristics of studies
Characteristics of included studies [ordered by study ID]
Almstrom 1992
| Methods | 2‐arm prospective randomised controlled trial ‐ randomised block design; individual women. | |
| Participants | Singleton pregnancies with suspected IUGR at 31 completed weeks of pregnancy. IUGR if fetal weight < 2 SD below the mean at 31 weeks. N = 427 women. |
|
| Interventions | Intervention: Doppler of umbilical artery only every 2 weeks till birth unless:
Comparison: CTG (NST). |
|
| Outcomes | Primary: GA at delivery, frequency of caesarean section, frequency of operative delivery for fetal distress, CS, vacuum, forceps, length of stay at NICU. Secondary: number of fetal monitoring occasions, duration of antenatal hospital stay, frequency of labour induction, birthweight, frequency of small for dates infants, Apgar score at 1 min and 5 min, need for respiratory support. |
|
| Notes | ||
| Risk of bias | ||
| Bias | Authors' judgement | Support for judgement |
| Random sequence generation (selection bias) | Unclear risk | Randomised block design. No information about how the randomisation was performed. |
| Allocation concealment (selection bias) | Unclear risk | Sealed numbered envelopes according to a randomisation block design. This may mean separate randomisation schedules for the 4 different hospitals. No mention of whether the envelopes were opaque. |
| Blinding of participants and personnel (performance bias) All outcomes | Unclear risk | Blinding women and/or staff in these trials was not generally feasible. |
| Blinding of outcome assessment (detection bias) All outcomes | Unclear risk | Blinding women and/or staff in these trials was not generally feasible. |
| Incomplete outcome data (attrition bias) All outcomes | Low risk | No women were lost to follow‐up. 3 women declined to take part in the trial. 1 woman in the CTG group had to be excluded from data analysis since all her records were mislaid before evaluation. All women seemed to get their allocated Doppler or CTG, so this is an ITT analysis. |
| Selective reporting (reporting bias) | Unclear risk | All outcomes have been described in results section but we have not assessed the trial protocol. |
| Other bias | High risk | The study was not stopped earlier. Basline imbalance:
Differential diagnosis: Almstrom 1995 concluded that obstetricians may have been influenced by the knowledge of a normal umbilical Doppler examination when assessing the CTG in labour. This may contribute bias to the finding of fewer emergency CS for fetal distress in the Doppler group than in the CTG group. |
Biljan 1992
| Methods | Randomised controlled study. | |
| Participants | Women with high‐risk singleton pregnancies. N = 674 women randomised. |
|
| Interventions | Intervention: Doppler of umbilical artery revealed. N = 338. Comparison: no Doppler. N = 336. |
|
| Outcomes | Elective births; GA at birth; birthweight; Apgar scores, admissions to NICU, length of time in NICU, number of babies ventilated, length of ventilation, perinatal mortality. | |
| Notes | The information comes only from the 2 conference abstracts and personal communication (ZA). Sadly, Dr Biljan has died, so further detailed information on the study is not available. The information on the number of women randomised to each group was obtained from previous published version of this systematic review (Alfirevic 1995), and data on 'potentially preventable perineal deaths' was calculated from data in a previous version of this Cochrane review (Neilson 1996). | |
| Risk of bias | ||
| Bias | Authors' judgement | Support for judgement |
| Random sequence generation (selection bias) | Unclear risk | "...were randomised..." |
| Allocation concealment (selection bias) | Unclear risk | No information provided. |
| Blinding of participants and personnel (performance bias) All outcomes | Unclear risk | Blinding women and/or staff in these trials was not generally feasible. |
| Blinding of outcome assessment (detection bias) All outcomes | Unclear risk | Blinding women and/or staff in these trials was not generally feasible. |
| Incomplete outcome data (attrition bias) All outcomes | Unclear risk | Insufficient information provided in the conference abstract to assess this. |
| Selective reporting (reporting bias) | High risk | Only gave data for the significant findings and reported the non‐significant findings just as lower but not statistically significant. |
| Other bias | Unclear risk | Insufficient information provided in the conference abstract to assess this. |
Burke 1992
| Methods | Prospective randomised controlled trial, individual women, 2 trial arms. | |
| Participants | Women with high‐risk pregnancies (suspected IUGR, hypertensive disorders, previous baby < 2.5 kg, antepartum haemorrhage, previous perinatal death, diminished fetal movements, post maturity, diabetes and others). N = 476 women. |
|
| Interventions | Intervention: Doppler of umbilical artery and fetal biometry and BPP scoring. Comparison: fetal biometry and BPP scoring. |
|
| Outcomes | Primary outcomes: induction of labour, elective and emergency CS, preterm delivery and perinatal loss. | |
| Notes | ||
| Risk of bias | ||
| Bias | Authors' judgement | Support for judgement |
| Random sequence generation (selection bias) | Unclear risk | Randomisation by a random number sequence but it is unclear whether this was made by a third independent person. |
| Allocation concealment (selection bias) | Unclear risk | Sealed numbered envelopes but there is no information whether the envelopes were opaque and whether there was an ordered numbered sequence. |
| Blinding of participants and personnel (performance bias) All outcomes | Unclear risk | Blinding women and/or staff in these trials was not generally feasible. |
| Blinding of outcome assessment (detection bias) All outcomes | Unclear risk | Blinding women and/or staff in these trials was not generally feasible. |
| Incomplete outcome data (attrition bias) All outcomes | Low risk | No exclusions after randomisation. Reported as ITT. |
| Selective reporting (reporting bias) | Unclear risk | All outcomes have been described in result section but we have not assessed the trial protocol. |
| Other bias | Low risk | The study was not stopped early. Basline imbalance: "Doppler examinations were not carried out in the control group unless specifically requested by the consultant in charge of patients" ‐ 2 women in control group had a Doppler and were not excluded. |
de Rochambeau 1992
| Methods | 2‐arm randomised controlled trial of individual women. | |
| Participants | Women with singleton post‐term pregnancies (40 +3 weeks to 42 +3 weeks). N = 107 women. |
|
| Interventions | Intervention: Doppler ultrasound of umbilical artery. Comparison: no Doppler ultrasound, and standard care (FHR). |
|
| Outcomes | CS, RDS and post maturity. | |
| Notes | Paper in French with English abstract, paper was translated. Most of the data are missing. | |
| Risk of bias | ||
| Bias | Authors' judgement | Support for judgement |
| Random sequence generation (selection bias) | Unclear risk | Women "...were randomly divided...". No information on how the random sequence was generated. |
| Allocation concealment (selection bias) | Unclear risk | Not described. |
| Blinding of participants and personnel (performance bias) All outcomes | Unclear risk | Blinding women and/or staff in these trials was not generally feasible. |
| Blinding of outcome assessment (detection bias) All outcomes | Unclear risk | Blinding women and/or staff in these trials was not generally feasible. |
| Incomplete outcome data (attrition bias) All outcomes | Unclear risk | Describe any loss of participants to follow‐up at each data collection point:
Describe any exclusion of participants after randomisation:
Was the analysis ITT? If not have the data been able to be re‐included?
|
| Selective reporting (reporting bias) | Unclear risk | There is no list of pre‐specified outcomes as far as we can ascertain and we have not assessed the trial protocol. |
| Other bias | Unclear risk | If the study was stopped early, explain the reasons:
Describe any baseline in balance:
Describe any differential diagnosis:
|
Giles 2003
| Methods | Multi‐centred randomised controlled trial ‐ block randomisation, block of 20. Individual women, 2‐trial arm. |
|
| Participants | Women with twin pregnancies (monochorionic and dichorionic) at 25 weeks. 2 viable apparently normally formed fetuses seen on ultrasound scan. Exclusions: fetal anomalies; polyhydramnois/oligohydramnois; demise of 1 twin before 25 weeks. Significance of chorionicity not realised at time randomisation began so no attempt was made to assess chorionicity. N = 539 women. |
|
| Interventions | Intervention: Doppler and biometry ultrasound.
Comparison: biometry ultrasound.
|
|
| Outcomes | Maternal: antenatal admission, presence of hypertension, gestation at delivery, indication for delivery and mode of delivery. Fetal: ultrasound biometry measurements, umbilical artery doppler systolic diastolic ratios and the occurrence of fetal death and causative factors. Neonatal: birthweight, Apgar scores, admission to NICU, admission to special care nursery, requirements for ventilation and occurrence of neonatal death (up to 28 days of life). |
|
| Notes | ||
| Risk of bias | ||
| Bias | Authors' judgement | Support for judgement |
| Random sequence generation (selection bias) | Unclear risk | “....opaque sealed envelopes containing the randomisation code the envelope being opened by an observer remote from patient care”. |
| Allocation concealment (selection bias) | Low risk | “....opaque sealed envelopes containing the randomisation code the envelope being opened by an observer remote from patient care". |
| Blinding of participants and personnel (performance bias) All outcomes | Unclear risk | Blinding women and/or staff in these trials was not generally feasible. |
| Blinding of outcome assessment (detection bias) All outcomes | Unclear risk | Blinding women and/or staff in these trials was not generally feasible. |
| Incomplete outcome data (attrition bias) All outcomes | Low risk | Describe any loss of participants to follow‐up at each data collection point:
Describe any exclusion of participants after randomisation: was the analysis ITT? If not have the data been able to be re‐included?
|
| Selective reporting (reporting bias) | Unclear risk | There seems to be no evidence of selective reporting bias but we have not assessed the trial protocol. |
| Other bias | Low risk | If the study was stopped early, explain the reasons:
Describe any baseline in balance:
|
Haley 1997
| Methods | 2‐arm randomised controlled trial with stratified block randomisation producing 4 groups: Caucasian primiparous and multiparous women, and Asian primiparous and multiparous women. Randomised in blocks of 8 using table of random numbers. However, the results are not reported by any of these subgroups ‐ only Doppler vs CTG overall. Randomisation was of individual women. |
|
| Participants | Women with singleton fetuses with ultrasound examination showing the abdominal circumference < 2 SD of the mean for the gestational age fetal heart rate on charts recommended by British Medical Ultrasound Society. There was no gestational age constraint although all women were > 26 weeks' gestation. N = 150 women. |
|
| Interventions | Intervention: Doppler of umbilical artery and no CTG. Comparison: CTG. |
|
| Outcomes | Primary: duration of hospital antenatal admission, induction of labour rates. Secondary: number of investigations (CTG or Doppler), number of outpatient visits to hospital, emergency CS rate, length of stay on the NICU, birthweight, and 1 min and 5 min Apgar score. All women were sent a questionnaire asking their views on the process of their care. |
|
| Notes | ||
| Risk of bias | ||
| Bias | Authors' judgement | Support for judgement |
| Random sequence generation (selection bias) | Low risk | Blocks of 8 using a table of random number. |
| Allocation concealment (selection bias) | Low risk | "...randomisation only possible by telephone .... sequentially numbered sealed opaque envelopes..." |
| Blinding of participants and personnel (performance bias) All outcomes | Unclear risk | Blinding women and/or staff in these trials was not generally feasible. |
| Blinding of outcome assessment (detection bias) All outcomes | Unclear risk | Blinding women and/or staff in these trials was not generally feasible. |
| Incomplete outcome data (attrition bias) All outcomes | Low risk | No loss of participants at follow‐up. No exclusion after the randomisation. ITT analysis. |
| Selective reporting (reporting bias) | Unclear risk | We have not assessed the trial protocol. Also, despite the stratified randomisation to look at ethnicity and parity, the results are not reported by any of these subgroups, only Doppler vs CTG overall. |
| Other bias | Low risk | Study went to completion. Basline in balance: more women had no live‐in support at home in the CTG group. Differential diagnosis: "...there was not a rigid protocol except that clinicians usually felt that a CTG record gave reassurance for 48‐72 hours and a Doppler examination for a week or more ...". |
Hofmeyr 1991
| Methods | 2‐arm RCT ‐ but with additional evaluation by the non‐allocated technique. Randomisation was of individual women. |
|
| Participants | Women undergoing evaluation of fetal well‐being in the high‐risk obstetric unit. 867 women randomised. N = 897 women. |
|
| Interventions | Intervention: Doppler ultrasound of umbilical artery. Comparison: computerised CTG. |
|
| Outcomes | Number and duration of tests; perinatal outcomes. “Our objective was to determine whether the experimental policy of Doppler study followed when necessary by FHR testing would take less time than routine FHR testing alone". |
|
| Notes | We contacted the authors to ask for clarification of the phrase, "computer generated algorithm based on the hospital number". They kindly responded with an explanation: "allocation was done automatically by a computer programme. Although the algorithm made use of the woman's hospital number, it was impossible for the midwife performing the fetal assessment to predict to which group the women would be allocated. The 'algorithm' was simply a mathematical sequence which was applied to the woman's hospital number to generate an allocation". | |
| Risk of bias | ||
| Bias | Authors' judgement | Support for judgement |
| Random sequence generation (selection bias) | Low risk | "...computer generated algorithm based on the hospital number...". We sought clarification from the authors who kindly responded: "allocation was done automatically by a computer programme." |
| Allocation concealment (selection bias) | Low risk | Not described in the paper but we wrote for clarification from the authors who kindly responded: "although the algorithm made use of the woman's hospital number, it was impossible for the midwife performing the fetal assessment to predict to which group the women would be allocated. The 'algorithm' was simply a mathematical sequence which was applied to the woman's hospital number to generate an allocation". |
| Blinding of participants and personnel (performance bias) All outcomes | Unclear risk | Blinding women and/or staff in these trials was not generally feasible. |
| Blinding of outcome assessment (detection bias) All outcomes | Unclear risk | Blinding women and/or staff in these trials was not generally feasible. |
| Incomplete outcome data (attrition bias) All outcomes | Unclear risk | Describe any loss of participants to follow‐up at each data collection point:
Describe any exclusion of participants after randomisation:
Was the analysis ITT? If not have the data been able to be re‐included?
|
| Selective reporting (reporting bias) | Unclear risk | There is no list of pre‐specified outcomes from protocol, and we have not assessed the trial protocol. |
| Other bias | High risk | If the study was stopped early, explain the reasons:
Describe any baseline in balance:
|
Johnstone 1993
| Methods | 2‐arm RCT. Randomisation by Zelen method ‐ only those randomised to Doppler were invited to participate in the trial. Those allocated to CTG were being given normal care so their permission was regarded as not required. Randomisation was of individual women. |
|
| Participants | Women with pregnancies identified clinically as being at increased risk. N = 2289 out of the 8018 women giving birth at the hospital during the time of the study. All women attending the hospital were randomised (2289). There were 8018 women giving birth in the hospital over this time period. Doppler or CTG or BPP given to pregnant women where there was concern by medical staff about antenatal fetal well‐being by random allocation. Women were admitted to the trial if there was a wish for Doppler studies or a referral for AN fetal monitoring (CTG or BPP). So, all women meeting these criteria were randomised regardless of risk. N = 2289 women. |
|
| Interventions | Intervention: Doppler ultrasound of umbilical artery (and other monitoring). Comparison: no Doppler ‐ but other monitoring used (CTG/BPP). |
|
| Outcomes | Fetal mortality and morbidity; obstetric interventions; use of other tests of fetal monitoring; impact on obstetric decision making; health and personal costs; women’s satisfaction (to be presented in a separate report). | |
| Notes | ||
| Risk of bias | ||
| Bias | Authors' judgement | Support for judgement |
| Random sequence generation (selection bias) | Unclear risk | Just described as randomised. |
| Allocation concealment (selection bias) | Low risk | “Sequentially numbered opaque sealed envelopes were attached by stapling to the case notes of all women attending this hospital. Randomisation was carried out by opening the envelope for every woman who met the criteria described above.” |
| Blinding of participants and personnel (performance bias) All outcomes | Unclear risk | Blinding women and/or staff in these trials was not generally feasible. |
| Blinding of outcome assessment (detection bias) All outcomes | Unclear risk | Blinding women and/or staff in these trials was not generally feasible. |
| Incomplete outcome data (attrition bias) All outcomes | Low risk | Describe any loss of participants to follow‐up at each data collection point:
Describe any exclusion of participants after randomisation:
Was the analysis ITT? If not have the data been able to be re‐included?
|
| Selective reporting (reporting bias) | Unclear risk | They seem to report on their pre‐specified outcomes but we have not assessed the trial protocol. |
| Other bias | Low risk | If the study was stopped early, explain the reasons:
Describe any baseline in balance:
Describe any differential diagnosis:
Receiving the other intervention:
|
Neales 1994
| Methods | 2‐arm randomised controlled study of individual women. | |
| Participants | Women of 24 weeks or greater gestation with a singleton pregnancy, and ultrasonic evidence of IUGR (abdominal circumference < on or below 5th centile for gestational age). N = 467 women. |
|
| Interventions | Intervention: Doppler ultrasound of umbilical artery revealed, weekly or more often if indicated. Documented in notes. Discussed with registrar. Comparison: Doppler US weekly but recorded in separate file and not disclosed to clinicians. |
|
| Outcomes | Obstetric management: gestation at birth, time from enrolment to birth, mode of birth/onset of labour, fetal distress in labour. Neonatal outcome: perinatal mortality, birthweight, admission to NICU, neonatal outcome. |
|
| Notes | ||
| Risk of bias | ||
| Bias | Authors' judgement | Support for judgement |
| Random sequence generation (selection bias) | Unclear risk | No information other than 'randomised'. |
| Allocation concealment (selection bias) | Unclear risk | Sealed envelopes but there is no information as to whether the envelopes were opaque and whether they were distributed in a sequential order. |
| Blinding of participants and personnel (performance bias) All outcomes | Unclear risk | Blinding women and/or staff in these trials was not generally feasible. |
| Blinding of outcome assessment (detection bias) All outcomes | Unclear risk | Blinding women and/or staff in these trials was not generally feasible. |
| Incomplete outcome data (attrition bias) All outcomes | Low risk | Describe any loss of participants to follow‐up at each data collection point:
Describe any exclusion of participants after randomisation: no exclusion:
Was the analysis ITT? If not have the data been able to be re‐included?
|
| Selective reporting (reporting bias) | High risk | Not all outcomes available and we have not assessed the trial protocol. |
| Other bias | Unclear risk | If the study was stopped early, explain the reasons:
|
Newnham 1991
| Methods | Randomised controlled trial ‐ 2‐arm RCT, stratified for twin pregnancies. Randomisation was of individual women. |
|
| Participants | Women with high‐risk pregnancies, singletons and twins. That was ‐ those disorders of pregnancy in which an increased risk of retarded fetal growth or impaired fetal well‐being were considered likely. N = 505 women. |
|
| Interventions | Intervention: Doppler of umbilical and utero‐placental (within the placental bed) artery.
Comparison: No Doppler.
|
|
| Outcomes | Primary: duration of neonatal stay in hospital. Secondary: number and type of fetal heart monitoring studies, obstetric interventions, frequency of fetal distress, birthweight, Apgar score, and need for NICU. |
|
| Notes | ||
| Risk of bias | ||
| Bias | Authors' judgement | Support for judgement |
| Random sequence generation (selection bias) | Unclear risk | Just described as random. |
| Allocation concealment (selection bias) | Low risk | Numbered opaque sealed envelopes. |
| Blinding of participants and personnel (performance bias) All outcomes | Unclear risk | Blinding women and/or staff in these trials was not generally feasible. |
| Blinding of outcome assessment (detection bias) All outcomes | Low risk | Assessors of neonatal outcomes were indeed blind to Doppler results. |
| Incomplete outcome data (attrition bias) All outcomes | Unclear risk | Describe any loss of participants to follow‐up at each data collection point:
Describe any exclusion of participants after randomisation:
Was the analysis ITT? If not have the data been able to be re‐included?
|
| Selective reporting (reporting bias) | Unclear risk | Reported outcomes were the same as those pre‐specified but we have not assessed the trial protocol. |
| Other bias | Low risk | If the study was stopped early, explain the reasons:
Describe any baseline in balance:
Describe any differential diagnosis:
|
Nienhuis 1997
| Methods | Randomised controlled study ‐ stratified randomisation and block randomisation. Stratification by gestational age (< 32 weeks and > 32 weeks) and smoking (regardless of number smoked). Randomisation by individual women, 2‐trial arms. |
|
| Participants | Women with clinically suspected IUGR of > 2 weeks diagnosed by fundal height measurements at the outpatient clinic. Singleton pregnancies. Exclusions: multiple pregnancies, uncertain GA, non‐Caucasian origin, maternal or fetal conditional requiring immediate hospitalisation or intervention. N = 161 women. |
|
| Interventions | Intervention: Doppler ultrasound of umbilical artery revealed:
Comparison: Doppler ultrasound of umbilical artery concealed:
|
|
| Outcomes | Effect on costs in terms of hospitalisation, perinatal outcome, neurological development and postnatal catch‐up growth, onset and mode of birth, birthweight, and GA at birth. | |
| Notes | ||
| Risk of bias | ||
| Bias | Authors' judgement | Support for judgement |
| Random sequence generation (selection bias) | Low risk |
|
| Allocation concealment (selection bias) | Low risk |
|
| Blinding of participants and personnel (performance bias) All outcomes | Unclear risk | Blinding women and/or staff in these trials was not generally feasible. |
| Blinding of outcome assessment (detection bias) All outcomes | Low risk | Assessors of neonatal outcomes were indeed blind to Doppler results. |
| Incomplete outcome data (attrition bias) All outcomes | Unclear risk | Describe any loss of participants to follow‐up at each data collection point:
Describe any exclusion of participants after randomisation:
Was the analysis ITT? If not have the data been able to be re‐included?
|
| Selective reporting (reporting bias) | Unclear risk | All the outcomes has been reported but we have not assessed the trial protocol. |
| Other bias | High risk | If the study was stopped early, explain the reasons:
Describe any baseline in balance:
|
Nimrod 1992
| Methods | Randomised controlled trial ‐ 2‐arm trial randomising individual women. | |
| Participants | Pregnant women seen at the 'Fetal Assessment Unit' over 40 weeks' gestation. | |
| Interventions | Intervention: pulsed Doppler revealed. Fetal aorta and umbilical artery assessed. BPP and NST also undertaken. Comparison: pulsed Doppler concealed. BPP and NST were reported. |
|
| Outcomes | CS; gestation at birth; meconium in amniotic fluid; need for phototherapy. | |
| Notes | Conference abstract available, but no full publication. | |
| Risk of bias | ||
| Bias | Authors' judgement | Support for judgement |
| Random sequence generation (selection bias) | Unclear risk | No information available. |
| Allocation concealment (selection bias) | Unclear risk | No information available |
| Blinding of participants and personnel (performance bias) All outcomes | Unclear risk | Blinding women and/or staff in these trials was not generally feasible. |
| Blinding of outcome assessment (detection bias) All outcomes | Unclear risk | Blinding women and/or staff in these trials was not generally feasible. |
| Incomplete outcome data (attrition bias) All outcomes | Unclear risk | No information available. |
| Selective reporting (reporting bias) | Unclear risk | Very limited data in the conference abstract. We have not assessed the trial protocol. |
| Other bias | Unclear risk | No information available on which to judge this aspect. |
Norman 1992
| Methods | Randomised controlled trial. Individual women randomised in 2 arms. | |
| Participants | Women with high‐risk pregnancies with recurrent pregnancy loss (2 or more mid trimester or early third trimester losses which resulted in IUFD, stillbirth or neonatal death) at least 24 weeks' pregnant. 54 women randomised. N = 54 women. |
|
| Interventions | Intervention: Doppler velocimetry of umbilical artery revealed. Comparison: Doppler velocimetry of umbilical artery concealed. |
|
| Outcomes | Maternal intervention, hospital stay, induction of labour, CS, perinatal mortality and morbidity. | |
| Notes | A conference poster (incomplete data). | |
| Risk of bias | ||
| Bias | Authors' judgement | Support for judgement |
| Random sequence generation (selection bias) | Unclear risk | Women were randomly allocated. |
| Allocation concealment (selection bias) | Unclear risk | Sealed envelope, but no mention of how there were distributed no whether they were opaque. |
| Blinding of participants and personnel (performance bias) All outcomes | Unclear risk | Blinding women and/or staff in these trials was not generally feasible. |
| Blinding of outcome assessment (detection bias) All outcomes | Unclear risk | Blinding women and/or staff in these trials was not generally feasible. |
| Incomplete outcome data (attrition bias) All outcomes | Unclear risk | Describe any loss of participants to follow‐up at each data collection point:
Describe any exclusion of participants after randomisation:
Was the analysis ITT? If not have the data been able to be re‐included?
|
| Selective reporting (reporting bias) | Unclear risk | No information in the poster to enable this to be assessed. Also we have not assessed the trial protocol. |
| Other bias | Low risk | If the study was stopped early, explain the reasons:
Describe any baseline in balance:
Describe any differential diagnosis:
|
Ott 1998
| Methods | 2‐arm randomised controlled trial of individual women. | |
| Participants | Women referred to the perinatal laboratory so high‐risk pregnancies (risk of UPI; fetal risk; postdates; maternal diabetes; PROM/PTL; fluid abnormalities). N = 715 women. |
|
| Interventions | Intervention: fetal and umbilical Doppler + modified BPP. Comparison: no Doppler but modified BPP. |
|
| Outcomes | Primary outcome: neonatal morbidity rate (admission to NICU, length of stay in NICU, significant neonatal morbidity). Secondary outcome: GA at delivery, neonatal weight, CS for fetal distress. |
|
| Notes | The outcome of 'significant neonatal morbidity' assessed in this study included central nervous system complications, sepsis, acidosis/asphyxia, cardiomyopathy, anaemia, metabolic but excluded RDS. Anaemia and metabolic outcomes were not defined. We considered this outcome to be sufficiently different from the reviews primary outcome of 'serious neonatal morbidity ‐ composite outcome including hypoxic ischaemic encephalopathy, IVH, BPD, NEC 'that we have not included these data in the meta‐analysis. This study found no significant difference in 'significant neonatal complications' between the Doppler group (8%) and the no Doppler group (6.6%). | |
| Risk of bias | ||
| Bias | Authors' judgement | Support for judgement |
| Random sequence generation (selection bias) | Low risk | “Computer‐generated random number allocation system.” |
| Allocation concealment (selection bias) | Unclear risk | No information provided. |
| Blinding of participants and personnel (performance bias) All outcomes | Unclear risk | Blinding women and/or staff in these trials was not generally feasible. |
| Blinding of outcome assessment (detection bias) All outcomes | Unclear risk | Blinding women and/or staff in these trials was not generally feasible. |
| Incomplete outcome data (attrition bias) All outcomes | Unclear risk | Describe any loss of participants to follow‐up at each data collection point:
Describe any exclusion of participants after randomisation:
Was the analysis ITT? If not have the data been able to be re‐included?
|
| Selective reporting (reporting bias) | Unclear risk | Although the pre‐specified outcomes in the paper were reported on we were not able to assess the protocol so are not sure re outcome reporting bias. They only reporting on CS for fetal distress, and not on all CS. |
| Other bias | Low risk | If the study was stopped early, explain the reasons:
Describe any baseline in balance:
Describe any differential diagnosis:
|
Pattinson 1994
| Methods | Randomised controlled trial ‐ block randomisation of individual women:
|
|
| Participants | Women > 28 weeks' pregnant with hypertension and/or suspected SGA fetuses were referred for Doppler US. 212 women with singleton pregnancies. N = 212 women. |
|
| Interventions | Intervention: Doppler velocimetry of umbilical artery revealed:
Comparison: Doppler velocimetry of umbilical artery concealed:
|
|
| Outcomes | Perinatal mortality and morbidity, antenatal hospitalisation, maternal intervention, admission to the NICU and hospitalisation until discharge from the neonatal wards. | |
| Notes | ||
| Risk of bias | ||
| Bias | Authors' judgement | Support for judgement |
| Random sequence generation (selection bias) | Unclear risk | “...randomisation was performed by the person doing the Doppler velocity .......” |
| Allocation concealment (selection bias) | Unclear risk | “......opaque sealed envelopes......”, but no mention of numbered and sequentially ordered envelopes. |
| Blinding of participants and personnel (performance bias) All outcomes | Unclear risk | Blinding women and/or staff in these trials was not generally feasible. |
| Blinding of outcome assessment (detection bias) All outcomes | Unclear risk | Blinding women and/or staff in these trials was not generally feasible. |
| Incomplete outcome data (attrition bias) All outcomes | Low risk | Describe any loss of participants to follow‐up at each data collection point:
Describe any exclusion of participants after randomisation:
Was the analysis ITT? If not have the data been able to be re‐included?
|
| Selective reporting (reporting bias) | Unclear risk | All the outcomes have been reported but we have not assessed the trial protocol. |
| Other bias | High risk | If the study was stopped early, explain the reasons:
Describe any differential diagnosis:
|
Trudinger 1987
| Methods | 2‐arm randomised controlled trial of Individual women. | |
| Participants | Women with high fetal risk (singletons). More than 28 weeks' gestation. N = 300 women. |
|
| Interventions | Intervention: Doppler of umbilical artery revealed:
Comparison: Doppler of umbilical artery concealed:
|
|
| Outcomes | Perinatal mortality, CS, induction of labour, etc. | |
| Notes | ||
| Risk of bias | ||
| Bias | Authors' judgement | Support for judgement |
| Random sequence generation (selection bias) | Unclear risk | Random number though no information on how they were generated and by whom. |
| Allocation concealment (selection bias) | Unclear risk | “Each patient was asked to draw an envelope containing a random number and those with even numbers were allocated to the Doppler report available group”. |
| Blinding of participants and personnel (performance bias) All outcomes | Unclear risk | Blinding women and/or staff in these trials was not generally feasible. |
| Blinding of outcome assessment (detection bias) All outcomes | Unclear risk | Blinding women and/or staff in these trials was not generally feasible. |
| Incomplete outcome data (attrition bias) All outcomes | Low risk | Describe any loss of participants to follow‐up at each data collection point:
Was the analysis ITT? If not have the data been able to be re‐included?
|
| Selective reporting (reporting bias) | Unclear risk | No outcome listed in methods section and we have not assessed the trial protocol. |
| Other bias | Low risk | If the study was stopped early, explain the reasons:
Describe any baseline in balance:
Describe any differential diagnosis:
|
Tyrrell 1990
| Methods | Randomised controlled trial ‐ pragmatic 2‐arm trial. | |
| Participants | Women with high‐risk singleton pregnancies. Specifically, 500 pregnant women at high risk of growth retardation or stillbirth. IUGR clinically suspected or by US scan, previous SGA baby, previous antepartum haemorrhage, hypertension. Exclusions: women with diabetes, twin pregnancies. N = 500 women. |
|
| Interventions | Intervention: routine use of Doppler and BPP testing + other tests:
Comparison: no Doppler and no biophysical assessment but other tests only:
|
|
| Outcomes | Total number of days of antenatal admission, rate of induction of labour (by any method), mode of birth (elective CS and emergency CS), 1 and 5 min Apgar, birthweight, admission to NICU. | |
| Notes | ||
| Risk of bias | ||
| Bias | Authors' judgement | Support for judgement |
| Random sequence generation (selection bias) | Unclear risk |
|
| Allocation concealment (selection bias) | Unclear risk |
|
| Blinding of participants and personnel (performance bias) All outcomes | Unclear risk | Blinding women and/or staff in these trials was not generally feasible. |
| Blinding of outcome assessment (detection bias) All outcomes | Unclear risk | Blinding women and/or staff in these trials was not generally feasible. |
| Incomplete outcome data (attrition bias) All outcomes | Unclear risk | Describe any loss of participants to follow‐up at each data collection point:
Describe any exclusion of participants after randomisation:
Was the analysis ITT? If not have the data been able to be re‐included?
|
| Selective reporting (reporting bias) | Unclear risk | Not all outcomes have been reported, emergency CS just reported in the text. We have not assessed the trial protocol. |
| Other bias | Unclear risk | If the study was stopped early, explain the reasons:
Describe any baseline in balance:
Describe any differential diagnosis:
|
Williams 2003
| Methods | Randomised controlled study ‐ block randomisation (block of 4 and 6). Individual women. |
|
| Participants | Women with high‐risk pregnancies ‐ singletons (IUGR 7%, hypertension 10%, diabetes 11%, prolonged pregnancy 43%, decreased fetal movements 22%). GA > 32 weeks. N = 1360 women. |
|
| Interventions | Intervention: umbilical artery Doppler:
Comparison: electronic FHR with NST:
|
|
| Outcomes |
Primary outcome: incidence of CS for fetal distress in labour (non reassuring FHR). Secondary outcome: total CS, Apgar score 1 and 5 min, the incidence of stillbirth, the presence of meconium, and the incidence of transfer to the NICU with severe neonatal morbidity. |
|
| Notes | ||
| Risk of bias | ||
| Bias | Authors' judgement | Support for judgement |
| Random sequence generation (selection bias) | Low risk | Random number table with a variable block size of 4 and 6. |
| Allocation concealment (selection bias) | Unclear risk | Sequentially numbered opaque envelopes although no information as to whether they were sealed. “...envelopes were kept in a locked drawer that was accessible only to the unit clerk. The envelops was opened by the nurse/sonographer in the presence of the patient”. |
| Blinding of participants and personnel (performance bias) All outcomes | Unclear risk | Blinding women and/or staff in these trials was not generally feasible. |
| Blinding of outcome assessment (detection bias) All outcomes | Unclear risk | Blinding women and/or staff in these trials was not generally feasible. |
| Incomplete outcome data (attrition bias) All outcomes | Unclear risk | Describe any loss of participants to follow‐up at each data collection point:
Describe any exclusion of participants after randomisation:
Was the analysis ITT?
|
| Selective reporting (reporting bias) | Unclear risk | All the outcomes have been reported but we have not assessed the trial protocol. |
| Other bias | Low risk | If the study was stopped early, explain the reasons:
Describe any baseline in balance:
Describe any differential diagnosis:
|
AEDF: absent end diastolic flow AEDV: absent end diastolic velocity
AN: antenatal BPD: bronchopulmonary dysplasia BPP: biophysical profile CS: caesarean section CTG: cardiotocography EDV: end diastolic velocities FHR: fetal heart rate GA: gestational age ITT: intention‐to‐treat IUFD: intrauterine fetal death IUGR: intrauterine growth retardation IVH: intraventricular haemorrhage min: minute NEC: necrotising enterocolitis NICU: neonatal intensive care unit NS: not significant NST: non‐stress test PTL: preterm labour PROM: preterm rupture of membranes RCT: randomised controlled trial RDS: respiratory distress syndrome SD: standard deviation SGA: small‐for‐gestational age US: ultrasound vs: versus
Characteristics of excluded studies [ordered by study ID]
| Study | Reason for exclusion |
|---|---|
| Davies 1992 | Participants are an "unselected population". |
| Gonsoulin 1991 | Full report not available. |
| Mason 1993 | Participants are "low‐risk primigravid women". |
| McCowan 1996 | Conference abstract only but outcomes were comparing women with normal and abnormal Doppler ultrasound readings, so not a randomised comparison. |
| McParland 1988 | This study has never been reported in full although it has been partly reported in a review article (McParland 1988) and a full manuscript has been given to the review authors by Dr Pearce, who has been accused of publishing reports of trials whose veracity cannot be confirmed (BJOG 1995). Consequently, the Doppler trial data are not now thought by the review authors to be sufficiently reliable to be retained within this review. |
| Newnham 1993 | Participants are an "unselected population". |
| Omtzigt 1994 | Participants are a "non‐selected University Hospital population". |
| Pearce 1992 | Dr Pearce has been accused of publishing reports of trials whose veracity cannot be confirmed (BJOG 1995). Consequently, the Doppler trial data are not now thought by the reviewers to be sufficiently reliable to be retained within this review. |
| Schneider 1992 | Participants are an "unselected pregnant population". |
| Whittle 1994 | Participants are an "unselected population". |
Characteristics of ongoing studies [ordered by study ID]
Lees 2005
| Trial name or title | Trial of umbilical and fetal flow in Europe (TRUFFLE): a multicentre randomised study. |
| Methods | RCT ‐ multicentre (20 centres), stratified by gestational age at enrolment. |
| Participants | Women with IUGR diagnosed by ultrasound at 26‐32 weeks' gestation. |
| Interventions | Intervention 1: delivery based on early ductus venosus changes (pulsatility index > 95th centile. Intervention 2: delivery based on late ductus venosus changes (a‐wave reaches the baseline, i.e. 0 mc/s). Control: current standard care: timing of delivery based on CTG criteria for delivery, namely short‐term variation below preset cut‐offs based on gestation. |
| Outcomes | Primary: survival without neurological impairment at 2 years Secondary: long‐term outcomes at 2 years corrected for prematurity: frequency of severe disability; respiratory outcomes; weight; length; head circumference; blood pressure; survival analysis. |
| Starting date | 2005, expected end date June 2009. |
| Contact information | Christoph Lees, Rosie Maternity Hospital, Addenbrookes NHS Trust, Cambridge, CB2 2QQ, UK Email: christoph.lees@addenbrookes.nhs.uk |
| Notes |
CTG: cardiotocography IUGR: intrauterine growth restriction RCT: randomised controlled trial
Contributions of authors
T Stampalija (TS) drafted the background section with Z Alfirevic (ZA) and G Gyte (GG) providing comments and suggestions. GG drafted the methodology section, with ZA and TS providing comments and suggestions. TS and GG undertook the data extraction, TS input the data into RevMan (RevMan 2012) and GG checked the data entry. ZA drafted the discussion and conclusions, and TS and GG checked these.
Sources of support
Internal sources
The University of Liverpool, UK.
External sources
No sources of support supplied
Declarations of interest
None known.
New search for studies and content updated (no change to conclusions)
References
References to studies included in this review
- Almstrom H, Axelsson O, Cnattingius S, Ekman G, Maesel A, Ulmsten U, et al. Comparison of umbilical‐artery velocimetry and cardiotocography for surveillance of small‐for‐gestational‐age fetuses. Lancet 1992;340:936‐40. [DOI] [PubMed] [Google Scholar]; Almstrom H, Axelsson O, Ekman G, Ingemarsson I, Maesel A, Arstrom K, et al. Umbilical artery velocimetry may influence clinical interpretation of intrapartum cardiotocograms. Acta Obstetricia et Gynecologica Scandinavica 1995;74:526‐9. [DOI] [PubMed] [Google Scholar]; Marsal K, Almstrom H, Axelsson O, Cnattingius S, Ekman G, Maesel A, et al. Umbilical artery velocimetry is more effective than cardiotocography for surveillance of growth retarded fetuses. Journal of Perinatal Medicine 1991;19(Suppl 2):84. [Google Scholar]
- Biljan M, Haddad N, McVey K, Williams J. Efficiency of continuous‐wave Doppler in screening high risk pregnancies in a district general hospital (a prospective randomized study on 674 singleton pregnancies). Proceedings of 26th British Congress of Obstetrics and Gynaecology; 1992 July 7‐10; Manchester, UK. 1992:6. [Google Scholar]; Biljan MM, McVey KP, Haddad NG. The value of continuous wave doppler assessment of fetal umbilical artery in management of "at risk" pregnancies. Proceedings of 2nd European Congress on Prostaglandins in Reproduction; 1991 April 30‐May 3; The Hague, Netherlands. 1991:189. [Google Scholar]
- Burke G, Stuart B, Crowley P, Ni Scanaill S, Drumm J. Does Doppler ultrasound alter the management of high‐risk pregnancy?. Care concern and cure in perinatal medicine. 13th European Congress of Perinatal Medicine; 1992 May; Amsterdam, The Netherlands. Parthenon, 1992:597‐604. [Google Scholar]; Burke G, Stuart B, Crowley P, Ni Scanaill S, Drumm J. Does Doppler ultrasound alter the management of high‐risk pregnancy?. Journal of Perinatal Medicine 1992;20(Suppl 1):266. [Google Scholar]
- Rochambeau B, Jabbour N, Mellier G. Umbilical doppler velocimetry in prolonged pregnancies [La velocimetrie Doppler ombilicale dans les grossesses prolongees]. Revue Francaise de Gynecologie et d Obstetrique 1992;87(5):289‐94. [PubMed] [Google Scholar]
- Giles W, Bisits A, O'Callaghan S. The doppler assessment in multiple pregnancy study (damp) and metaanalyses of doppler and twins. American Journal of Obstetrics and Gynecology 2000;182(1 Pt 2):S17. [Google Scholar]; Giles W, Bisits A, O'Callaghan S, Gill A. The doppler assessment in multiple pregnancy randomised controlled trial of ultrasound biometry versus umbilical artery doppler ultrasound and biometry in twin pregnancy. BJOG: an international journal of obstetrics and gynaecology 2003;110(6):593‐7. [PubMed] [Google Scholar]
- Haley J, Tuffnell DJ, Johnson N. Randomised controlled trial of cardiotocography versus umbilical artery Doppler in the management of small for gestational age fetuses. British Journal of Obstetrics and Gynaecology 1997;104(4):431‐5. [DOI] [PubMed] [Google Scholar]
- Hofmeyr GJ, Pattinson R, Buckley D, Jennings J, Redman CWG. Umbilical artery resistance index as a screening test for fetal well‐being. II. Randomized feasibility study. Obstetrics & Gynecology 1991;78:359‐62. [PubMed] [Google Scholar]
- Johnstone FD, Prescott R, Hoskins P, Greer IA, McGlew T, Compton M. The effect of introduction of umbilical Doppler recordings to obstetric practice. British Journal of Obstetrics and Gynaecology 1993;100:733‐41. [DOI] [PubMed] [Google Scholar]
- Neales K. A randomised controlled study to assess the use of Doppler ultrasound in the management of patients with intrauterine growth retardation. Personal communication1994.
- Newnham JP, O'Dea MRA, Reid KP, Diepeveen DA. Doppler flow velocity waveform analysis in high risk pregnancies: a randomized controlled trial. British Journal of Obstetrics and Gynaecology 1991;98:956‐63. [DOI] [PubMed] [Google Scholar]
- Nienhuis SJ. Costs and effects of Doppler ultrasound measurements in suspected intrauterine growth retardation. A randomised clinical trial [thesis]. Maastricht: Universitaire Pers Maastricht, 1995. [Google Scholar]; Nienhuis SJ, Ruissen CJ, Hoogland HJ, Gerver JW, Vles J, Haan J. Cost‐effectiveness of a doppler policy in suspected intrauterine growth retardation ‐ a randomized controlled trial. Proceedings of 13th World Congress of Gynaecology and Obstetrics (FIGO); 1991 Sept 15‐20; Singapore. 1991:32. [Google Scholar]; Nienhuis SJ, Vles JS, Gerver WJ, Hoogland HJ. Doppler ultrasonography in suspected intrauterine growth retardation: a randomized clinical trial. Ultrasound in Obstetrics & Gynecology 1997;9(1):6‐13. [DOI] [PubMed] [Google Scholar]; Ruissen CJ, Nienhuis SJ, Hoogland HJ, Vles JFH, Gerver WJ, Haan J. Cost‐effectiveness of a Doppler based policy of suspected intrauterine growth retardation ‐ a randomised controlled trial. Journal of Maternal Fetal Investigation 1992;1:126. [Google Scholar]
- Nimrod C, Yee J, Hopkins C, Pierce P, Lange I, Fick G, et al. The utility of pulsed Doppler studies in the evaluation of postdate pregnancies. Journal of Maternal Fetal Investigation 1992;1:127. [Google Scholar]
- Norman K, Pattinson RC, Carstens E. Doppler velocimetry in recurrent pregnancy loss: is there a role?. Proceedings of 11th Conference on Priorities in Perinatal Care in South Africa; 1992 March; Caledon, South Africa. 1992:71‐4. [Google Scholar]
- Ott WJ, Mora G, Arias F, Sunderji S, Sheldon G. Comparison of the modified biophysical profile to a new biophysical profile incorporating the middle cerebral artery to umbilical artery velocity flow systolic/diastolic ratio. American Journal of Obstetrics and Gynecology 1998;178(6):1346‐53. [DOI] [PubMed] [Google Scholar]
- Pattinson R, Norman K, Odendaal HJ. Management of fetuses suspected of IUGR but with EDVs of the umbilical artery: a randomised controlled trial. Proceedings of 26th British Congress of Obstetrics and Gynaecology; 1992 July 7‐10; Manchester, UK. 1992:5. [Google Scholar]; Pattinson RC, Norman K, Odendaal HJ. The role of Doppler velocimetry in the management of high risk pregnancies. British Journal of Obstetrics and Gynaecology 1994;101:114‐20. [DOI] [PubMed] [Google Scholar]; Pattinson RC, Norman K, Odendaal HJ. The role of doppler velocimetry in the management of pregnancies: a randomized controlled trial. Proceedings of 11th Conference on Priorities in Perinatal Care in South Africa; 1992 March; Caledon, South Africa. 1992:59‐63. [Google Scholar]
- Trudinger BJ, Cook CM, Giles WB, Connelly AJ, Thompson RS. Umbilical artery flow velocity waveforms in high‐risk pregnancy: randomised controlled trial. Lancet 1987;1:188‐90. [DOI] [PubMed] [Google Scholar]
- Lilford RJ. Fetal assessment in laboratory vs standard management of high risk pregnancy. Personal communication1989. ; Tyrrell SN, Lilford RJ, MacDonald HN, Nelson EJ, Porter J, Gupta JK. Randomized comparison of routine vs highly selective use of Doppler ultrasound and biophysical scoring to investigate high risk pregnancies. British Journal of Obstetrics and Gynaecology 1990;97:909‐16. [DOI] [PubMed] [Google Scholar]
- Williams K, Farquharson D, Bebbington M, Dansereau J, Galerneau F, Wilson RD, et al. A randomized controlled clinical trial comparing non stress testing versus doppler velocimetry as a screening test in a high risk population [abstract]. American Journal of Obstetrics and Gynecology 2000;182(1 Pt 2):S109. [DOI] [PubMed] [Google Scholar]; Williams KP, Farquharson DF, Bebbington M, Dansereau J, Galerneau F, Wilson RD, et al. Screening for fetal well‐being in a high‐risk pregnant population comparing the nonstress test with umbilical artery doppler velocimetry: a randomized controlled clinical trial. American Journal of Obstetrics and Gynecology 2003;188(5):1366‐71. [DOI] [PubMed] [Google Scholar]
References to studies excluded from this review
- Davies JA, Gallivan S, Spencer JAD. Randomised controlled trial of doppler ultrasound screening of placental perfusion during pregnancy. Lancet 1992;340:1299‐303. [PubMed] [Google Scholar]
- Gonsoulin W. Umbilical artery Doppler waveform analysis: a randomized study on effect on outcome. American Journal of Obstetrics and Gynecology 1991;164:370. [Google Scholar]
- Mason GC, Lilford RJ, Porter J, Nelson E, Tyrell S. Randomised comparison of routine vs highly selective use of Doppler ultrasound in low risk pregnancies. British Journal of Obstetrics and Gynaecology 1993;100:130‐3. [DOI] [PubMed] [Google Scholar]
- McCowan LME, Harding J, Roberts AB, Barker S, Townend K. Perinatal morbidity in small for gestational age fetuses in relation to umbilical doppler. Proceedings of the 14th Annual Congress of the Australian Perinatal Society in conjunction with the New Zealand Perinatal Society; 1996 March 24‐27; Adelaide, Australia. 1996:P10. [Google Scholar]
- McParland P, Pearce JM. Doppler blood flow in pregnancy. Placenta 1988;9:427‐50. [DOI] [PubMed] [Google Scholar]
- Newnham JP, Evans SF, Michael CA, Stanley FJ, Landau LI. Effects of frequent ultrasound during pregnancy: a randomised controlled trial. Lancet 1993;342:887‐91. [DOI] [PubMed] [Google Scholar]
- Omtzigt AWJ. Clinical value of umbilical doppler velocimetry [thesis]. Utrecht: University of Utrecht, 1990. [Google Scholar]; Omtzigt AWJ, Bruinse HW, Reuwer PJHM. A randomized controlled trial on the clinical value of umbilical Doppler velocimetry. I. Obstetrical management. Proceedings of 12th European Congress of Perinatal Medicine; 1990 Sept 11‐14; Lyon, France. 1990:210. [Google Scholar]; Omtzigt AWJ, Bruinse HW, Reuwer PJHM. A randomized controlled trial on the clinical value of umbilical Doppler velocimetry: neonatal outcome. Proceedings of 12th European Congress of Perinatal Medicine; 1990 Sept 11‐14; Lyon, France. 1990:189. [Google Scholar]; Omtzigt AWJ, Reuwer PJHM, Bruinse HW. A randomized controlled trial on the clinical value of umbilical Doppler velocimetry in antenatal care. American Journal of Obstetrics and Gynecology 1994;170:625‐34. [DOI] [PubMed] [Google Scholar]
- Pearce JM. The application of uteroplacental waveforms to complicated pregnancies. Doppler Ultrasound in Perinatal Medicine. Oxford: Oxford University Press, 1992:159‐77. [Google Scholar]
- Schneider KTM, Renz S, Furstenau U, Amberg‐Wendland D, Prochaska D, Graeff H. Doppler flow measurements as a screening method during pregnancy: is it worth the effort?. Journal of Maternal Fetal Investigation 1992;1:125. [Google Scholar]
- Whittle MJ, Hanretty KP, Primrose MH, Neilson JP. Screening for the compromised fetus: a randomized trial of umbilical artery velocimetry in unselected pregnancies. American Journal of Obstetrics and Gynecology 1994;170:555‐9. [DOI] [PubMed] [Google Scholar]
References to ongoing studies
- Cambridge Consortium. Trial of umbilical and fetal flow in Europe (TRUFFLE) (ongoing trial). National Research Register (www.nrr.nhs.uk) (accessed 6 July 2006). ; Lees C, Baumgartner H. The TRUFFLE study ‐ a collaborative publicly funded project from concept to reality: how to negotiate an ethical, administrative and funding obstacle course in the European Union. Ultrasound in Obstetrics and Gynecology 2005;25:105‐7. [DOI] [PubMed] [Google Scholar]
Additional references
- Al‐Ghazali WH, Chapman MG, Rissik JM, Allan LD. The significance of absent end‐diastolic flow in the umbilical artery combined with reduced fetal cardiac output estimation in pregnancies at high risk for placental insufficiency. Journal of Obstetrics and Gynaecology 1990;10:271‐5. [Google Scholar]
- Alfirevic Z, Neilson JP. Doppler ultrasonography in high‐risk pregnancies: systematic review with meta‐analysis. American Journal of Obstetrics and Gynecology 1995;172:1379‐87. [DOI] [PubMed] [Google Scholar]
- Alfirevic Z, Roberts D, Martlew V. How strong is the association between maternal thrombophilia and adverse pregnancy outcome? A systematic review. European Journal Obstetetrics & Gynecology and Reproductive Biology 2002;101(1):6‐14. [DOI] [PubMed] [Google Scholar]
- Alfirevic Z, Stampalija T, Gyte GML. Fetal and umbilical Doppler ultrasound in normal pregnancy. Cochrane Database of Systematic Reviews 2010, Issue 8. [DOI: 10.1002/14651858.CD001450.pub3] [DOI] [PMC free article] [PubMed] [Google Scholar]
- Almstrom H, Axelsson O, Ekman G, Ingemarsson I, Maesel A, Arstrom K, et al. Umbilical artery velocimetry may influence clinical interpretation of intrapartum cardiotocograms. Acta Obstetricia et Gynecologica Scandinavica 1995;74:526‐9. [DOI] [PubMed] [Google Scholar]
- Baschat AA, Gembruch U, Harman CR. The sequence of changes in Doppler and biophysical parameters as severe fetal growth restriction worsens. Ultrasound in Obstetrics & Gynecology 2001;18:571‐7. [DOI] [PubMed] [Google Scholar]
- Baschat AA, Gembruch U. Evaluation of the fetal coronary circulation. Ultrasound in Obstetrics & Gynecology 2002;20:405‐12. [DOI] [PubMed] [Google Scholar]
- Bernstein IM, Horbar JD, Badger GJ, Ohlsson A, Golan A. Morbidity and mortality among very‐low‐birth‐weight neonates with intrauterine growth restriction. The Vermont Oxford Network. American Journal of Obstetrics and Gynecology 2000;182:198‐206. [DOI] [PubMed] [Google Scholar]
- Bilardo CM, Nicolaides KH, Campbell S. Doppler measurements of fetal and uteroplacental circulations: relationship with umbilical venous blood gases measured at cordocentesis. American Journal of Obstetrics and Gynecology 1990;162:115‐20. [DOI] [PubMed] [Google Scholar]
- Bilardo CM, Wolf H, Stigter RH, Ville Y, Baez E, Visser GHA, et al. Relationship between monitoring parameters and outcome in severe, early intrauterine growth restriction. Ultrasound in Obstetrics & Gynecology 2004;23:119‐25. [DOI] [PubMed] [Google Scholar]
- Anonymous. Retraction of articles. British Journal of Obstetrics and Gynaecology 1995;102(11):853. [DOI] [PubMed] [Google Scholar]
- Bricker L, Neilson JP. Routine Doppler ultrasound in pregnancy. Cochrane Database of Systematic Reviews 2007, Issue 2. [DOI: 10.1002/14651858.CD001450.pub2] [DOI] [PubMed] [Google Scholar]
- Burns PN. Principles of Doppler and color flow. Radiology in Medicine 1993;85:3‐16. [PubMed] [Google Scholar]
- Cheema R, Dubiel M, Breborowicz G, Gudmundsson S. Fetal cerebral venous Doppler velocimetry in normal and high‐risk pregnancy. Ultrasound in Obstetrics & Gynecology 2004;24:147‐53. [DOI] [PubMed] [Google Scholar]
- Chen JF, Fowlkes JB, Carson PL, Rubin JM, Adler RS. Autocorrelation of integrated power Doppler signals and its application. Ultrasound in Medicine and Biology 1996;22:1053‐7. [DOI] [PubMed] [Google Scholar]
- Moher D, Schulz KF, Altman DG. The CONSORT statement: revised recommendations for improving the quality of reports of parallel‐group randomised trials. Lancet 2001;357(9263):1191‐4. [PubMed] [Google Scholar]
- Deeks JJ, Altman DG, Bradburn MJ. Statistical methods for examining heterogeneity and combining results from several studies in meta‐analysis. In: Egger M, Davey Smith G, Altman DJ editor(s). Systematic Reviews in Health Care: Meta‐Analysis in Context. London: BMJ, 2001. [Google Scholar]
- Devane D, Begley CM, Clarke M, Horey D, OBoyle C. Evaluating maternity care: a core set of outcome measures. Birth 2007;34(2):164‐72. [DOI] [PubMed] [Google Scholar]
- Egger M, Smith GD, Schneider M, Minder C. Bias in meta‐analysis detected by a simple, graphical test. BMJ 1997;315:629‐34. [DOI] [PMC free article] [PubMed] [Google Scholar]
- Ferrazzi E, Bozzo M, Rigano S, Bellotti M, Morabito A, Pardi G, et al. Temporal sequence of abnormal Doppler changes in the peripheral and central circulatory systems of the severely growth‐restricted fetus. Ultrasound in Obstetrics & Gynecology 2002;19:140‐6. [DOI] [PubMed] [Google Scholar]
- Figueras F, Eixarch E, Gratacos E, Gardosi J. Predictiveness of antenatal umbilical artery Doppler for adverse pregnancy outcome in small‐for‐gestational‐age babies according to customised birthweight centiles: population‐based study. BJOG: an international journal of obstetrics and gynaecology 2008;115:590‐4. [DOI] [PubMed] [Google Scholar]
- Fisk NM, Smith RP. Fetal growth restriction; small for gestational age. In: Chamberlain G, Steer P editor(s). Turnbull's Obstetrics. 3rd Edition. Edinburgh: Churchill Livingstone, 2001:197‐209. [Google Scholar]
- Fitzgerald DE, Drumm JE. Non‐invasive measurement of the human circulation using ultrasound: a new method. British Medical Journal 1977;2:1450‐1. [DOI] [PMC free article] [PubMed] [Google Scholar]
- Gates S, Brocklehurst P. How should randomised trial including multiple pregnancies be analysed?. BJOG: an international journal of obstetrics and gynaecology 2004;111:213‐9. [DOI] [PubMed] [Google Scholar]
- Giles WB, Trudinger BJ, Baird PJ. Fetal umbilical artery flow velocity waveforms and placental resistance: pathological correlation. British Journal of Obstetrics and Gynaecology 1985;92:31‐8. [DOI] [PubMed] [Google Scholar]
- Graves CR. Antepartum fetal surveillance and timing of delivery in the pregnancy complicated by diabetes mellitus. Clinical Obstetrics and Gynecology 2007;50(4):1007‐13. [DOI] [PubMed] [Google Scholar]
- Greer IA. Thrombosis in pregnancy: maternal and fetal issues. Lancet 1999;353(9160):1258‐65. [DOI] [PubMed] [Google Scholar]
- GRIT Study Group. A randomised trial of timed delivery for the compromised preterm fetus: short term outcomes and Bayesian interpretation. BJOG: an international journal of obstetrics and gynaecology 2002;110:27‐32. [DOI] [PubMed] [Google Scholar]
- GRIT study group. Infant wellbeing at 2 years of age in the Growth Restriction Intervention Trial (GRIT): multicentred randomised controlled trial. Lancet 2004;364:513‐20. [DOI] [PubMed] [Google Scholar]
- Harbord RM, Egger M, Sterne JA. A modified test for small‐study effects in meta‐analyses of controlled trials with binary endpoints. Statistics in Medicine 2006;25:3443‐57. [DOI] [PubMed] [Google Scholar]
- Hecher K, Bilardo CM, Stigter RH, Ville Y, Hackeloer BJ, Kok HJ, et al. Monitoring of fetuses with intrauterine growth restriction: a longitudinal study. Ultrasound in Obstetrics & Gynecology 2001;18:564‐70. [DOI] [PubMed] [Google Scholar]
- Higgins JPT, Green S, editors. Cochrane Handbook for Systematic Reviews of Interventions Version 5.0.0 [updated February 2008]. The Cochrane Collaboration, 2008. Available from www.cochrane‐handbook.org.
- Higgins JPT, Thompson SG, Spiegelhalter DJ. A re‐evaluation of random‐effects meta‐analysis. Journal of the Royal Statistical Society, Series A 2009;172:137‐59. [DOI] [PMC free article] [PubMed] [Google Scholar]
- Higgins JPT, Green S, editors. Cochrane Handbook for Systematic Reviews of Interventions Version 5.1.0 [updated March 2011]. The Cochrane Collaboration, 2011. Available from www.cochrane‐handbook.org.
- Lalor JG, Fawole B, Alfirevic Z, Devane D. Biophysical profile for fetal assessment in high risk pregnancies. Cochrane Database of Systematic Reviews 2008, Issue 1. [DOI: 10.1002/14651858.CD000038.pub2] [DOI] [PMC free article] [PubMed] [Google Scholar]
- Mari G. Doppler ultrasonography in obstetrics: from the diagnosis of fetal anemia to the treatment of intrauterine growth‐restricted fetuses. American Journal of Obstetrics and Gynecology 2009;200(6):613.e1‐613.e9. [DOI] [PubMed] [Google Scholar]
- Mires GJ, Patel NB, Dempster J. Review: The value of fetal umbilical artery flow velocity waveforms in the prediction of adverse fetal outcome in high risk pregnancies. Journal of Obstetrics and Gynaecology 2000;10:261‐70. [Google Scholar]
- Neilson JP. Doppler ultrasound. British Journal of Obstetrics and Gynaecology 1987;94:929‐34. [DOI] [PubMed] [Google Scholar]
- Nicholaides KH, Bilardo CM, Soothill PW, Campbell S. Absence of end diastolic frequencies in umbilical artery: a sign of fetal hypoxia and acidosis. BMJ 1988;297(6655):1026‐7. [DOI] [PMC free article] [PubMed] [Google Scholar]
- Nienhuis SJ. Costs and effects of Doppler ultrasound measurements in suspected intrauterine growth retardation. A randomised clinical trial [thesis]. Maastricht: Universitaire Pers Maastricht, 1995. [Google Scholar]
- Ortibus E, Lopriore E, Deprest J, Vandenbussche FP, Walther FJ, Diemert A, et al. The pregnancy and long‐term neurodevelopmental outcome of monochorionic diamniotic twin gestations: a multicenter prospective cohort study from the first trimester onward. American Journal of Obstetrics and Gynecology 2009;200(5):494.e1‐494.e8. [DOI] [PubMed] [Google Scholar]
- Owen P. Fetal assessment in the third trimester: fetal growth and biophysical methods. In: Chamberlain G, Steer P editor(s). Turnbull's Obstetrics. 3rd Edition. Edinburgh: Churchill Livingstone, 2001. [Google Scholar]
- Pattison N, McCowan L. Cardiotocography for antepartum fetal assessment. Cochrane Database of Systematic Reviews 1999, Issue 1. [DOI: 10.1002/14651858.CD001068] [DOI] [PubMed] [Google Scholar]
- The Nordic Cochrane Centre: The Cochrane Collaboration. Review Manager (RevMan). Version 5.0. Copenhagen: The Nordic Cochrane Centre: The Cochrane Collaboration, 2008.
- The Nordic Cochrane Centre, The Cochrane Collaboration. Review Manager (RevMan). Version 5.2. Copenhagen: The Nordic Cochrane Centre, The Cochrane Collaboration, 2012.
- Stampalija T, Gyte GML, Alfirevic Z. Utero‐placental Doppler ultrasound for improving pregnancy outcome. Cochrane Database of Systematic Reviews 2010, Issue 9. [DOI: 10.1002/14651858.CD008363.pub2] [DOI] [PMC free article] [PubMed] [Google Scholar]
- Thompson RS, Trudinger BJ. Doppler waveform pulsatility index and resistance, pressure and flow in the umbilical placental circulation: an investigation using a mathematical model. Ultrasound in Medicine and Biology 1990;16:449. [DOI] [PubMed] [Google Scholar]
- Trudinger BJ, Giles WB, Cook CM, Bombardieri J, Collins L. Fetal umbilical artery flow velocity waveforms and placental resistance: clinical significance. British Journal of Obstetrics and Gynaecology 1985;92:23‐30. [DOI] [PubMed] [Google Scholar]
- Trudinger BJ, Giles WB, Cook CM. Uteroplacental blood flow velocity‐time waveform in normal and complicated pregnancy. British Journal of Obstetrics and Gynaecology 1985;92:39‐45. [DOI] [PubMed] [Google Scholar]
- Weiner CP. The relationship between the umbilical artery systolic/diastolic ratio and umbilical blood gas measurements in specimens obtained by cordocentesis. American Journal of Obstetrics and Gynecology 1990;162:1198‐202. [DOI] [PubMed] [Google Scholar]
- Westergaard HB, Langhoff‐Roos J, Lingman G, Marsal K, Kreiner S. A critical appraisal of the use of umbilical artery Doppler ultrasound in high‐risk pregnancies: use of meta‐analyses in evidence‐based obstetrics. Ultrasound in Obstetrics & Gynecology 2001;17:466‐76. [DOI] [PubMed] [Google Scholar]
References to other published versions of this review
- Alfirevic Z, Stampalija T, Gyte GML. Fetal and umbilical Doppler ultrasound in high‐risk pregnancies. Cochrane Database of Systematic Reviews 2010, Issue 1. [DOI: 10.1002/14651858.CD007529.pub2] [DOI] [PMC free article] [PubMed] [Google Scholar]
- Neilson JP, Alfirevic Z. Doppler ultrasound for fetal assessment in high risk pregnancies. Cochrane Database of Systematic Reviews 1995, Issue 1. [DOI: 10.1002/14651858.CD000073] [DOI] [PubMed] [Google Scholar]
- Neilson JP, Alfirevic Z. Doppler ultrasound for fetal assessment in high risk pregnancies. Cochrane Database of Systematic Reviews 1996, Issue 4. [DOI: 10.1002/14651858.CD000073.pub2] [DOI] [PubMed] [Google Scholar]