

Abstract
Background
Stroke Unit care is now accepted as an effective service model for hospital care, but the effectiveness of outpatient care is less certain. This review focuses on therapy‐based rehabilitation services targeted at stroke patients living at home.
Objectives
To assess the effects of therapy‐based rehabilitation services targeted towards stroke patients resident in the community within one year of stroke onset/discharge from hospital following stroke.
Search methods
We searched the Cochrane Stroke Group Trials Register (last searched May 2001), the Cochrane Controlled Trials Register (The Cochrane Library Issue 4, 2001), MEDLINE (1996 to November 2001), EMBASE (1980 to November 2001), CINAHL (1983 to November 2001), PsycINFO (1967 to November 2001), AMED (1985 to November 2001), Wilson Social Sciences Abstracts (1984 to November 2001), Science Citation Index and Social Sciences Citation Index (1981 to November 2001). Other strategies to ensure identification of all potentially relevant trials included scanning reference lists of relevant articles and original papers, personal communication and hand searching journals.
Selection criteria
All unconfounded, truly randomised controlled trials of stroke patients resident in the community receiving a therapy service intervention compared with conventional or no care. Therapy services were those provided by physiotherapy, occupational therapy, or multidisciplinary staff working with patients primarily to improve task‐orientated behaviour and hence increase activity and participation.
Data collection and analysis
Two review authors independently selected trials and extracted data on a number of prespecified outcomes. The primary outcomes were the proportion of patients who had deteriorated or were dependent in personal activities of daily living and performance in personal activities of daily living at the end of follow up.
Main results
We identified 14 trials including 1617 patients. Therapy‐based rehabilitation services reduced the odds of a poor outcome (Peto odds ratio 0.72, 95% confidence interval (CI) 0.57 to 0.92; P = 0.009) and increased personal activity of daily living scores (standardised mean difference 0.14, 95% CI 0.02 to 0.25; P = 0.02). For every 100 stroke patients resident in the community receiving therapy‐based rehabilitation services, 7 (95% CI 2 to 11) patients would be spared a poor outcome, assuming 37.5% would have had a poor outcome with no treatment.
Authors' conclusions
Therapy‐based rehabilitation services targeted towards stroke patients living at home appear to improve independence in personal activities of daily living. However, the evidence is derived from a review of heterogeneous interventions and therefore further exploration of the interventions is justifiable.
Plain language summary
Therapy‐based rehabilitation services for stroke patients at home
People who have had a recent stroke are more likely to maintain their ability to carry out daily activities if they receive therapy services at home. Therapy‐based rehabilitation services for stroke survivors can include input from physiotherapists, occupational therapists or multidisciplinary teams. This review of 14 studies, involving 1617 participants, found that people who had a recent stroke were more independent in personal activities of daily living and more likely to maintain these abilities if they received therapy services at home. The amount of benefit that can be achieved is uncertain.
Background
Stroke is one of the major causes of death and disability in the Western world and consumes about 5% of National Health Service resources in Scotland (Isard 1992) with similar findings from other developed countries. It is therefore imperative that services for people who have had a stroke are effective and efficient. A systematic review has indicated that organised in‐patient (stroke unit) care is the service model of choice within hospital (SUTC 2002). However, many questions remain about how other components of a stroke service should be provided (Langhorne 1995). In particular, what outpatient rehabilitation services should be provided after discharge from hospital? With increasing emphasis on services to enhance early hospital discharge (ESDT 2002) the importance of outpatient rehabilitation services is growing. Evaluation of the effectiveness of outpatient services is therefore of key importance to the delivery of efficient evidence‐based stroke care.
The definition of rehabilitation (Wade 1992) is broad and non‐specific: 'a problem‐solving and educational process aimed at reducing the disability and handicap experienced by someone as a result of a disease ...'. Using this definition, outpatient stroke rehabilitation services can be considered as any intervention delivered by rehabilitation personnel, which aims to meet these broad objectives. These interventions have been categorised into those which aim to reduce disability and those aiming to reduce psychological and social problems (Langhorne 1995). However, the components of each specific intervention tend to overlap and it is difficult to devise criteria which can accurately distinguish different types of intervention, or even to distinguish interventions provided by different rehabilitation staff. For this reason, we first set out to identify and describe all trials of outpatient services, which have aimed to improve patient or carer outcomes after stroke.
The development of this descriptive analysis (OST 1999) comprised a two‐stage process. The first stage involved a comprehensive, unbiased search for randomised controlled trials of outpatient rehabilitation services for stroke patients which had been compared with no routine intervention. Two independent assessors examined the trials for inclusion based on pre‐defined criteria. The second stage involved getting consensus from trial collaborators around descriptors which included: (1) trial identifiers; (2) who provided the intervention; (3) the domains of the intervention (i.e. behavioural, psychological, informational, social); (4) delivery; (5) intensity; (6) timing; (7) patients; (8) intention (e.g. to reduce disability by improving mobility); and (9) control comparison. All the identified trials were fitted into this taxonomy and analysed using a simple numerical taxonomy cluster analysis (Armitage 1987) to identify clusters of studies with similar characteristics.
This descriptive analysis indicated two major distinctive groups of interventions. (1) Therapy‐based services: provided by physiotherapy, occupational therapy, or multidisciplinary staff working with patients primarily to improve task‐orientated behaviour (e.g. walking, dressing) and hence reduce disability. (2) Stroke liaison worker services: provided by nursing, social work or volunteer staff working with patients to provide information and improve social liaison with the primary intention of improving mood and alleviating the emotional impact of stroke.
This review will focus on the former group of interventions and a subsequent one (Mant 2002) will focus on the latter.
Objectives
We addressed three main questions. (1) Can therapy‐based rehabilitation services exert any beneficial effect on the outcomes of stroke patients (and those of their carers)? (2) Which components of such services are effective (e.g. physiotherapy, occupational therapy, multidisciplinary)? (3) Which outcomes are influenced (e.g. dependency, social activities, mood, functional deterioration)?
Methods
Criteria for considering studies for this review
Types of studies
We included all unconfounded, truly randomised controlled trials of stroke patients resident in the community receiving a therapy service intervention, which was compared with conventional care (i.e. normal practice or no routine intervention).
Types of participants
We included trials which recruited patients who fulfilled a clinical definition of stroke (focal neurological deficit caused by cerebrovascular disease), were resident in a community setting (i.e. permanent address) and who had been randomised to treatment within one year of the index stroke.
Types of interventions
We were interested in reviewing therapy‐based rehabilitation service interventions, which had the following features.
(1) Outpatient: interventions targeted towards stroke patients living at home (i.e. permanent address). The exact form (e.g. domiciliary, day hospital, outpatient clinic) was recorded but not used as an exclusion criterion. We included trials which: (a) randomised patients prior to hospital discharge; (b) included patients not admitted to hospital following stroke; and (c) randomised patients who were resident in the community. We explored possible confounding effects due to differences in inpatient care.
(2) Therapy‐based rehabilitation: the definition of the intervention is based on a taxonomic descriptive analysis (OST 1999) of all identified trials of outpatient rehabilitation services. One major cluster of interventions had the following features: (a) provided by qualified physiotherapy, occupational therapy or multidisciplinary staff, or under the supervision of qualified therapy staff; (b) therapists outlined in (a) work with the patient to improve task‐orientated behaviour (e.g. walking, dressing, leisure); and (c) primarily aiming to reduce disability.
(3) Service: any intervention which required an organisational and staffing structure (i.e. which requires rehabilitation therapy staff). Interventions had to be tested at a service level rather than at the level of the specific therapeutic technique. We did not include trials which compared different therapy techniques within the same service setting or which looked at different settings for providing similar interventions (e.g. physiotherapy versus day hospital physiotherapy). Service interventions were only considered if they aimed to deliver the intervention routinely to a wide range of stroke patients. We did therefore not consider interventions directed only at a small sub‐group of stroke patients (e.g. those with depression).
We included trials where the control group received no routine intervention or 'normal practice'. The exact form of control service was recorded but not used to exclude trials. Interventions which primarily aimed to prevent admission to hospital, to facilitate early discharge from hospital (ESDT 2002), or to reduce communication problems (Greener 2002a; Greener 2002b; Sellars 2002) were excluded as they were covered in other reviews.
Types of outcome measures
We recorded outcomes which would reflect the full burden of a disabling illness. These were:
Primary outcomes
(1) Death or a poor outcome (deterioration, dependency, institutionalisation) defined as the combined poor outcome of being dead or (a) experiencing a deterioration in ability to perform activities of daily living (i.e. experiencing a drop in a given ADL score); or (b) dependent (i.e. lying above or below a pre‐defined cut‐off on a given ADL scale); or (c) requiring institutional care at the end of scheduled follow up. (2) Performance in personal activities of daily living (feeding, dressing, bathing, toileting, simple mobility and transfers) at the end of scheduled follow up.
Secondary outcomes
(1) Death at the end of scheduled follow up. (2) The number of patients dead or requiring institutional care at the end of scheduled follow up. (3) The number of patients dead or physically dependent (i.e. lying above or below a pre‐defined cut‐off characterised by a drop in score on a given ADL scale) at the end of scheduled follow up. (4) Performance in extended activities of daily living (community and domestic activities) at the end of scheduled follow up. (5) Patient subjective health status/quality of life at the end of scheduled follow up. (6) Patient mood at the end of scheduled follow up. (7) Carer quality of life at the end of scheduled follow up. (8) Carer mood at the end of scheduled follow up. (9) Patient and carer satisfaction with services at the end of scheduled follow up.
Outcomes (4), (5), (6), (7), and (8) were measured by the available measures.
We recorded outcomes which reflected resource use (i.e. number of admissions to hospital, number of days in hospital, aids and appliances provided, number of staff required per caseload) by the end of scheduled follow up.
Search methods for identification of studies
See: 'Specialized register' section in Cochrane Stroke Group
Relevant trials were identified in the Cochrane Stroke Group Trials Register, which was last searched by the Review Group Co‐ordinator in May 2001. The Cochrane Controlled Trials Register (The Cochrane Library Issue 4, 2001), MEDLINE (1966 to November 2001), EMBASE (1980 to November 2001), CINAHL (1983 to November 2001), PsycINFO (1967 to November 2001), AMED (1985 to November 2001), Wilson Social Sciences Abstracts (1984 to November 2001), Science Citation Index and Social Sciences Citation Index (1981 to November 2001) were searched using intervention‐based search strategies for electronic databases which were developed in conjunction with the Cochrane Stroke Group Trials Search Co‐ordinator to avoid unnecessary duplication.
We developed an intervention‐based strategy, using controlled vocabulary and free‐text terms, which was used to identify studies involving interventions provided by physiotherapists, occupational therapists or a multi‐disciplinary group to stroke patients living at home. This strategy was used to search MEDLINE and the Cochrane Controlled Trials Register (CENTRAL/CCTR) (Appendix 1) and was modified to suit other databases (Appendix 2).
Other strategies to ensure identification of all potentially relevant trials included scanning reference lists of relevant articles and original papers and personal communication.
In addition, we handsearched 17 journals for this review (Appendix 3).
Data collection and analysis
The trials were scrutinised by two independent reviewers to ensure eligibility. Differences in opinion regarding trial eligibility were resolved by consensus.
Assessment of methodological quality
The methodological quality of the studies was documented by two independent reviewers. The following quality criteria were documented: randomisation; method of treatment allocation; concealment of treatment allocation; presence of an intention to treat analysis and a blinded assessment of final outcomes. The sensitivity analyses were based on these variables.
Data extraction
Our primary aim was to obtain standardised data through collaboration with the original trialists. Where data were taken from published sources this was extracted by two independent investigators using a standard data recording form. Where differences occurred between the two investigators these were resolved through consensus.
Data synthesis
Binary outcome variables were analysed using the Peto odds ratio (OR) and 95% confidence interval (CI) employing a fixed effects model with exploration of sources of heterogeneity. For continuous variables, a random effects model was always used to take account of statistical heterogeneity.
Sensitivity analysis
Sensitivity analyses were carried out based upon the method of randomisation, presence of an intention to treat analysis, blinding of final assessment, type of intervention provided, severity of stroke, timing of the intervention, nature and number of staff involved and the setting in which the patient was managed (i.e. discharged from hospital or never admitted to hospital).
Heterogeneity tests
Standard tests of statistical heterogeneity were carried out and sources of heterogeneity explored.
Results
Description of studies
A total of 27 trials were identified by November 2001 of which 10 were excluded (Ljungberg 2001; Werner 1996; Turton 1990; Haig 1995; Mayo 2000; Wall 1987; Frayne 2000; Ytterberg 2000; Mulders 1989; Wade 1992) for various reasons: details are given in the 'Characteristics of Excluded Studies' section. Three trials are not yet completed (Logan 2002; Sackley 2002; Stalhandske 2002) and the remaining 14 contained outcome information on a total of 1617 patients.
(1) Patient characteristics
(a) Demographic characteristics
The mean age of patients in the included studies ranged from 55 to 75 years. One study (London 1981) had a smaller proportion of men to women in the control group compared to the two intervention groups (67% and 73% male in intervention groups compared to 41% in control group). There was a significant difference in the ratio of males to females in the intervention group in another (Nottingham 1997). Data were not provided on gender characteristics in a third trial (Kansas 1998). Percentage males in the included studies ranged from 37% to 67%. Full details of the percentage males in each study are included in the Table: Characteristics of included studies.
(b) Stroke severity (Barthel Index scores) at baseline
Barthel Index scores were available at baseline for eight trials. Five studies (Cardiff 1995; Glasgow 2000; Nottingham 1999; South London 2000; TOTAL 2001) presented Barthel Index Scores at baseline for intervention and control groups as medians and inter quartile range (IQR). Full details of median and IQR are included in Table 1: Stroke severity (Barthel Index score). One study (Copenhagen 2000) presented the baseline Barthel Index score (100 point scale) for intervention and control group as mean and standard deviation, which was 80.6 (16.12 Barthel Index 20 point scale) (SD = 17.4) and 76.8 (15.36 on Barthel Index 20 point scale) (SD = 23.7) respectively. Another study (Kansas 1998) provided the mean baseline Barthel Index scores (100 point scale) for intervention and control group (82.5 and 82.5 (16.5 on Barthel Index 20 point scale)) without the standard deviation. One study (Hong Kong 1995) recorded the number of patients scoring less than or equal to 15, or 16 to 19 on the Barthel Index, which was 82% and 18% respectively.
1. Stroke severity (Barthel Index score).
| Study | Intervn. median(IQR) | Control median(IQR) |
| Cardiff | 15 (2‐20) | 14 ( 0‐20) |
| Glasgow | 17 (15‐18) | 18 (16‐19) |
| Nottingham 1999 | 18 (15‐20) | 18 (15‐20) |
| South London | 17 (7‐20) | 17 (8‐20) |
| TOTAL | 18 (15‐20) | 18 (16‐19) |
(2) Exclusion criteria
Ten trials employed exclusion criteria which excluded patients who: had a previous history of stroke (Hong Kong 1995); varying degrees of communication and/or cognitive difficulties and/or other co‐existing conditions that would interfere with outcome assessments or participation in treatment regimens (Copenhagen 2000; Glasgow 2000; Kansas 1998; Nottingham 1995; Philadelphia 1997; TOTAL 2001; Vancouver 1991); who were unable to speak English (Glasgow 2000; Nottingham 1995; Nottingham 1996; Nottingham 1999; TOTAL 2001); were terminally ill (Copenhagen 2000; Glasgow 2000); blind (Nottingham 1996); deaf (Nottingham 1996); had a history of dementia (Hong Kong 1995; Nottingham 1999; TOTAL 2001); were on antidepressant medication (Vancouver 1991); were participating in other studies (Copenhagen 2000); and/ or were resident in/or to be discharged to a residential or nursing home (Copenhagen 2000; Glasgow 2000; Nottingham 1999; Philadelphia 1997; TOTAL 2001). Two trials required the patient to have a friend or carer who was willing to participate (Philadelphia 1997; Vancouver 1991).
(3) Definition of stroke
Three trials used the World Health Organization (Aho 1980) criteria to define stroke (Copenhagen 2000; Kansas 1998; TOTAL 2001), while nine used a clinical definition of stroke (Cardiff 1995; Glasgow 2000; Hong Kong 1995; London 1981; Nottingham 1997; Nottingham 1999; Philadelphia 1997; South London 2000; Vancouver 1991). Two trials did not specify the definition of stroke (Nottingham 1995; Nottingham 1996).
(4) Recruitment
Nine trials recruited patients at discharge from inpatient facilities (Cardiff 1995; Copenhagen 2000; Glasgow 2000; Hong Kong 1995; London 1981; Nottingham 1995; Nottingham 1996; Nottingham 1997; TOTAL 2001). Five trials recruited patients within a set time frame from stroke onset: 1 month (Nottingham 1999); 30‐90 days (Kansas 1998); 2 weeks to 3 months (Philadelphia 1997); within 6 months (TOTAL 2001); within 15 months (Vancouver 1991). Two trials recruited stroke patients who were not admitted to hospital following stroke onset (Nottingham 1999; South London 2000).
(5) Characteristics of patient stroke care prior to discharge/recruitment
(a) Inpatient facilities
12 trials recruited patients who had experience of hospital inpatient facilities. Inpatient facilities include: a stroke unit (Cardiff 1995; Nottingham 1995; Nottingham 1996); inpatient rehabilitation unit (Philadelphia 1997); rehabilitation hospital (Vancouver 1991); stroke ward (Hong Kong 1995); general medical, health care of the elderly wards (Nottingham 1996); neurological ward, geriatric and rheumatology ward and geriatric ward (Copenhagen 2000); hospital ‐ non‐specific (Glasgow 2000; Kansas 1998; London 1981; Nottingham 1997; TOTAL 2001). Two studies recruited patients from home (Nottingham 1999; South London 2000).
(b) Experience of rehabilitation prior to discharge/recruitment
Four studies recruited patients who had experience of inpatient rehabilitation prior to recruitment (Cardiff 1995; Copenhagen 2000; Hong Kong 1995; Philadelphia 1997); in one study (Vancouver 1991), patients had completed a rehabilitation programme; one study (Nottingham 1999), patients had no rehabilitation prior to recruitment and rehabilitation experience was unclear in 8 studies (Glasgow 2000; Kansas 1998; London 1981; Nottingham 1995; Nottingham 1996; Nottingham 1997; South London 2000; TOTAL 2001).
(c) Length of stay
Two (South London 2000; Nottingham 1999) out of the fourteen included studies recruited patients who were not admitted to hospital following stroke. Information on the number of days in hospital was available from five studies (Hong Kong 1995; Copenhagen 2000; Cardiff 1995; Nottingham 1997; TOTAL 2001). In one study (Hong Kong 1995) the length of stay for patients on the stroke ward in the intervention group was intervention mean 6.47, SEM = 3.62 and mean 5.45, SEM = 2.66 for those patients in the conventional group; length of stay in the rehabilitation ward for patients in the intervention group was mean 33.31, SEM = 24.02 and mean 34.87, SEM = 18.29 for the conventional group. In another study (Copenhagen 2000) the length of stay in days in the hospital facility for the intervention group was (mean, median) 83.0/74 and (mean, median) 98.3/ 88.5 for the control group. For one study (Cardiff 1995) the length of stay in days for the intervention group was median 50, (IQR 5‐229) and median 50, (IQR 7‐169) for the control group. In the Nottingham 1997 study, the length of stay in days in the hospital facility for patients receiving the enhanced service was median 39 (IQR 6 ‐ 252), and median 45 (IQR 4 ‐ 328) for the patients receiving usual service. TOTAL 2001 length of stay leisure group median 23 (IQR 11‐ 62), ADL group median 26 (IQR 12 ‐ 63), control group median 30, (IQR 15 ‐ 58). No data were available on length of hospital stay for London 1981; Philadelphia 1997; Kansas 1998; Glasgow 2000; Nottingham 1995; Nottingham 1996; Vancouver 1991.
(6) Duration of follow up
Duration of follow up was between three and 12 months, median six months. For full details of periods of follow up refer to 'Characteristics of included studies'.
(7) Study interventions and comparisons
For details of the comparisons made within the 14 trials with outcome data refer to Table 2: Study interventions and comparisons. Four of the trials compared two alternative forms of interventions against usual care or no routine intervention. Two trials (Nottingham 1995; TOTAL 2001) compared alternative forms of occupational therapy i.e. occupational therapy focused on 'leisure' and conventional occupational therapy against control. One trial (Nottingham 1996) used a crossover design in which patients were given dressing practice, the intervention of interest, in sequence. For the purpose of this review the end of scheduled follow‐up is the end of the first treatment period, i.e. 12 weeks. One trial (London 1981) compared three different intensities of therapy; another trial compared a therapy‐based 'physiotherapy' intervention with a 'physician' intervention against usual care (Copenhagen 2000). As this review was confined to therapy‐based interventions the physician‐based intervention was excluded.
2. Study interventions and comparisons.
| Number of trials | Number of patients | Interventions | Control | Studies |
| 8 | 1145 | Occupational therapy | no routine intervention | Cardiff; Glasgow; Nottingham 1995; Nottingham 1996; Nottingham 1997; Nottingham 1999; TOTAL; Vancouver. |
| 2 | 121 | Physiotherapy | usual care | Copenhagen; Kansas. |
| 1 | 120 | Multidisciplinary team | conventional medical care | Hong Kong |
| 1 | 133 | Multidisciplinary: physiotherapist; occupational therapist, speech and language therapist. | no routine intervention | London |
| 1 | 55 | Multidisciplinary: physiatrist; psychologist; recreational therapist; case manager/ social worker. | usual care | Philadelphia |
| 1 | 43 | Multidisciplinary: physiotherapist; occupational therapist; speech and language therapist; therapy aide. | usual community care | South London |
(8) Intensity of intervention
Nine trials provided information on the intensity of treatment sessions. Four trials provided an intervention programme that covered a six‐month period (Cardiff 1995 ‐ intervention at 2, 8,16, 24 weeks; London 1981 ‐ intensive four days per week, conventional three half days; Nottingham 1995 ‐ 30 minutes per week in first three months thereafter 30 minutes per fortnight; TOTAL 2001 ‐ six‐month programme, minimum of 10 treatment sessions, 30 minute+ treatment sessions). One trial (Nottingham 1999) provided a five‐month treatment programme with a mean of 5.8 visits per patient. One trial provided a three‐month intervention programme (South London 2000 ‐ one daily visit from each therapist). In one trial the intervention programme lasted for eight weeks (Kansas 1998 ‐ three visits per week, 90 minute sessions). Two trials provided an intervention programme that lasted six weeks (Copenhagen 2000 ‐ one hour sessions; Glasgow 2000 ‐ 1.7 visits per week, 30 ‐ 45 minute sessions). One trial provided an intervention programme that covered a five‐week period (Vancouver 1991 ‐ five treatment sessions lasting one hour). One trial (Nottingham 1997) provided a mean of six visits per patient. Three trials did not provide any information on the intensity of intervention (Hong Kong 1995; Nottingham 1996; Philadelphia 1997).
(9) Outcome measures used in trials
The included trials used a large number of heterogeneous outcome measures for patients.
(a) Patient outcomes
Full details of the range of outcomes used in the different studies are provided in Table 3 'Patient outcome measures'.
3. Patient Outcome Measures.
| Category | Measure | Study |
| Global outcomes | Death | All studies |
| Deterioration | Glasgow | |
| Impairment | Motricity Index | South London |
| Functional outcomes | 10 metre walk | Kansas |
| 5 metre timed walk | South London | |
| 6 minute walk | Kansas | |
| Frenchay aphasia screening test | South London | |
| Fugl‐Meyer Motor Score | Kansas | |
| Global dependency/ Performance in ADL | Activities of Daily Living ADL Index | London |
| Barthel Index | Hong Kong, South London, Copenhagen, Kansas, Cardiff, Glasgow, Nottingham 1997, Nottingham 1999, TOTAL, Vancouver | |
| Functional Independence Measure | Philadelphia | |
| Nottingham Stroke Dressing Assessment | Nottingham 1996 | |
| Rankin Scale | South London, TOTAL | |
| Rivermead ADL | South London, Nottingham 1996 | |
| Extended Activities of daily living | Frenchay Activities Index | Philadelphia, Copenhagen |
| Index of Extended Activities of Daily Living | Copenhagen | |
| Lawton Instrumental ADL | Kansas | |
| Nottingham EADL | Cardiff, Glasgow, Nottingham 1995, Nottingham 1997, Nottingham 1999, TOTAL | |
| The Active Lifestyle: Efficacy Expectancies Scale | Philadelphia | |
| The Older American Resources and Services Scales: Activities of Daily Living | Philadelphia | |
| Participation | Canadian Occupational Performance Measure | Glasgow |
| Katz Adjustment Index ‐ Level of free time activities | Vancouver | |
| London Handicap Scale | Nottingham 1999, TOTAL | |
| Nottingham Leisure Questionnaire | Nottingham 1995, TOTAL | |
| Oxford Handicap Scale | TOTAL | |
| The International Stroke Trials Outcomes Questionnaire | TOTAL | |
| Quality of Life | Euroqol | Glasgow |
| Katz Adjustment Index ‐ Level of Satisfaction with Free Time Activities | Philadelphia | |
| Nottingham Health Profile | South London, Nottingham 1995, Nottingham 1996 | |
| Pearlman's 6‐point Quality of Life Scale | Cardiff | |
| Physical Function (MOS‐36) | Kansas | |
| The Older American Resources and Services Scales: Physical Health | Philadelphia | |
| Well‐being self‐rated | Hong Kong | |
| Motor impairment | Berg Balance Scale | Kansas |
| Jebsen Test of Hand Function | Kansas | |
| Motricity Index | South London | |
| Rivermead motor assessment (gross function) | Nottingham 1999 | |
| Mood | General Health Questionnaire | Glasgow, Nottingham 1997, Nottingham 1999, TOTAL |
| Geriatric Depression Scale | Cardiff, Hong Kong | |
| Hospital Anxiety and Depression Scale | South London | |
| The Centre for Epidemiologic Studies: Depression Scale | Philadelphia | |
| Wakefield Depression Inventory | Nottingham 1995 | |
| Zung Depression Scale | Vancouver | |
| Cognition | Mini‐mental State Examination | South London, Vancouver |
| Perception | Albert Test | South London |
(i) Global outcomes
Death. Deterioration. Deterioration, represented by 'deterioration in Barthel Activities of Daily Living Index' (Mahoney 1965) was reported in one trial.
(ii) Measures of impairment
Motricity Index (Demeurisse 1980) was recorded by one trial.
(iii) Functional outcomes
Measures reported by the included trials include gait velocity (two trials) (Collen 1990) (Guyatt 1985); Rivermead Motor Function Scale (two trials) (Lincoln 1976); Fugl‐Meyer scale (one trial) (Fugl‐Meyer 1975); Frenchay Aphasia screening test (one trial) (Enderby 1987).
(iv) Measures of activity
Global dependency scales/ performance in activities of daily living (ADL) Measures reported in the included trials were: Barthel Index (10 trials) (Mahoney 1965); Rankin (two trials) (Rankin 1957); Functional Independence Measure (one trial) (Wade 1992); Northwick Park ADL (one trial) (Wade 1992); Nottingham Stroke Dressing Assessment (one trial) (Ebrahim 1985); Rivermead ADL (two trials) (Wade 1992).
(v) Extended activity of daily living scales.
Measures reported in the included trials were: Nottingham Extended Activities of Daily Living (six trials) (Nouri 1987); Frenchay Activities Index (two trials) (Wade 1985); Index of Extended Activities of Daily Living (one trial) (Anderson 2001); Katz Adjustment Index ‐ Level of free time activities (one trial) (Wade 1992); Lawton Instrumental Activities of Daily Living (one trial) (Lawton 1988); The Active Lifestyle Efficacy Expectancies Scale (one trial) (STAIR 1995); The Older American Resources and Services Scales ‐ Activities of Daily Living (one trial) (Fillenbaum 1981).
(vi) Measures of participation
Measures reported in the included trials were London Handicap Scale (two trials) (Harwood 1994); Nottingham Leisure Questionnaire (two trials) (Drummond 1994); Canadian Occupational Performance Measure (one trial) (Law 1994); International Stroke Trials Outcomes (one trial) (IST 1997); Katz Adjustment Index ‐ level of free time activities (one trial) (Wade 1992); Oxford Handicap Scale (one trial) (Wade 1992).
(vii) Quality of life
Measures reported in included trials were Nottingham Health Profile (three trials) (Hunt 1981), Euroquol (one trial) (Euroquol 1990); Katz Adjustment Index ‐ satisfaction with free time activities (one trial) (Wade 1992); Pearlman's six point Quality of Life Scale (one trial) (Pearlman 1991); Medical Outcomes Study MOS 36 Physical Function (one trial) (Ware 1992); The Older American Resources and Services Scales ‐ Physical Health (one trial) (Fillenbaum 1981); Well‐being (self‐rated) (one trial).
(viii) Measures of motor impairment
Postural control and balance. Measures used by the included trials were Berg Balance Scale (one trial) (Berg 1995). Upper extremity function. Measures reported in included trials were Jebsen Test of Hand Function (one trial) (Jebsen 1969).
(ix) Mood
Measures reported include: General Health Questionnaire (four trials) (Goldberg 1992); Geriatric Depression Scale (two trials) (Sheikh 1986); Hospital Anxiety and Depression Scale (one trial) (Wade 1992); The Centre for Epidemiological Studies ‐ Depression Scale (one trial) (Radloff 1977); Wakefield Depression Inventory (one trial) (Wade 1992) and Zung Depression Scale (one trial) (Wade 1992).
(x) Cognitive Function
Measures reported include the Mini‐Mental State Examination (two trials) (Wade 1992).
(xi) Perception
Albert test (one trial) (Albert 1973).
(b) Carer outcomes
Eight trials (Cardiff 1995; Glasgow 2000; Hong Kong 1995; Nottingham 1997; Nottingham 1999; Philadelphia 1997; South London 2000; TOTAL 2001) included outcomes for carers. General Health Questionnaire (four trials) (Goldberg 1992); Caregiver Strain Index (two trials); degree of satisfaction with services (one trial); Pearlman's six‐point Quality of Life Scale (one trial) (Pearlman 1991); The Centre for Epidemiologic Studies ‐ Depression Scale (one trial) (Radloff 1977); The Older American Resources and Services Scales ‐ Economic Resources (one trial) (Fillenbaum 1981); The Older American Resources and Services Scales ‐ Social Resources (one trial) (Fillenbaum 1981); The Questionnaire on Resources and Stress (one trial) (Holroyd 200); The Social Functioning Examination (one trial) (STAIR 1995).
(c) Service outcomes
Measures reported include: hospital readmission (two trials); degree of satisfaction with services (one trial); provision of equipment and services (one trial); staff time (one trial).
(10) Outcomes for analysis
The large numbers of heterogeneous outcome measures recorded by included studies made it unrealistic and impractical to analyse all the documented data. Based on the predefined outcomes of interest, and the availability of data from specific outcome measures in the included trials, the data analysis has been concentrated on the following outcomes :‐
(a) Patient outcomes
(i) Death
Defined as the number of patients dead at the end of scheduled follow‐up.
(ii) Data on death or requiring institutional care
Defined as the combined adverse outcome of being dead or in institutional care at the end of scheduled follow‐up.
(iii) Death or dependency
Defined as the combined adverse outcome of being dead or dependent in personal activities of daily living at the end of scheduled follow‐up. Dependence in personal activities of daily living was defined as either lying above or below a predefined cut‐off point on a given ADL scale. Where the Barthel Index (Mahoney 1965) was used, this was used for analysis. Where the Barthel Index was not available, alternative global dependency scales with a predefined cut‐off point were used.
(iv) Death or a poor outcome (deterioration, dependency, institutionalisation)
Defined as the combined 'poor outcome' of being dead or (i) experiencing a deterioration in ability to perform personal activities of daily living (i.e. experiencing a drop in a given ADL score or; (ii) dependent (i.e. lying above or below a pre‐defined cut‐off characterised by a drop in score on a given ADL scale) or (iii) requiring institutional care at the end of scheduled follow‐up. Where deterioration in ability to perform personal ADL activities was available, this was used for analysis, where this was not available, dependence in personal ADL was used. Institutionalisation was used where no other measures were available. Where the trials recorded the Barthel Index (Mahoney 1965), this was used for analysis. Where the Barthel Index was unavailable, alternative global dependency scales were used.
(v) Personal activities of daily living
Where trials recorded The Barthel Index (Mahoney 1965) this was used for analysis, if this was not available then an alternative global dependency scale was used.
(vi) Extended activities of daily living
Where trials recorded the Nottingham Extended Activities of Daily Living Index (Nouri 1987) this was used for analysis, if this was not available then an alternative EADL scale was accepted.
(vii) Quality of Life
Where the trials recorded a subjective health status measure such as the Nottingham Health Profile (Hunt 1981) this was used for analysis, if a subjective health status measure was not available then a quality of life measure was used.
(viii) Mood
Where trials recorded the General Health Questionnaire (Goldberg 1992) this was used for analysis, if this was not available then an alternative measure of mood was accepted.
(b) Carers Outcomes
(i) Quality of Life
Pearlman's six‐point Quality of Life Scale (Pearlman 1991) and The Social Functioning Examination (Holroyd 2002) were used for the analysis.
(ii) Mood
Where the trials reported the General Health Questionnaire (Goldberg 1992), this was used for analysis. Alternative mood scales were accepted if this was unavailable.
(c) Service Outcomes
(i) Readmission to hospital (ii) Length of stay
Risk of bias in included studies
Randomisation and allocation concealment
Of the 14 trials able to provide outcome data, 10 used a clearly concealed randomisation procedure (Cardiff 1995; Copenhagen 2000; Glasgow 2000; Kansas 1998; Nottingham 1995; Nottingham 1996; Nottingham 1997; Nottingham 1999; South London 2000; TOTAL 2001). Three trials used an unclear method of randomisation (London 1981; Philadelphia 1997; Vancouver 1991). Two (Philadelphia 1997; Vancouver 1991) did not fully describe adequate allocation concealment. Full details of the methodological quality of the studies are provided in Table 4 and in the Table of Characteristics of Included Studies.
4. Methodological Quality of Included Studies.
| Study | Randomisation | Intent.toTreat | BlindFinalAssess | Intervention | TimeInterven. | Type&no.staff | Setting | Comments |
| Cardiff | Opaque sealed envelopes | Unclear | Yes ‐ Postal questionnaire | Occupational therapy | Recruitment prior to discharge | Single occupational therapist i.e. one therapist for one patient throughout the intervention period | Patient's home which included residential and nursing homes. | |
| Copenhagen | Random generation of allocation sequence by two independent secretaries who randomly drew lots. Managed from a central source. | Yes | No ‐ inadequate blinding of Barthel Index and Frenchay Activities Index ‐ administered by the project physician, who was not blinded. | Physiotherapy | Recruitment at the end of inpatient rehabilitation, prior to discharge | Single physiotherapist i.e. one therapist for one patient throughout the intervention period | Patient's home | |
| Glasgow | Centralised randomisation by telephone. Sequentially numbered opaque sealed envelopes. | Yes | Yes | Occupational therapy | Recruitment when discharge date set. | Single occupational therapist i.e. one therapist for one patient throughout the intervention period | Patient's home | |
| Hong Kong | Centralised randomisation. Treament allocation concealed. | Unclear | Unclear | Multidisciplinary team (medical, nursing, therapy) with day hospital facilities. | Recruitment if unable to discharge home after one week as inpatient following stroke onset. | Numbers of each unclear | Day hospital | |
| Kansas | Centralised randomisation. Treament allocation concealed. | Unclear | Yes | Physiotherapy | Recruitment at the end of acute rehabilitation programme | Single physiotherapist i.e. one therapist for one patient throughout the intervention period | Patient's home | |
| London | Method of creating randomistion unclear. Mechanism for treatment allocation unclear. | Unclear | Yes | Multidisciplinary | Recruitment at discharge from inpatient facility. | Physiotherapy and occupational therapy, number unclear. | Patient's home | |
| Nottingham 1995 | Random generation of allocation sequence, sequentially numbered opaques sealed envelopes. | Unclear | Yes | Occupational therapy | Recruitment at discharge from inpatient facility. | Single occupational therapist i.e. one therapist for one patient throughout the intervention period | Patient's home | The same therapist provided the treatment to both the treatment groups, creating the possibility of contamination between the groups. |
| Nottingham 1996 | Random generation and allocation concealment using sequentially numbered opque sealed envelopes. | Unclear | Yes | Occupational therapy | Recruitment at discharge from inpatient facility. | Single occupational therapist i.e. one therapist for one patient throughout the intervention period | Patient's home | |
| Nottingham 1997 | Random generation and prepared sealed envelopes. | Yes | Yes | Occupational therapy | Recruitment at discharge from hospital. | Single occupational therapist i.e. one therapist for one patient throughout the intervention period | Patient's home | |
| Nottingham 1999 | Random generation and allocation concealment, sequentially numbered, opaque sealed envelopes. | Unclear | Yes | Occupational therapy | Recruitment from home within one month of stroke onset. | Single occupational therapist i.e. one therapist for one patient throughout the intervention period | Patient's home | |
| TOTAL | Centralised randomisation | Yes | Yes | Occupational therapy | Recruitment at discharge from 4 sites and at a stroke clinic within 6 months of stroke onset at a fifth site. | Multiple occupational therapists. | Patient's home | The same therapists were providing the two different interventions, creating the possibility of contamination. |
| Vancouver | Method of creating randomisation unclear, allocation concealment method unclear. | No | Yes | Occupational therapy | Recruitment after discharge and stroke onset < 15 months. | Single therapist i.e. one therapist for one patient throughout the intervention period | Patient's home | |
| South London | Random generation and prepared sealed envelopes | Yes | Yes | Multidisciplinary | Recruited to study within 2.5 years of stroke onset | Physiotherapy, occupational therapy, speech and language therapy. Coordinated by consultant. | Patient's home | |
| Philadelphia | Random number tables, unclear if open or closed. | Unclear | Yes | Multidisciplinary | Physiatrist, psychologist, recreational therapist, case manager/ social worker. |
Blinding
Twelve trials used an unequivocal blinded final outcome assessment for all patients, one trial (Hong Kong 1995) did not display clear blinding of final outcome assessor and one trial (Copenhagen 2000) did not display adequate blinding on the Barthel Index and The Frenchay Activities Index at final outcome assessment.
Intention‐to‐treat analysis
In total 138 patients (8.5%) were reported to be lost to follow up, with 859 (53.1%) patients enrolled in studies with a stated intention‐to‐treat analysis (South London 2000; TOTAL 2001; Glasgow 2000; Copenhagen 2000; Nottingham 1997). However, the remaining trials may have performed but omitted to report an intention‐to‐treat analysis.
Effects of interventions
Protocol deviations
In our review we considered missing data from included studies as a protocol deviation.
Exploration of possible confounding effects due to differences in inpatient care
There was insufficient information to further explore effect of rehabilitation experience or length of stay on outcomes of interest.
Outcomes
Patient and carer satisfaction with services
Only one study (Glasgow 2000) collected information on patient and carer satisfaction with services. Therefore there was insufficient data to draw definite conclusions.
Outcomes which reflect resource use
Number of days in hospital
Two studies (South London 2000; Nottingham 1999) recruited patients from home. Length of stay ranged from five to over 80 days in the 12 studies recruiting people from hospital (Hong Kong 1995; London 1981; Philadelphia 1997; Copenhagen 2000; Kansas 1998; Cardiff 1995; Glasgow 2000; Nottingham 1995; Nottingham 1996; Nottingham 1997; TOTAL 2001; Vancouver 1991). There was no obvious association between length of stay in the studies recruiting people from hospital and any of the outcomes of interest.
Number of aids and appliances
Data on the number of aids and appliances was collected by two studies (Cardiff 1995, Glasgow 2000) but were available for only one study (Cardiff 1995).
Number of staff required per caseload
Number of staff required per caseload was calculated by one study (Glasgow 2000) therefore there were insufficient data to draw conclusions.
* Denotes primary outcome
Analysis point: Three studies included in this review (London 1981, Nottingham 1995, TOTAL 2001) have two intervention and one control arm. For the purpose of this review the results for the two intervention arms or subgroups within each of the aforementioned studies have been combined. $ denotes during which outcomes the contributing study sub‐groups have been combined.
To keep the review concise we have decided to cut back on sensitivity analyses.
(1) Death (Outcome 01)
(a) Completeness of data
(see Table 5 Completeness of data: Death (Outcome 01)) Contributing studies: All Total participants: 1617 Number of participants missing: 138 Number of contributing participants: 1479
5. Completeness of data: Death (Outcome 01).
| Study | N (Interv.) | Dead (Interv.) | Alive (Interv.) | Missing (interv.) | N (control) | Dead (control) | Alive (control) | Missing (control) |
| Hong Kong | 59 | 6 | 43 | 10 | 61 | 6 | 44 | 11 |
| London | 89 | 10 | 79 | 0 | 44 | 6 | 38 | 0 |
| Philadelphia | 27 | 0 | 21 | 6 | 28 | 0 | 20 | 8 |
| South London | 23 | 5 | 15 | 3 | 20 | 0 | 17 | 3 |
| Copenhagen | 53 | 2 | 51 | 0 | 48 | 0 | 48 | 0 |
| Kansas | 10 | 0 | 10 | 0 | 10 | 0 | 10 | 0 |
| Cardiff | 55 | 9 | 46 | 0 | 55 | 11 | 44 | 0 |
| Glasgow | 67 | 6 | 61 | 0 | 71 | 5 | 66 | 0 |
| Nottingham 1995 | 42 | 0 | 42 | 0 | 23 | 1 | 22 | 0 |
| Nottingham 1996 | 15 | 0 | 15 | 0 | 15 | 0 | 15 | 0 |
| Nottingham 1997 | 53 | 5 | 48 | 0 | 58 | 7 | 51 | 0 |
| Nottingham 1999 | 94 | 6 | 88 | 0 | 91 | 7 | 84 | 0 |
| TOTAL | 309 | 29 | 219 | 61 | 157 | 11 | 112 | 34 |
| Vancouver | 20 | 0 | 20 | 0 | 20 | 0 | 18 | 2 |
(b) Main analysis
Data on death were available for 1479 (91.5%) patients. The overall estimate gives an odds ratio (OR) of 1.10 (95% confidence interval (CI) 0.76 to 1.59; P = 0.6). This result does not provide evidence of either significant benefit or harm. There was no statistically significant heterogeneity between trials (chi‐square = 9.74, df = 9, P = 0.37).
(2) Death or institutional care (Outcome 02)
(a) Completeness of data
(see Table 6 Completeness of data: Death or requiring institutional care (Outcome 02)) Total participants: 1617 Contributing studies: Hong Kong 1995; Philadelphia 1997; Copenhagen 2000; Cardiff 1995; Glasgow 2000; Nottingham 1997 Number of participants from contributing studies: 635 Number of participants missing from contributing studies: 36 Number of participants contributing to analyses: 599 Excluded studies/studies not recording outcome of interest i.e. nursing/residential care placement at end of follow‐up: London 1981; South London 2000; Kansas 1998; Nottingham 1995; Nottingham 1996; Nottingham 1999, TOTAL 2001, Vancouver 1991
6. Completeness of data: Death or requiring institutional care (Outcome 02).
| Study | N(interv.) | Dead/ instit (inter) | Total | Missing | N (control) | Dead/instit (contr) | Total (contr) | Missing(contr) |
| Hong Kong | 59 | 6+13 | 49 | 10 | 61 | 6+14 | 50 | 11 |
| London | 89 | ‐ | ‐ | ‐ | 44 | ‐ | ‐ | ‐ |
| Philadelphia | 27 | 0+2 | 21 | 6 | 28 | 0+2 | 20 | 8 |
| South London | 23 | ‐ | ‐ | ‐ | 20 | ‐ | ‐ | ‐ |
| Copenhagen | 53 | 2+2 | 53 | 0 | 48 | 0+3 | 48 | 0 |
| Kansas | 10 | ‐ | ‐ | ‐ | 10 | ‐ | ‐ | ‐ |
| Cardiff | 55 | 9+16 | 55 | 0 | 55 | 11+18 | 54 | 1 |
| Glasgow | 67 | 6+4 | 67 | 0 | 71 | 5+4 | 71 | 0 |
| Nottingham 1995 | 42 | ‐ | ‐ | ‐ | 23 | ‐ | ‐ | ‐ |
| Nottingham 1996 | 15 | ‐ | ‐ | ‐ | 15 | ‐ | ‐ | ‐ |
| Nottingham 1997 | 53 | 5+1 | 53 | 0 | 58 | 7+7 | 58 | 0 |
| Nottingham 1999 | 94 | ‐ | ‐ | ‐ | 91 | ‐ | ‐ | ‐ |
| TOTAL | 309 | ‐ | ‐ | ‐ | 157 | ‐ | ‐ | ‐ |
| Vancouver | 20 | ‐ | ‐ | ‐ | 20 | ‐ | ‐ | ‐ |
(b) Main analysis
Data on the combined adverse outcome of being dead or requiring institutional care at the end of scheduled follow‐up were available for 599 (37%) patients. The summary OR for being dead or in institutional care; OR 0.81 (95% CI 0.54 to 1.21; P = 0.3) was not statistically significant. Therefore, at the 5% significance level we are unable to detect a difference in the odds of patient dying or requiring long‐term institutional care between those patients receiving therapy‐based rehabilitation services and those patients receiving usual care or no service. There was no statistically significant heterogeneity between trials (chi‐square = 2.94, df = 5, P = 0.71).
(3) Death or dependency (Outcome 03)
(a) Completeness of data
(see Table 7 Completeness of data: Death or dependency (Outcome 03)) Total participants: 1617 Contributing studies: Hong Kong 1995; South London 2000; Kansas 1998; Cardiff 1995; Glasgow 2000; Nottingham 1999; TOTAL 2001 Number of participants from contributing studies: 1082 Number of participants missing from contributing studies: 139 Number of participants contributing to analyses: 943 Excluded studies/studies not recording outcome of interest i.e. dependency at end of follow‐up: London 1981; Philadelphia 1997; Copenhagen 2000; Nottingham 1995; Nottingham 1996; Nottingham 1997; Vancouver 1991
7. Completeness of data: Death or dependency (Outcome 03).
| Study | N (inter) | Dead/ Depend (i) | Total (inter) | Missing (inter) | N (control) | Dead/ Depend (c) | Total (control) | Missing (control) | Outcome measure |
| Hong Kong | 59 | 6+9 | 49 | 10 | 61 | 6+13 | 50 | 11 | Barthel <15 |
| London | 89 | ‐ | ‐ | ‐ | 44 | ‐ | ‐ | ‐ | ‐ |
| Philadelphia | 27 | ‐ | ‐ | ‐ | 28 | ‐ | ‐ | ‐ | ‐ |
| South London | 23 | 5+8 | 20 | 3 | 20 | 0+7 | 17 | 3 | Rankin > 3 |
| Copenhagen | 53 | ‐ | ‐ | ‐ | 48 | ‐ | ‐ | ‐ | ‐ |
| Kansas | 10 | 0 | 10 | 0 | 10 | 0 | 9 | 1 | Barthel < 15 |
| Cardiff | 55 | 9+32 | 55 | 0 | 55 | 11+30 | 54 | 1 | Barthel< 15 |
| Glasgow | 67 | 6+21 | 66 | 1 | 71 | 6+14 | 66 | 5 | Barthel <15 |
| Nottingham 1995 | 42 | ‐ | ‐ | ‐ | 23 | ‐ | ‐ | ‐ | ‐ |
| Nottingham 1996 | 15 | ‐ | ‐ | ‐ | 15 | ‐ | ‐ | ‐ | ‐ |
| Nottingham 1997 | 53 | ‐ | ‐ | ‐ | 58 | ‐ | ‐ | ‐ | |
| Nottingham 1999 | 94 | 6+12 | 90 | 4 | 91 | 7+20 | 86 | 5 | Barthel <15 |
| TOTAL | 309 | 29+77 | 248 | 61 | 157 | 11+45 | 123 | 34 | Barthel <15 |
| Vancouver | 20 | ‐ | ‐ | ‐ | 20 | ‐ | ‐ | ‐ |
(b) Main analysis
Data on the outcome of being dead or dependent in activities at the end of scheduled follow‐up were available for 943 (58.3%) patients from seven trials (Hong Kong 1995; South London 2000; Kansas 1998; Cardiff 1995; Glasgow 2000; Nottingham 1999; TOTAL 2001). The summary result for receiving therapy‐based rehabilitation services at home rather than an alternative was OR 0.93 (95% CI 0.70 to 1.22; P = 0.6). This result shows that there was no statistically significant difference in the combined odds of patients dying or being less dependent between those patients receiving therapy‐based rehabilitation services and those patients receiving usual care or no service. There was no statistically significant heterogeneity between trials (chi‐square = 7.22, df = 5; P = 0.2).
(4) Death or a poor outcome* (Outcome o4)
(a) Completeness of data (deterioration or dependency)
(see Table 8 Completeness of data: Poor outcome (Outcome 04)) Total participants: 1617 Contributing studies: Hong Kong 1995; London 1981; Philadelphia 1997; South London 2000; Copenhagen 2000; Kansas 1998; Cardiff 1995; Glasgow 2000; Nottingham 1995, Nottingham 1997; Nottingham 1999; TOTAL 2001 Data collected but not available: Vancouver (n = 40) Number of participants from contributing studies: 1547 Number of participants missing from contributing studies: 197 Number of participants contributing to analyses: 1350 Excluded studies/studies not recording outcome of interest i.e. combined adverse outcome of death and deterioration or dependency at end of follow‐up: Nottingham 1996.
8. Completeness of data: Poor outcome (Outcome 04).
| Study | N (Interv.) | Dead/ Deterior(i) | Total (interv) | Missing (inter) | N (control) | Dead/ Deterior(i) | Total (control) | Missing (control) | Outcome in use |
| Hong Kong | 59 | 6+2 | 49 | 10 | 61 | 6+6 | 50 | 11 | Barthel (deterioration) |
| London | 89 | 10+6 | 72 | 17 | 44 | 6+8 | 35 | 9 | Northwick Park (deterioration) |
| Philadelphia | 27 | 0+2 | 21 | 6 | 28 | 0+2 | 20 | 8 | Institutionalisation |
| South London | 23 | 5+8 | 20 | 3 | 20 | 0+7 | 17 | 3 | Rankin >3 (dependence) |
| Copenhagen | 53 | 2+6 | 43 | 10 | 48 | 0+10 | 39 | 9 | Barthel (deterioration) |
| Kansas | 10 | 0 | 10 | 0 | 10 | 0 | 9 | 1 | Barthel (deterioration) |
| Cardiff | 55 | 9+24 | 55 | 0 | 55 | 11+21 | 54 | 1 | Barthel (deterioration) |
| Glasgow | 67 | 6+27 | 66 | 1 | 71 | 5+36 | 67 | 4 | Barthel (deterioration) |
| Nottingham 1995 | 42 | 0+2 | 42 | 0 | 23 | 1+2 | 23 | 0 | Institutionalisation |
| Nottingham 1996 | 15 | ‐ | ‐ | ‐ | 15 | ‐ | ‐ | ‐ | ‐ |
| Nottingham 1997 | 53 | 5+1 | 53 | 0 | 58 | 7+7 | 58 | 0 | Institutionalisation |
| Nottingham 1999 | 94 | 6+12 | 90 | 4 | 91 | 7+20 | 86 | 5 | Barthel < 15 (dependence) |
| TOTAL | 309 | 29+77 | 248 | 61 | 157 | 11+45 | 123 | 34 | Barthel < 15 (dependence) |
| Vancouver | 20 | ‐ | ‐ | ‐ | 20 | ‐ | ‐ | ‐ | Barthel |
(b) Main analysis
Data on the combined adverse poor outcome of death and deterioration (where deterioration is represented by a drop in personal activities of daily living (ADL) score) shows that the odds of death or deterioration in ADL were significantly less (p = 0.03) in the group receiving therapy‐based rehabilitation services; OR 0.67 (95% CI 0.46 to 0.97) (chi‐square = 2.34, df = 4, p = 0.67). However, these outcome data were only available for 549 (33.9%) patients from six trials (Hong Kong 1995; London 1981; Copenhagen 2000; Kansas 1998; Cardiff 1995; Glasgow 2000). Re‐analysis including trials that have reported data on death or a poor outcome (deterioration or dependency), which were available for 1350 (83.5%) patients from 12 trials (Hong Kong 1995; London 1981; Philadelphia 1997; South London 2000; Copenhagen 2000; Kansas 1998; Cardiff 1995; Glasgow 2000; Nottingham 1995; Nottingham 1997; Nottingham 1999; TOTAL 2001) produces similar results; OR 0.72 (95% CI 0.57 to 0.92; P = 0.009). There was no statistically significant heterogeneity between trials (chi‐square = 9.73, df = 10; P = 0.46).
(c) Sensitivity analyses
(i) Randomisation procedures and/or allocation concealment
Although no formal statistical testing was done, the odds of a poor outcome seem to be reduced when analysis is restricted to the two trials with unclear randomisation procedures and/or unclear allocation concealment (London 1981; Philadelphia 1997) (n = 148); OR 0.48 (95% CI 0.21 to 1.08; P = 0.08) (chi‐square 0.52, df = 1; P = 0.47). This is in contrast to a more modest estimate of effect observed when the analysis is restricted to the ten trials with clear randomisation procedures and/or clear allocation concealment (Hong Kong 1995; South London 2000; Copenhagen 2000; Kansas 1998; Cardiff 1995; Glasgow 2000; Nottingham 1995; Nottingham 1997; Nottingham 1999; TOTAL 2001) (n = 1202); OR 0.75 (95% CI 0.58 to 0.97; P = 0.01). There was no statistically significant heterogeneity between trials (chi‐square = 8.13, df = 8; P = 0.42).
(ii) Intention to treat analysis
The odds of a poor outcome seem lower when the analysis is restricted to studies with unknown intention to treat analysis (Hong Kong 1995; London 1981; Philadelphia 1997; Kansas 1998; Cardiff 1995; Nottingham 1995; Nottingham 1999) (n = 616); OR 0.62 (95% CI 0.42 to 0.92; P = 0.02) although no formal statistical testing was done. In contrast, the odds of a poor outcome seem higher when the analysis was restricted to trials with a clear intention to treat analysis (South London 2000; Copenhagen 2000; Glasgow 2000; Nottingham 1997; TOTAL 2001) (n = 734); OR 0.80 (95% CI 0.58 to 1.09; P = 0.16) with no statistically significant heterogeneity between trial results (chi‐square = 5.6, df = 4; P = 0.23). No formal statistical testing was performed.
(iii) Blinding
Re‐analysis of the results including the ten studies with adequate blinding (London 1981; Philadelphia 1997; South London 2000; Kansas 1998; Cardiff 1995; Glasgow 2000; Nottingham 1995; Nottingham 1997; Nottingham 1999; TOTAL 2001) (n = 1169) appears to reduce the effect of treatment i.e. the odds of a poor outcome seem to be higher, although no formal statistical testing was done; OR 0.73 (95% CI 0.57 to 0.95; P = 0.02) (chi‐square 9.61, df = 8; P = 0.29). In contrast, the effect of the intervention appeared to increase i.e. the odds of a poor outcome seem lower, when analysis was restricted to the two trials with unclear/inadequate blinding, although no formal statistical testing was performed (Copenhagen 2000; Hong Kong 1995) (n = 181); OR 0.64 (95% CI 0.32 to 1.31; P = 0.2). There was no statistically significant heterogeneity between trials (chi‐square = 0.01 df = 1; P = 0.93).
(iv) Sensitivity to missing data
Further, if we assume that the patients who are missing from the treatment groups (112/881 (12.7%) and control groups (85/666 (12.8%) are alive and well and living at home, then the odds of a poor outcome is still significantly reduced for those patients receiving therapy‐based rehabilitation services; OR 0.77 (95% CI 0.61 to 0.97; P = 0.03) with no statistically significant heterogeneity (chi‐square = 9.93, df = 10; P = 0.45). Alternatively, if we consider patients who are missing from the treatment groups and control groups to be either dead or having a poor outcome (deterioration or dependency), then the odds of a poor outcome is still significantly reduced for those patients receiving therapy‐based rehabilitation services; OR 0.74 (95% CI 0.59 to 0.92; P = 0.006) with no statistically significant heterogeneity (chi‐square = 8.38, df = 10; P = 0.59).
(5) Personal activities of daily living* (Outcome 05)
(a) Completeness of data
(see Table 9 Completeness of data: Personal activities of daily living (Outcome 05)) Total participants: 1617 Contributing studies: Hong Kong 1995; London 1981; Philadelphia 1997; South London 2000; Copenhagen 2000; Kansas 1998;Cardiff 1995; Glasgow 2000; Nottingham 1996; Nottingham 1997; Nottingham 1999; TOTAL 2001 Data collected but not available: Vancouver 1991 (n = 40) Number of participants from contributing studies: 1512 Number of participants missing from contributing studies: 332 Cardiff 1995 Number of participants contributing to analyses: 1180 Excluded studies/studies not recording outcome of interest: Nottingham 1995.
9. Completeness of data: Personal activities of daily living (Outcome 05).
| Study | Treatment N | Treatment n | Treatment missing | Control N | Control n | Control missing | Outcome measure |
| Hong Kong | 59 | 43 | 16 | 61 | 44 | 17 | Barthel |
| London | 89 | 72 | 17 | 44 | 35 | 9 | Northwick Park ADL |
| Philadelphia | 27 | 20 | 7 | 28 | 20 | 8 | FIM |
| South London | 23 | 15 | 8 | 20 | 17 | 3 | Barthel |
| Copenhagen | 53 | 44 | 9 | 48 | 43 | 5 | Barthel |
| Kansas | 10 | 10 | 0 | 10 | 9 | 1 | Barthel |
| Cardiff | 55 | 46 | 9 | 55 | 39 | 16 | Barthel |
| Glasgow | 67 | 60 | 7 | 71 | 62 | 9 | Barthel |
| Nottingham 1995 | 42 | ‐ | ‐ | 23 | ‐ | ‐ | ‐ |
| Nottingham 1996 | 15 | 12 | 3 | 15 | 15 | 0 | Rivermead ADL |
| Nottingham 1997 | 53 | 45 | 8 | 58 | 38 | 20 | Barthel |
| Nottingham 1999 | 94 | 84 | 10 | 91 | 79 | 12 | Barthel |
| TOTAL | 309 | 218 | 91 | 157 | 110 | 47 | Barthel |
| Vancouver | 20 | ‐ | ‐ | 20 | ‐ | ‐ | ‐ |
$Analysis point. London 1981 and TOTAL 2001 sub‐groups have been combined.
(b) Main analysis
Personal activities of daily living scores were available for 1180 (73.0%) patients from 12 trials (Hong Kong 1995; London 1981; Philadelphia 1997; South London 2000; Copenhagen 2000; Kansas 1998; Cardiff 1995; Glasgow 2000; Nottingham 1996; Nottingham 1997; Nottingham 1999;TOTAL 2001). The pooled result for all trials, combined using a standardised mean difference (SMD) with a random effects model was 0.14 (95% CI 0.02 to 0.25; P= 0.02). Therefore, patients who received therapy‐based rehabilitation services after stroke were significantly more independent in personal activities of daily living (ADL) than those patients who received no care or usual care. There was no statistically significant heterogeneity between trials (chi‐square = 10.43, df = 11; P = 0.49).
(c) Sensitivity analyses
(i) Randomisation procedures and/or allocation concealment.
Although no formal statistical testing was performed, the effect of the intervention on ability to perform personal activities of daily living appeared to be very similar when analyses were restricted to trials with clear randomisation and/or allocation concealment (Hong Kong 1995; South London 2000; Copenhagen 2000; Kansas 1998; Cardiff 1995; Glasgow 2000; Nottingham 1996; Nottingham 1997; Nottingham 1999; TOTAL 2001) (n = 1033); SMD 0.15 (95% CI 0.01 to 0.29; P = 0.03) (chi‐square = 10.34, df = 9; P = 0.32) and unclear randomisation and/or unclear allocation concealment (London 1981; Philadelphia 1997) (n = 147); SMD 0.11 (95% CI ‐0.23 to 0.45; P = 0.5). There was no statistically significant heterogeneity between trials (chi‐square = 0.07, df = 1; P = 0.79).
(ii) Blinding
While no formal statistical testing was performed, we observed an increase in the effect of the intervention on ability to perform personal activities of daily living when analysis was restricted to trials with inadequate blinding (Copenhagen 2000; Hong Kong 1995) (n = 174); SMD 0.33 (95% CI 0.03 to 0.63; P = 0.03) (chi‐square 0.01, df = 1; P = 0.91). In contrast, restriction of the analysis to the ten trials with adequate blinding (London 1981; Philadelphia 1997; South London 2000; Kansas 1998; Cardiff 1995; Glasgow 2000; Nottingham 1996; Nottingham 1997; Nottingham 1999; TOTAL 2001) (n = 1006) appeared to result in a reduction in the effect of the intervention on ability to perform personal activities of daily living; SMD 0.10 (95% CI ‐0.03 to 0.23; P = 0.12). There was no statistically significant heterogeneity between trials (chi‐square = 8.48, df = 9; P = 0.49).
(iii) Intention to treat analysis
The effect of the intervention on ability to perform personal activities of daily living appeared to be reduced when analysis was restricted to the five trials with known intention to treat analysis (South London 2000; Copenhagen 2000; Glasgow 2000; Nottingham 1997; TOTAL 2001) (n = 652); SMD 0.06 (95% CI ‐0.14 to 0.26; P = 0.6) (chi‐square = 5.53, df = 4; P = 0.24). However, the effect of the intervention on ability to perform personal activities of daily living appeared to increase when analysis was confined to the seven trials with unclear intention to treat analysis (Hong Kong 1995; London 1981; Philadelphia 1997; Kansas 1998; Cardiff 1995; Nottingham 1996; Nottingham 1999) (n = 528); SMD 0.25 (95% CI 0.08 to 0.42; P = 0.005). There was no statistically significant heterogeneity between trials (chi‐square = 1.89, df = 6; P = 0.93).
(6) Extended activities of daily living (Outcome 06)
(a) Completeness of data
(see Table 10 Completeness of data: Extended activities of daily living (Outcome 06)) Total participants: 1617 Contributing studies: Philadelphia 1997; Copenhagen 2000; Kansas 1998; Cardiff 1995; Glasgow 2000; Nottingham 1995; Nottingham 1997; Nottingham 1999; TOTAL 2001 Number of participants from contributing studies: 1221 Number of participants missing from contributing studies: 225 Number of participants contributing to analyses: 996 Excluded studies/ studies not recording outcome of interest: Hong Kong 1995; London 1981; South London 2000; Nottingham 1996; Vancouver 1991
10. Completeness of data: Extended activities of daily living (Outcome 06).
| Study | Treatment N | Treatment n | Treatment missing | Control N | Control n | Control missing | Outcome measure |
| Hong Kong | 59 | ‐ | ‐ | 61 | ‐ | ‐ | ‐ |
| London | 89 | ‐ | ‐ | 44 | ‐ | ‐ | ‐ |
| Philadelphia | 27 | 21 | 6 | 28 | 21 | 7 | Frenchay Activities Index |
| South London | 23 | ‐ | ‐ | 20 | ‐ | ‐ | ‐ |
| Copenhagen | 53 | 44 | 9 | 48 | 43 | 5 | Frenchay Activities Index |
| Kansas | 10 | 10 | 0 | 10 | 10 | 0 | Lawton Scale of Instrumental ADL |
| Cardiff | 55 | 45 | 10 | 55 | 39 | 16 | Nottingham Extended Activities of Daily Living (NEADL) |
| Glasgow | 67 | 60 | 7 | 71 | 62 | 9 | NEADL |
| Nottingham 1995 | 42 | 41 | 1 | 23 | 23 | 0 | NEADL |
| Nottingham 1996 | 15 | ‐ | ‐ | 15 | ‐ | ‐ | ‐ |
| Nottingham 1997 | 53 | 45 | 8 | 58 | 38 | 20 | NEADL |
| Nottingham 1999 | 94 | 84 | 10 | 91 | 79 | 12 | NEADL |
| TOTAL | 309 | 219 | 90 | 157 | 112 | 45 | NEADL |
| Vancouver | 20 | ‐ | ‐ | 20 | ‐ | ‐ | ‐ |
$ Analysis point. Nottingham 1995 and London 1981 sub‐groups have been combined.
(b) Main analysis
Nine trials (Cardiff 1995; Copenhagen 2000; Glasgow 2000; Kansas 1998; Nottingham 1995; Nottingham 1997; Nottingham 1999; Philadelphia 1997; TOTAL 2001) recorded outcome measures related to extended activities of daily living. Scores were available for 996 (61.6%) patients. Combined as the SMD using a random effects model the result for all trials was 0.17(95% CI 0.04 to 0.30; P = 0.010) indicating that patients who received therapy‐based rehabilitation services following stroke were significantly more independent in extended activities of daily living. No statistically significant heterogeneity between trials was detected (chi‐square = 8.10, df = 8; P = 0.42).
(7) Quality of life (Comparison 07)
(a) Completeness of data
(see Table 11 Completeness of data: Quality of life (Outcome 07)) Total participants: 1617 Contributing studies: South London 2000; Kansas 1998; Glasgow 2000; Nottingham 1995; Nottingham 1996 Data collected but not available: Nottingham 1996 (n = 30) Number of participants from contributing studies: 266 Number of participants missing from contributing studies: 47 Number of participants contributing to analyses: 219 Excluded studies/studies not recording outcome of interest: Hong Kong 1995; London 1981; Nottingham 1997; Nottingham 1999; TOTAL 2001; Vancouver 1991
11. Completeness of data: Quality of life (Outcome 07).
| Study | Treatment N | Treatment n | Treatment missing | Control N | Control n | Control missing | Outcome |
| Hong Kong | 59 | ‐ | ‐ | 61 | ‐ | ‐ | ‐ |
| London | 89 | ‐ | ‐ | 44 | ‐ | ‐ | ‐ |
| Philadelphia | 27 | ‐ | ‐ | 28 | ‐ | ‐ | ‐ |
| South London | 23 | 15 | 8 | 20 | 17 | 3 | Nottingham Health Profile |
| Copenhagen | 53 | ‐ | ‐ | 48 | ‐ | ‐ | ‐ |
| Kansas | 10 | 10 | 0 | 10 | 10 | 0 | Medical Outcomes Study 36 (MOS‐36) . Physical function |
| Cardiff | 55 | ‐ | ‐ | 55 | ‐ | ‐ | ‐ |
| Glasgow | 67 | 54 | 13 | 71 | 54 | 17 | Euroquol |
| Nottingham 1995 | 42 | 40 | 2 | 23 | 19 | 4 | Nottingham Health Profile |
| Nottingham 1996 | 15 | not available | not available | 15 | not available | not available | Nottingham Health Profile |
| Nottingham 1997 | 53 | ‐ | ‐ | 58 | ‐ | ‐ | ‐ |
| Nottingham 1999 | 94 | ‐ | ‐ | 91 | ‐ | ‐ | ‐ |
| TOTAL | 309 | ‐ | ‐ | 157 | ‐ | ‐ | ‐ |
| Vancouver | 20 | ‐ | ‐ | 20 | ‐ | ‐ | ‐ |
$ Analysis point. Nottingham 1995 sub‐groups have been combined.
(b) Main analysis
Five trials (Glasgow 2000; Kansas 1998; Nottingham 1995; Nottingham 1996; South London 2000) recorded outcome measures related to quality of life. Outcome measures reported include the Nottingham Health Profile (Nottingham 1995; Nottingham 1996; South London 2000) and the MOS‐36 (Kansas 1998). One trial (Glasgow 2000) used a quality of life measure (Euroquol 1990). No Nottingham Health Profile data were available for Nottingham 1996. The quality of life scores were available for 219 (13.5%) patients and were combined as the SMD using the random effects model. The pooled result for all trials was SMD 0.20 (95% CI ‐0.07 to 0.47; P = 0.14). The trend is towards improved quality of life in those patients receiving therapy‐based rehabilitation services; however there are insufficient numbers of trials to draw firm conclusions. There was no statistically significant heterogeneity between trials (chi‐square = 0.74, df = 3; P = 0.86).
$ Analysis point. Results from the trials using the Nottingham Health Profile have been inverted to reflect the direction of scoring (i.e. the higher the score the greater the health problem).
(8) Mood/distress (Outcome 08)
(a) Completeness of data
(see Table 12 Completeness of data: Mood (Outcome 08)) Total participants: 1617 Contributing studies: Philadelphia 1997; South London 2000; Cardiff 1995; Nottingham 1997; Nottingham 1999; TOTAL 2001; Vancouver 1991 Data collected but not available: Hong Kong 1995 (n = 120); Nottingham 1995 (n = 65) Number of participants from contributing studies: 1010 Number of participants missing from contributing studies: 270 Number of participants contributing to analyses: 740 Excluded studies/studies not recording outcome of interest: London 1981; Copenhagen 2000; Kansas 1998; Glasgow 2000; Nottingham 1996
12. Completeness of data: Mood (Outcome 08).
| Study | Treatment N | Treatment n | Treatment missing | Control N | Control n | Control missing | Outcomes |
| Hong Kong | 59 | ‐ | ‐ | 61 | ‐ | ‐ | ‐ |
| London | 89 | ‐ | ‐ | 44 | ‐ | ‐ | ‐ |
| Philadelphia | 27 | 19 | 8 | 28 | 19 | 9 | The Centre for Epidemiologic Studies Depression Scale |
| South London | 23 | 14 | 9 | 20 | 17 | 3 | Hospital Anxiety and Depression Scale |
| Copenhagen | 53 | ‐ | ‐ | 48 | ‐ | ‐ | ‐ |
| Kansas | 10 | ‐ | ‐ | 10 | ‐ | ‐ | ‐ |
| Cardiff | 55 | 41 | 14 | 55 | 31 | 24 | Geriatric Depression Scale |
| Glasgow | 67 | ‐ | ‐ | 71 | ‐ | ‐ | ‐ |
| Nottingham 1995 | 42 | ‐ | ‐ | 23 | ‐ | ‐ | ‐ |
| Nottingham 1996 | 15 | ‐ | ‐ | 15 | ‐ | ‐ | ‐ |
| Nottingham 1997 | 53 | 39 | 14 | 58 | 34 | 24 | General Health Questionnaire |
| Nottingham 1999 | 94 | 83 | 11 | 91 | 77 | 14 | General Health Questionnaire |
| TOTAL | 309 | 219 | 90 | 157 | 112 | 45 | General Health Questionnaire |
| Vancouver | 20 | 18 | 2 | 20 | 17 | 3 | Zung Depression Scale |
$ Analysis point. TOTAL 2001 sub‐groups have been combined.
(b) Main analysis
The mood/distress scores were available for 740 (45.8%) patients from seven studies (Cardiff 1995; Nottingham 1997; Nottingham 1999; Philadelphia 1997; South London 2000; TOTAL 2001; Vancouver 1991). Outcome measures reported included the General Health Questionnaire (Nottingham 1997, GHQ ‐ 28 item; Nottingham 1999, GHQ 28 ‐ item; TOTAL 2001 ‐ GHQ 12 ‐ item), the Hospital Anxiety and Depression Scale (South London 2000), The Center for Epidemiologic Studies ‐ Depression Scale (Philadelphia 1997), Geriatric Depression Scale (Cardiff 1995), and the Zung Depression Scale (Vancouver 1991). Data from one trial (Nottingham 1995) has been excluded as the data was presented as proportions and could not be converted to means and standard deviations and therefore combined. The result for all trials was 0.11 (95% CI ‐ 0.04 to 0.26; P = 0.15). However, the numbers are very small and therefore it is difficult to draw definite conclusions. No significant heterogeneity between trials (chi‐square = 5.14, df = 6; P = 0.53).
$ Analysis point. General Health Questionnaire mean scores have been inverted to account for the direction of scoring (i.e. high scores equal worse emotional health).
Carers
(1) Quality of life (Outcome 09)
(a) Completeness of data
(See Table 13 Completeness of data: carers quality of life (Outcome 9)) Total participants: 1617 Contributing studies: Philadelphia 1997; Cardiff 1995 Number of participants from contributing studies: 165 Number of participants missing from contributing studies: 70 Number of participants contributing to analysis: 95 Excluded studies/studies not recording outcome of interest: Hong Kong 1995; London 1981; South London 2000; Copenhagen 2000; Kansas 1998; Glasgow 2000; Nottingham 1995; Nottingham 1996; Nottingham 1997; Nottingham 1999; TOTAL 2001; Vancouver 1991
13. Completeness of data: Carers quality of life (Outcome 09).
| Study | Treatment N | Treatment n | Treatment missing | Control N | Control n | Control missing | Outcome |
| Hong Kong | 59 | ‐ | ‐ | 61 | ‐ | ‐ | ‐ |
| London | 89 | ‐ | ‐ | 44 | ‐ | ‐ | ‐ |
| Philadelphia | 27 | 21 | 6 | 28 | 20 | 8 | The Questionnaire on Resources and Stress |
| South London | 23 | ‐ | ‐ | 20 | ‐ | ‐ | ‐ |
| Copenhagen | 53 | ‐ | ‐ | 48 | ‐ | ‐ | ‐ |
| Kansas | 10 | ‐ | ‐ | 10 | ‐ | ‐ | ‐ |
| Cardiff | 55 | 30 | 25 | 55 | 24 | 31 | Pearlman's six‐point Quality of Life Scale |
| Glasgow | 67 | ‐ | ‐ | 71 | ‐ | ‐ | ‐ |
| Nottingham 1995 | 42 | ‐ | ‐ | 23 | ‐ | ‐ | ‐ |
| Nottingham 1996 | 15 | ‐ | ‐ | 15 | ‐ | ‐ | ‐ |
| Nottingham 1997 | 53 | ‐ | ‐ | 58 | ‐ | ‐ | ‐ |
| Nottingham 1999 | 94 | ‐ | ‐ | 91 | ‐ | ‐ | ‐ |
| TOTAL | 309 | ‐ | ‐ | 157 | ‐ | ‐ | ‐ |
| Vancouver | 20 | ‐ | ‐ | 20 | ‐ | ‐ | ‐ |
(b) Main analysis
Quality of life scores were available for 95 carers (5.9% of all patients) from two trials (Cardiff 1995; Philadelphia 1997). There is not enough evidence to identify if carers of patients who receive therapy‐based rehabilitation services following stroke experienced improved quality of life.
(2) Mood/distress (Outcome 10)
(a) Completeness of data
(see Table 14 Completeness of data: Carers mood (Outcome 10)) Total participants: 1617 Contributing studies: Philadelphia 1997; South London 2000; Glasgow 2000; Nottingham 1997; Nottingham 1999, TOTAL 2001 Number of participants from contributing studies: 998 Number of participants missing from contributing studies: 351 Number of participants contributing to analyses: 647 Excluded studies/studies not recording outcome of interest: Cardiff 1995; Hong Kong 1995; London 1981; Copenhagen 2000; Kansas 1998; Nottingham 1995; Nottingham 1996; Vancouver 1991
14. Completeness of data: Carers mood (Outcome 10).
| Study | Treatment N | Treatment n | Treatment missing | Control N | Control n | Control missing | Outcomes |
| Hong Kong | 59 | ‐ | ‐ | 61 | ‐ | ‐ | ‐ |
| London | 89 | ‐ | ‐ | 44 | ‐ | ‐ | ‐ |
| Philadelphia | 27 | 19 | 8 | 28 | 19 | 9 | The Centre for Epidemiological Studies ‐ Depression Scale |
| South London | 23 | 10 | 13 | 20 | 9 | 11 | Carer Strain Index |
| Copenhagen | 53 | ‐ | ‐ | 48 | ‐ | ‐ | ‐ |
| Kansas | 10 | ‐ | ‐ | 10 | ‐ | ‐ | ‐ |
| Cardiff | 55 | ‐ | ‐ | 55 | ‐ | ‐ | ‐ |
| Glasgow | 67 | 49 | 18 | 71 | 58 | 13 | General Health Questionnaire |
| Nottingham 1995 | 42 | ‐ | ‐ | 23 | ‐ | ‐ | ‐ |
| Nottingham 1996 | 15 | ‐ | ‐ | 15 | ‐ | ‐ | ‐ |
| Nottingham 1997 | 53 | 29 | 24 | 58 | 26 | 32 | General Health Questionnaire |
| Nottingham 1999 | 94 | 58 | 36 | 91 | 39 | 52 | General Health Questionnaire |
| TOTAL | 309 | 219 | 90 | 157 | 112 | 45 | General Health Questionnaire |
| Vancouver | 20 | ‐ | ‐ | 20 | ‐ | ‐ | ‐ |
(b) Main analysis
Six trials recorded outcomes related to mood or distress (Glasgow 2000; Nottingham 1997; Nottingham 1999; Philadelphia 1997; South London 2000; TOTAL 2001) (n = 647). The General Health Questionnaire was used by four trials (Glasgow 2000; Nottingham 1997; Nottingham 1999; TOTAL 2001); The Caregiver Strain Index was used by one trial (South London 2000) and The Centre for Epidemiologic Studies Depression Scale was use by one trial (Philadelphia 1997). Mood/distress scores were available for carers (40.0% of all patients). The combined result for all trials using the SMD random effects model was 0.18 (95% CI ‐0.11 to 0.46; P = 0.2). Although the results are not statistically significant, there is a trend towards improved mood in carers of patients who receive therapy‐based rehabilitation services following stroke. However, there was statistically significant heterogeneity between trials (chi‐square =12.11, df = 5; P=0.033). This may be due to the combination of different outcome measures used in the analysis.
Service outcomes
(1) Readmission to hospital (Outcome 11)
(a) Completeness of data
(see Table 15 Completeness of data: Readmission (Outcome 11)) Total participants: 1617 Studies collecting readmission data: Hong Kong 1995; Philadelphia 1997; Copenhagen 2000; Cardiff 1995; Glasgow 2000 Data collected but not in suitable format for inclusion: Hong Kong 1995 Contributing studies: Philadelphia 1997; Copenhagen 2000; Cardiff 1995; Glasgow 2000. Number of participants from contributing studies: 404 Number of participants missing from contributing studies: 15 Number of participants contributing to analyses: 389 Excluded studies/studies not recording outcome of interest: London 1981; South London 2000; Kansas 1998; Nottingham 1995; Nottingham 1996; Nottingham 1997; Nottingham 1999; TOTAL 2001; Vancouver 1991
15. Completeness of data: Readmission (Outcome 11).
| Study | N(inter.) | Readmitt (inter.) | Total (interv.) | Missing (Interv.) | N (control) | Readmitt (contr.) | Total (contr.) | Missing (contr.) |
| Hong Kong | 59 | ‐ | ‐ | ‐ | 61 | ‐ | ‐ | ‐ |
| London | 89 | ‐ | ‐ | ‐ | 44 | ‐ | ‐ | ‐ |
| Philadelphia | 27 | 9 | 21 | 6 | 28 | 7 | 20 | 8 |
| South London | 23 | ‐ | ‐ | ‐ | 20 | ‐ | ‐ | ‐ |
| Copenhagen | 53 | 18 | 53 | 0 | 48 | 21 | 48 | 0 |
| Kansas | 10 | ‐ | ‐ | ‐ | 10 | ‐ | ‐ | ‐ |
| Cardiff | 55 | 4 | 55 | 0 | 55 | 11 | 54 | 1 |
| Glasgow | 67 | 23 | 67 | 0 | 71 | 22 | 71 | 0 |
| Nottingham 1995 | 42 | ‐ | ‐ | ‐ | 23 | ‐ | ‐ | ‐ |
| Nottingham 1996 | 15 | ‐ | ‐ | ‐ | 15 | ‐ | ‐ | ‐ |
| Nottingham 1997 | 53 | ‐ | ‐ | ‐ | 58 | ‐ | ‐ | ‐ |
| Nottingham 1999 | 94 | ‐ | ‐ | ‐ | 91 | ‐ | ‐ | ‐ |
| TOTAL | 309 | ‐ | ‐ | ‐ | 157 | ‐ | ‐ | ‐ |
| Vancouver | 20 | ‐ | ‐ | ‐ | 20 | ‐ | ‐ | ‐ |
(b) Main analysis
Five trials (Cardiff 1995; Hong Kong 1995; Copenhagen 2000; Glasgow 2000; Philadelphia 1997) collected data on readmission to hospital before the end of scheduled follow‐up, range 6 months to 1 year. The number of patients readmitted to hospital at the end of scheduled follow‐up was available for 404 (25.0%) patients. Data from one trial (Hong Kong 1995) was excluded as it was presented as the number of admissions not number of people admitted. The overall estimate OR of 0.81 (95% CI 0.52 to 1.26; P = 0.4). Therapy‐based rehabilitation services provided to patients living at home after stroke neither prevents nor results in readmission to hospital. However, the numbers are small and therefore it is difficult to draw definite conclusions. There was no statistically significant heterogeneity between trials (chi‐square = 4.49, df = 3; P = 0.21).
Discussion
Intervention issues
This systematic review assessed the effectiveness of therapy‐based rehabilitation services for stroke patients living at home. Our primary aims were to estimate the extent to which therapy‐based rehabilitation services provided to individuals living at home following stroke (1) influenced the risk of deterioration in ability to perform activities of daily living, and (2) improved patients' ability to perform personal activities of daily living. The available evidence suggests that therapy‐based rehabilitation services can reduce the likelihood of such deterioration and improve patients' ability to perform personal activities of daily living.
In this review, we stated in advance criteria for trial inclusion and the outcomes thought to reflect the range of limited activity and participation closely linked with stroke. However, the primary outcomes selected for this review, deterioration in ability to perform activities of daily living and performance in activities of daily living, was not in all cases identified or reported as the primary outcome in each of the trials. Therapy‐based rehabilitation services consist of various activities and intervention characteristics aimed at improving a range of events or abilities; therefore, different trialists use different outcome measures to reflect this.
We are satisfied that the risk of publication bias is low. Our literature search was comprehensive and extensive, and we contacted original trialists and other researchers working in the field of stroke rehabilitation research. There was no statistical or graphical evidence to suggest publication bias.
There was substantial clinical heterogeneity between the trials in the interventions tested, duration of follow‐up, the selection criteria for patients and stroke severity at baseline. There were also methodological differences in the mechanism of randomisation and allocation, blinding of final outcomes and follow‐up. To examine the robustness of results, we specified in advance methodological variables which we believed could influence the size of effect observed. However, it was decided that the pre‐planned sensitivity analyses based on clinical differences were not performed for the sake of simplicity.
The three types of therapy‐based rehabilitation service for stroke patients living at home included physiotherapy, occupational therapy or multidisciplinary team input. This clinical heterogeneity raises the question of trial compatibility. However, work by the Outpatient Service Trialists (OST 1999) suggests that this combination is justifiable because the therapy professions (occupational therapy, physiotherapy and multidisciplinary team) share a broad common aim, which is to reduce physical disability by altering task‐orientated behaviour.
Methodological issues
When we considered the effect of methodological quality on the odds of a poor outcome we found that there was a more modest estimate of effect when trials with unclear randomisation procedures, unclear blinding and unclear intention to treat analysis were removed from the analysis, although no formal statistical testing was performed. Best and worse case analyses indicated that treatment benefit was maintained with no statistical heterogeneity.
When we examined the effect of methodological differences across the trials on patients' ability to perform personal activities of daily living again we found that benefits were more modest when trials with unclear randomisation and allocation procedures, unclear blinding and unclear intention to treat analysis were removed, however, no formal statistical testing was carried out.
While the methodological quality of the included trials was generally good, trials of rehabilitation interventions are subject to several potential methodological limitations. These limitations include inability to blind the therapist and patient, contamination (provision of the intervention to the control group) and co intervention (when the same therapist unintentionally provides additional care to either treatment or comparison group). All introduce the possibility of performance bias. The very nature of home‐based rehabilitation makes contamination highly unlikely, as the therapists would not normally come in to contact with the control group. However, empirical evidence currently indicates that only adequate randomisation, allocation concealment and blinding of outcome assessor will influence effect size (Mulrow 1997). As discussed earlier, this is demonstrated in the sensitivity analyses by methodological quality.
Potential benefit
The results enable us to explore the apparent effectiveness of therapy‐based rehabilitation services for stroke patients living at home on certain outcomes.
We have observed an odds ratio of 0.72 from this we can calculate a number needed to treat (NNT) for any specific event rate. The overall event rate for controls in the review was 37.5%, which gives a NNT of 14 (95% CI 9 to 52). For an event rate of 20%, the NNT would be 22 and for an event rate of 60% the NNT would be 13.
Furthermore, if we are interested in estimating the effect of therapy‐based rehabilitation services on for example Barthel scores, then using the standardised mean difference and typical distribution of disability scores in this population we would estimate the effect to be a one (5%) point difference on a Barthel Index scale in favour of the group receiving therapy‐based services. While a one point difference in the Barthel Index score would appear to be a relatively small benefit, it is worth noting that the patients who participated in these trials were at randomisation already performing at a level which has allowed them to return to or remain in the community. Also, the Barthel Index has a ceiling effect, which means that once a patient has reached 20 (maximum score) on the Barthel Index (20 point scale) there is no mechanism for highlighting and recording further improvement.
This review illustrates the potential impact of therapy‐based services for stroke patients at home after stroke. However, the exact nature and content of therapy‐based rehabilitation services is unclear; the most effective way to structure the provision of these services is not known; and the economic benefits of providing such services still to be determined. What is clear is that the debate should move from whether such services are effective to what is the scale of their cost and impact.
Authors' conclusions
Implications for practice.
Therapy‐based rehabilitation services for patients living at home after stroke reduces the odds of a poor outcome i.e. death or deterioration in ability to perform activities of daily living, and has a beneficial effect on a patient's ability to perform personal activities of daily living and extended activities of daily living. Approximately 13 patients need to be treated to prevent one avoidable deterioration.
Implications for research.
This analysis was based on a review of heterogeneous interventions. Further research is needed to define the most effective interventions, their economic benefit and the most appropriate level of service delivery.
What's new
| Date | Event | Description |
|---|---|---|
| 7 October 2008 | Amended | Converted to new review format. |
Acknowledgements
The Outpatient Service Trialists' group consists of: Hanne Elkjaer Andersen (Copenhagen); Susan Corr (Cardiff); Avril Drummond (Nottingham); Pam Duncan (Kansas); Arthur Gershkoff (Philadelphia); Louise Gilbertson (Glasgow); John Gladman (TOTAL); Elsie Hui (Hong Kong); Lyn Jongbloed (Vancouver); Peter Langhorne; Lynn Legg; Jo Leonardi‐Bee (Medical statistician) for assistance with original trial data; Pip Logan (Nottingham 1997); Tom Meade (London); Reiki de Veit (for searching the Cochrane Rehabilitation and Related Therapies Field database of trials); Joni Stoker‐Yates (Kansas); Kate Tilling (South London); Marion Walker (Nottingham 1996, 1999); Charles Wolfe (South London).
We would like to thank Hazel Fraser, Review Group Co‐ordinator, Cochrane Stroke Group for supplying lists of trials identified by the Cochrane Stroke Group's search strategy, and Brenda Thomas, Cochrane Stroke Group Trials Search Co‐ordinator, for help in writing the search strategy.
Appendices
Appendix 1. MEDLINE/CCTR search strategy
MEDLINE (Ovid) 1966 to November 2001; Cochrane Controlled Trials Register (The Cochrane Library Issue 4, 2001)
1 exp cerebrovascular disorders/ 2 stroke$.tw. 3 cva$.tw. 4 cerebrovascular$.tw. 5 cerebral vascular$.tw. 6 (cerebral or cerebellar or brain$ or vertebrobasilar).tw. 7 (infarct$ or isch?emi$ or thrombo$ or emboli$ or apoplexy).tw. 8 6 and 7 9 (cerebral or brain$ or subarachnoid).tw. 10 (haemorrhage or hemorrhage or haematoma or hematoma or bleeding).tw. 11 9 and 10 12 hemiplegia/ 13 exp aphasia/ 14 hemianopsia/ 15 (aphasia$ or dysphasi$ or hemianop$ or hemipleg$ or hemipar$ or poststroke).tw. 16 1 or 2 or 3 or 4 or 5 or 8 or 11 or 12 or 13 or 14 or 15 17 exp cerebrovascular disorders/rh 18 hemiplegia/rh 19 exp aphasia/rh 20 hemianopsia/rh 21 17 or 18 or 19 or 20 22 exp rehabilitation/ 23 patient education/ 24 health education 25 exp diet therapy/ 26 exp nutrition/ 27 exp nutritional support/ 28 therapy, computer assisted/ 29 rehabilitat$.tw. 30 ((occupational or speech or language or exercise) and therap$).tw. 31 physiotherap$.tw. 32 tertiary prevention.tw. 33 ((treatment or therap$ or training or education$ or healthcare) adj10 (program$ or intervention$ or approach$)).tw. 34 ((diet or nutrition) and (therap$ or modif$ or program$)).tw. 35 22 or 23 or 24 or 25 or 26 or 27 or 28 or 29 or 30 or 31 or 32 or 33 or 34 36 16 and 35 37 21 or 36 38 community health services/ 39 social work/ 40 community hospital/ 41 ambulatory care/ 42 outpatient clinics, hospital/ 43 ambulatory care facilities/ 44 day care/ 45 patient care/ 46 continuity of patient care/ 47 patient care team/ 48 patient transfer/ 49 primary health care/ 50 comprehensive health care/ 51 rehabilitation centers/ 52 sheltered workshops/ 53 fitness centers/ 54 community health centers/ 55 rehabilitation, vocational/ 56 outpatients/ 57 exp home care services/ 58 community health services/ 59 social support/ 60 health services for the aged/ 61 community.tw. 62 domiciliary.tw. 63 (home or home‐care or home‐based).tw. 64 early supported discharge.tw. 65 outpatient$.tw. 66 day?patient$.tw. 67 outreach.tw. 68 multidisciplinary team.tw. 69 patient care team.tw. 70 stroke unit$.tw. 71 day hospital$.tw. 72 38 or 39 or 40 or 41 or 42 or 43 or 44 or 45 or 46 or 47 or 48 or 49 or 50 or 51 or 52 or 53 or 54 or 55 or 56 or 57 or 58 or 59 or 60 or 61 or 62 or 63 or 64 or 65 or 66 or 67 or 68 or 69 or 70 or 71 73 37 and 72
Appendix 2. EMBASE search strategy
Embase (Ovid) 1980 to November 2001
1 exp cerebrovascular disease/ 2 (stroke$ or cva$ or poststroke).tw. 3 (cerebrovasc$ or cerebral vascular).tw. 4 (cerebral or cerebell$ or brain$ or vertebrobasilar).tw. 5 (infarct$ or isch?emi$ or thrombo$ or emboli$ or apoplexy).tw. 6 4 and 5 7 (cerebral or intracerebral or intracranial or parenchymal or brain or intraventricular or brainstem or cerebellar or infratentorial or supratentorial or subarachnoid).tw. 8 (haemorrhage or hemorrhage or haematoma or hematoma or bleed$ or aneurysm$).tw. 9 7 and 8 10 hemiplegia/ or exp aphasia/ or dysphasia/ or hemianopia/ or hemiparesis/ 11 (hemiplegi$ or aphasi$ or dysphasi$ or hemianop$ or hemipar$).tw. 12 1 or 2 or 3 or 6 or 9 or 10 or 11 13 exp cerebrovascular disease/rh 14 hemiplegia/rh or exp aphasia/rh or dysphasia/rh or hemianopia/rh or hemiparesis/rh 15 13 or 14 16 exp rehabilitation/ 17 exp physical medicine/ 18 rehabilitation medicine/ 19 exp exercise/ 20 physiotherapist/ or occupational therapist/ 21 computer assisted therapy/ 22 exp health education/ 23 exp nutrition/ 24 (rehabilitat$ or physiotherap$).tw. 25 ((occupational or speech or language or exercise) adj10 therap$).tw. 26 tertiary prevention.tw. 27 ((treatment or therap$ or training or education$ or healthcare) adj10 (program$ or intervention$ or approach$)).tw. 28 ((diet or nutrition$) adj10 (therap$ or modif$ or program$)).tw. 29 16 or 17 or 18 or 19 or 20 or 21 or 22 or 23 or 24 or 25 or 26 or 27 or 28 30 12 and 29 31 15 or 30 32 home care/ or home/ 33 day hospital/ or day care/ or aftercare/ 34 rehabilitation center/ or health center/ 35 vocational rehabilitation/ 36 community care/ or community/ or community hospital/ or community medicine/ 37 social work/ or social worker/ or social support/ 38 outpatient/ or outpatient care/ or outpatient department/ 39 patient care/ or patient transport/ 40 exp primary health care/ or elderly care/ or ambulatory care/ 41 sheltered workshop/ 42 32 or 33 or 34 or 35 or 36 or 37 or 38 or 39 or 40 or 41 43 (community or domiciliary or home or home‐based or home‐care).tw. 44 (outpatient$ or day?patient$ or outreach).tw. 45 early supported discharge.tw. 46 ((patient care or multidisciplinary) adj5 team$).tw. 47 (stroke unit$ or day hospital$).tw. 48 43 or 44 or 45 or 46 or 47 49 42 or 48 50 31 and 49
Appendix 3. Journals handsearched
American Journal of Occupational Therapy (1947 to November 2001)
Australian Journal of Occupational Therapy (1965 to November 2001)
British Journal of Occupational Therapy (1950 to November 2001)
British Journal of Therapy and Rehabilitation (1994 to November 2001)
Canadian Journal of Occupational Therapy (1970 to November 2001)
Clinical Rehabilitation (1987 to November 2001)
Disability and Rehabilitation (1992 to November 2001) formerly International Journal of Rehabilitation Medicine (1979 to 1986)
Journal of Rehabilitation (1993 to November 2001)
International Journal of Rehabilitation Research (1977 to November 2001)
Journal of Rehabilitation Science (1989 to 1997)
Neuropsychological Rehabilitation (1987 to 2001)
Neurorehabilitation (1991 to November 2001)
Occupational Therapy International (1994 to November 2001)
Physiotherapy Theory and Practice 1990 to November 2001) formerly Physiotherapy Practice (1985 to 1989)
Physical Therapy (1988 to November 2001)
Rehabilitation Psychology (1982 to November 2001)
The Journal of Cognitive Rehabilitation (1988 to November 2001) formerly Cognitive Rehabilitation (1983 to 1987)
Data and analyses
Comparison 1. Therapy‐based rehabilitation versus no routine input.
| Outcome or subgroup title | No. of studies | No. of participants | Statistical method | Effect size |
|---|---|---|---|---|
| 1 Death by end of scheduled follow up | 14 | 1479 | Peto Odds Ratio (Peto, Fixed, 95% CI) | 1.10 [0.76, 1.59] |
| 1.1 Mixed service | 4 | 310 | Peto Odds Ratio (Peto, Fixed, 95% CI) | 1.27 [0.60, 2.68] |
| 1.2 Physiotherapy | 2 | 121 | Peto Odds Ratio (Peto, Fixed, 95% CI) | 6.85 [0.42, 111.51] |
| 1.3 Occupational therapy | 8 | 1048 | Peto Odds Ratio (Peto, Fixed, 95% CI) | 1.00 [0.65, 1.54] |
| 2 Death or requiring institutional care by the end of scheduled follow‐up | 6 | 599 | Peto Odds Ratio (Peto, Fixed, 95% CI) | 0.81 [0.54, 1.21] |
| 2.1 Mixed service | 2 | 140 | Peto Odds Ratio (Peto, Fixed, 95% CI) | 0.95 [0.45, 2.00] |
| 2.2 Physiotherapy | 1 | 101 | Peto Odds Ratio (Peto, Fixed, 95% CI) | 1.22 [0.26, 5.64] |
| 2.3 Occupational therapy | 3 | 358 | Peto Odds Ratio (Peto, Fixed, 95% CI) | 0.72 [0.43, 1.19] |
| 3 Death or dependency by end of scheduled follow‐up | 7 | 943 | Peto Odds Ratio (Peto, Fixed, 95% CI) | 0.93 [0.70, 1.22] |
| 3.1 Mixed service | 2 | 136 | Peto Odds Ratio (Peto, Fixed, 95% CI) | 1.05 [0.52, 2.09] |
| 3.2 Physiotherapy | 1 | 19 | Peto Odds Ratio (Peto, Fixed, 95% CI) | 0.0 [0.0, 0.0] |
| 3.3 Occupational therapy | 4 | 788 | Peto Odds Ratio (Peto, Fixed, 95% CI) | 0.90 [0.67, 1.23] |
| 4 Death or poor outcome (deterioration or dependency) | 12 | 1350 | Peto Odds Ratio (Peto, Fixed, 95% CI) | 0.72 [0.57, 0.92] |
| 4.1 Mixed service | 4 | 284 | Peto Odds Ratio (Peto, Fixed, 95% CI) | 0.72 [0.41, 1.27] |
| 4.2 Physiotherapy | 2 | 101 | Peto Odds Ratio (Peto, Fixed, 95% CI) | 0.67 [0.24, 1.89] |
| 4.3 Occupational therapy | 6 | 965 | Peto Odds Ratio (Peto, Fixed, 95% CI) | 0.73 [0.55, 0.96] |
| 5 Activities of daily living score | 12 | 1180 | Std. Mean Difference (IV, Random, 95% CI) | 0.14 [0.02, 0.25] |
| 5.1 Mixed service | 4 | 266 | Std. Mean Difference (IV, Random, 95% CI) | 0.11 [‐0.15, 0.37] |
| 5.2 Physiotherapy | 2 | 106 | Std. Mean Difference (IV, Random, 95% CI) | 0.29 [‐0.10, 0.67] |
| 5.3 Occupational therapy | 6 | 808 | Std. Mean Difference (IV, Random, 95% CI) | 0.14 [‐0.02, 0.30] |
| 6 Extended activities of daily living scores | 9 | 996 | Std. Mean Difference (IV, Random, 95% CI) | 0.17 [0.04, 0.30] |
| 6.1 Mixed service | 1 | 42 | Std. Mean Difference (IV, Random, 95% CI) | ‐0.01 [‐0.62, 0.59] |
| 6.2 Physiotherapy | 2 | 107 | Std. Mean Difference (IV, Random, 95% CI) | 0.10 [‐0.28, 0.48] |
| 6.3 Occupational therapy | 6 | 847 | Std. Mean Difference (IV, Random, 95% CI) | 0.21 [0.03, 0.39] |
| 7 Quality of life scores | 4 | 219 | Std. Mean Difference (IV, Random, 95% CI) | 0.20 [‐0.07, 0.47] |
| 7.1 Mixed service | 1 | 32 | Std. Mean Difference (IV, Random, 95% CI) | 0.47 [‐0.23, 1.18] |
| 7.2 Physiotherapy | 1 | 20 | Std. Mean Difference (IV, Random, 95% CI) | 0.04 [‐0.83, 0.92] |
| 7.3 Occupational therapy | 2 | 167 | Std. Mean Difference (IV, Random, 95% CI) | 0.17 [‐0.14, 0.48] |
| 8 Mood/ distress scores | 7 | 740 | Std. Mean Difference (IV, Random, 95% CI) | 0.11 [‐0.04, 0.26] |
| 8.1 Mixed service | 2 | 69 | Std. Mean Difference (IV, Random, 95% CI) | 0.33 [‐0.14, 0.81] |
| 8.2 Physiotherapy | 0 | 0 | Std. Mean Difference (IV, Random, 95% CI) | 0.0 [0.0, 0.0] |
| 8.3 Occupational therapy | 5 | 671 | Std. Mean Difference (IV, Random, 95% CI) | 0.08 [‐0.07, 0.24] |
| 9 Carers: Quality of Life | 2 | 95 | Std. Mean Difference (IV, Random, 95% CI) | ‐0.03 [‐0.44, 0.37] |
| 9.1 Mixed service | 1 | 41 | Std. Mean Difference (IV, Random, 95% CI) | ‐0.24 [‐0.85, 0.38] |
| 9.2 Physiotherapy | 0 | 0 | Std. Mean Difference (IV, Random, 95% CI) | 0.0 [0.0, 0.0] |
| 9.3 Occupational therapy | 1 | 54 | Std. Mean Difference (IV, Random, 95% CI) | 0.12 [‐0.41, 0.66] |
| 10 Carers: Mood | 6 | 647 | Std. Mean Difference (IV, Random, 95% CI) | 0.18 [‐0.11, 0.46] |
| 10.1 Mixed service | 2 | 57 | Std. Mean Difference (IV, Random, 95% CI) | 0.00 [‐1.15, 1.15] |
| 10.2 Physiotherapy | 0 | 0 | Std. Mean Difference (IV, Random, 95% CI) | 0.0 [0.0, 0.0] |
| 10.3 Occupational therapy | 4 | 590 | Std. Mean Difference (IV, Random, 95% CI) | 0.23 [‐0.05, 0.51] |
| 11 Readmission | 4 | 389 | Peto Odds Ratio (Peto, Fixed, 95% CI) | 0.81 [0.52, 1.26] |
| 11.1 Mixed service | 1 | 41 | Peto Odds Ratio (Peto, Fixed, 95% CI) | 1.38 [0.40, 4.77] |
| 11.2 Physiotherapy | 1 | 101 | Peto Odds Ratio (Peto, Fixed, 95% CI) | 0.66 [0.30, 1.48] |
| 11.3 Occupational Therapy | 2 | 247 | Peto Odds Ratio (Peto, Fixed, 95% CI) | 0.80 [0.44, 1.45] |
1.1. Analysis.

Comparison 1 Therapy‐based rehabilitation versus no routine input, Outcome 1 Death by end of scheduled follow up.
1.2. Analysis.
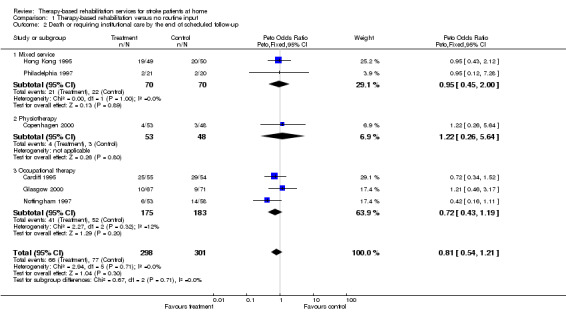
Comparison 1 Therapy‐based rehabilitation versus no routine input, Outcome 2 Death or requiring institutional care by the end of scheduled follow‐up.
1.3. Analysis.

Comparison 1 Therapy‐based rehabilitation versus no routine input, Outcome 3 Death or dependency by end of scheduled follow‐up.
1.4. Analysis.

Comparison 1 Therapy‐based rehabilitation versus no routine input, Outcome 4 Death or poor outcome (deterioration or dependency).
1.5. Analysis.
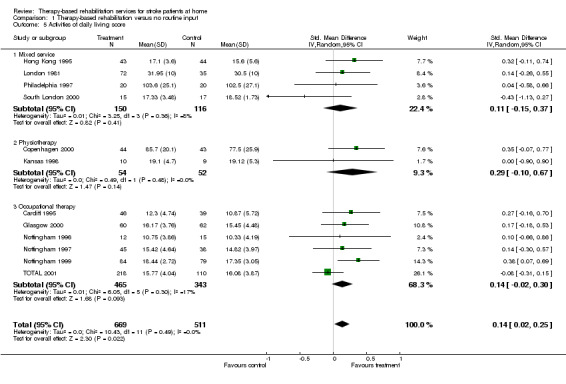
Comparison 1 Therapy‐based rehabilitation versus no routine input, Outcome 5 Activities of daily living score.
1.6. Analysis.
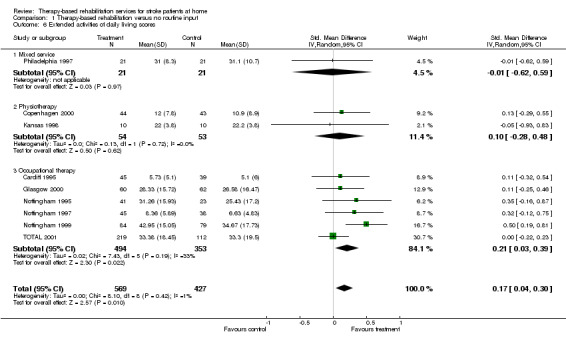
Comparison 1 Therapy‐based rehabilitation versus no routine input, Outcome 6 Extended activities of daily living scores.
1.7. Analysis.
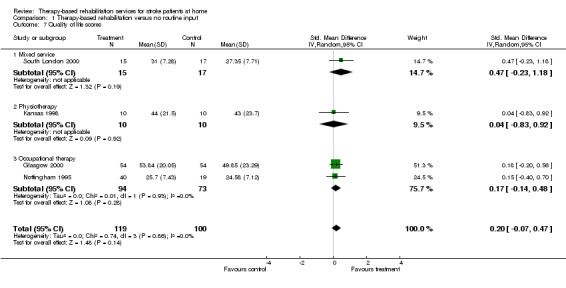
Comparison 1 Therapy‐based rehabilitation versus no routine input, Outcome 7 Quality of life scores.
1.8. Analysis.

Comparison 1 Therapy‐based rehabilitation versus no routine input, Outcome 8 Mood/ distress scores.
1.9. Analysis.
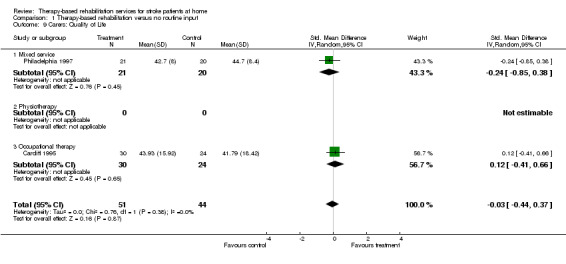
Comparison 1 Therapy‐based rehabilitation versus no routine input, Outcome 9 Carers: Quality of Life.
1.10. Analysis.

Comparison 1 Therapy‐based rehabilitation versus no routine input, Outcome 10 Carers: Mood.
1.11. Analysis.
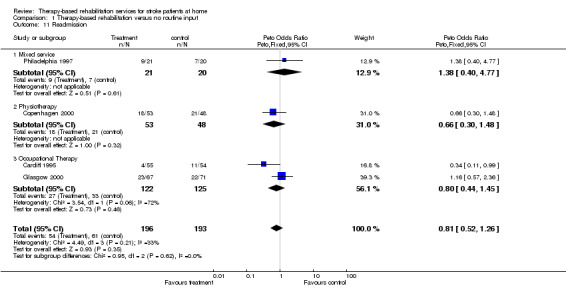
Comparison 1 Therapy‐based rehabilitation versus no routine input, Outcome 11 Readmission.
Characteristics of studies
Characteristics of included studies [ordered by study ID]
Cardiff 1995.
| Methods | Randomised controlled trial. Opaque sealed envelopes. Central randomisation. Blinded outcome assessment (postal questionnaire) | |
| Participants | UK 110 patients 55 intervention 55 control Mean age 75.5 37% male Median Barthel index score at baseline: intervention group 15 (IQR 2 ‐ 20); control group 14 (IQR 0 ‐ 20) Clinical definition of stroke Patients recruited prior to discharge from inpatient facility Inclusion criteria: discharged from one of two stroke units, regardless of discharge destination. | |
| Interventions | Rehabilitation at home by occupational therapist vs usual care. Input at 2, 8, 16 and 24 weeks. Intervention based on the model of human occupation. Interventions included: teaching new skills; facilitating more independence in activities of daily living; facilitating return of function; enabling patients to use equipment supplied by other agencies; information provision to patient and carer; referring to or liaison with other agencies. Service provided by a qualified occupational therapist. | |
| Outcomes | Outcomes were recorded at 12 months: Death Barthel ADL Nottingham EADL Geriatric Depression Scale (short form) Pearlman's six point Quality of Life Scale Carer: Pearlman's six‐point Quality of Life Scale. | |
| Notes | Follow‐up period used in analysis 12 months. | |
| Risk of bias | ||
| Bias | Authors' judgement | Support for judgement |
| Allocation concealment? | Low risk | A ‐ Adequate |
Copenhagen 2000.
| Methods | Randomised controlled trial. Random generation of allocation sequence by two independent secretaries who randomly drew lots. Managed from a central source. Inadequate blinding of outcome assessor on the Barthel Index and Frenchay Activities Index at final outcome assessment. | |
| Participants | Denmark 101 patients 53 intervention 48 control 47% male Mean age 71 Mean Barthel Index score at baseline: intervention group 80.6 (SD 17.4); control group 76.8 (SD 23.7) WHO definition of stroke Recruited at end of inpatient rehabilitation (prior to discharge) Inclusion criteria: discharged to own home with stroke related impairments and functional limitations. | |
| Interventions | Domicilary physiotherapist vs control. Physiotherapist ‐ 6 week programme of instruction and education immediately after discharge. Home visit lasted approximately 1 hr. | |
| Outcomes | Outcomes were recorded at 6 months after discharge: Index of Extended Activities of Daily Living Barthel Index Frenchay Activities Index | |
| Notes | Follow‐up period used in analysis 6 months. Figures for physiotherapist v control only arms only | |
| Risk of bias | ||
| Bias | Authors' judgement | Support for judgement |
| Allocation concealment? | Low risk | A ‐ Adequate |
Glasgow 2000.
| Methods | Randomised controlled trial. Centralised randomisation by telephone. Computer generated randomisation schedule stratified by sex and attendance at day hospital. Allocation method concealed (sequentially numbered, opaque, sealed envelopes). Blinded outcome assessor. | |
| Participants | UK 138 patients 67 intervention 71 control Median age 69 45% male Median Barthel Index score at baseline: intervention group 17 (IQR 15 ‐18); control group 18 (IQR 16 ‐ 19) Clinical definition of stroke Patients recruited when discharged from hospital/ date set. Inclusion criteria: discharged to a private address; willing to cooperate; consent. Exclusion: made a full recovery; discharged to institutional care; terminally ill; lived outside catchment area; severe cognitive or communication difficulties preventing consent, goal setting or completing outcome measures. | |
| Interventions | Domiciliary occupational therapy for a period of six weeks. Frequency approximately 1.7 visits per week lasting between 30‐45 minutes. Client centred occupational therapy programme. Liaison with other agencies. Occupational therapy provided by a qualified occupational therapist. | |
| Outcomes | Outcomes were recorded at 7 weeks/ 6 months: Primary outcomes: Nottingham Extended Activities of Daily Living Barthel Index 'Global' i.e. death or deterioration in BI Secondary outcomes: Barthel Index Canadian Occupational Performance Measure EUROQOL Satisfaction with outpatient services. Resource use (staff time, hospital readmission, provision of equipment and services). Carer : General Health Questionnaire at 6 weeks | |
| Notes | Follow‐up period used in analyses 6 months | |
| Risk of bias | ||
| Bias | Authors' judgement | Support for judgement |
| Allocation concealment? | Low risk | A ‐ Adequate |
Hong Kong 1995.
| Methods | Randomised controlled trial. Random allocation to treatment randomisation schedule stratified by Barthel Index score. Randomisation sequence generated from random number tables. Allocation method concealed (opaque sealed envelopes) held in an office at Shatin Hospital. Unclear if outcome assessor was blinded. |
|
| Participants | Hong Kong 120 patients 59 intervention 61 control 44% male Mean age 73.5 Clinical definition of stroke Percentage of patients scoring less than or equal to 15 on the Barthel Index at baseline, 82% Patients were recruited if unable to discharge home after one week as an inpatient following stroke onset. Inclusion criteria: > 65 years; clinical diagnosis of cerebrovascular accident; no previous history of stroke; no history of dementia; resident within catchment area; Barthel score < 20. | |
| Interventions | Multidisciplinary team with day hospital facilites and multidisciplinary approach vs medical follow‐up as outpatients. | |
| Outcomes | Outcomes were recorded at 3/ 6 months: Primary outcome: Death Barthel Index Well‐being (self‐rated) Geriatric Depression Scale Readmission Carer: Degree of satisfaction with services | |
| Notes | Follow‐up period used in analyses 6 months | |
| Risk of bias | ||
| Bias | Authors' judgement | Support for judgement |
| Allocation concealment? | Low risk | A ‐ Adequate |
Kansas 1998.
| Methods | Randomised controlled trial. Blocks of 10, random list generated by group assignments before study. Randomisation scheme controlled by a laboratory technician who had no involvement in study. Treatment allocation concealed. Blinded outcome assessor. | |
| Participants | USA 20 patients 10 intervention 10 control Mean age 68 years Mean Barthel index score at baseline: intervention group 82.5; control group 82.5. Standard deviation not available. % male not reported WHO definition of stroke Patients recruited when completed acute rehabilitation programme and 30‐90 days after stroke onset. Inclusion criteria: patients between 60 and 90 days poststroke; minimally or moderately impaired sensorimotor funtion (Fugl‐Meyer Motor Score 40‐90), Orpington Prognostic Scale Score 2.0‐5.2); Ambulatory with supervision and/ or assistive device; living at home; living within 50 miles of UKMC. Exclusion criteria: presence of coexisting conditions that would interfere with outcome assessments and/or ability to participate in submaximal exercise programme; score < 18 Mini‐Mental State Examination; receptive aphasia affecting ability to follow three step command. | |
| Interventions | Home‐based exercise programme provided by a physical therapist to improve strength, balance and endurance and to encourage use of affected extremity. Each session lasted for 90 minutes, the intervention was prescriptive. Each patient in the treatment group received 3 visits per week for 8 weeks, patients were instructed to continue the exercise programme for a further 4 weeks. | |
| Outcomes | Outcomes were recorded at 12 weeks after baseline assessment: Fugl‐Meyer Motor Score: Upper and Lower Extremity Barthel ADL Lawton Instrumental ADL Physical Function (MOS‐36) Gait Velocity 6 Minute Walk, ft 10m walk Berg Balance Scale Jebsen Test of Hand Function | |
| Notes | Follow‐up period used in analyses 12 weeks | |
| Risk of bias | ||
| Bias | Authors' judgement | Support for judgement |
| Allocation concealment? | Low risk | A ‐ Adequate |
London 1981.
| Methods | Randomised controlled trial. Method of creating randomisation not described. Mechanism for treatment allocation not described (each allocated at random to one of the three regimens). Blinded assessor. | |
| Participants | UK 133 patients 89 intervention (46 patients in intensive rehab group; 43 patients in conventional treatment group). 44 control Mean age 65 years 66% male Clinical definition of stroke Patients recruited at discharge from inpatient facility, 12 patient recruited from outpatient department. Inclusion criteria: able to manage the most intensive of the three treatment regimens being tested; live within catchment area. | |
| Interventions | Intensive vs conventional vs no routine rehabilitation. (1) Intensive = patients attend rehabilitation department attendance for 4 whole day/7 (2) Conventional = patients attend rehabilitation department for 3 half days per week (3) no routine intervention = patients visited at home on a regular basis by health visitor. Intensive and conventional groups receive physiotherapy and occupational therapy for a maximum of six months. | |
| Outcomes | Outcomes were recorded at 3/12 months: Primary outcome measure: Death Activities of Daily Living (ADL) Index | |
| Notes | Follow‐up period used in analyses 12 months | |
| Risk of bias | ||
| Bias | Authors' judgement | Support for judgement |
| Allocation concealment? | Unclear risk | B ‐ Unclear |
Nottingham 1995.
| Methods | Randomised controlled trial; parallel group design. Randomisation and allocation concealment (sequentially numbered, opaque sealed envelopes) randomisation sequence generated from random number tables. Blinded outcome assessor. | |
| Participants | UK 65 patients 42 intervention (21 patients leisure intervention group; 21 patients in ADL intervention group) 23 control Mean age 66 57% male Definition of stroke ‐ unclear Patients recruited at discharge from inpatient facility. Inclusion criteria: Admitted to City Hospital Nottingham Stroke Unit. Exclusion: severe comprehension difficulties i.e. score< 3 on Speech Therapy Boston Diagnostic Aphasic Examination; a documented history of dementia; no English language. | |
| Interventions | Leisure v conventional v no occupational therapy. First three months patients were seen by an occupational therapist for a minimum of 30 minutes per week, thereafter 30 minutes every 2 weeks up to 6 months. Leisure intervention: Patients hobbies and interests were discussed in detail and the importance of maintaining a leisure programme stressed. Treatment reflected personal preferences and abilities. Help and advice included: treatment (e.g. practice of transfers needed for leisure pursuits; positioning provision of equipment; adaptations; advice on obtaining financial assistance and transport; liaison with specialist organisations; and providing physical assistance. Conventional occupational therapy: occupational therapy activities such as transfers washing and dressing practice and when appropriate, perceptual treatments. | |
| Outcomes | Outcomes were recorded at 3/ 6 months: Nottingham EADL Nottingham Health Profile Nottingham Leisure Questionnaire Wakefield Depression Inventory | |
| Notes | Follow‐up period used in analyses 6 months | |
| Risk of bias | ||
| Bias | Authors' judgement | Support for judgement |
| Allocation concealment? | Low risk | A ‐ Adequate |
Nottingham 1996.
| Methods | Crossover trial. Randomisation and allocation concealment (sequentially numbered, opaque, sealed envelopes) randomisation generated from random number tables. Blinded outcome assessor. | |
| Participants | UK 30 patients 15 intervention 15 control Mean age 68 53% male Definition of stroke ‐ unclear Patients recruited at discharge from inpatient facility. Exclusion criteria: blind; deaf; unable to understand or speak English prior to stroke onset. | |
| Interventions | Domiciliary occupational therapy over a three month period provided by a senior occupational therapist. Amount of therapy provided at therapist's discretion. Components of intervention: dressing practice on a regular basis; teaching patients and carers specific dressing techniques, energy conservation techniques, advice on clothing adaptation. Relative/carer involvement in therapy programme and between therapy sessions homework. Single therapist. | |
| Outcomes | Outcomes were recorded at 3/ 6 months: Nottingham Stroke Dressing Assessment Rivermead ADL Nottingham Health Profile | |
| Notes | Outcome data recorded at 3 months used in analyses i.e. before crossover period. Randomisation and allocation procedure checked with M. Walker | |
| Risk of bias | ||
| Bias | Authors' judgement | Support for judgement |
| Allocation concealment? | Low risk | A ‐ Adequate |
Nottingham 1997.
| Methods | Randomised controlled trial, random allocation, concealed allocation assignment (prepared sealed envelopes). Blinded outcome assessor. | |
| Participants | UK 111 patients 53 intervention 58 control Mean age 55 43% male Clinical definition of stroke. Inclusion criteria: first stroke and discharged from hospital and referred to the Social Services occupational therapy department. | |
| Interventions | Enhanced occupational therapy service provided by social services, includes provision of equipment. Single therapist | |
| Outcomes | Outcomes were recorded at 3 and 6 months: Nottingham EADL Barthel Index General Health Questionnaire | |
| Notes | Follow‐up period used in analysis 6 months Carers assessed at 6 months; General Health Questionnaire | |
| Risk of bias | ||
| Bias | Authors' judgement | Support for judgement |
| Allocation concealment? | Low risk | A ‐ Adequate |
Nottingham 1999.
| Methods | Randomised controlled trial. Randomisation and allocation concealment (sequentially numbered, opaque, sealed envelopes). Randomisation sequence generated from random number tables. Blinded outcome assessor. | |
| Participants | UK 185 patients 94 intervention 91 control Mean age 74 51% male Median Barthel index score at baseline: Intervention group 18 (IQR 15‐20); control group 18 (IQR 15‐20). Clinical definition of stroke Patients were recruited < one month after stroke onset from home. Exclusion criteria: > one month after stroke onset; history of dementia; living in a nursing or residential home; unable to speak or understand English prior to stroke onset. | |
| Interventions | Occupational therapy intervention for a period of five months. Frequency of visits arranged between therapist, patient and carer (if appropriate). Mean of 5.8 visits per patient. Aim of therapy was to achieve independence in personal (bathing, dressing, feeding, stair mobility) and instrumental activities of daily living (outdoor mobility, driving a car, using public transport, household chores). Homework tasks were set in between therapy sessions. | |
| Outcomes | Outcomes were recorded at 6 months: Primary outcomes: Nottingham Extended Activities of Daily Living Index Barthel Index Secondary outcome measures: London Handicap Scale General Health Questionnaire 28 item Rivermead motor assessment (gross function) Carers: Carer strain Index General Health Questionnaire 28 | |
| Notes | Follow‐up period used in analysis 6 months Randomisation and allocation procedure confirmed with M. Walker Carers: Carer strain Index General Health Questionnaire 28 | |
| Risk of bias | ||
| Bias | Authors' judgement | Support for judgement |
| Allocation concealment? | Low risk | A ‐ Adequate |
Philadelphia 1997.
| Methods | Randomised controlled trial. Random allocation to treatment group, random number tables used to create randomisation, allocation procedure not described. | |
| Participants | USA 55 patients 27 intervention 28 control Median age 72 51% male Clinical definition of stroke Patients recruited at transfer to inpatient rehabilitation facility for inpatient rehab. Inclusion criteria: Patients > 65 years, 2 weeks to 3 months post stroke onset; discharge to a private address; an identifiable primary caregiver. Exclusion: presence of severe pre‐morbid or co‐morbid conditions which affect ability to recover from the qualifying stroke; cognitive or communication difficulties preventing ability to participate in follow‐up interviews. | |
| Interventions | The STAIR programme (Stroke Transition after Inpatient Rehabilitation): ‐ home‐based case‐managed care; ‐ identifying and managing psychosocial stressors affecting patients and carers; ‐ information and support as and when required; ‐ early detection and management of problems; ‐ advocacy and mobilizing of community resources. Team included a physiatrist, psychologist, recreational therapist and a case manager/ social worker. | |
| Outcomes | Outcomes were recorded at 6 and 12 months: Functional Independence Measure Frenchay Activities Index The Active Lifestyle: Efficacy Expectancies Scale The Centre for Epidemiologic Studies ‐ Depression Scale The Older American Resources and Services Scales ‐ Physical Health The Older American Resources and Services Scales ‐ Activities of Daily Living Carers: The Questionnaire on Resources and Stress The Center for Epidemiologic Studies ‐ Depression Scale The Older American Resources and Services Scales ‐ Social Resources The Social Functioning Examination The Older American Resources and Services Scales ‐ Economic Resources | |
| Notes | Follow‐up period used in analyses 12 months. | |
| Risk of bias | ||
| Bias | Authors' judgement | Support for judgement |
| Allocation concealment? | Unclear risk | B ‐ Unclear |
South London 2000.
| Methods | Randomised controlled trial. Randomisation in permuted blocks of 10 using random number tables, Allocation concealment method (blank opaque sealed envelopes. Blinded outcome assessor at 12 months. | |
| Participants | UK 43 patients 23 intervention 20 control Mean age 74 42% male Median Barthel Index score at baseline: intervention group 17 (IQR 7 ‐ 20); usual care 17 (IQR 8‐20) Clinical definition of stroke Patients recruited to study if stroke onset between January 1993 and July 1995 and living at home. | |
| Interventions | Home rehabilitation programme. The treatment team comprised of one senior physiotherapist with neurological training, one senior occupational therapist and one half‐time speech and language therapist with neurological training. The team were coordinated by a consultant. A weekly clinical meeting was held and chaired by the consultant. Each patient was assessed for home rehabilitation needs, aims were set and a therapy programme devised. The therapy programme involved a maximum of one daily visit from each therapist over a maximum period of three months. | |
| Outcomes | Outcomes were recorded at 2, 4, 6 and 12 months: Primary Outcome: Barthel Index Secondary outcomes: Rankin Motricity Index Mini‐Mental State Examination Albert Test Frenchay Aphasia Screening Test Rivermead Activities of Daily Living Score Hospital Anxiety and Depression Scale 5‐metre timed walk Nottingham Health Profile Carers: Caregiver Strain Index | |
| Notes | Although patients were recruited to this study over a period of 2.5 years from stroke onset, Kate Tilling (Trialist) was able to confirm that a large proportion of patients recruited to the trial were in fact recruited within 1 year of stroke onset and therefore met the review inclusion criteria. Follow‐up period used in analyses 12 months | |
| Risk of bias | ||
| Bias | Authors' judgement | Support for judgement |
| Allocation concealment? | Low risk | A ‐ Adequate |
TOTAL 2001.
| Methods | Randomised controlled trial. Centralised randomisation by telephone. Randomisation stratified by participating centre and a five‐level composite measure of prognosis. Treatment allocation concealed (masking to individual allocation maintained until all outcome measures recorded). 6 and 12 month outcome measures obtained by postal questionnaire. Blinded outcome assessment. | |
| Participants | UK 466 patients 309 intervention (153 patients in Leisure group; 156 patients in ADL group). 157 control Median age 3 groups 72/ 71/ 72 Median Barthel index score at baseline: leisure 18 (IQR 15 ‐ 19); ADL group 18 (IQR 16 ‐ 20); control group 18 (IQR 16 ‐ 19) 58% male WHO definition of stroke Patients recruited from one of four participating sites at discharge and, all patients attending a stroke outcome clinic (site 5, Glasgow) with stroke onset< 6 months. Exclusion: discharge to a nursing or residential home; recorded history of dementia; inability to complete outcome questionnaires because of limited use of English language; unable to endure interventions because of co‐existing health conditions; lived outside the catchment area. | |
| Interventions | Occupational Therapy Leisure 'leisure intervention' v 'ADL' v no occupational therapy for a period of up to six months after recruitment to the study. A minimum of 10 treatment sessions lasting not less than 30 minutes were provided to each patient. Leisure Group: Goals were set in terms of leisure activities as well as ADL tasks to acheive leisure objectives. ADL Group: Goals set to improve independence in selfcare activities and included practise in activities such as meal preparation and walking outdoors. Control Group: No occupational therapy. | |
| Outcomes | Outcomes were recorded at 6 (primary) and 12 months: Primary outcome measure: General Health Questionnaire 12 item. Nottingham Leisure questionnaire Nottingham Extended ADL Secondary outcomes: The International Stroke Trial outcome questions the Rankin Scale The Oxford Handicap Scale The Barthel ADL Index (Sheikh 1979) The London Handicap Scale Carers: General Health Questionnaire 12 | |
| Notes | Follow‐up period used in analyses 12 months | |
| Risk of bias | ||
| Bias | Authors' judgement | Support for judgement |
| Allocation concealment? | Low risk | A ‐ Adequate |
Vancouver 1991.
| Methods | Randomised controlled trial. Random allocation treatment. Method of creating randomisation unclear. Allocation concealment method not described (project coordinator randomly assigned subjects to either treatment or control group). Blinded outcome assessor. | |
| Participants | Canada 40 patients 20 intervention 20 control Mean age 69 years 67% male Clinical definition of stroke Inclusion criteria: stroke onset within previous 15 months; had completed a rehabilitation programme; not on antidepressant medication; the ability to follow a one‐step command; able to express themselves through gesture/ verbal expression/ or communication aid i.e. not severely aphasic; carer/ friend willing to participate. | |
| Interventions | Occupational therapy intervention aimed at helping patients to resume former leisure activities or learn new activities. Patients decided what areas that they wished the occupational therapist to assist with. The occupational therapist assessed the patient's physical and social environment (home, primary social contacts, transport and funds for leisure activites). The Occupational therapy intervention consisted of five one‐hour sessions in the patient's home over a five‐week period. Service provided by a qualified occupational therapist. | |
| Outcomes | Outcomes were recorded at 5 and 18 weeks after the initial visit or treatment: Primary Outcome: Katz Adjustment Index: Level of Free‐Time Actvities and Level of Satisfaction with Free‐Time Activities. Barthel Index Zung Depression Scale Mini‐Mental State. | |
| Notes | Patients recruited to study < 15 months after stroke onset. While this does not strictly meet the inclusion criteria the reviewers decided that the 3‐month excess recruitment period was not significant enough to exclude the study. Follow‐up period used in analyses 18 weeks | |
| Risk of bias | ||
| Bias | Authors' judgement | Support for judgement |
| Allocation concealment? | Unclear risk | B ‐ Unclear |
Characteristics of excluded studies [ordered by study ID]
| Study | Reason for exclusion |
|---|---|
| Frayne 2000 | Nursing intervention |
| Haig 1995 | Stroke patients account for 7.5% of study population |
| Ljungberg 2001 | Early supported discharge trial |
| Mayo 2000 | Early supported discharge trial |
| Mulders 1989 | Patients were more than one year post‐stroke at the time of randomisation |
| Turton 1990 | Focus is on improving recovery of the upper limb |
| Wade 1992 | Patients were assessed to have mobility problems one year after stroke |
| Wall 1987 | Focus is on the management of gait asymmetry |
| Werner 1996 | Patients are more than one year post‐stroke at the time of randomisation |
| Ytterberg 2000 | Not a therapy‐based intervention |
Characteristics of ongoing studies [ordered by study ID]
Logan 2002.
| Trial name or title | Investigation of transport used by stroke patients and the evaluation of an occupational therapy intervention |
| Methods | |
| Participants | Stroke patients within one year of stroke onset living at home. Target recruitment 200 patients. |
| Interventions | Transport training programme (approximately 6 seesions) vs one visit by an occupational therapist and information on transport. |
| Outcomes | Barthel Index Nottingham Extended Activities of daily living General Health Questionnaire 12 Mobility Questionnaire. Outcomes to be recorded at 4 and 10 months |
| Starting date | 2002 |
| Contact information | Pip Logan |
| Notes |
Sackley 2002.
| Trial name or title | A randomised controlled trial to evaluate the intervention of an occupational therapist in a nursing and residential home setting. |
| Methods | |
| Participants | Residents in nursing or residential home settings scoring less than or equal to 15 on the Barthel index. Information on percentage of stroke patients and length of time since stroke onset not available until the end of trial. 65 patients. |
| Interventions | Individual occupational therapy sessions over a treament period of three months |
| Outcomes | Barthel Index Rivermead ADL Rivermead mobility Hospital anxiety and depression scale (HADS) Stroke aphasia depression questionnaire Outcomes to be recorded at three and six months. |
| Starting date | 2001 |
| Contact information | Cath Sackley |
| Notes |
Stalhandske 2002.
| Trial name or title | After stroke: A home rehabilitation project 'lara leva efter stroke' |
| Methods | |
| Participants | 80 patients discharged from a stroke unit , University Hospital , Uppsala, Sweden and living at home. |
| Interventions | Occupational therapist, physiotherapist and speech and language therapist vs usual care |
| Outcomes | Frenchay Activities Index, Life satisfaction, dysphoria, utilization of health care resources, need for home‐help services or support from family care‐givers. |
| Starting date | 1997 |
| Contact information | M Stalhanske c/o Prof A Terent004618 6110000 |
| Notes |
Contributions of authors
Lynn Legg and Peter Langhorne planned the review, wrote the first draft of the review and revised subsequent drafts. The other contributors provided data, advice, comment and helped revise the review.
Sources of support
Internal sources
University of Glasgow, UK.
External sources
Chest, Heart and Stroke Scotland, UK.
Declarations of interest
None known
Edited (no change to conclusions)
References
References to studies included in this review
Cardiff 1995 {published and unpublished data}
- Corr S, Bayer A. Occupational therapy for stroke patients after hospital discharge ‐ a randomized controlled trial. Clinical Rehabilitation 1995;9:291‐296. [Google Scholar]
Copenhagen 2000 {published and unpublished data}
- Andersen HE, Scultz‐Larsen K, Kreiner S, Forchhammer BH, Eriksen K, Brown A. Can readmission after stroke be prevented? Results of a randomized clinical study: A post discharge follow‐up service for stroke survivors. Stroke 2000;31:1038‐1045. [DOI] [PubMed] [Google Scholar]
Glasgow 2000 {published and unpublished data}
- Gilbertson L, Langhorne P, Walker A, Allen A, Murray GD. Domiciliary occupational therapy for patients with stroke discharged from hospital: randomised controlled trial. BMJ 2000;320:603‐606. [DOI] [PMC free article] [PubMed] [Google Scholar]
Hong Kong 1995 {published and unpublished data}
- Hui E, Lum CM, Woo J, Or KH, Kay RLC. Outcomes of elderly stroke patients. Day hospital versus conventional medical management. Stroke 1995;26:1616‐1619. [DOI] [PubMed] [Google Scholar]
Kansas 1998 {published and unpublished data}
- Duncan P, Richards L, Wallace D, Stoker‐Yates J, Pohl P, Luchies C, Ogle A, Studenski S. A randomized, controlled pilot study of a home‐based exercise program for individauls with mild and moderate stroke. Stroke 1998;29:2055‐2060. [DOI] [PubMed] [Google Scholar]
London 1981 {published data only}
- Smith DS, Goldenberg E, Ashburn A, Kinsella G, Sheikh K, Brennan PJ, Meade TW, Zutshi JD, Perry JD, Reeback JS. Remedial therapy after stroke: a randomised controlled trial. BMJ 1981;282:517‐520. [DOI] [PMC free article] [PubMed] [Google Scholar]
Nottingham 1995 {published and unpublished data}
- Drummond AER, Walker MF. A randomized controlled trial of leisure rehabilitation after stroke. Clinical Rehabilitation 1995;9:283‐290. [Google Scholar]
- Drummond AER, Walker MF. Generalisation of the effects of leisure rehabilitation for stroke patients. British Journal of Occupational Therapy July 1996;59(7):330‐334. [Google Scholar]
Nottingham 1996 {published and unpublished data}
- Walker MF, Drummond AER. Evaluation of dressing practice for stroke patients after discharge from hospital: a crossover design study. Clinical Rehabilitation 1996;10:23‐31. [Google Scholar]
Nottingham 1997 {published and unpublished data}
- Logan P, Ahern J, Gladman JRF, Lincoln NB. A randomized controlled trial of enhanced Social Service occupational therapy for stroke patients. Clinical Rehabilitation 1997;11:107‐113. [DOI] [PubMed] [Google Scholar]
Nottingham 1999 {published and unpublished data}
- Walker MF, Gladman JRF, Lincoln NB, Siemonsma P, Whiteley T. Occupational therapy for stroke patients not admitted to hospital: a randomised controlled trial. Lancet 1999;354:278‐280. [DOI] [PubMed] [Google Scholar]
Philadelphia 1997 {published and unpublished data}
- Goldberg G, Segal ME, Berk SN, Schall RR, Gershkoff A. Stroke transition after inpatient rehabilitation. Top Stroke Rehabil 1997;4(1):64‐79. [DOI] [PubMed] [Google Scholar]
South London 2000 {published and unpublished data}
- Wolfe CDA, Tilling K, Rudd AG. The effectiveness of community‐based rehabilitation for stroke patients who remain at home: a pilot randomized trial. Clinical Rehabilitation 2000;14:563‐569. [DOI] [PubMed] [Google Scholar]
TOTAL 2001 {published and unpublished data}
- Parker CJ, Gladman JRF, Drummond AER, Dewey ME, Lincoln NB, Barer D, Logan PA, Radford KA. A multicentre randomized controlled trial of leisure therapy and conventional occupational therapy after stroke. Clinical Rehabilitation 2001;15:42‐52. [DOI] [PubMed] [Google Scholar]
Vancouver 1991 {published and unpublished data}
- Jongbloed L, Morgan D. An investigation of involvement in leisure activities after stroke. American Journal of Occupational Therapy May 1991;45(5):420‐427. [DOI] [PubMed] [Google Scholar]
References to studies excluded from this review
Frayne 2000 {published data only}
- Frayne J, Brodtmann A, Voselis H, Haartsen J, Fiddes K. Study of home intervention post‐stroke. Stroke 2000;31(11):2812‐2813. [Google Scholar]
Haig 1995 {published data only}
- Haig AJ, Nagy A, Lebreck DB, Stein GL. Outpatient planning for persons with physical disabilites: a randomized prospective trial of physiatrist alone versus a multidisciplinary team. Arch Phys Med Rehabil 1995;76:341‐8. [DOI] [PubMed] [Google Scholar]
Ljungberg 2001 {published data only}
- Ljungberg C, Hanson E, Lovgren M. A home rehabilitation program for stroke patients: A pilot study. Scandinavian Journal of Caring Sciences 2001;15(1):44‐53. [Google Scholar]
Mayo 2000 {published data only}
- Mayo NE, Wood‐Dauphinee S, Cote R, Gayton D, Carlton J, Buttery J, Tamblyn R. There's no place like home. Stroke 2000;31:1016‐1023. [DOI] [PubMed] [Google Scholar]
Mulders 1989 {published data only}
- Mulders AHM, Witte LP, Diederiks JPM. Evaluation of a rehabilitation after‐care programme for stroke patients. Journal of Rehabilitation Sciences 1989;2(4):97‐103. [Google Scholar]
Turton 1990 {published data only}
- Turton A, Fraser C. The use of home therapy programmes for improving recovery of the upper limb following stroke. BJOT 1990;53(11):457‐462. [Google Scholar]
Wade 1992 {published and unpublished data}
- Wade DT, Collen FM, Robb GF, Warlow CP. Physiotherapy intervention late after stroke and mobility. BMJ 1992;304:609‐613. [DOI] [PMC free article] [PubMed] [Google Scholar]
Wall 1987 {published data only}
- Wall JC, Turnbull GI. Evaluation of out‐patient physiotherapy and a home exercise program in the management of gait asymmetry in residual stroke. J Neuro Rehab 1987;1:115‐123. [Google Scholar]
Werner 1996 {published data only}
- Werner RA, Kessler S. Effectiveness of an intensive outpatient rehabilitation program for postacute stroke patients. American Journal of Physical Medicine and Rehabilitation 1996;75:114‐120. [DOI] [PubMed] [Google Scholar]
Ytterberg 2000 {published data only}
- Ytterberg C, Malm SA, Britton M. How do stroke patients fare when discharged straight to their homes? A controlled study on the significance of hospital follow‐up after one month. Scandanavian Journal of Rehabilitation Medicine 2000;32(2):93‐96. [DOI] [PubMed] [Google Scholar]
References to ongoing studies
Logan 2002 {unpublished data only}
- Logan P. Investigation of transport used by stroke patients and evaluation of an Occupational Therapy intervention. Personal correspondence 2002.
Sackley 2002 {unpublished data only}
- Sackley C. A randomised controlled trial to evaluate the intervention of an occupational therapist in a nursing and residential home setting. Personal correspondence 2002.
Stalhandske 2002 {published and unpublished data}
- Stalhandske M, Terent A. A home rehabilitation project. Personal communication 2002.
- Stalhandske M, Tuvemo‐Johnson S, Terent A, Fugl‐Meyer A. After stroke: a home rehabilitation project 'lara leva efter stroke'. Up J Med Sci 1997;Suppl 53. [Google Scholar]
Additional references
Aho 1980
- Aho K, Harmsen P, Hatano S, Marquardsen J, Smirnov VE, Strasser T. Cerebrovascular disease in the community: results of a WHO collaborative study. Bull World Health Organ 1980;58:113‐30. [PMC free article] [PubMed] [Google Scholar]
Albert 1973
- Albert ML. A simple test of neglect. Neurology 1973;23:658‐64. [DOI] [PubMed] [Google Scholar]
Anderson 2001
- Andersen H. Index of extended activities of daily living. Dr H Andersen, Center for Elder Research, University Hospital H;S Bispebjerg, Bispebjerg Bakke 23, DK‐2400 Copenhagen, Denmark 24th June 2001.
Armitage 1987
- Armitage P, Benny G. Statistical methods in medical reserach. 2nd Edition. Blackwell, 1987. [Google Scholar]
Berg 1995
- Berg K, Wood‐Dauphinee S, Williams JI. The balance scale: reliability assessment with elderly residents and patients with acute stroke. Scand J Rehabil Med 1995;27:37‐36. [PubMed] [Google Scholar]
Collen 1990
- Collen FM, Wade DT, Bradshaw CM. Mobility after stroke: reliability of measures of impairment and disability. Int Disabil Stud 1990;12:6‐9. [DOI] [PubMed] [Google Scholar]
Demeurisse 1980
- Demeurisse G, Demol O, Robaye E. Motor evaluation in vascular hemiplegia. Eur Neurol 1980;19:382‐89. [DOI] [PubMed] [Google Scholar]
Drummond 1994
- Drummond AER, Walker M. The Nottingham Leisure Questionnaire for stroke patients. British Journal of Occupational Therapy 1994;57:414‐418. [Google Scholar]
Ebrahim 1985
- Ebrahim S, Nouri FM, Barer D. Measuring disability after stroke. J Epidemio Commun Health 1985;39:86‐89. [DOI] [PMC free article] [PubMed] [Google Scholar]
Enderby 1987
- Enderby P, Wood V, Wade D. Frenchay Aphasia Screening Test. Windsor, Berks: NFER‐Nelson, 1987. [DOI] [PubMed] [Google Scholar]
ESDT 2002
- Early Supported Discharge Trialists. Services for reducing duration of hospital care for acute stroke patients. Cochrane Database of Systematic Reviews 2002, Issue 1. [Art. No.: CD000443. DOI: 10.1002/14651858.CD000443] [DOI] [PubMed] [Google Scholar]
Euroquol 1990
- The Euroquol Group. Euroquol ‐ a new facility for the measurement of health related quality of life. Health Policy 1990;16:199‐208. [DOI] [PubMed] [Google Scholar]
Fillenbaum 1981
- Fillenbaum GG, Smyer M. Older Americans' Resources and Services [OARS] Multidimensional Functional Assessment [MFAQ] selected items. In: Salek S editor(s). Compendium of Quality of Life Instruments. (5 vols.). Vol. 5, 3C:5, Chichester, West Sussex: Wiley, 1981:Pg.1‐2 (datasheet), V.5, 3C:5a, Pg.1‐14 (instrument). [Google Scholar]
Fugl‐Meyer 1975
- Fugle‐Meyer AR, Jaasko L, Leyman I, Olsson S, Steglind S. The post‐stroke hemiplegic patient: method for evaluation of physical performance. Scand J Rehabil Med 1975;7:13‐31. [PubMed] [Google Scholar]
Goldberg 1992
- Goldberg D, Williams P. A User's Guide to the General Health Questionnaire. Windsor: NFER ‐ NELSON, 1992. [Google Scholar]
Greener 2002a
- Greener J, Enderby P, Whurr R. Pharmacological treatment for aphasia following stroke. Cochrane Database of Systematic Reviews 2002, Issue 2. [Art. No.: CD000424. DOI: 10.1002/14651858.CD000424] [DOI] [PMC free article] [PubMed] [Google Scholar]
Greener 2002b
- Greener J, Enderby P, Whurr R. Speech and language therapy for aphasia following stroke. Cochrane Database of Systematic Reviews 2002, Issue 2. [Art. No.: CD000425. DOI: 10.1002/14651858.CD000425] [DOI] [PubMed] [Google Scholar]
Guyatt 1985
- Guyatt GH, Sullivan MJ, Thompson PJ. The 6‐Minute Walk: a new measure of exercise capacity in patients with chronic heart failure. Can Med Assoc J 1985;132:919‐923. [PMC free article] [PubMed] [Google Scholar]
Harwood 1994
- Harwood R, Gompertz P, Ebrahim S. Handicap one year after stroke: validity of a new scale. Journal of Neurology 1994;57:825‐829. [DOI] [PMC free article] [PubMed] [Google Scholar]
Holroyd 200
- Holroyd J. Questionnaire on Resources and Stress. http://www.cps.nova.edu/˜cpphelp/QRS.html 19th September 2002.
Holroyd 2002
- Holroyd J. Questionnaire on Resources and Stress. http://www.cps.nova.edu/˜cpphelp/QRS.html 8th May 2002.
Hunt 1981
- Hunt SM, McKenna SP, Williams J. Reliability of a population survey tool for measuring perceived health problems: a study of patients with osteo‐arthritis. J Epidemio Commun Health 1981;35:297‐300. [DOI] [PMC free article] [PubMed] [Google Scholar]
Isard 1992
- Isard PA, Forbes JF. The cost of stroke to the National Health Service in Scotland. Cerebrovasc Dis 1992;2:47‐50. [Google Scholar]
IST 1997
- Sandercock P, Collins R, Counsell C, Farrell B, Peto R, Slattery J, et al. The International Stroke Trial (IST): a randomised trial of aspirin, subcutaneous heparin, both or neither, among 19,435 patients with acute ischaemic stroke. Lancet 1997;349:1569‐1581. [PubMed] [Google Scholar]
Jebsen 1969
- Jebsen RH, Taylor N, Trieschmann RB, Trotter MJ, Howard LA. An objective and standardized test of hand function. Arch Phys Med Rehabil 1969;45:311‐319. [PubMed] [Google Scholar]
Langhorne 1995
- Langhorne P. Developing new stroke services: An evidence‐based approach. Postgraduate Medical Journal 1995;71:733‐37. [DOI] [PMC free article] [PubMed] [Google Scholar]
Law 1994
- Law M, Baptiste S, Carswell A, et al. Cananadian Occupational Performance Measure. 2. CAOT Publications ACE, 1994. [Google Scholar]
Lawton 1988
- Lawton MP. Instrumental Activities of Daily Living (IADL) Scale: self rate version. Psychopharmacol Bull 1988;24:789‐791. [PubMed] [Google Scholar]
Lincoln 1976
- Lincoln NB, Leadbitter D. Assessment of motor function in stroke patients. Physiotherapy 1976;65:48‐51. [PubMed] [Google Scholar]
Mahoney 1965
- Mahoney FI, Barthel DW. Functional evaluation: the Barthel Index. Maryland State Medical Journal 1965;14:661‐65. [PubMed] [Google Scholar]
Mant 2002
- Mant J, Langhorne P, Dennis M, Winner S. Stroke Liaison Workers for stroke patients and carers. Cochrane Database of Systematic Reviews 2002, Issue 1. [Art. No.: CD005066. DOI: 10.1002/14651858.CD005066] [DOI] [PMC free article] [PubMed] [Google Scholar]
Mulrow 1997
- Mulrow CD, Oxman D (eds). The Cochrane Collaboration Handbook [updated September 1997]. In: The Cochrane Library [database on disk and CDROM]. The Cochrane Collaboration. Oxford: Update Software, 1997, Issue 4. [Google Scholar]
Nouri 1987
- Nouri FM, Lincoln NB. An extended activities of daily living scale for stroke patients. Clinical Rehabilitation 1987;1:301‐305. [Google Scholar]
OST 1999
- Outpatient service trialists. Describing complex interventions : an example from stroke rehabilitation. Proceedings of the 7th Cochrane Colloquium, Rome. 1999.
Pearlman 1991
- Pearlman RA, Ulhmann RF. Quality of life in elderly, chronically ill outpatients. J Gerontol 1991;46:31‐38. [DOI] [PubMed] [Google Scholar]
Radloff 1977
- Radloff LS. The CES‐D scale: A self report depression scale for research in the general population. Applied Psychological Measurement 1977;1:385‐401. [Google Scholar]
Rankin 1957
- Rankin J. Cerebrebal vascular accidents in patients over the age of 60. Scottish Medical Journal 1957;2:200‐215. [DOI] [PubMed] [Google Scholar]
Sellars 2002
- Sellars C, Hughes T, Langhorne P. Speech and langauge therapy due to non‐progressive brain damage. Cochrane Database of Systematic Reviews 2002, Issue 2. [Art. No.: CD002088. DOI: 10.1002/14651858.CD002088] [DOI] [PubMed] [Google Scholar]
Sheikh 1979
- Sheikh K, Smith DS, Meade TW, Goldenberg E, Brennan PJ, Kinsella G. Repeatability and validity of a modified Activities of Daily Living (ADL) index in studies of chronic disability. International Rehabilitation Medicine 1979;1:51‐58. [DOI] [PubMed] [Google Scholar]
Sheikh 1986
- Sheikh JI, Yesavage JA. Geriatric Depression Scale (GDS). Recent evidence and development of a shorter version. In: Brink TL editor(s). Clinical gerontology ‐ a guide to assessment and intervention. New York: Haworth Press, 1986:165‐73. [Google Scholar]
STAIR 1995
- Codebook for Stroke Transition after inpatient rehabilitation (STAIR). Moss Rehabilitation Research Institute, Philadelphia, Pennyslyvania 27th April 1995.
SUTC 2002
- Stroke Unit Trialists' Collaboration. Organised inpatient (stroke unit) care for stroke. Cochrane Database of Systematic Reviews 2002, Issue 1. [Art. No.: CD000197. DOI: 10.1002/14651858.CD000197] [DOI] [PubMed] [Google Scholar]
Wade 1985
- Wade DT, Leigh‐Smith J, Hewer RL. Social activities after stroke: measurement and natural history using the Frenchay Activities Index. Rehabil Med 1985;7:176‐181. [DOI] [PubMed] [Google Scholar]
Wade 1992
- Wade D. Measurement in neurological rehabilitation. Oxford: Oxford University Press, 1992. [Google Scholar]
Ware 1992
- Ware JE, Sherbourne CD. MOS‐36 item short form health survey (SF‐36): conceptual framework and item selection. Med Care 1992;30:473‐483. [PubMed] [Google Scholar]